


Features
- 20 Unique Slides
- Fully editable and easy to edit in Microsoft Powerpoint, Keynote and Google Slides
- 16:9 widescreen layout
- Clean and professional designs
- Export to JPG, PDF or send by email


Do you have any questions?
Recommend


4 slides
Business Development Roadmap Presentation
Visualize your growth journey with this Business Development Roadmap Presentation. Featuring a winding road design with four milestones, it’s perfect for showcasing project phases, strategic goals, or quarterly plans. Each checkpoint is color-coded and icon-based for easy comprehension. Fully editable in PowerPoint, Keynote, and Google Slides.


5 slides
Business Organizational Structure Presentation
Showcase your Business Organizational Structure with this modern and professional infographic template. Designed to visually represent company hierarchy, this slide enhances clarity in roles, team relationships, and reporting structures. Fully customizable in PowerPoint, Keynote, and Google Slides, making it perfect for corporate strategy presentations, HR reports, and leadership meetings.
8 slides
Business Growth and Progress Tracking Presentation
Visualize success with this upward-arrow roadmap template designed to highlight four key stages of business development. Ideal for managers, analysts, and entrepreneurs, this slide uses milestone icons and clean, directional layout to emphasize progress. Fully editable in PowerPoint, Keynote, and Google Slides for seamless customization.


5 slides
Leadership Decision-Making Process Presentation
Guide your audience through leadership challenges with this step-by-step visual. Featuring four clearly defined stages, this layout is perfect for illustrating strategy development, executive planning, or coaching frameworks. The rising path graphic and human figure emphasize progress and achievement. Fully editable and compatible with PowerPoint, Keynote, and Google Slides.


6 slides
Core Mission Vision Goals Presentation
Spark clarity and momentum with a clean, modern slide designed to showcase your organization’s purpose and future direction. This presentation highlights your core mission and vision in a visually engaging layout that keeps teams aligned and focused. Fully compatible with PowerPoint, Keynote, and Google Slides.


21 slides
Kelpie Project Timeline Presentation
This sleek project plan template is perfect for outlining deliverables, timeline, budget breakdown, and risk management. Its modern design ensures clarity and professionalism, making it ideal for team or business presentations. Compatible with PowerPoint, Keynote, and Google Slides, it offers flexibility and ease for showcasing your project's key elements.


21 slides
Kinetic Startup Funding Proposal Presentation
Get ready to impress potential investors with the Kinetic Startup Funding Proposal template! This dynamic and modern template is designed to help you present your startup's vision, mission, and growth potential in the most compelling way possible. From introducing your team and services to highlighting your unique value proposition and business model, every slide is crafted to showcase your startup's strengths. The template includes sections for market analysis, customer needs, and pain points, ensuring your presentation is data-driven and focused on solving real problems. With slides dedicated to your marketing strategy, sales channels, and financial overview, you can provide a comprehensive plan for success. The sleek design, combined with easy-to-edit slides, allows you to customize the presentation to reflect your startup's brand identity. Whether you're pitching to angel investors or venture capitalists, the Kinetic Startup Funding Proposal template will help you stand out and secure the funding you need. Compatible with PowerPoint, Keynote, and Google Slides, this template is your key to delivering a winning pitch.


4 slides
Blockchain and Cryptocurrency Market Analysis Presentation
Present complex blockchain structures and crypto market layers with clarity using the Blockchain and Cryptocurrency Market Analysis presentation template. Featuring a stacked cylinder diagram with four interactive data points, this layout is ideal for breaking down transaction flows, network layers, or decentralized finance (DeFi) ecosystems. Each title block offers space for concise key insights. Best suited for blockchain consultants, fintech startups, and crypto analysts. Fully compatible with PowerPoint, Keynote, and Google Slides.


7 slides
SEO Strategy and Keyword Plan Presentation
Spark your marketing roadmap with a bold, idea-driven layout that makes every action step clear and memorable. This presentation helps you outline search goals, explore keyword opportunities, and map out strategic priorities in a simple, visual flow. Fully compatible with PowerPoint, Keynote, and Google Slides.


23 slides
Mystic Small Business Pitch Deck Presentation
Elevate your small business presentations with this sleek, professional pitch deck template! It’s designed to highlight your company's background, market opportunities, and key objectives in a visually appealing format. Perfect for showcasing your products, services, value proposition, and financial performance, this template makes your pitch stand out. Customize it for PowerPoint, Keynote, or Google Slides to suit your needs.


6 slides
Cash Management Strategy Presentation
Break down your financial priorities with a bold, visual approach. This cash management slide uses a segmented dollar symbol to represent key areas like budgeting, reserves, expenses, and more—making it easy to track strategy points at a glance. Ideal for finance teams, planning sessions, or investor decks. Compatible with PowerPoint, Keynote, and Google Slides.


5 slides
AIDA Funnel for Marketing Strategy Presentation
This presentation template breaks down the AIDA model—Attention, Interest, Desire, Action—into a clean, engaging layout. Perfect for marketing strategies, campaign planning, or customer journey mapping. Easily customizable in Canva, it combines modern icons, bold typography, and horizontal flow to clearly visualize your marketing funnel in a compelling, structured format.


5 slides
Topic Organization with Bubble Mapping Presentation
Easily structure complex information with the Topic Organization with Bubble Mapping Presentation. This visually engaging layout uses a central idea with grouped supporting elements, making it perfect for brainstorming, mind mapping, or topic clustering. Fully editable in PowerPoint, Keynote, or Google Slides—ideal for educators, strategists, and project teams.


5 slides
Cryptocurrency Investment Overview Presentation
Capture the excitement of digital investing with this clean, modern layout designed to visualize market performance, asset insights, and portfolio trends. Perfect for financial analysts, startups, and educators, it simplifies complex data into engaging visuals. Fully compatible with PowerPoint, Keynote, and Google Slides for seamless editing and presentation delivery.


6 slides
Creative Hexagon Process Flow Presentation
Bring order and creativity together with a sleek, geometric layout that turns complex processes into clear visual stories. This presentation helps you map workflows, stages, or milestones with a modern, connected hexagon flow. Fully editable and compatible with PowerPoint, Keynote, and Google Slides for effortless customization and presentation.

20 slides
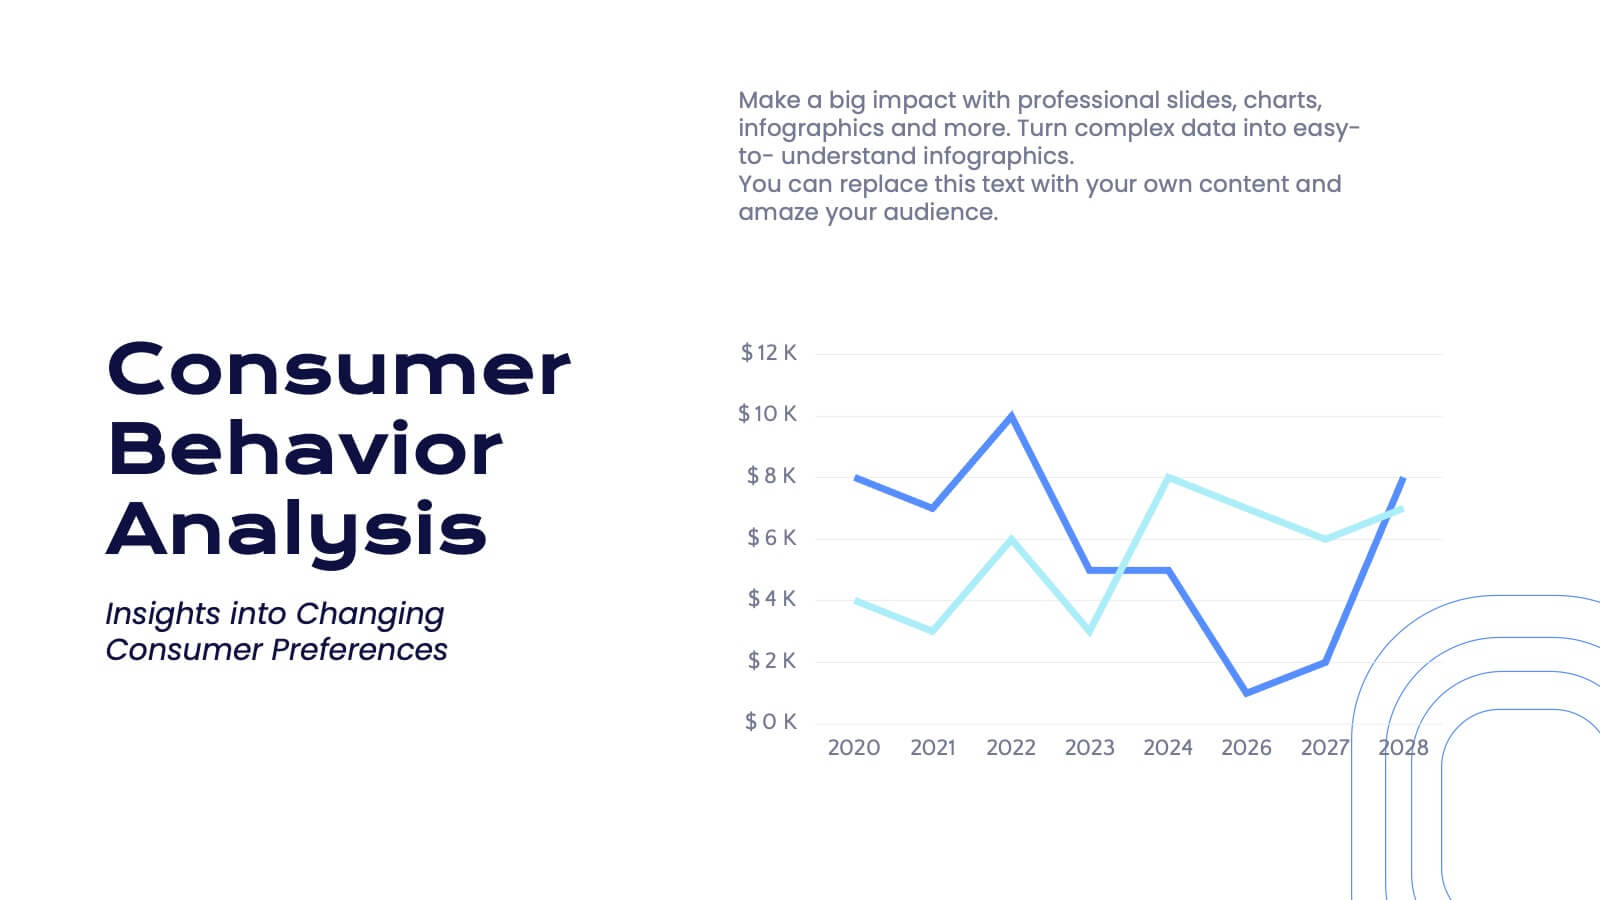
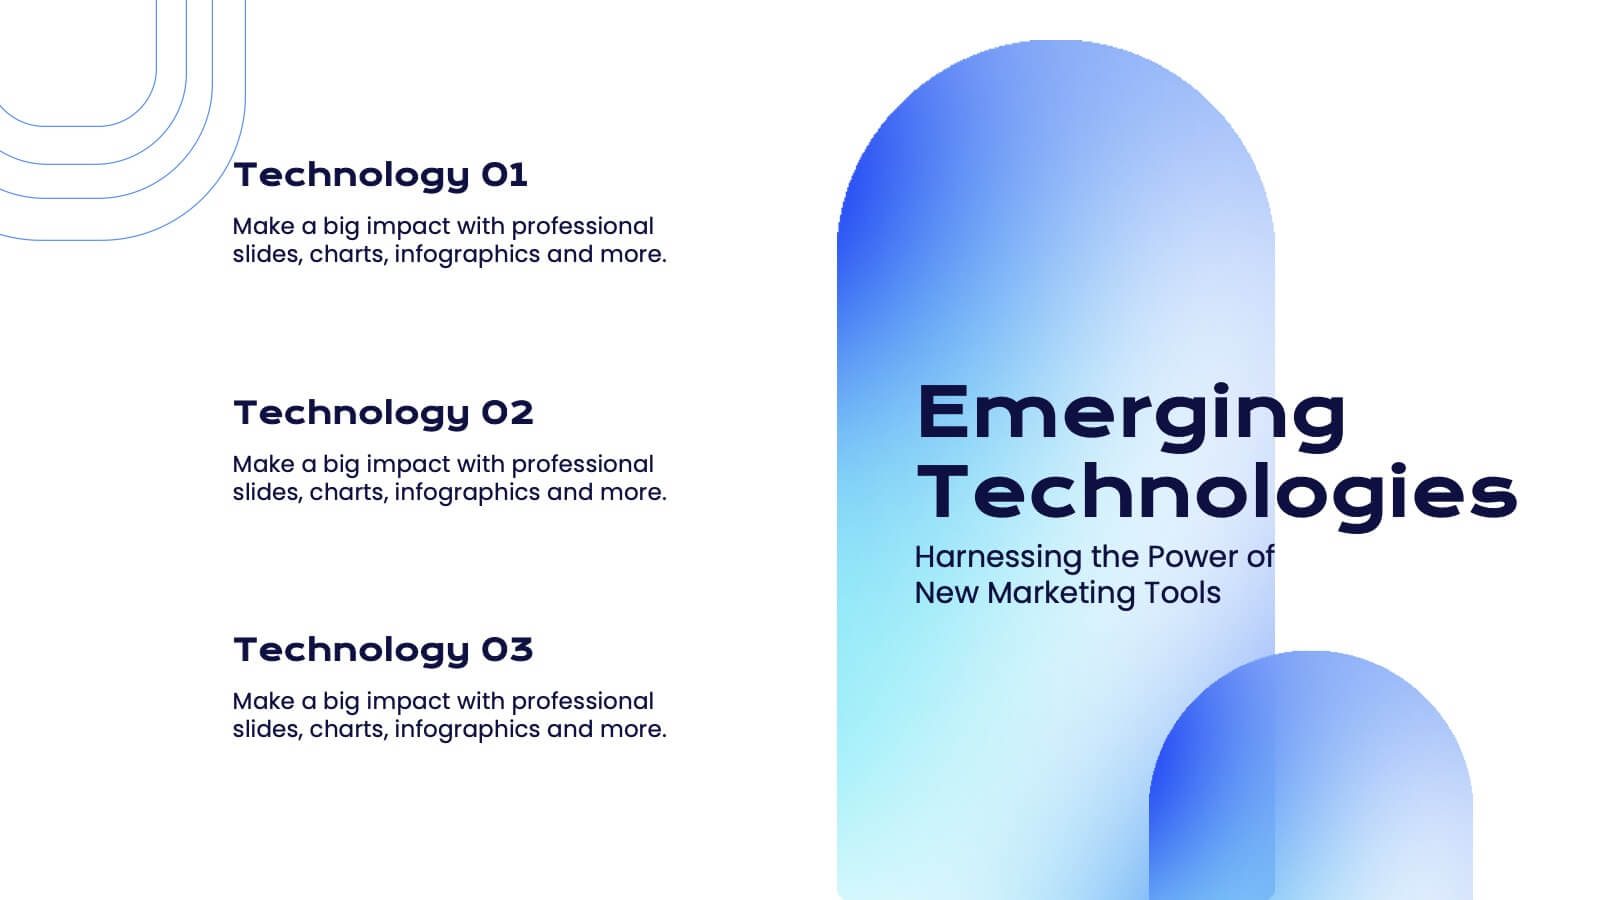
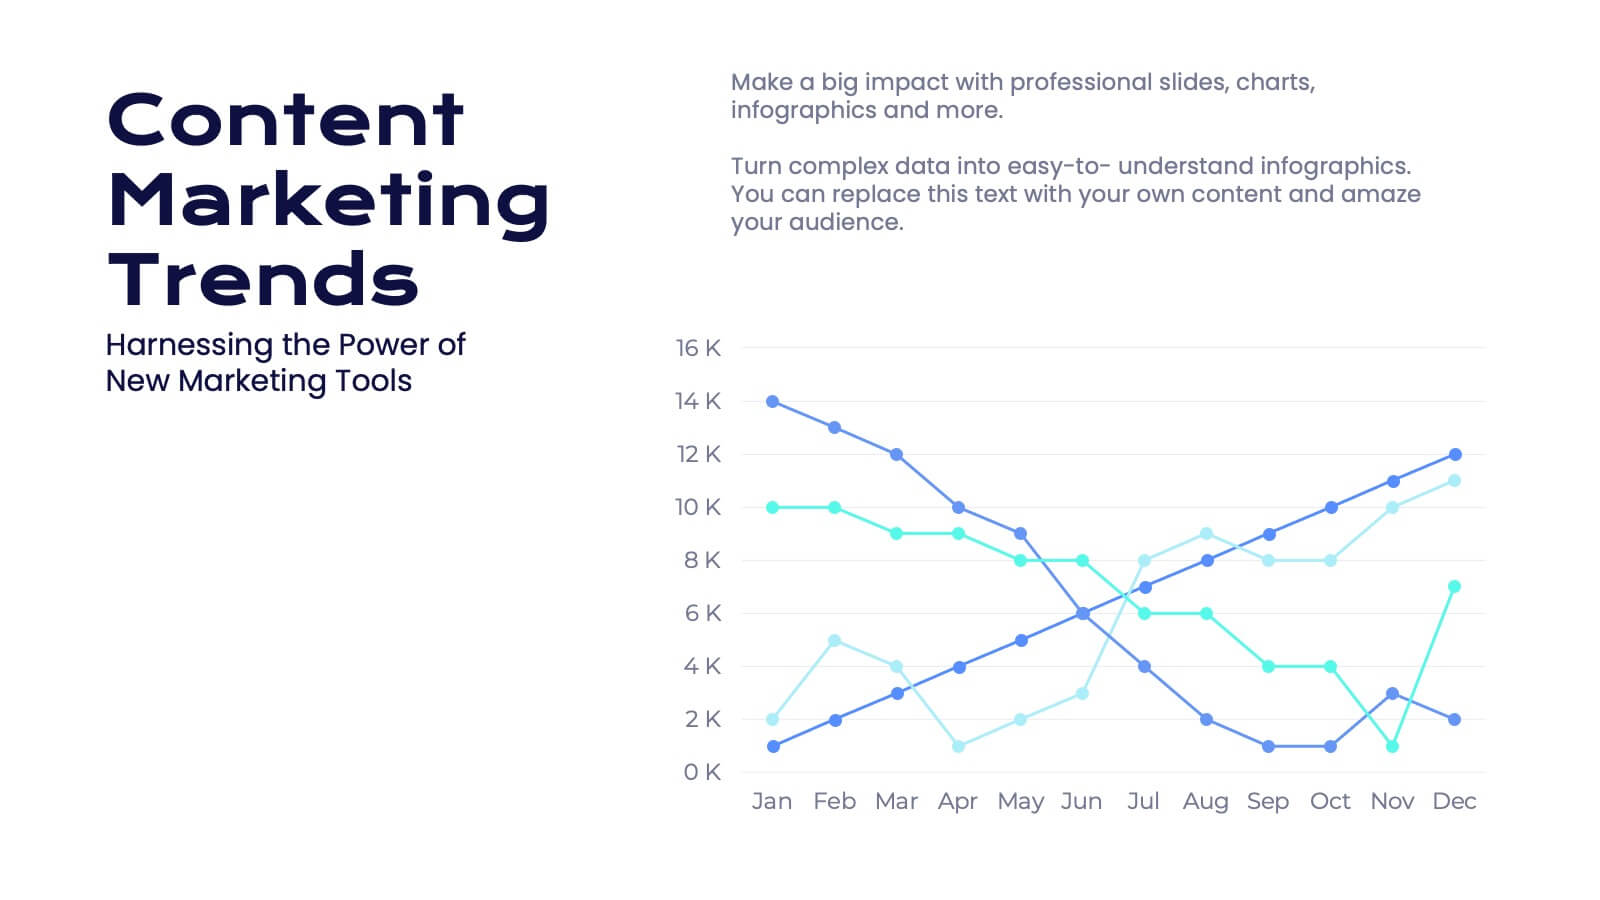
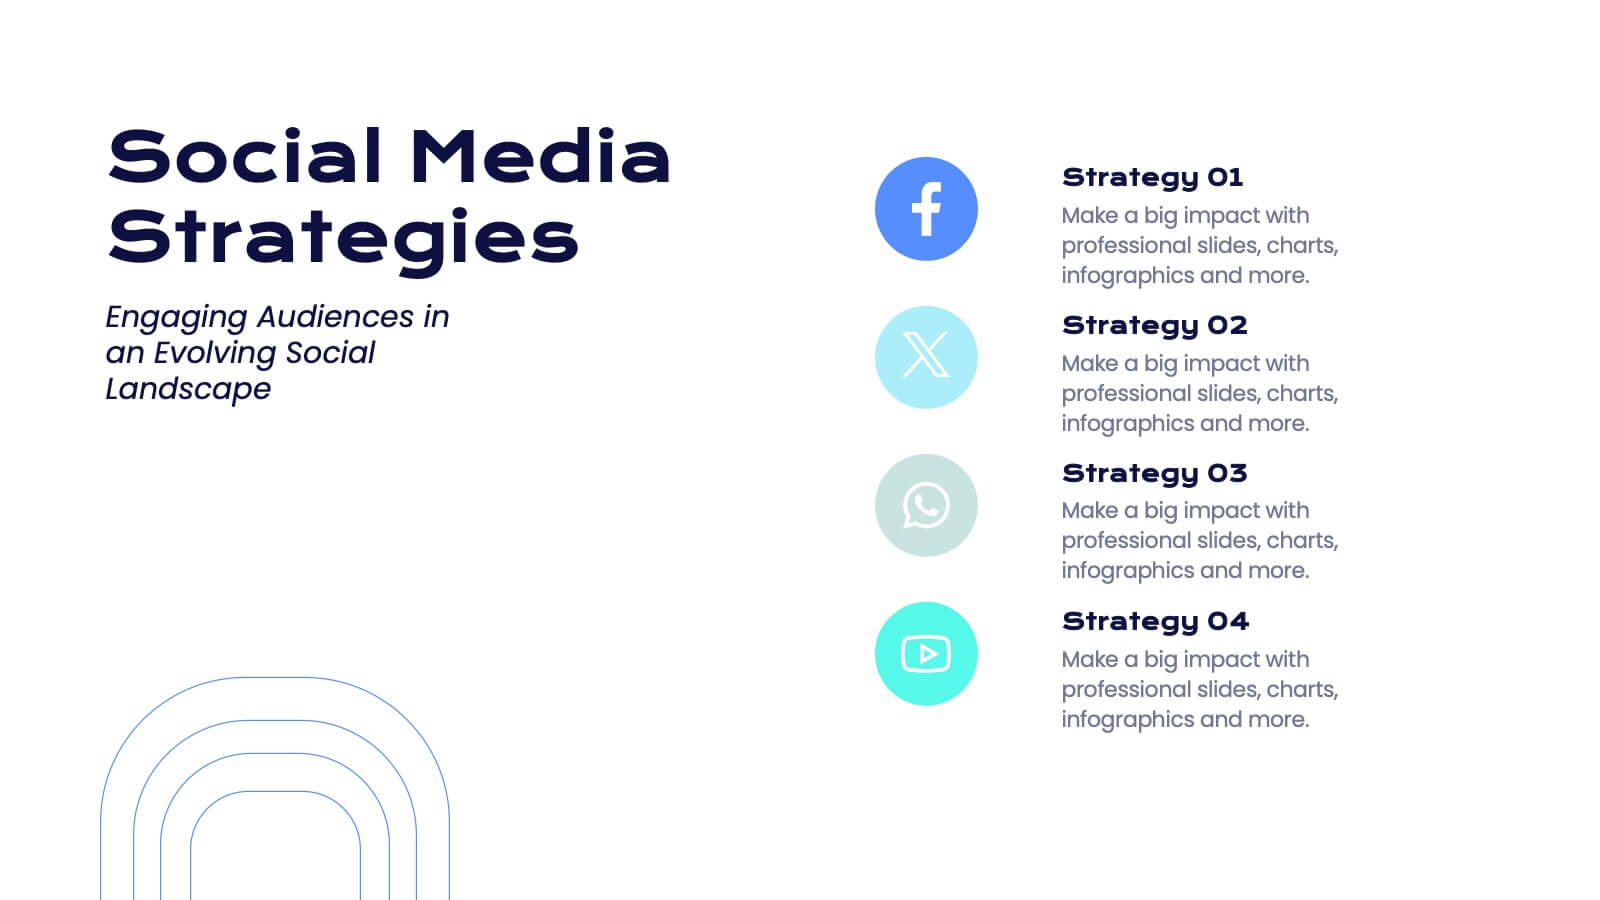
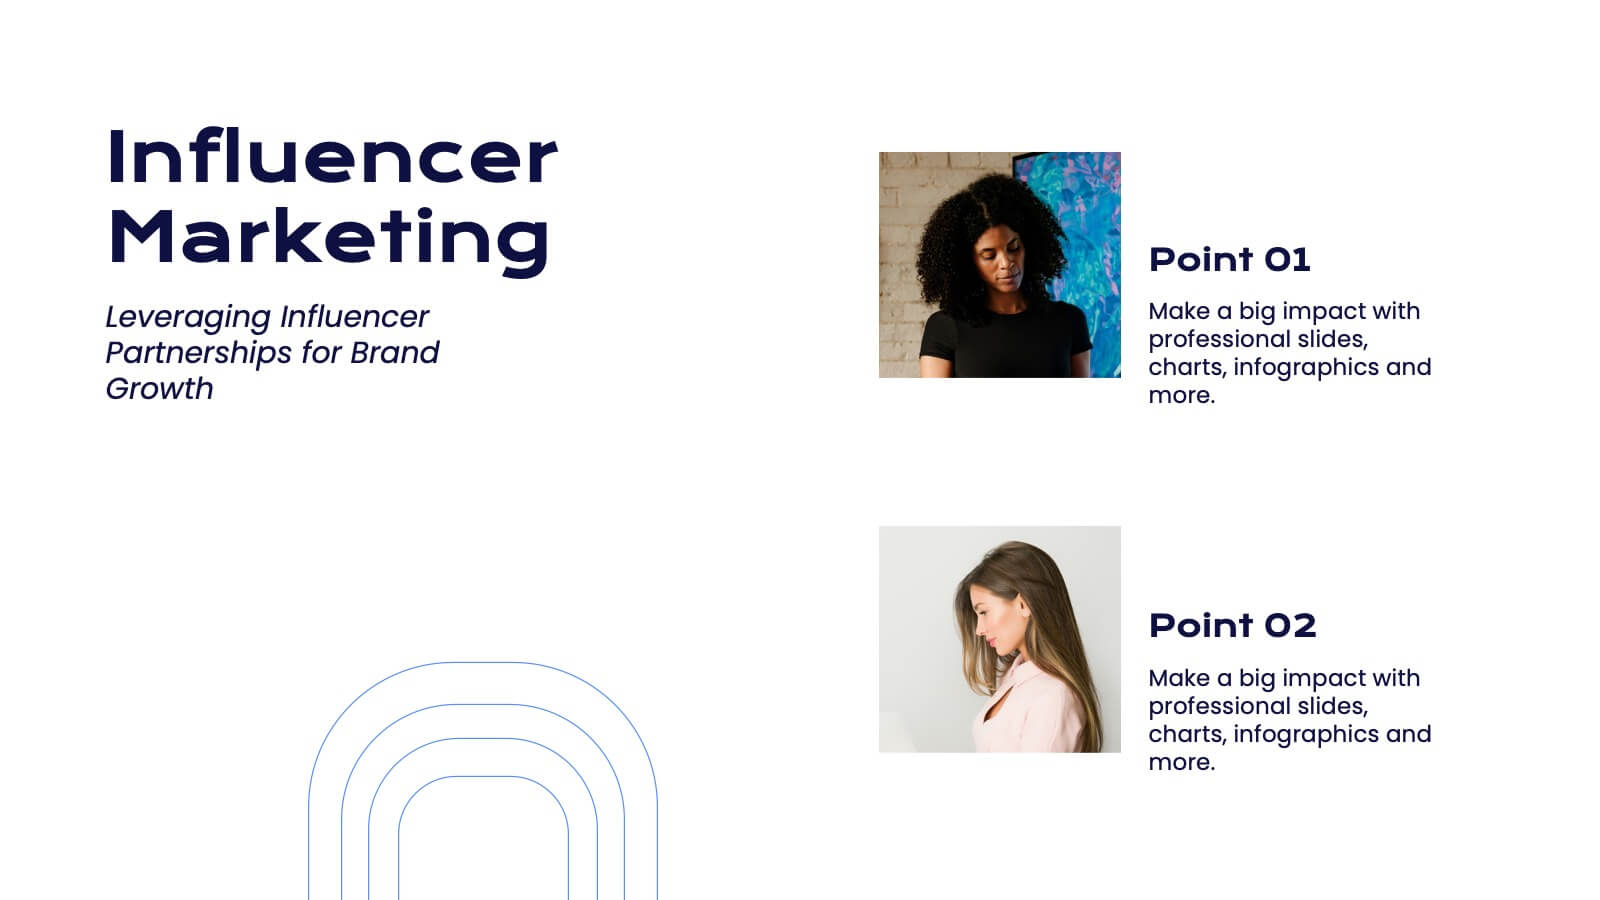
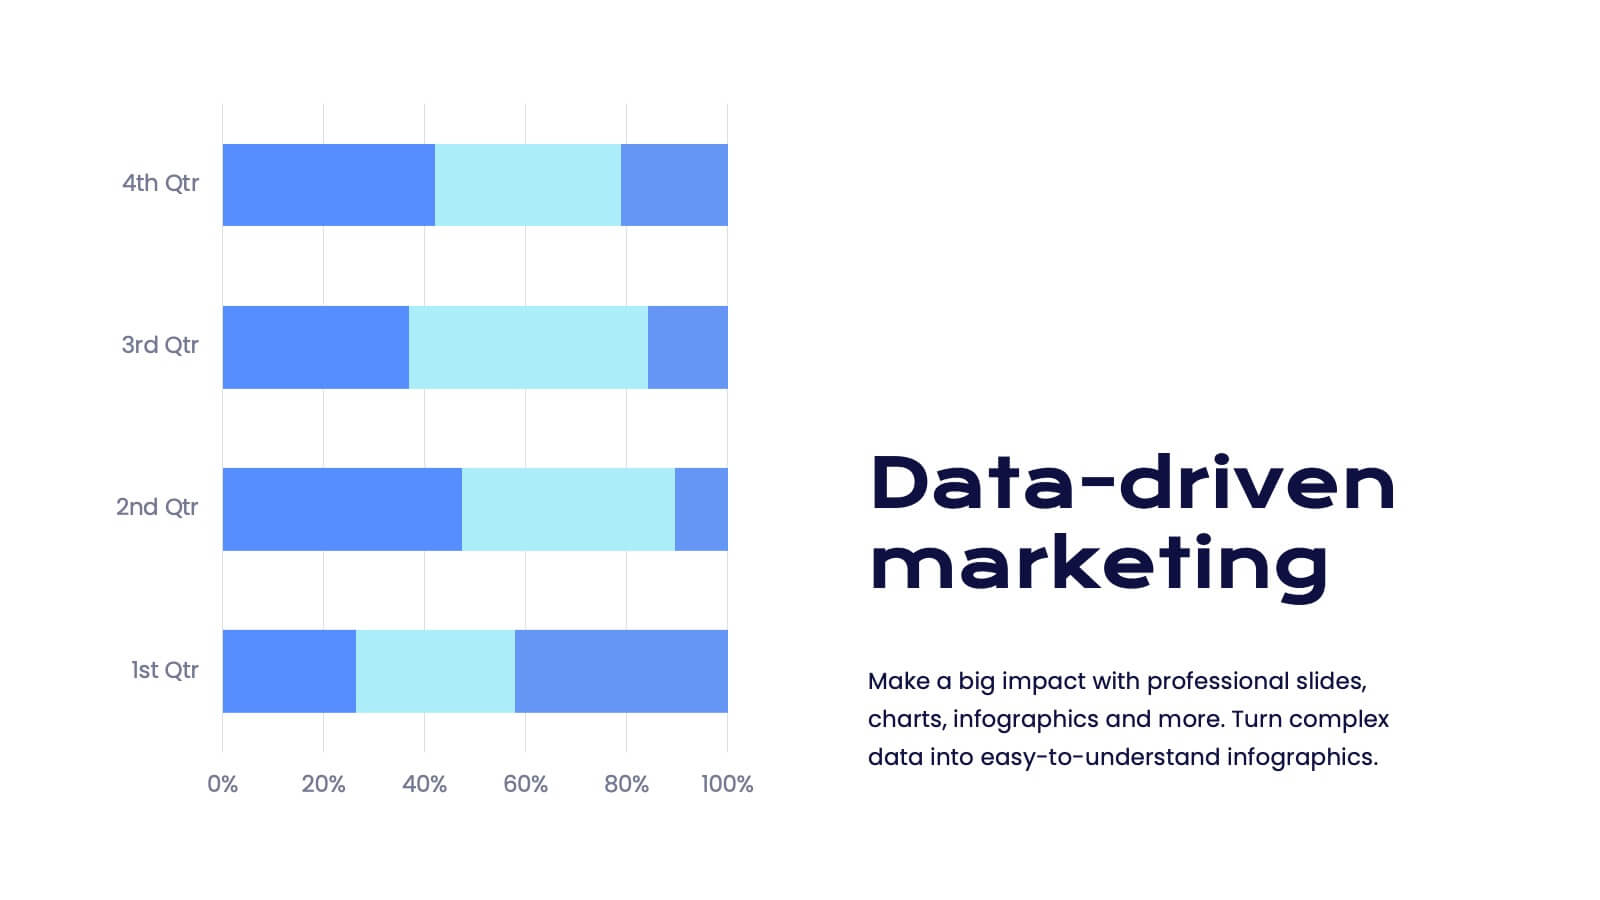
Faerie Digital Marketing Strategy Plan Presentation
Create a compelling marketing strategy with this sleek, modern template! It covers key topics like consumer behavior, social media strategies, and emerging trends. Perfect for showcasing insights in a clear, data-driven format. Fully customizable, it works seamlessly with PowerPoint, Keynote, and Google Slides for effective presentations.


21 slides
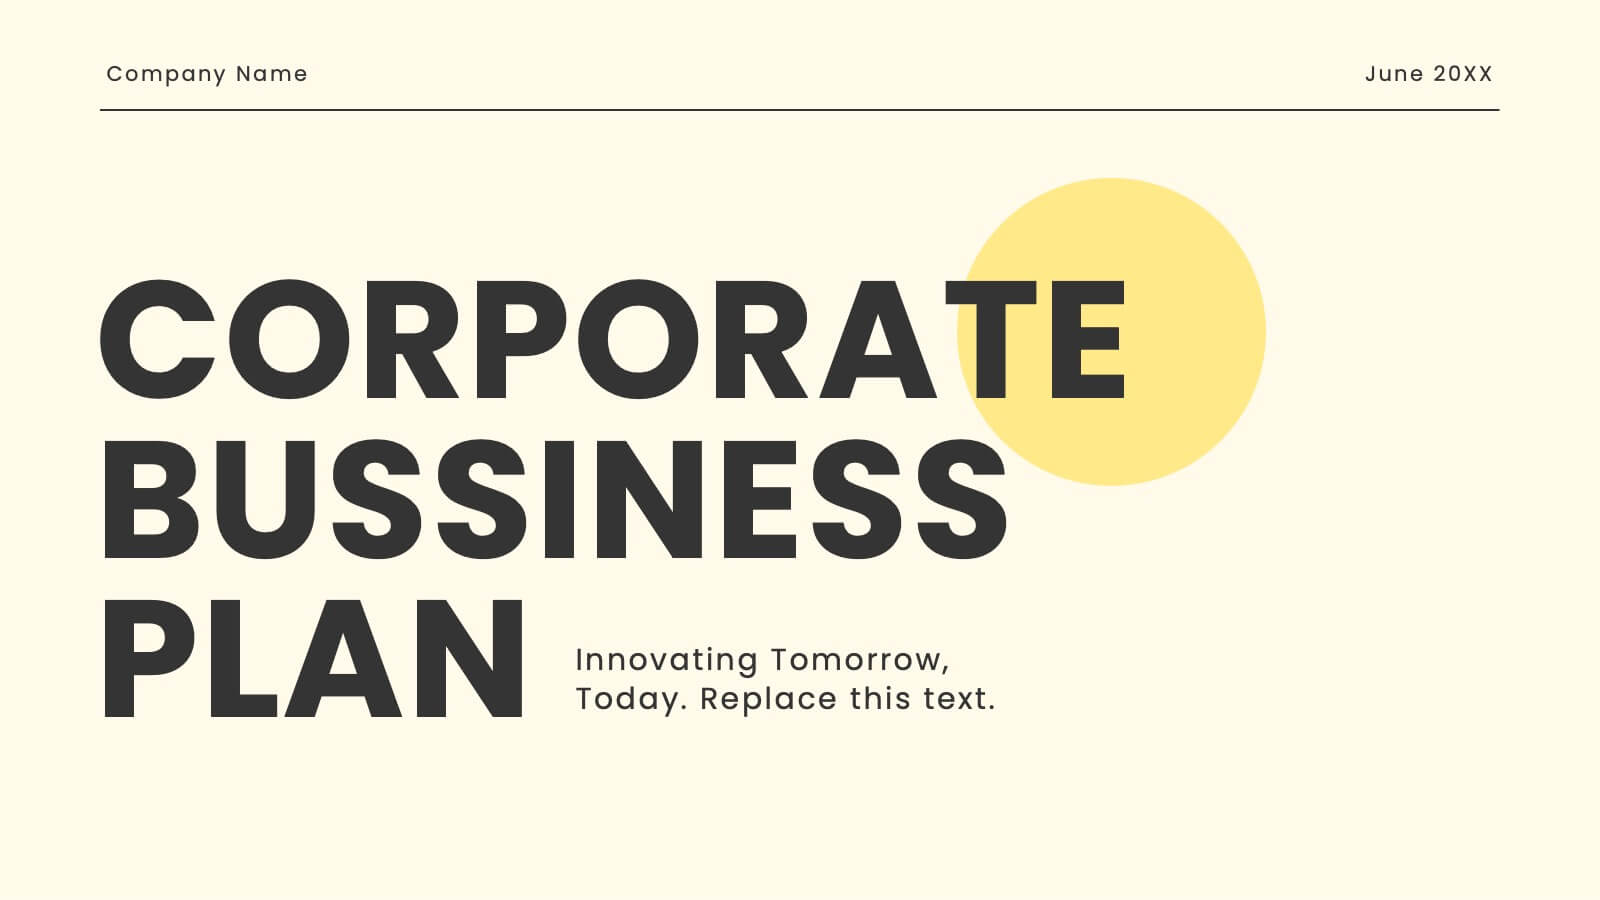
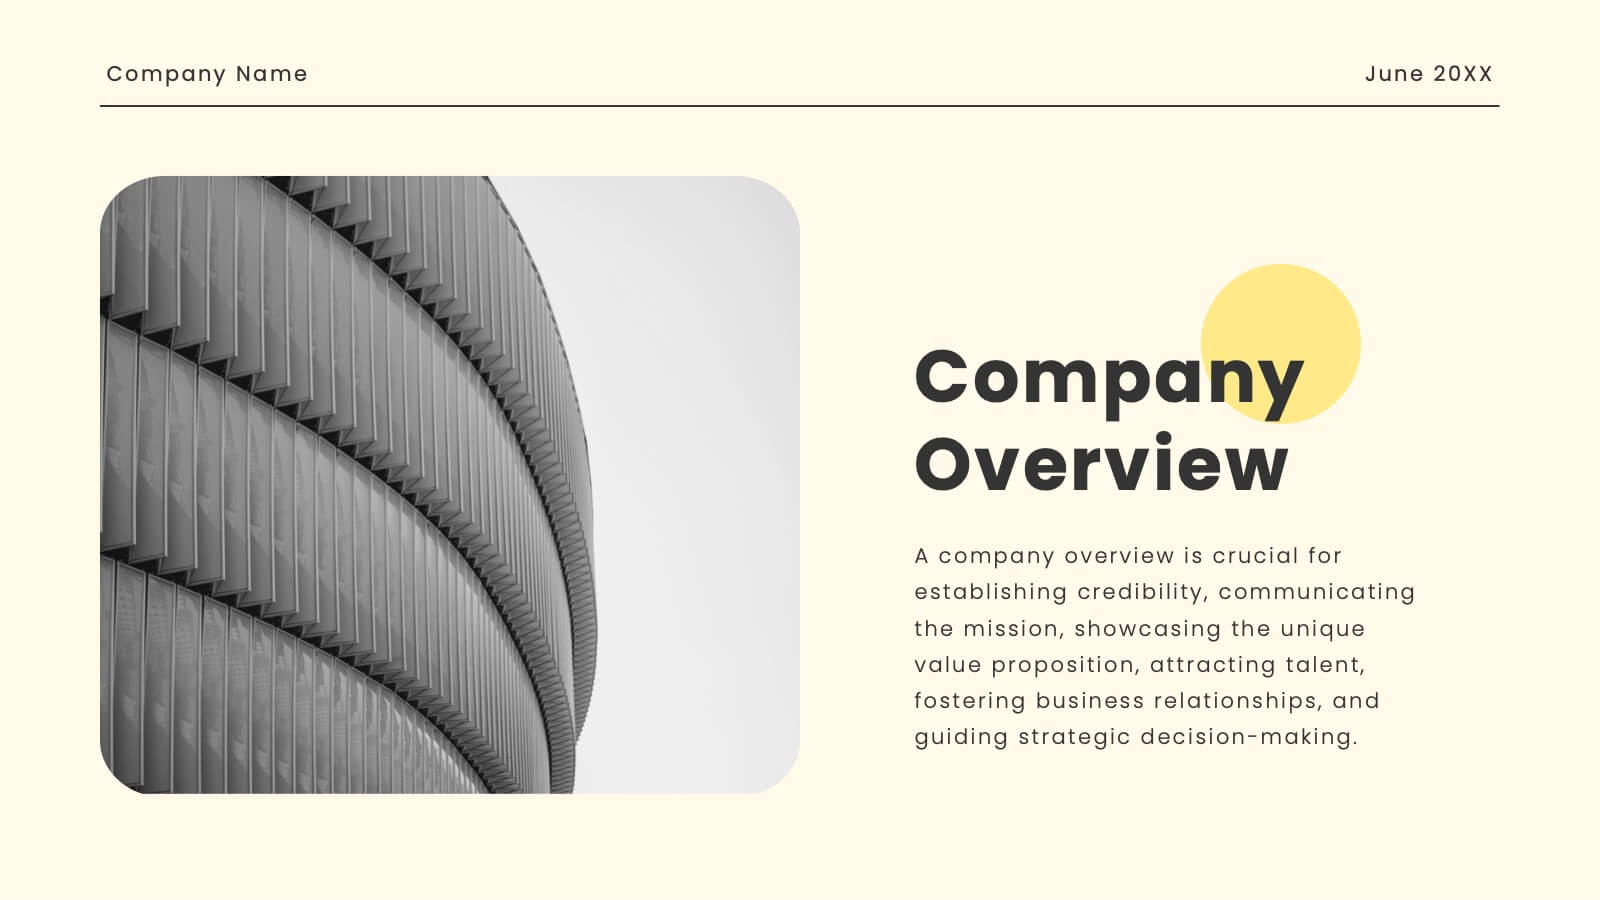
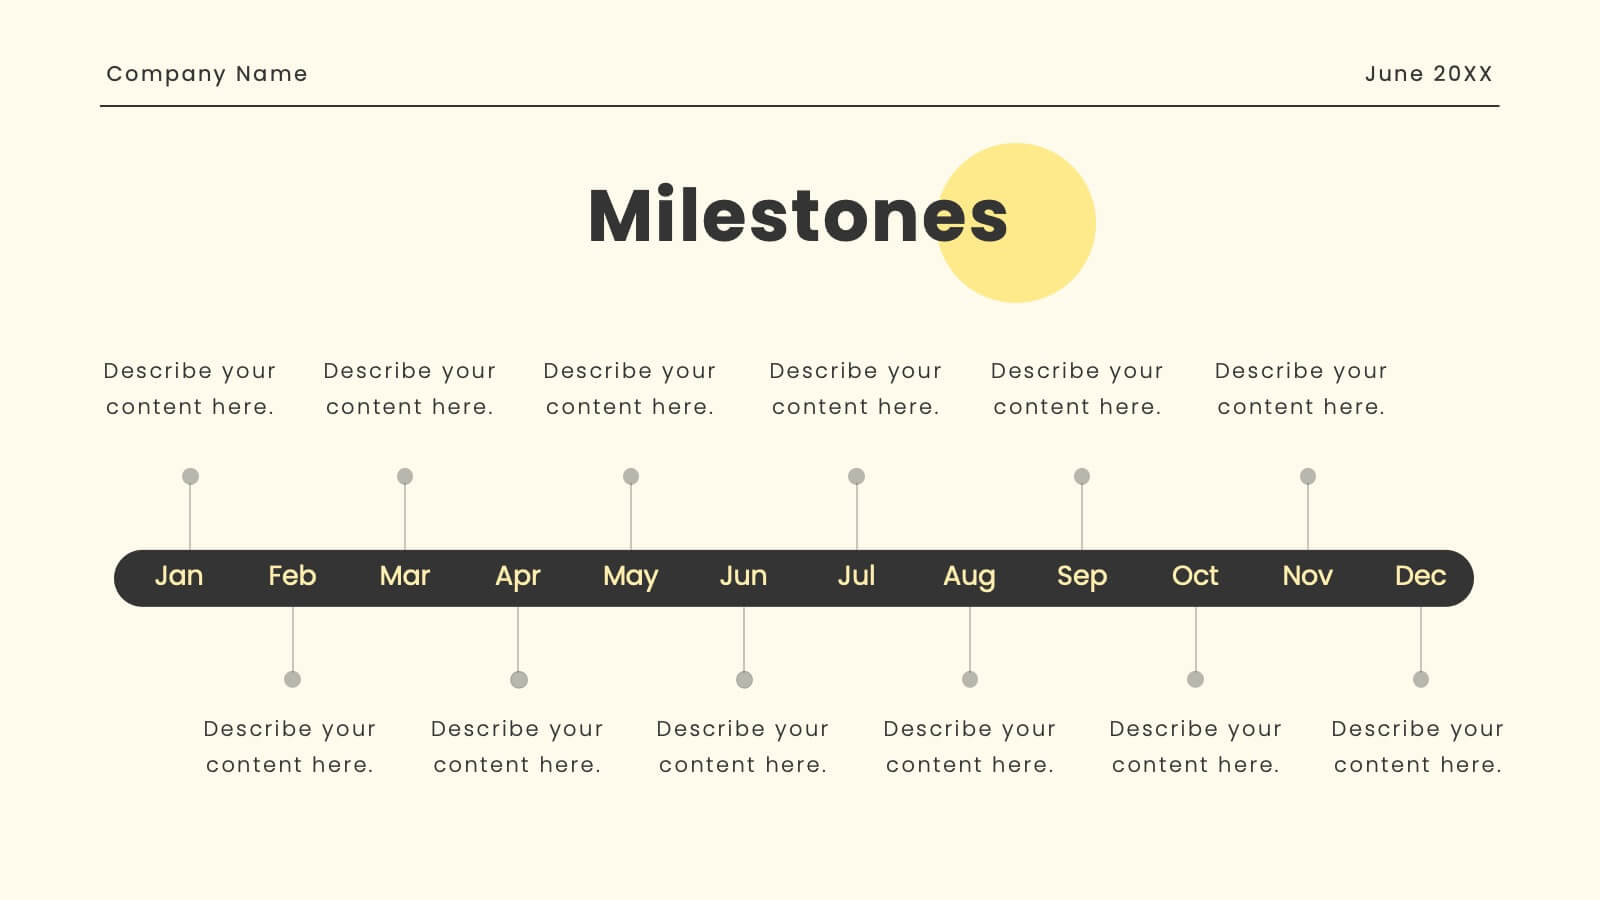
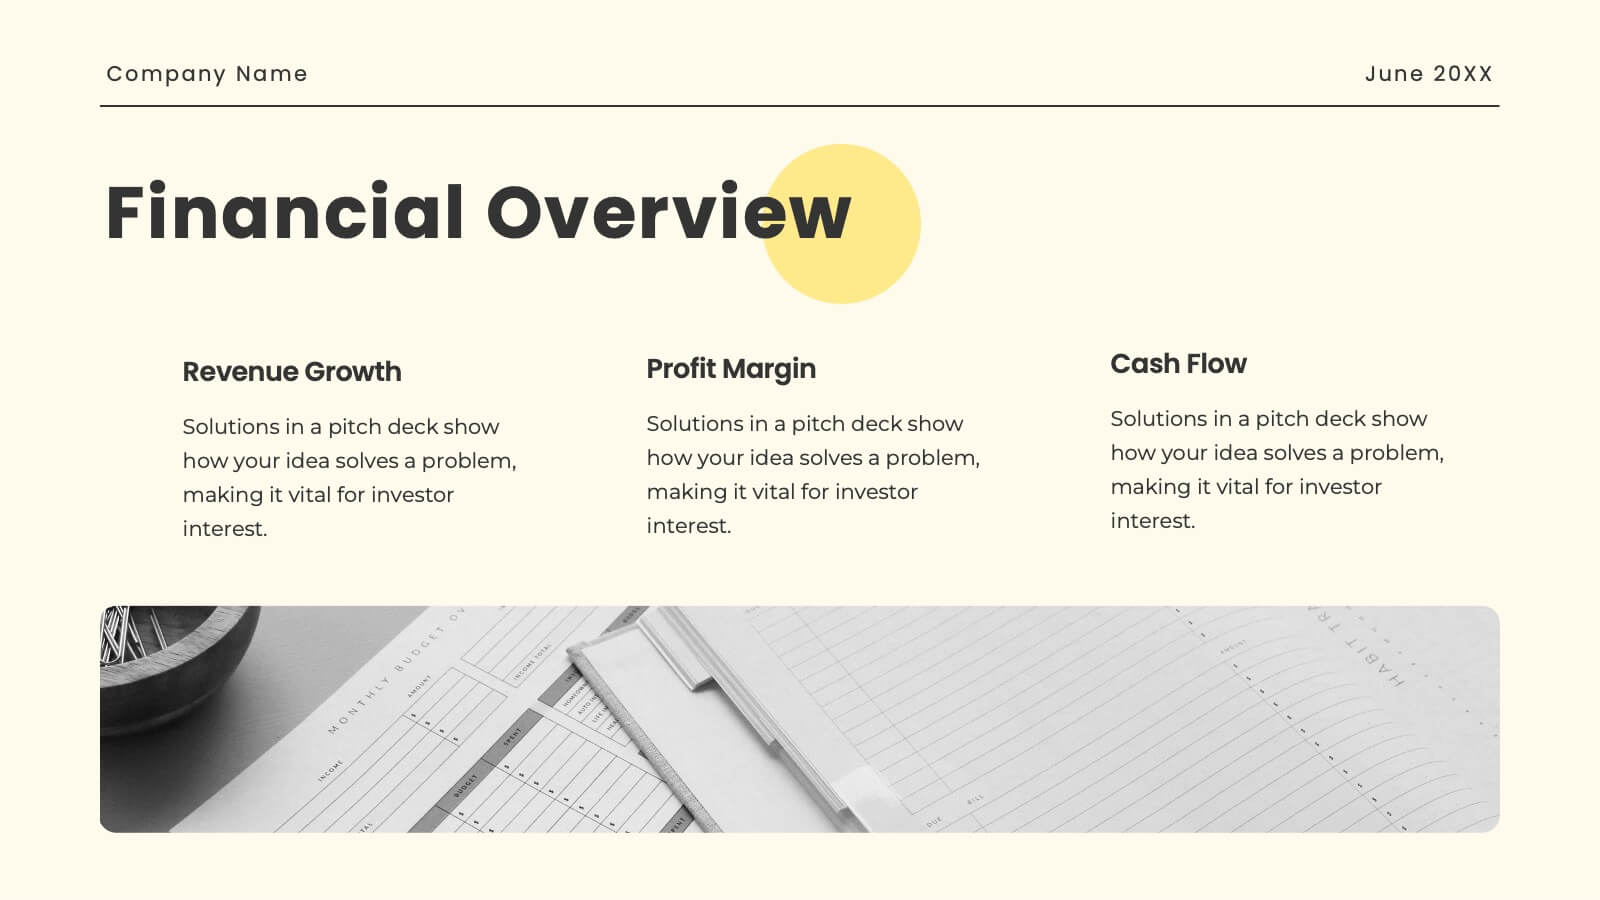
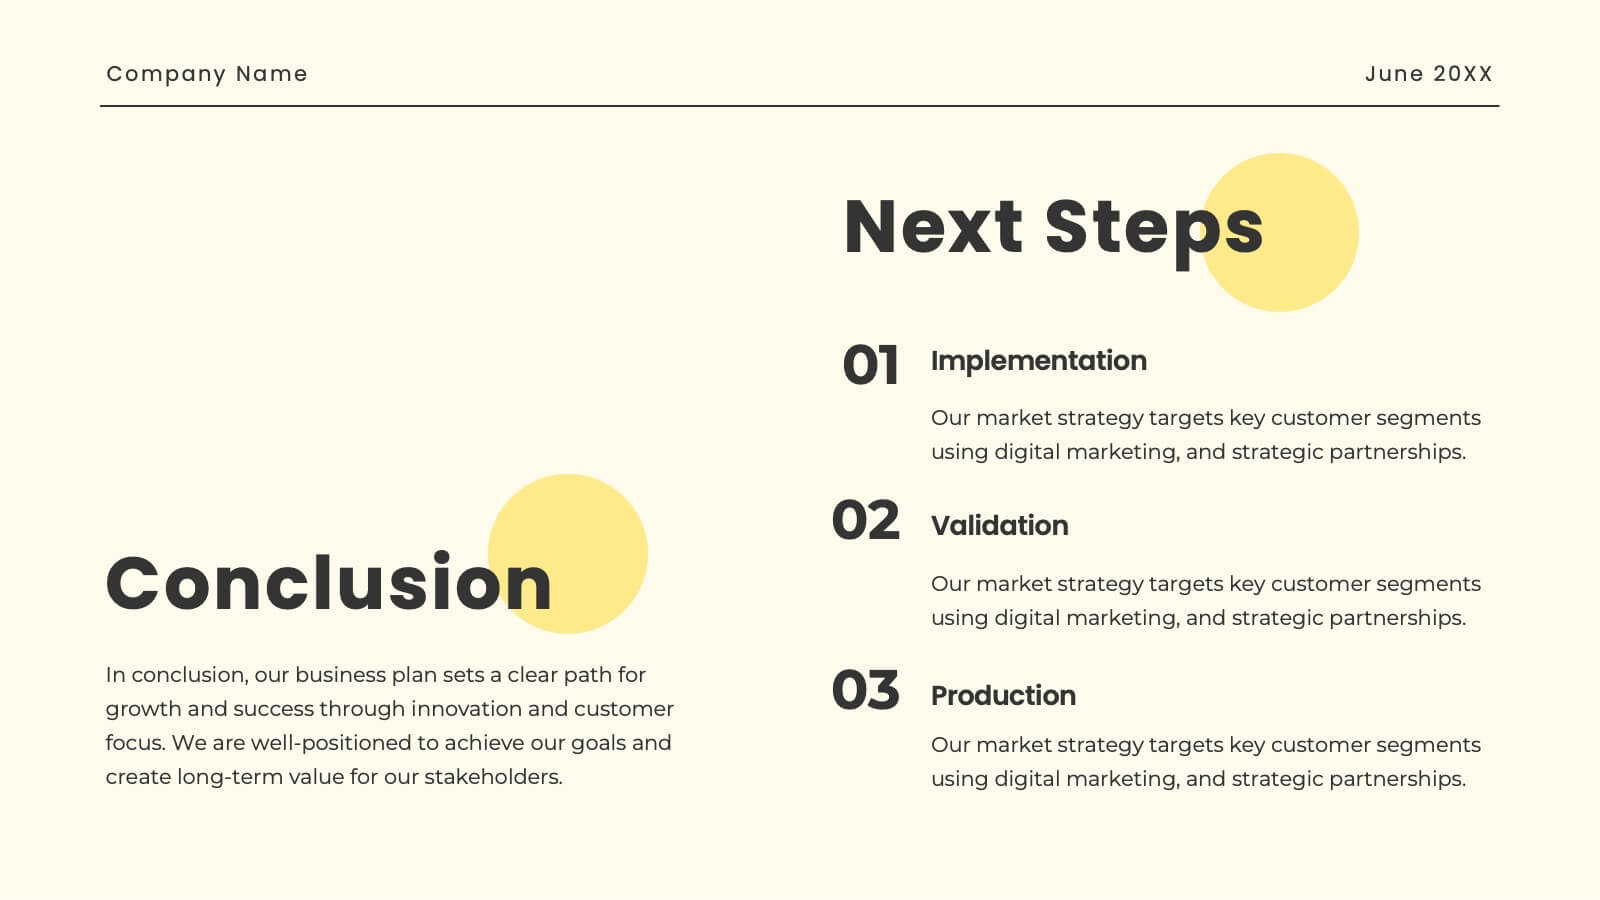
Oasis Startup Business Plan Presentation
Present your corporate business plan with confidence! This template includes sections for company overview, mission, vision, services, target market, and more. Showcase your market strategy, sales channels, growth plan, and financial overview. Perfect for conveying a professional and comprehensive business plan. Compatible with PowerPoint, Keynote, and Google Slides. Impress your audience today!