


Features
- 6 Unique slides
- Fully editable and easy to edit in Microsoft Powerpoint, Keynote and Google Slides
- 16:9 widescreen layout
- Clean and professional designs
- Export to JPG, PDF or send by email


Do you have any questions?
Recommend


6 slides
Life Insurance Infographic
Life insurance is a contract between an individual and an insurance company, where the insurance company agrees to pay a sum of money (the death benefit) to the designated beneficiaries upon the death of the insured person. This infographic template is designed to provide a clear and concise overview of what life insurance is, why it is important, and the different types of life insurance coverage available. This infographic aims to educate and inform individuals about the value of life insurance in protecting their loved ones and securing their financial future. This infographic is compatible with Powerpoint, Keynote, and Google Slides.

20 slides
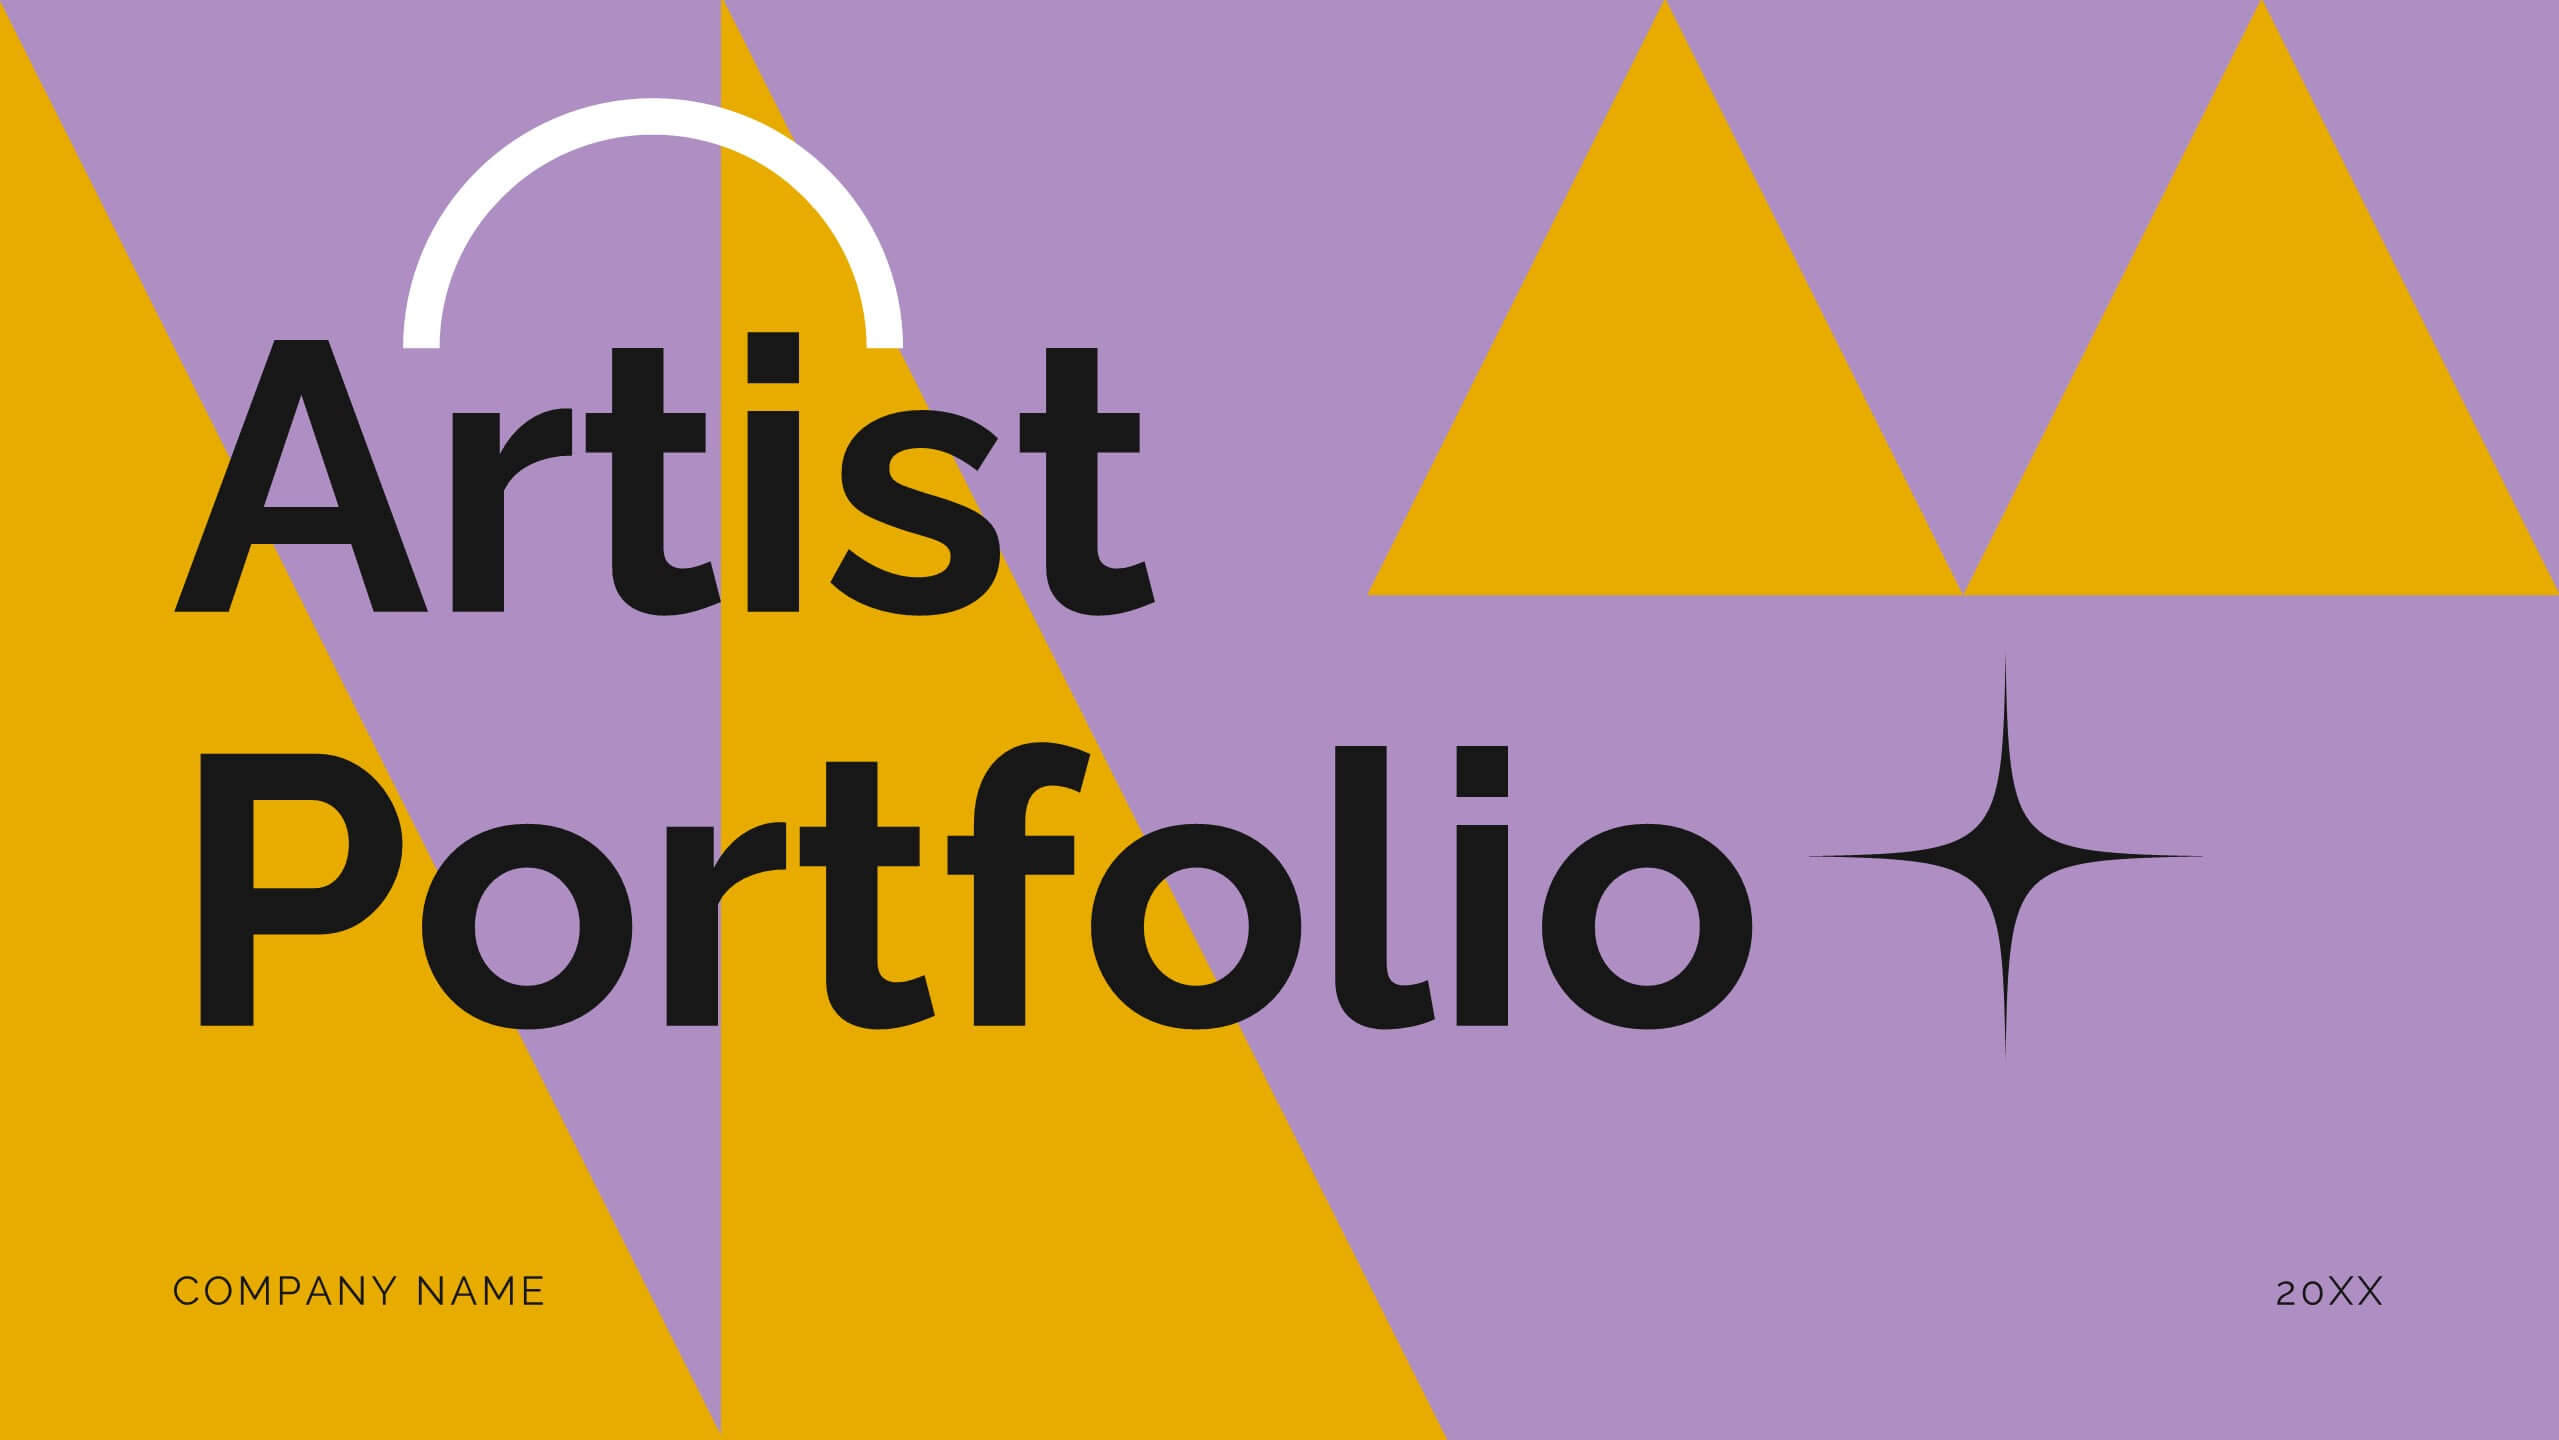
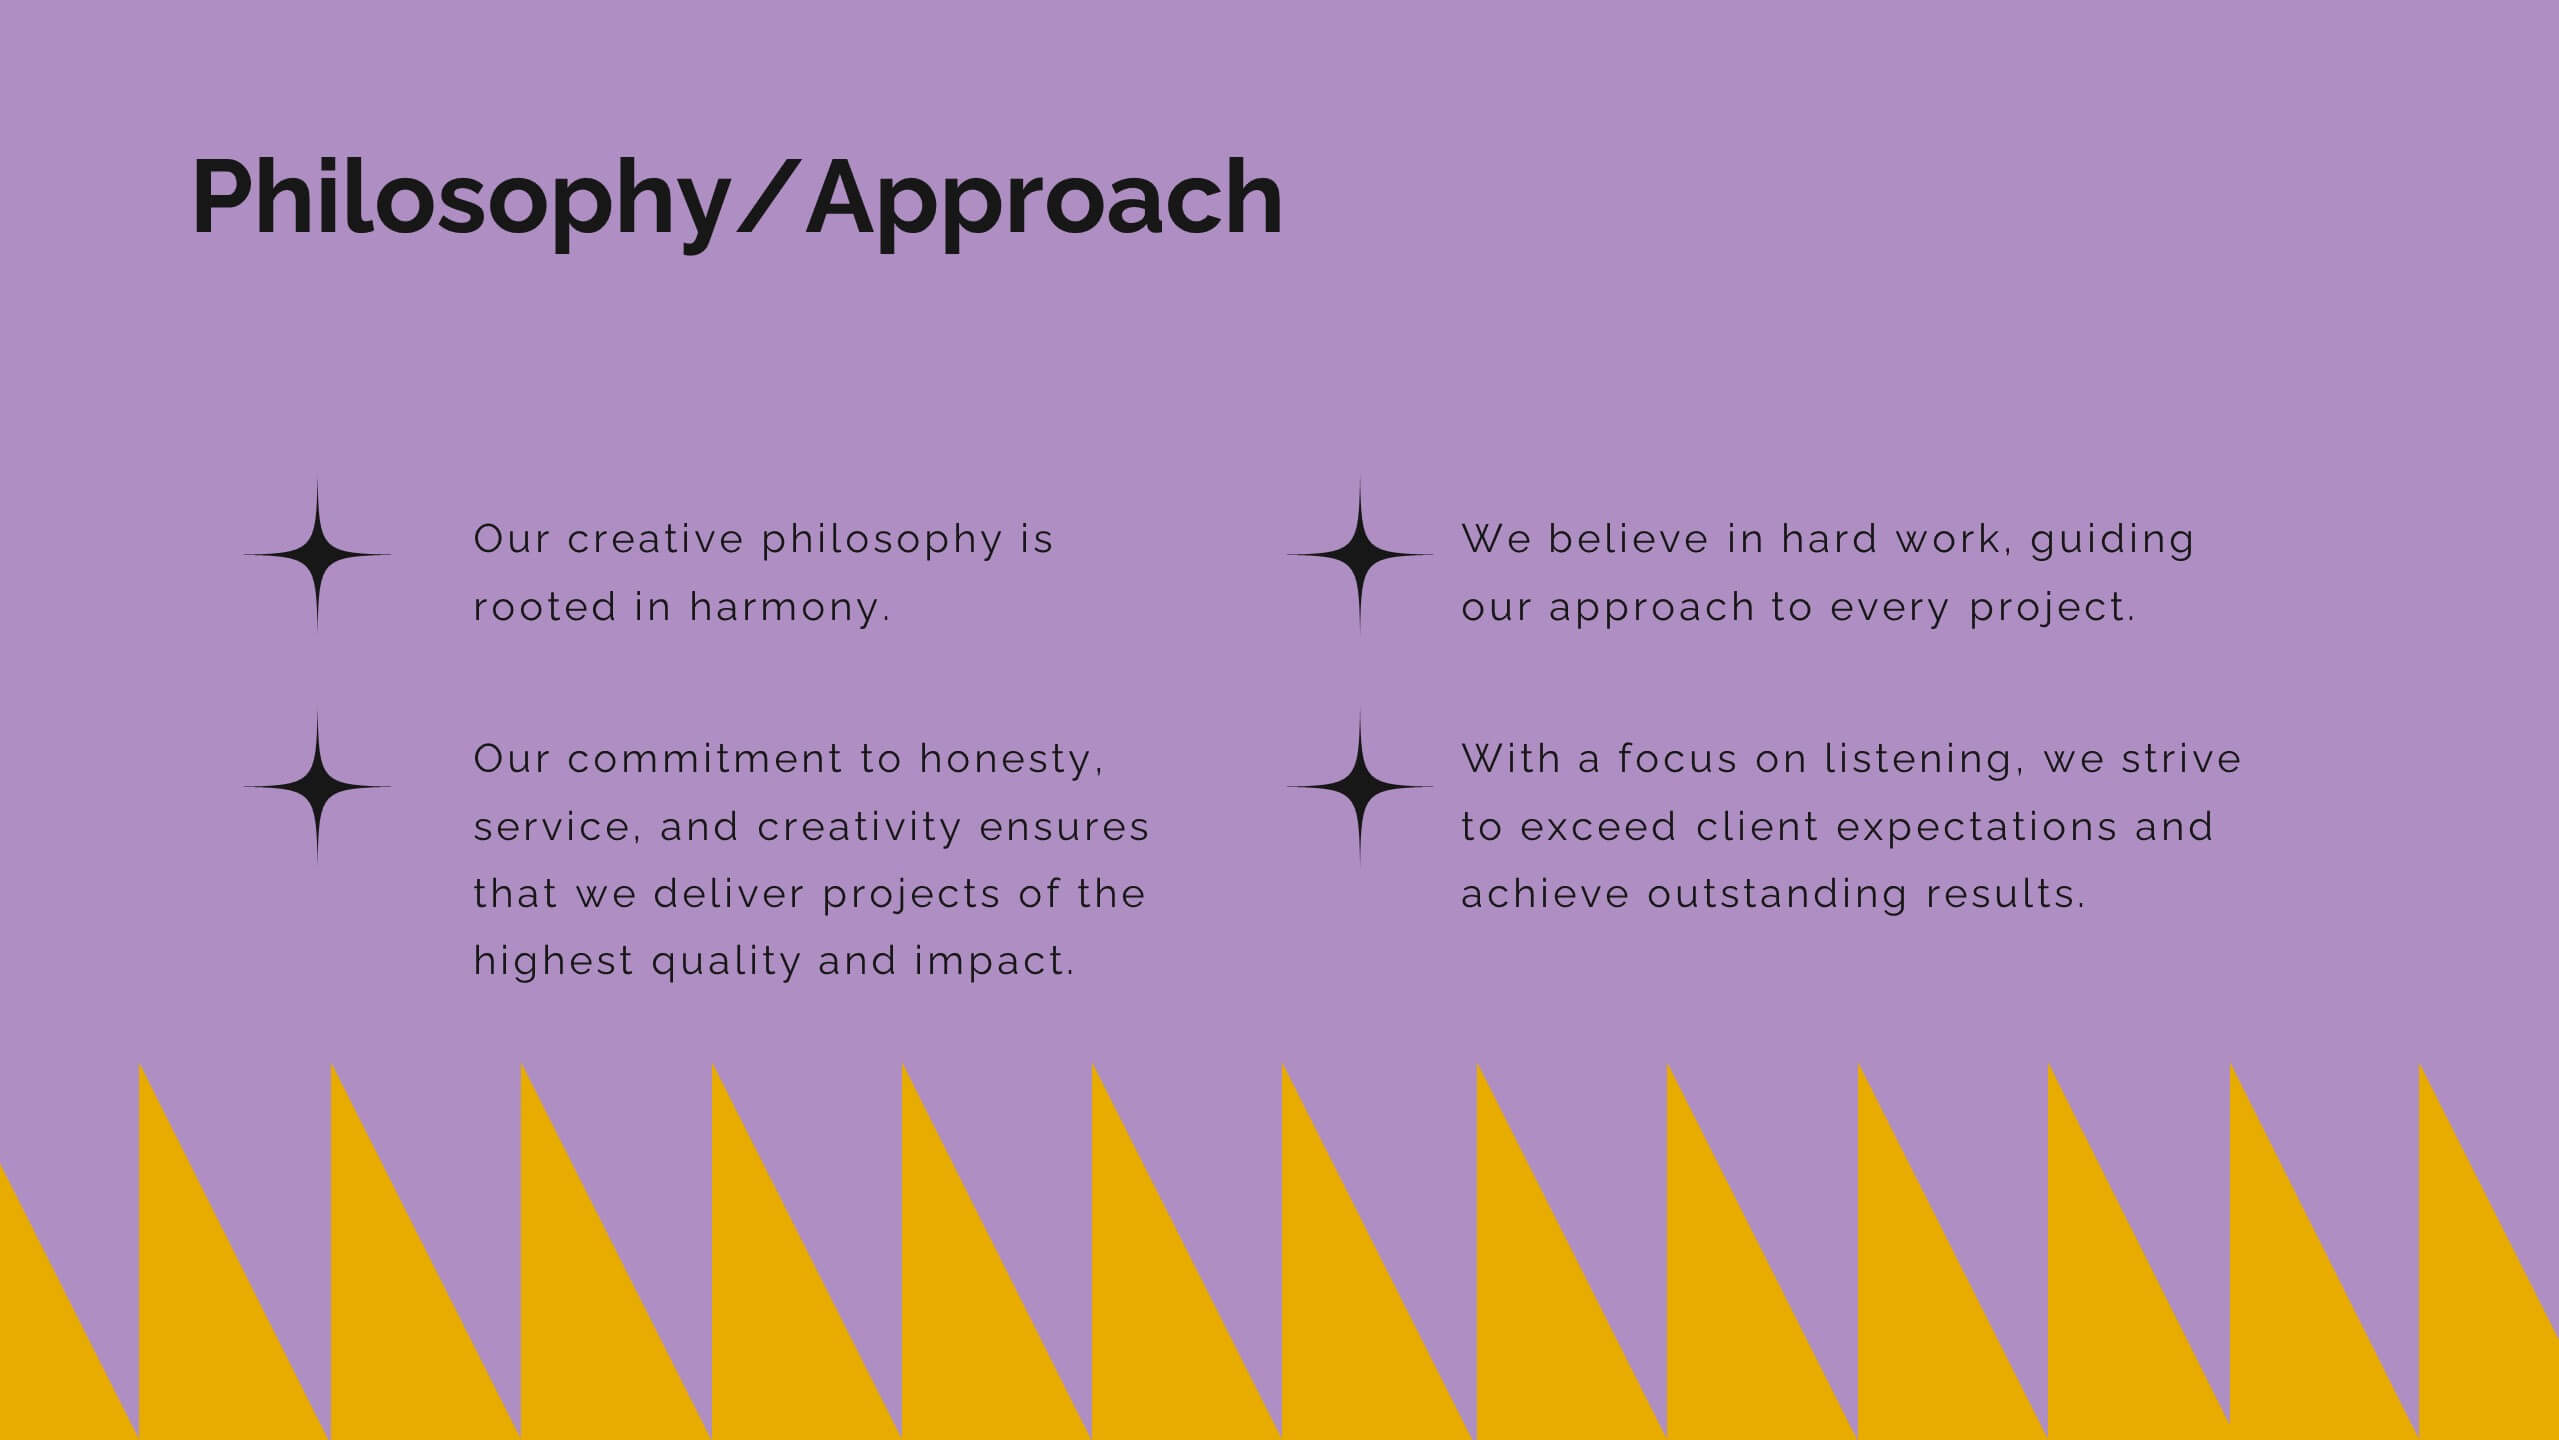
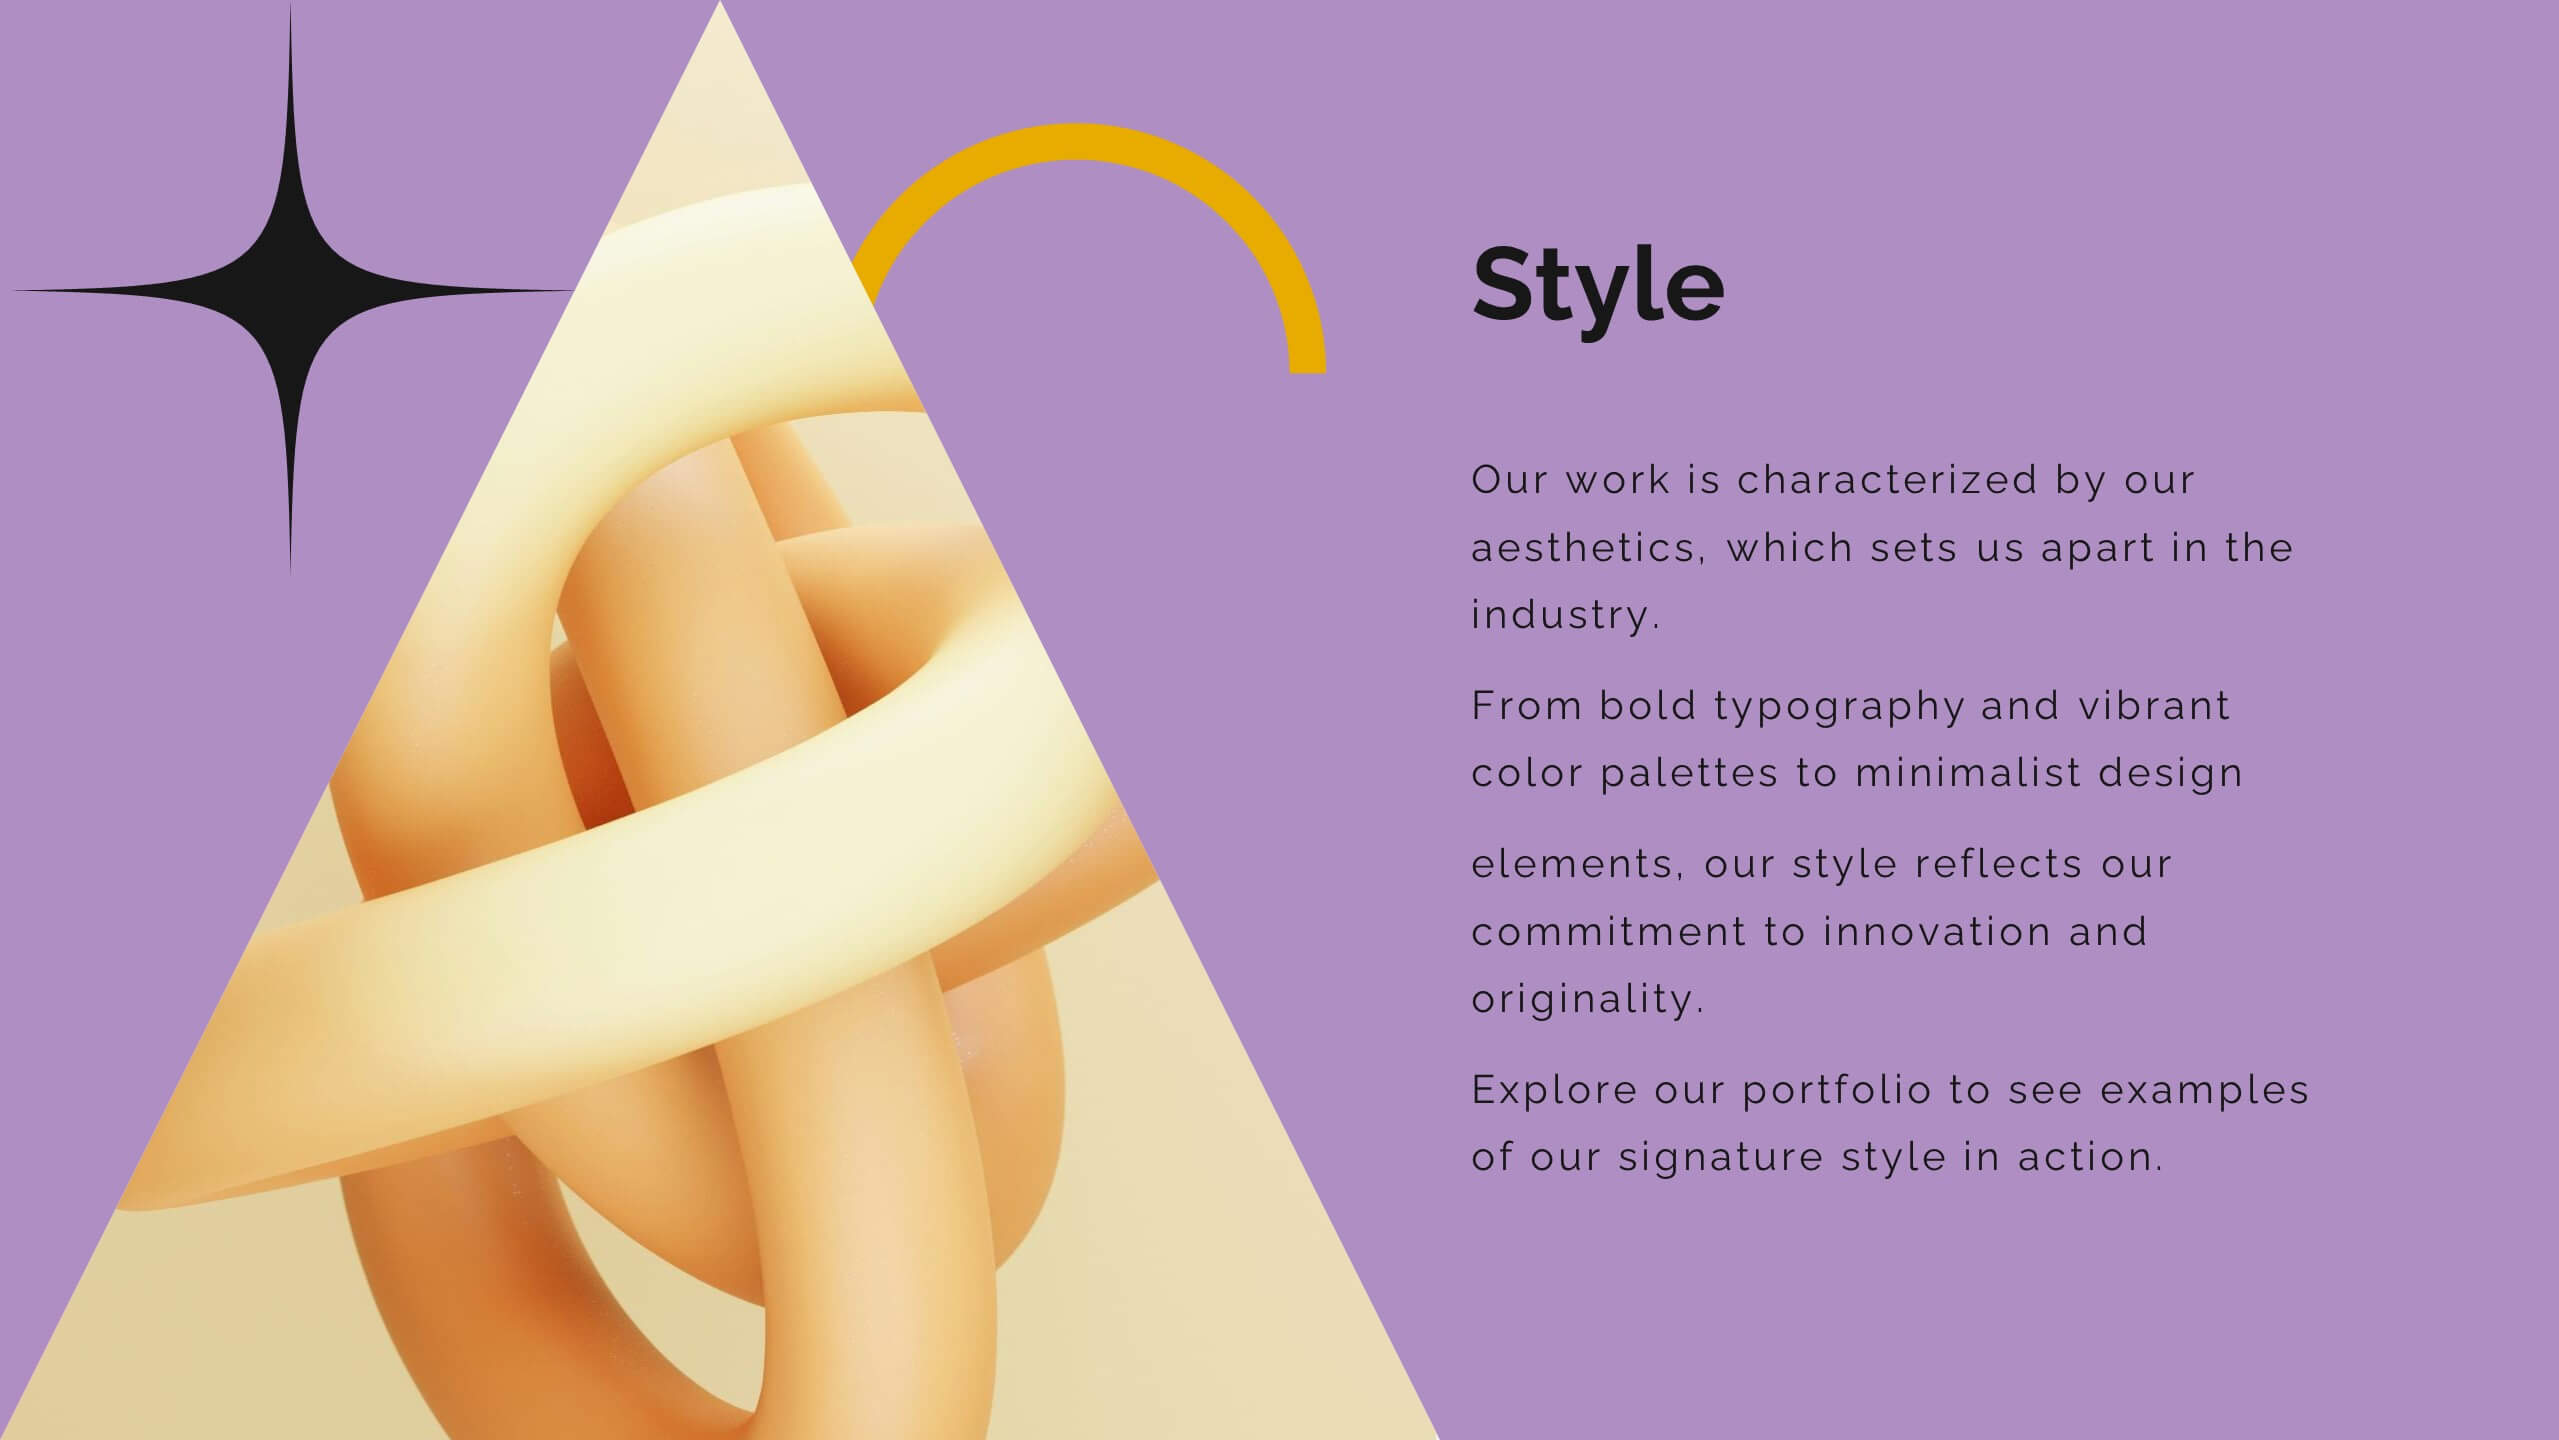
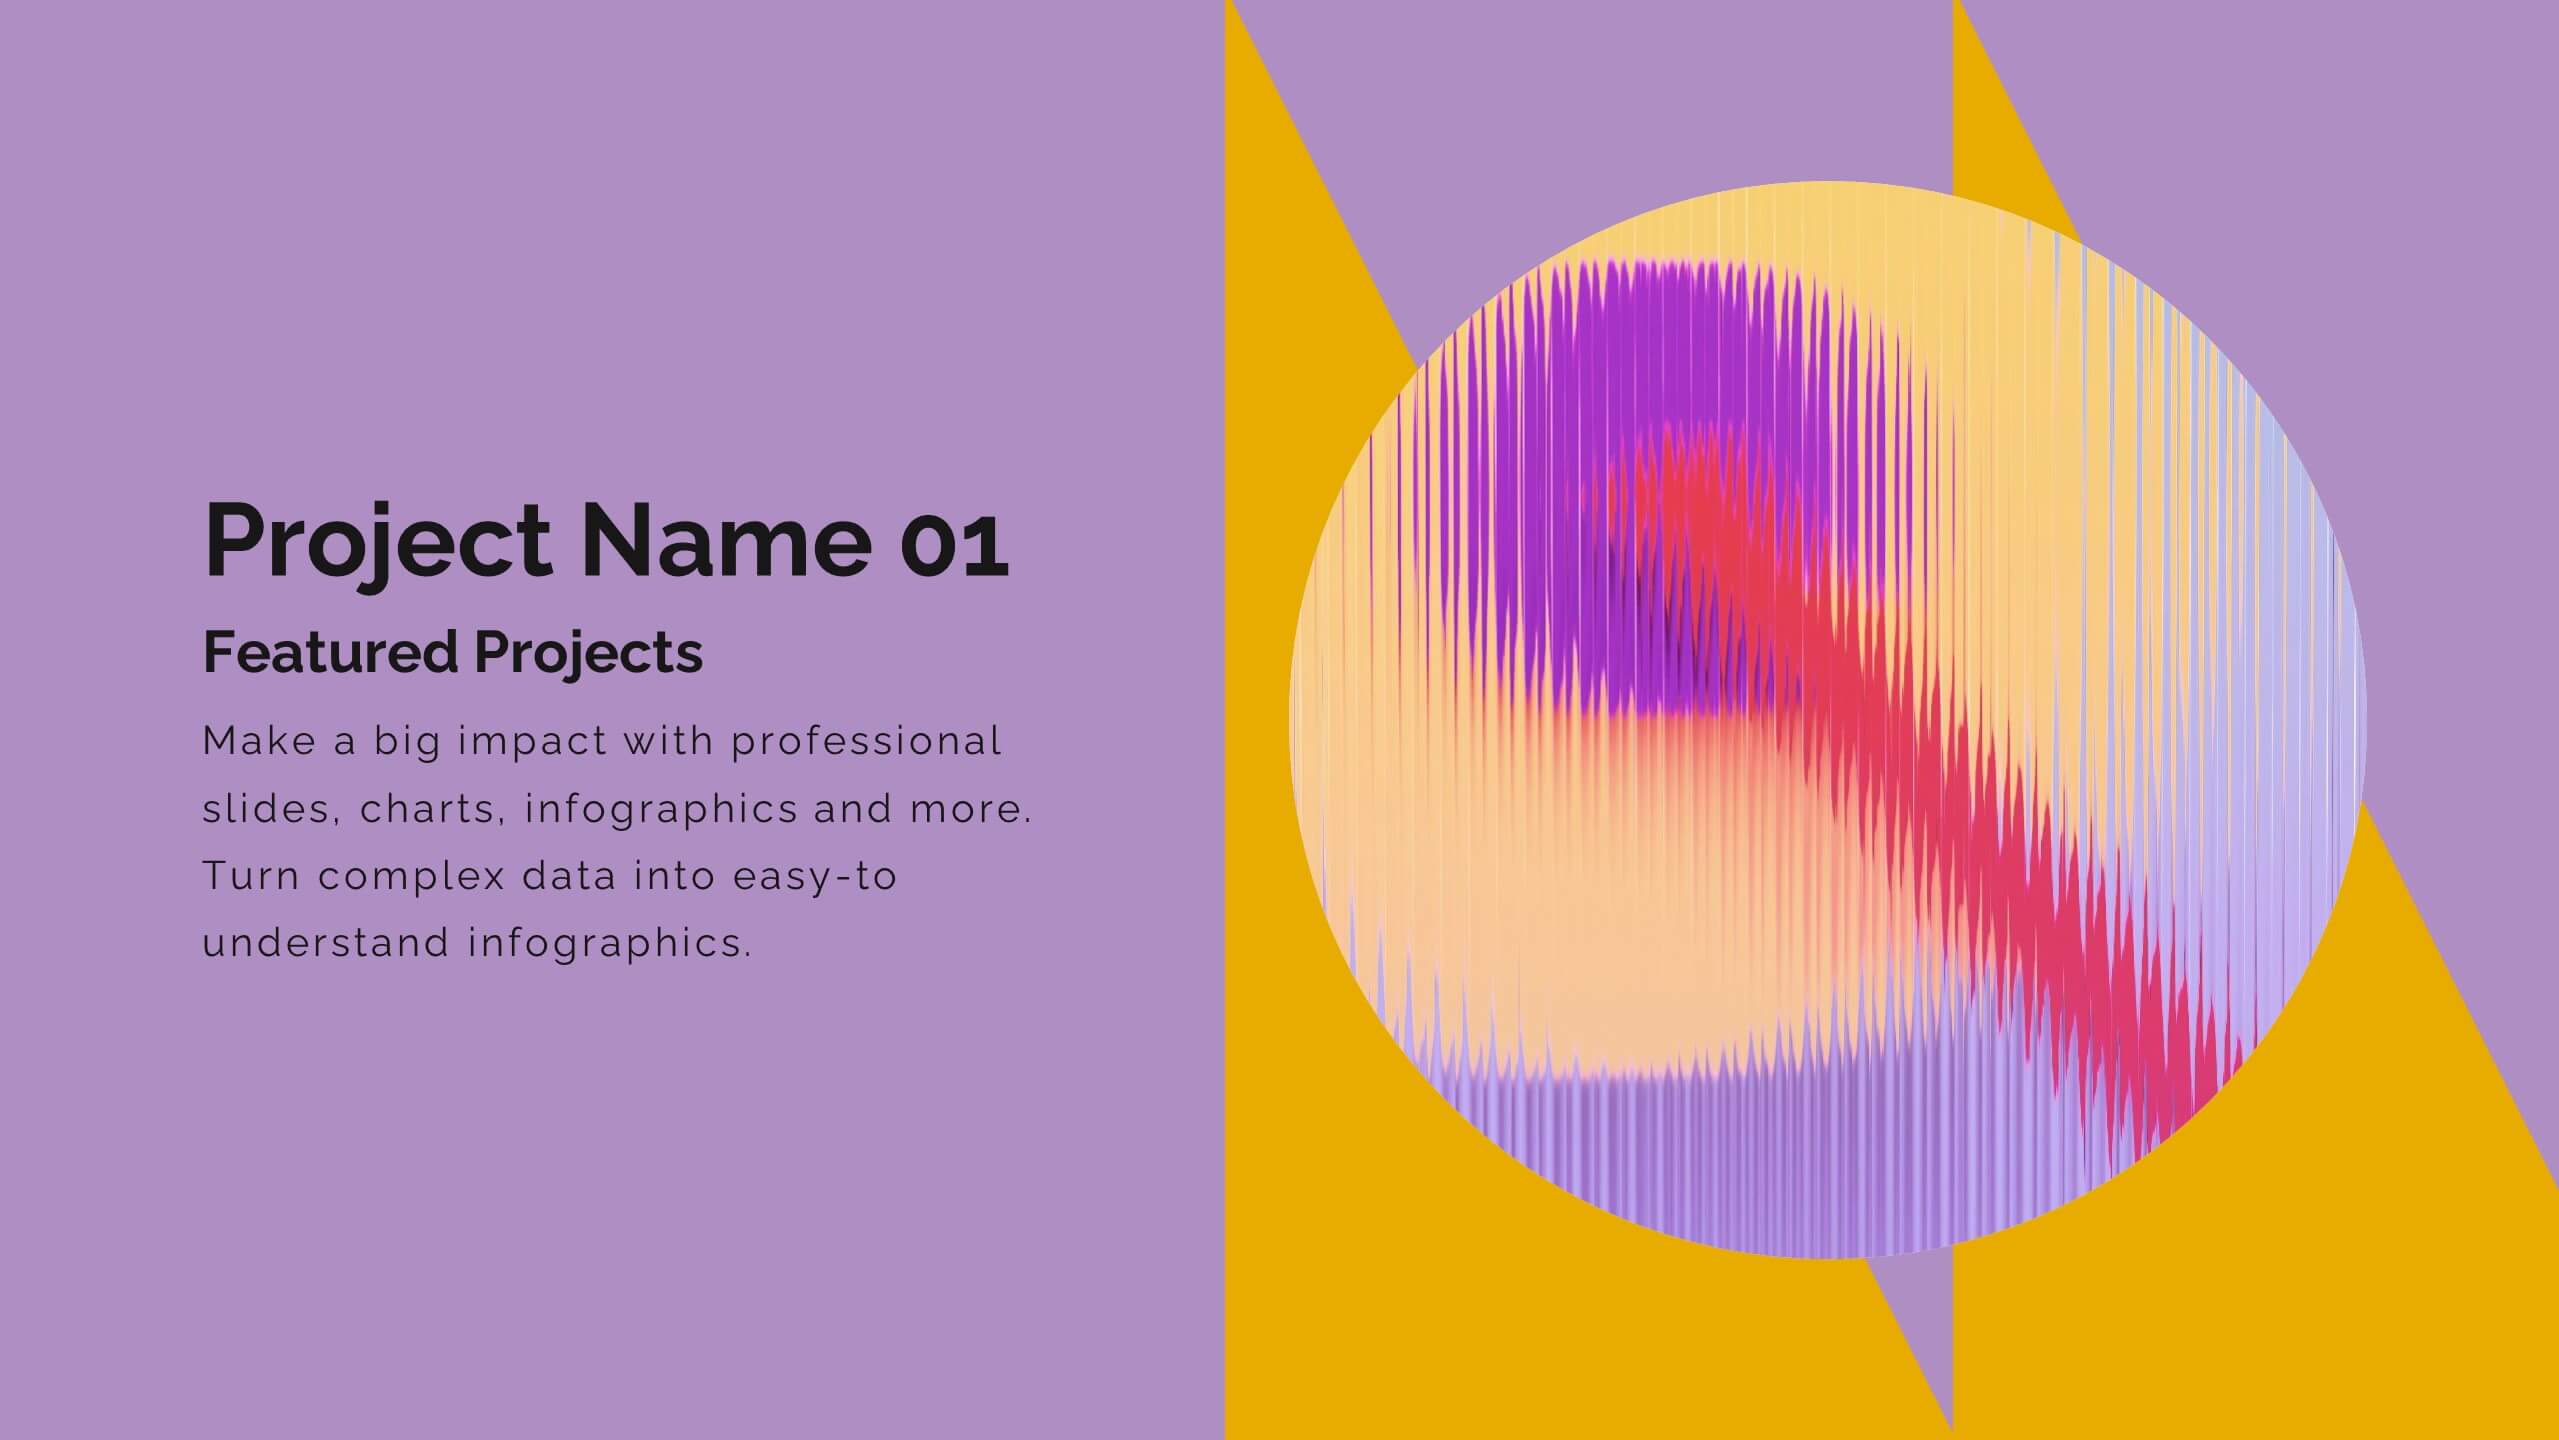
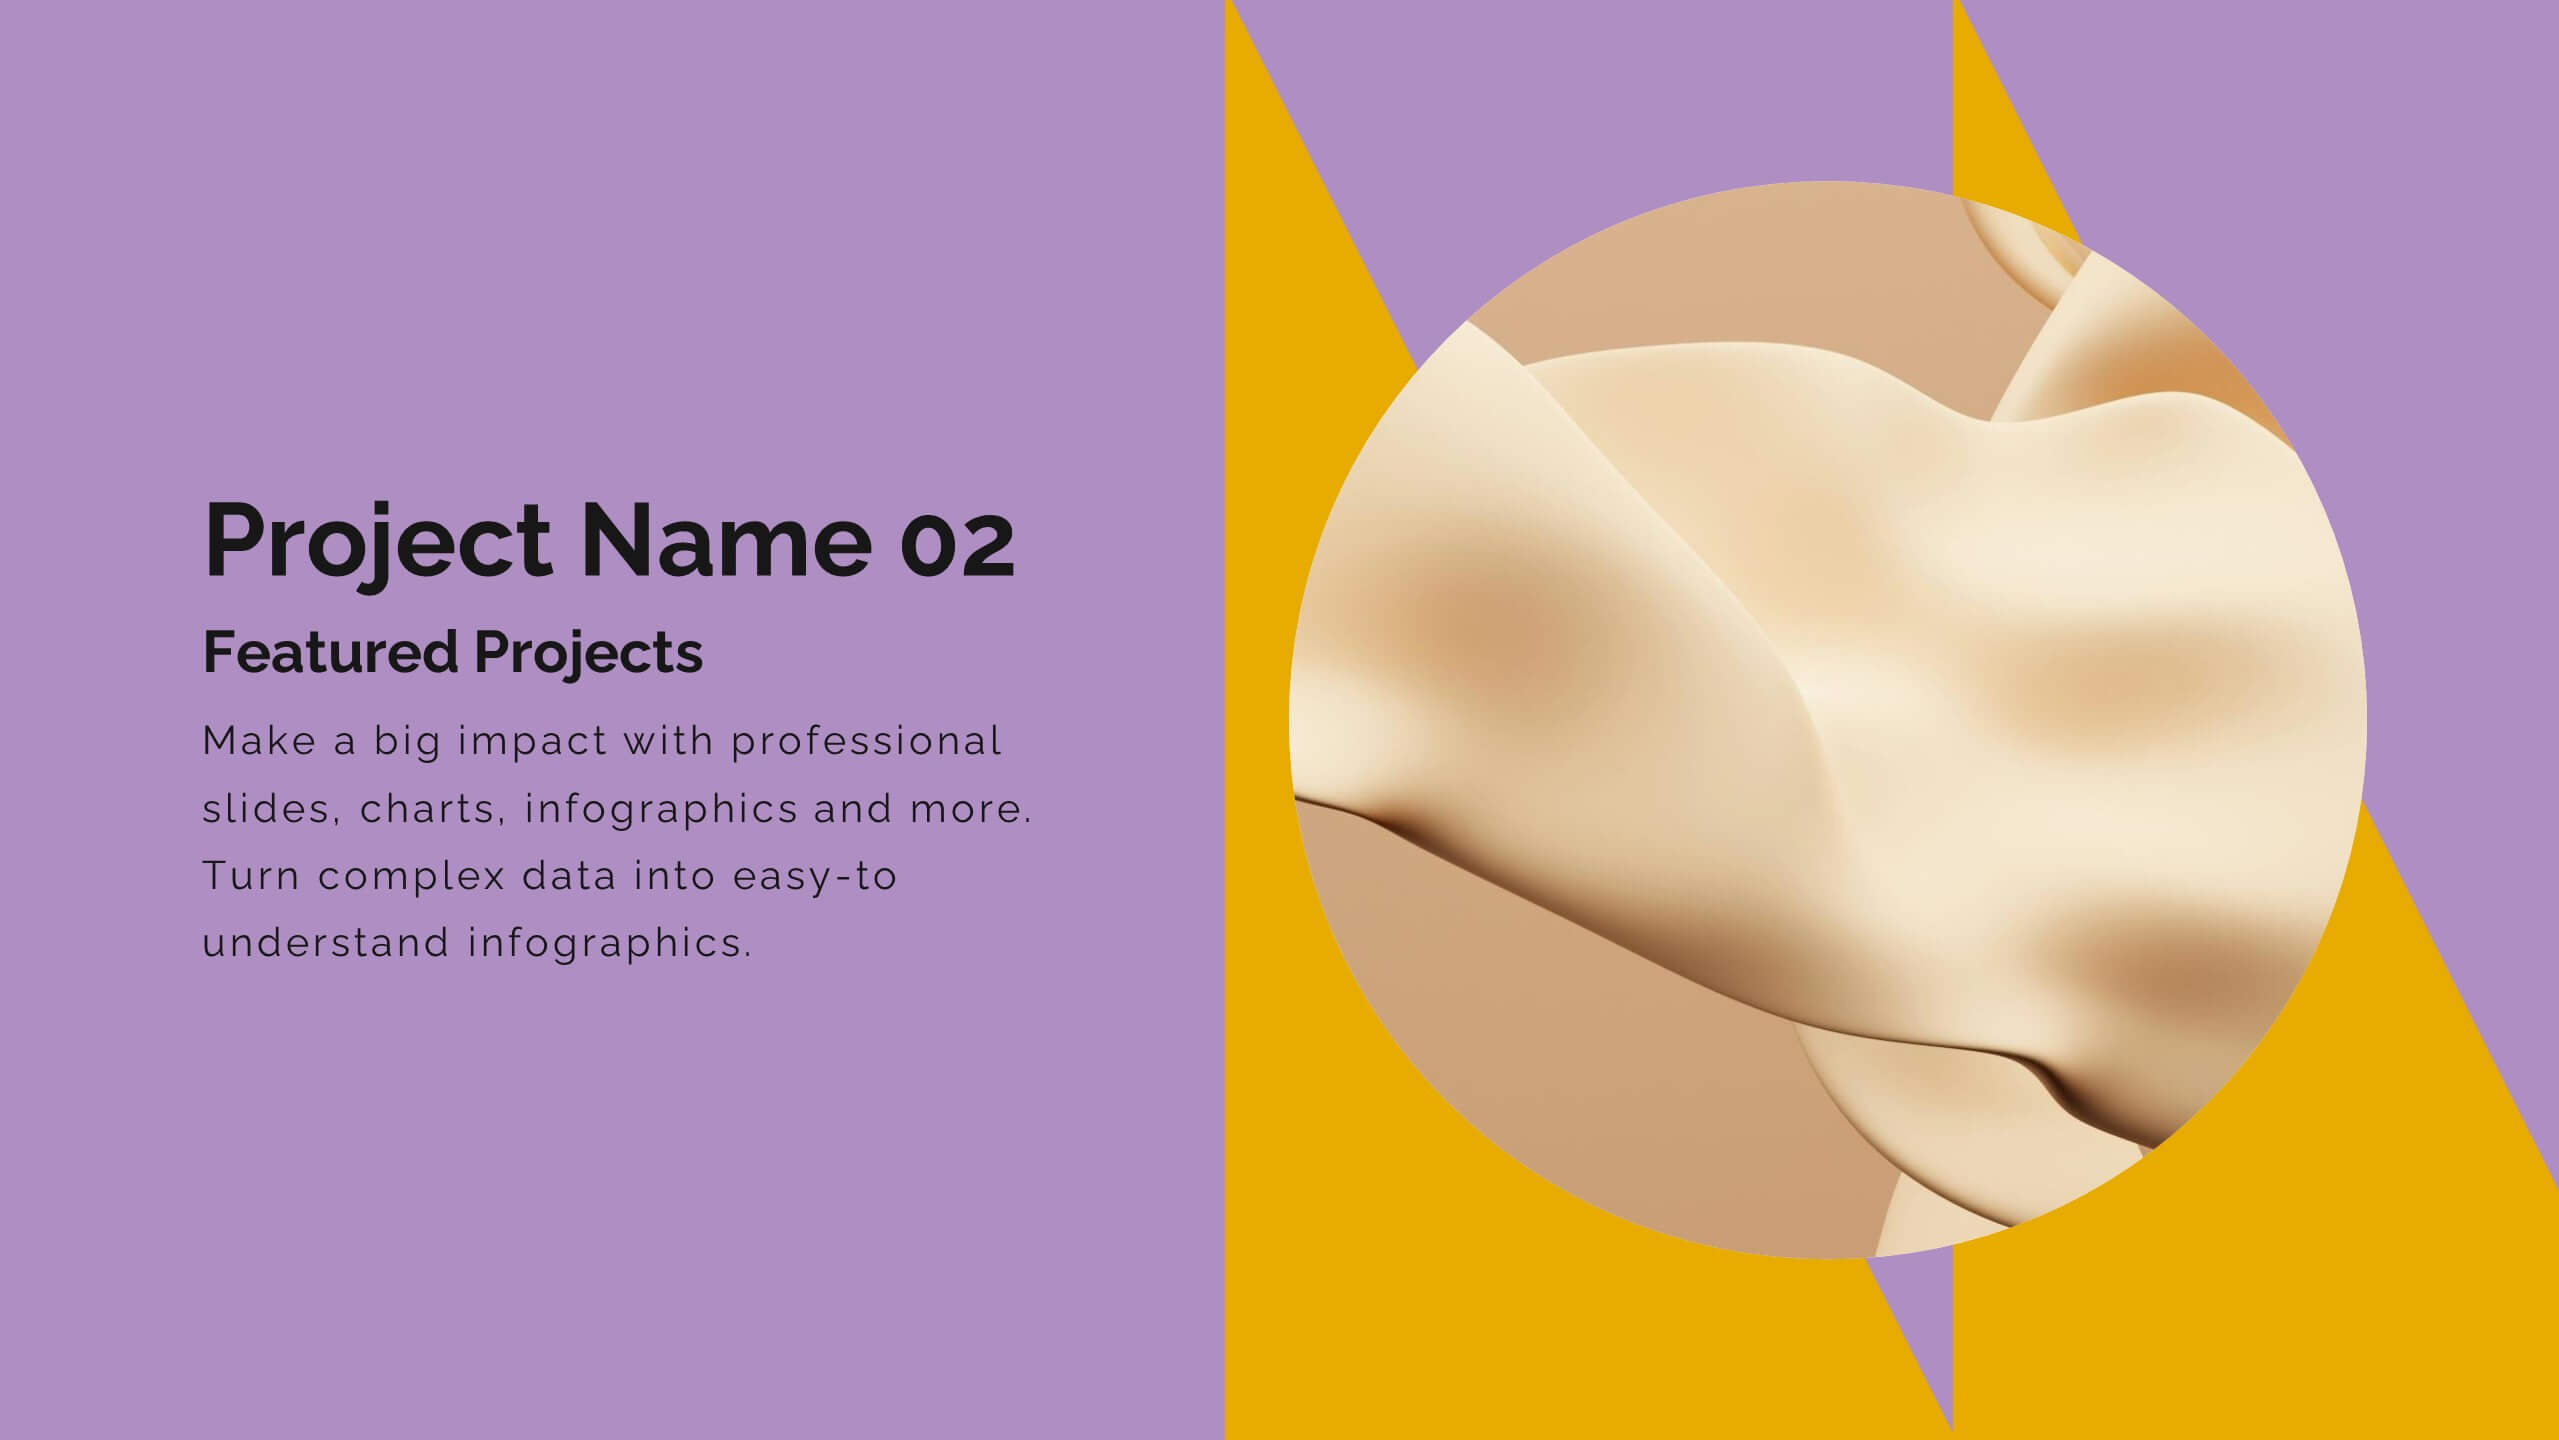
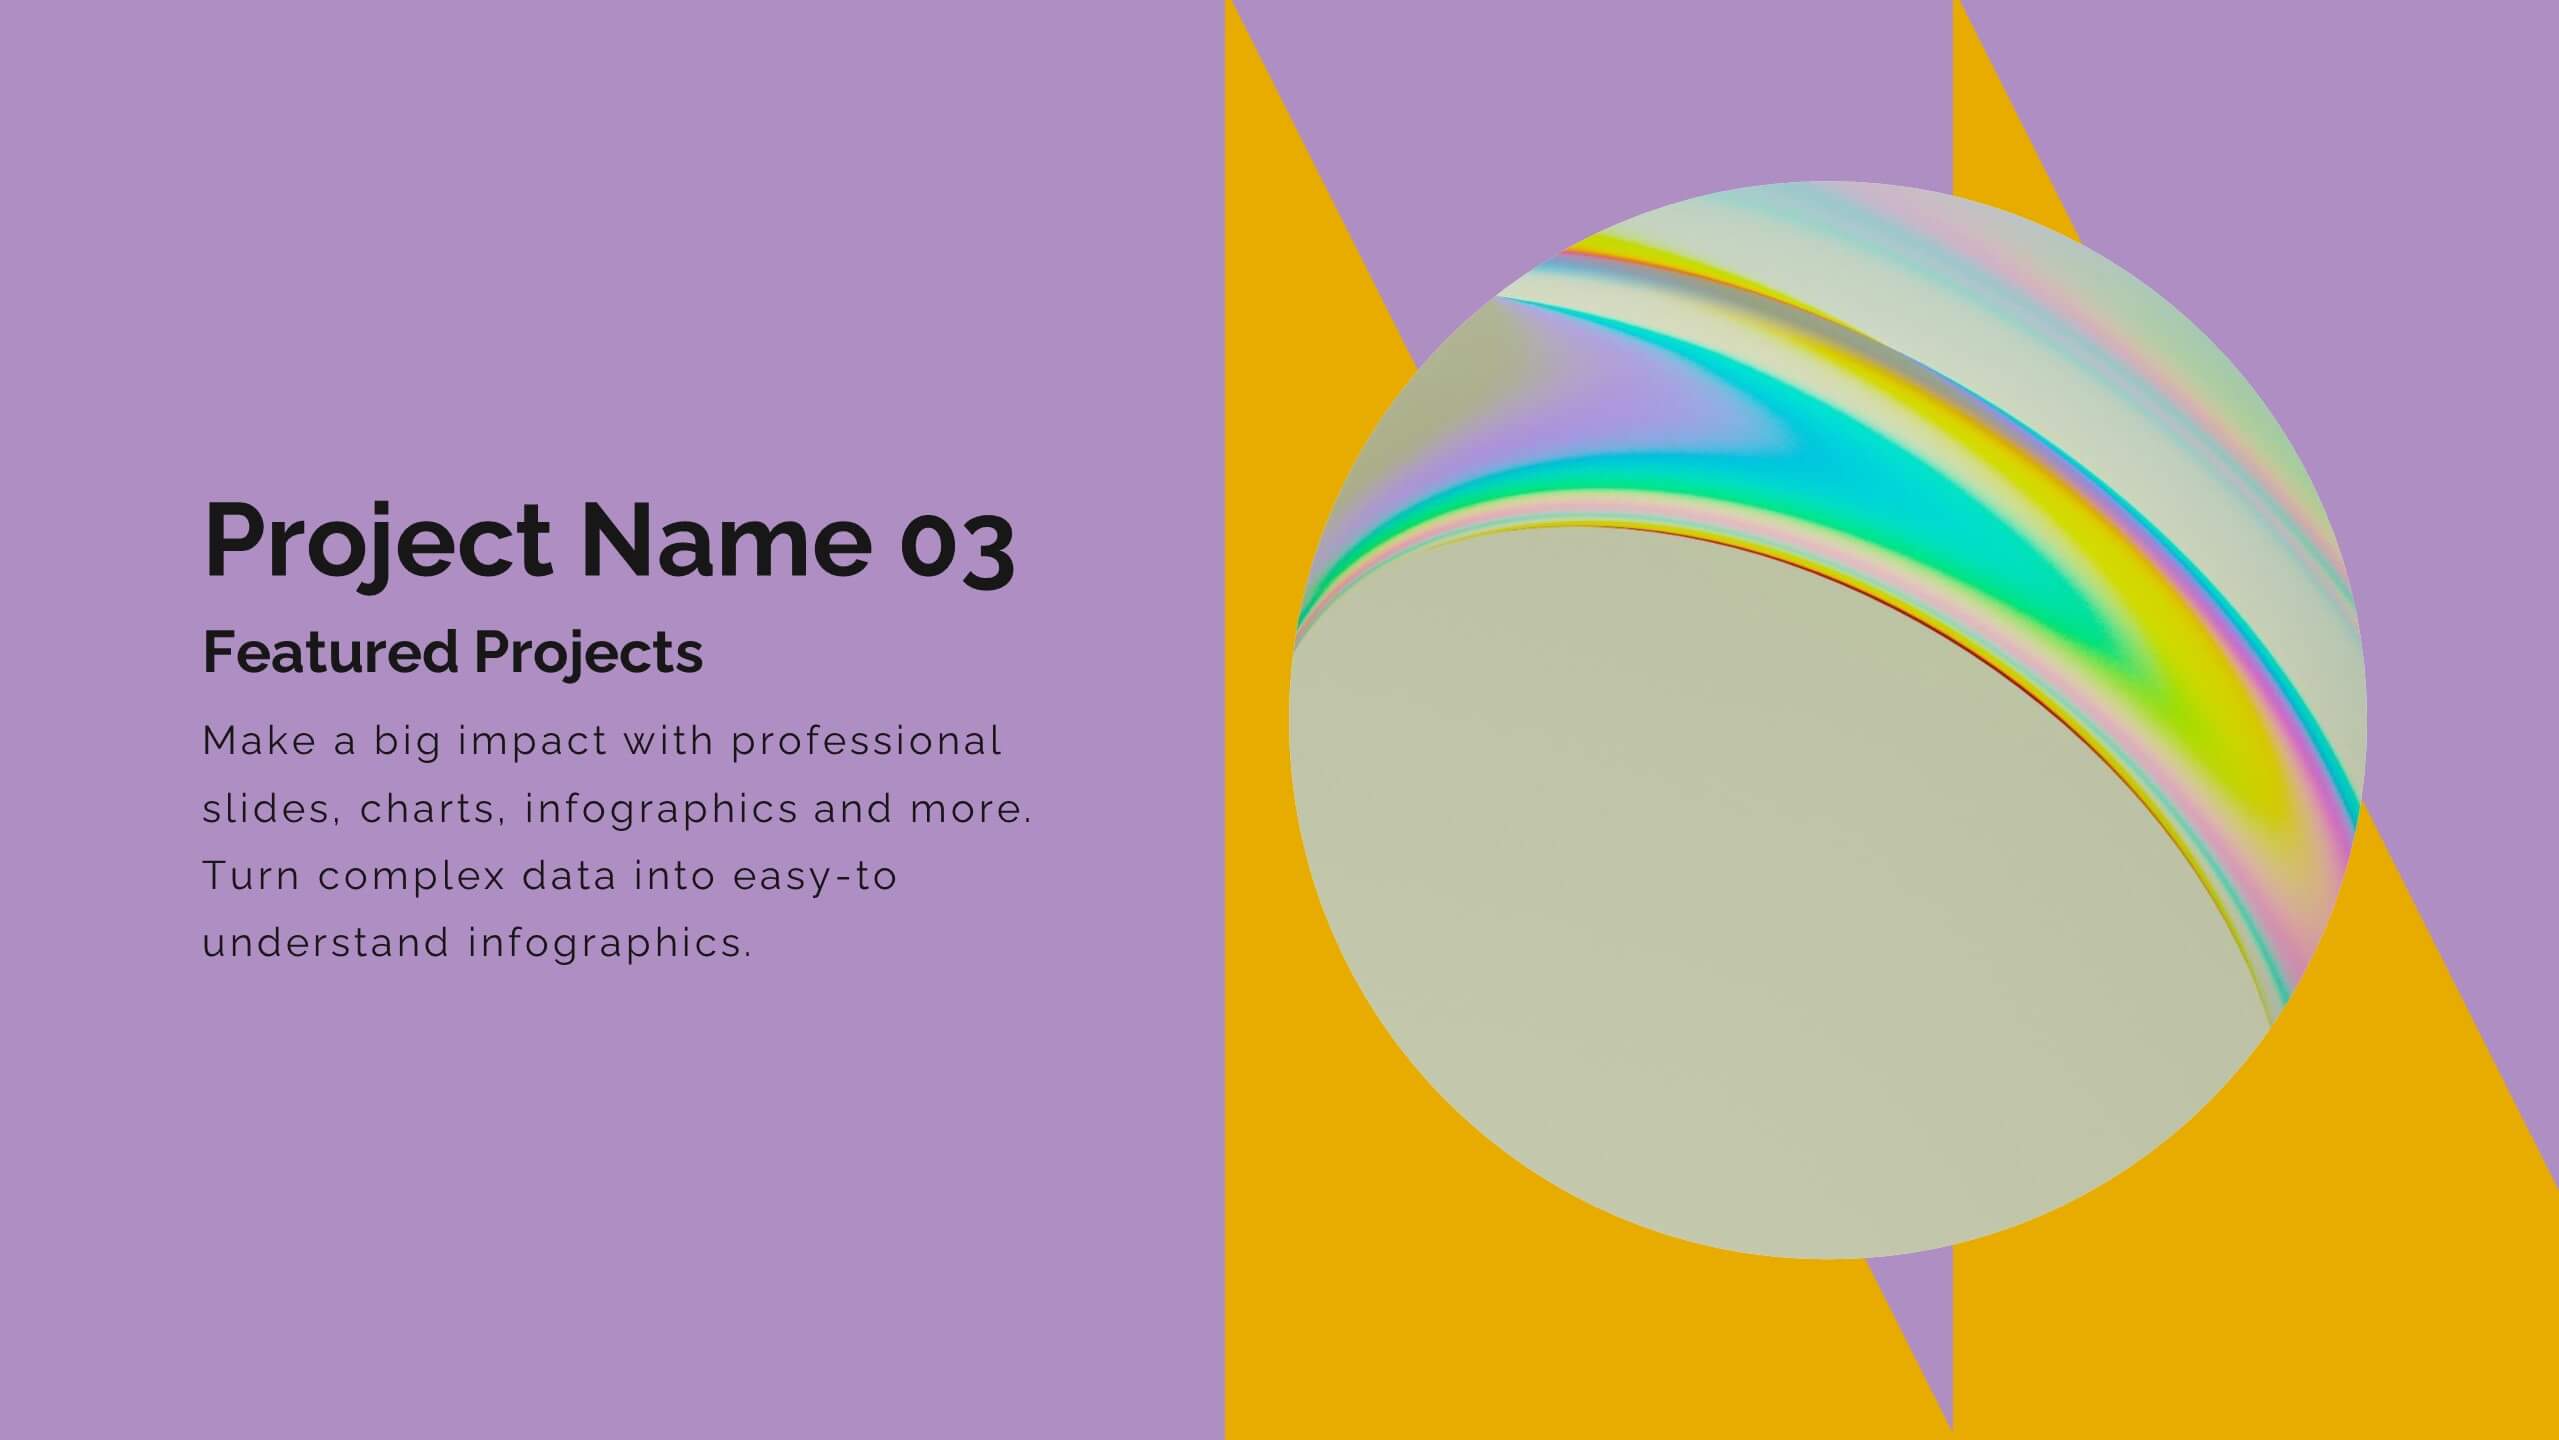
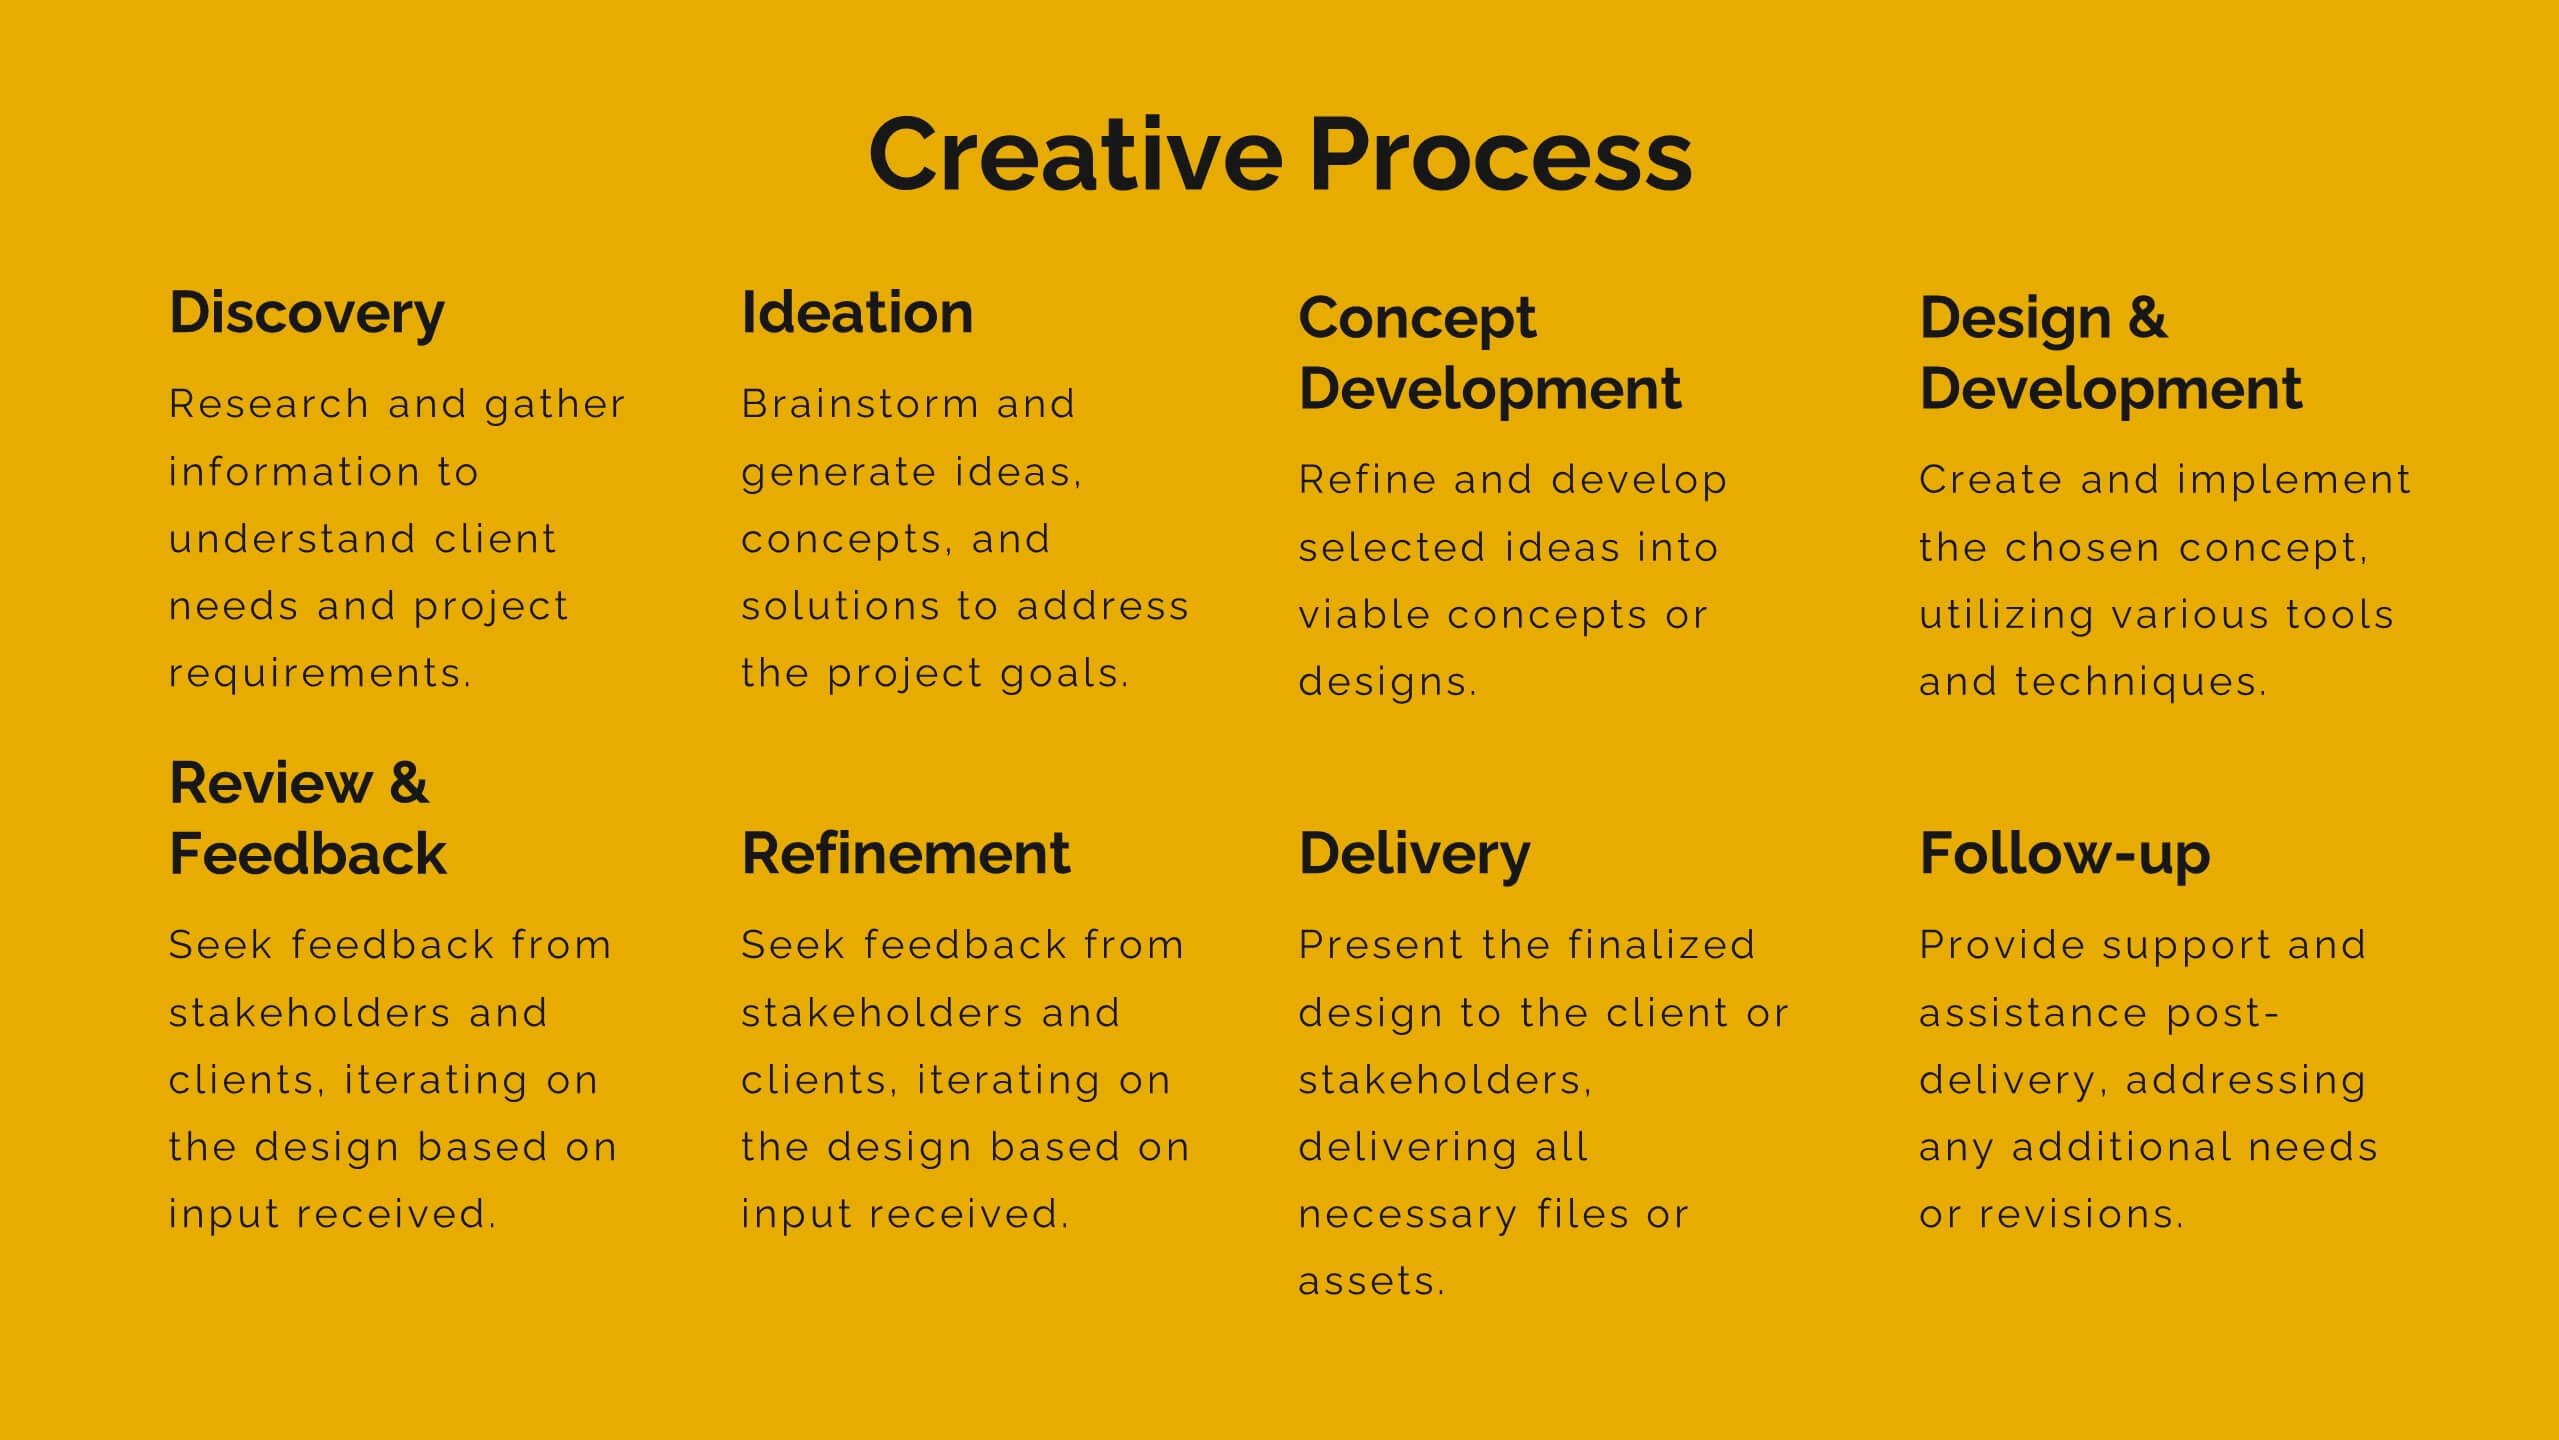
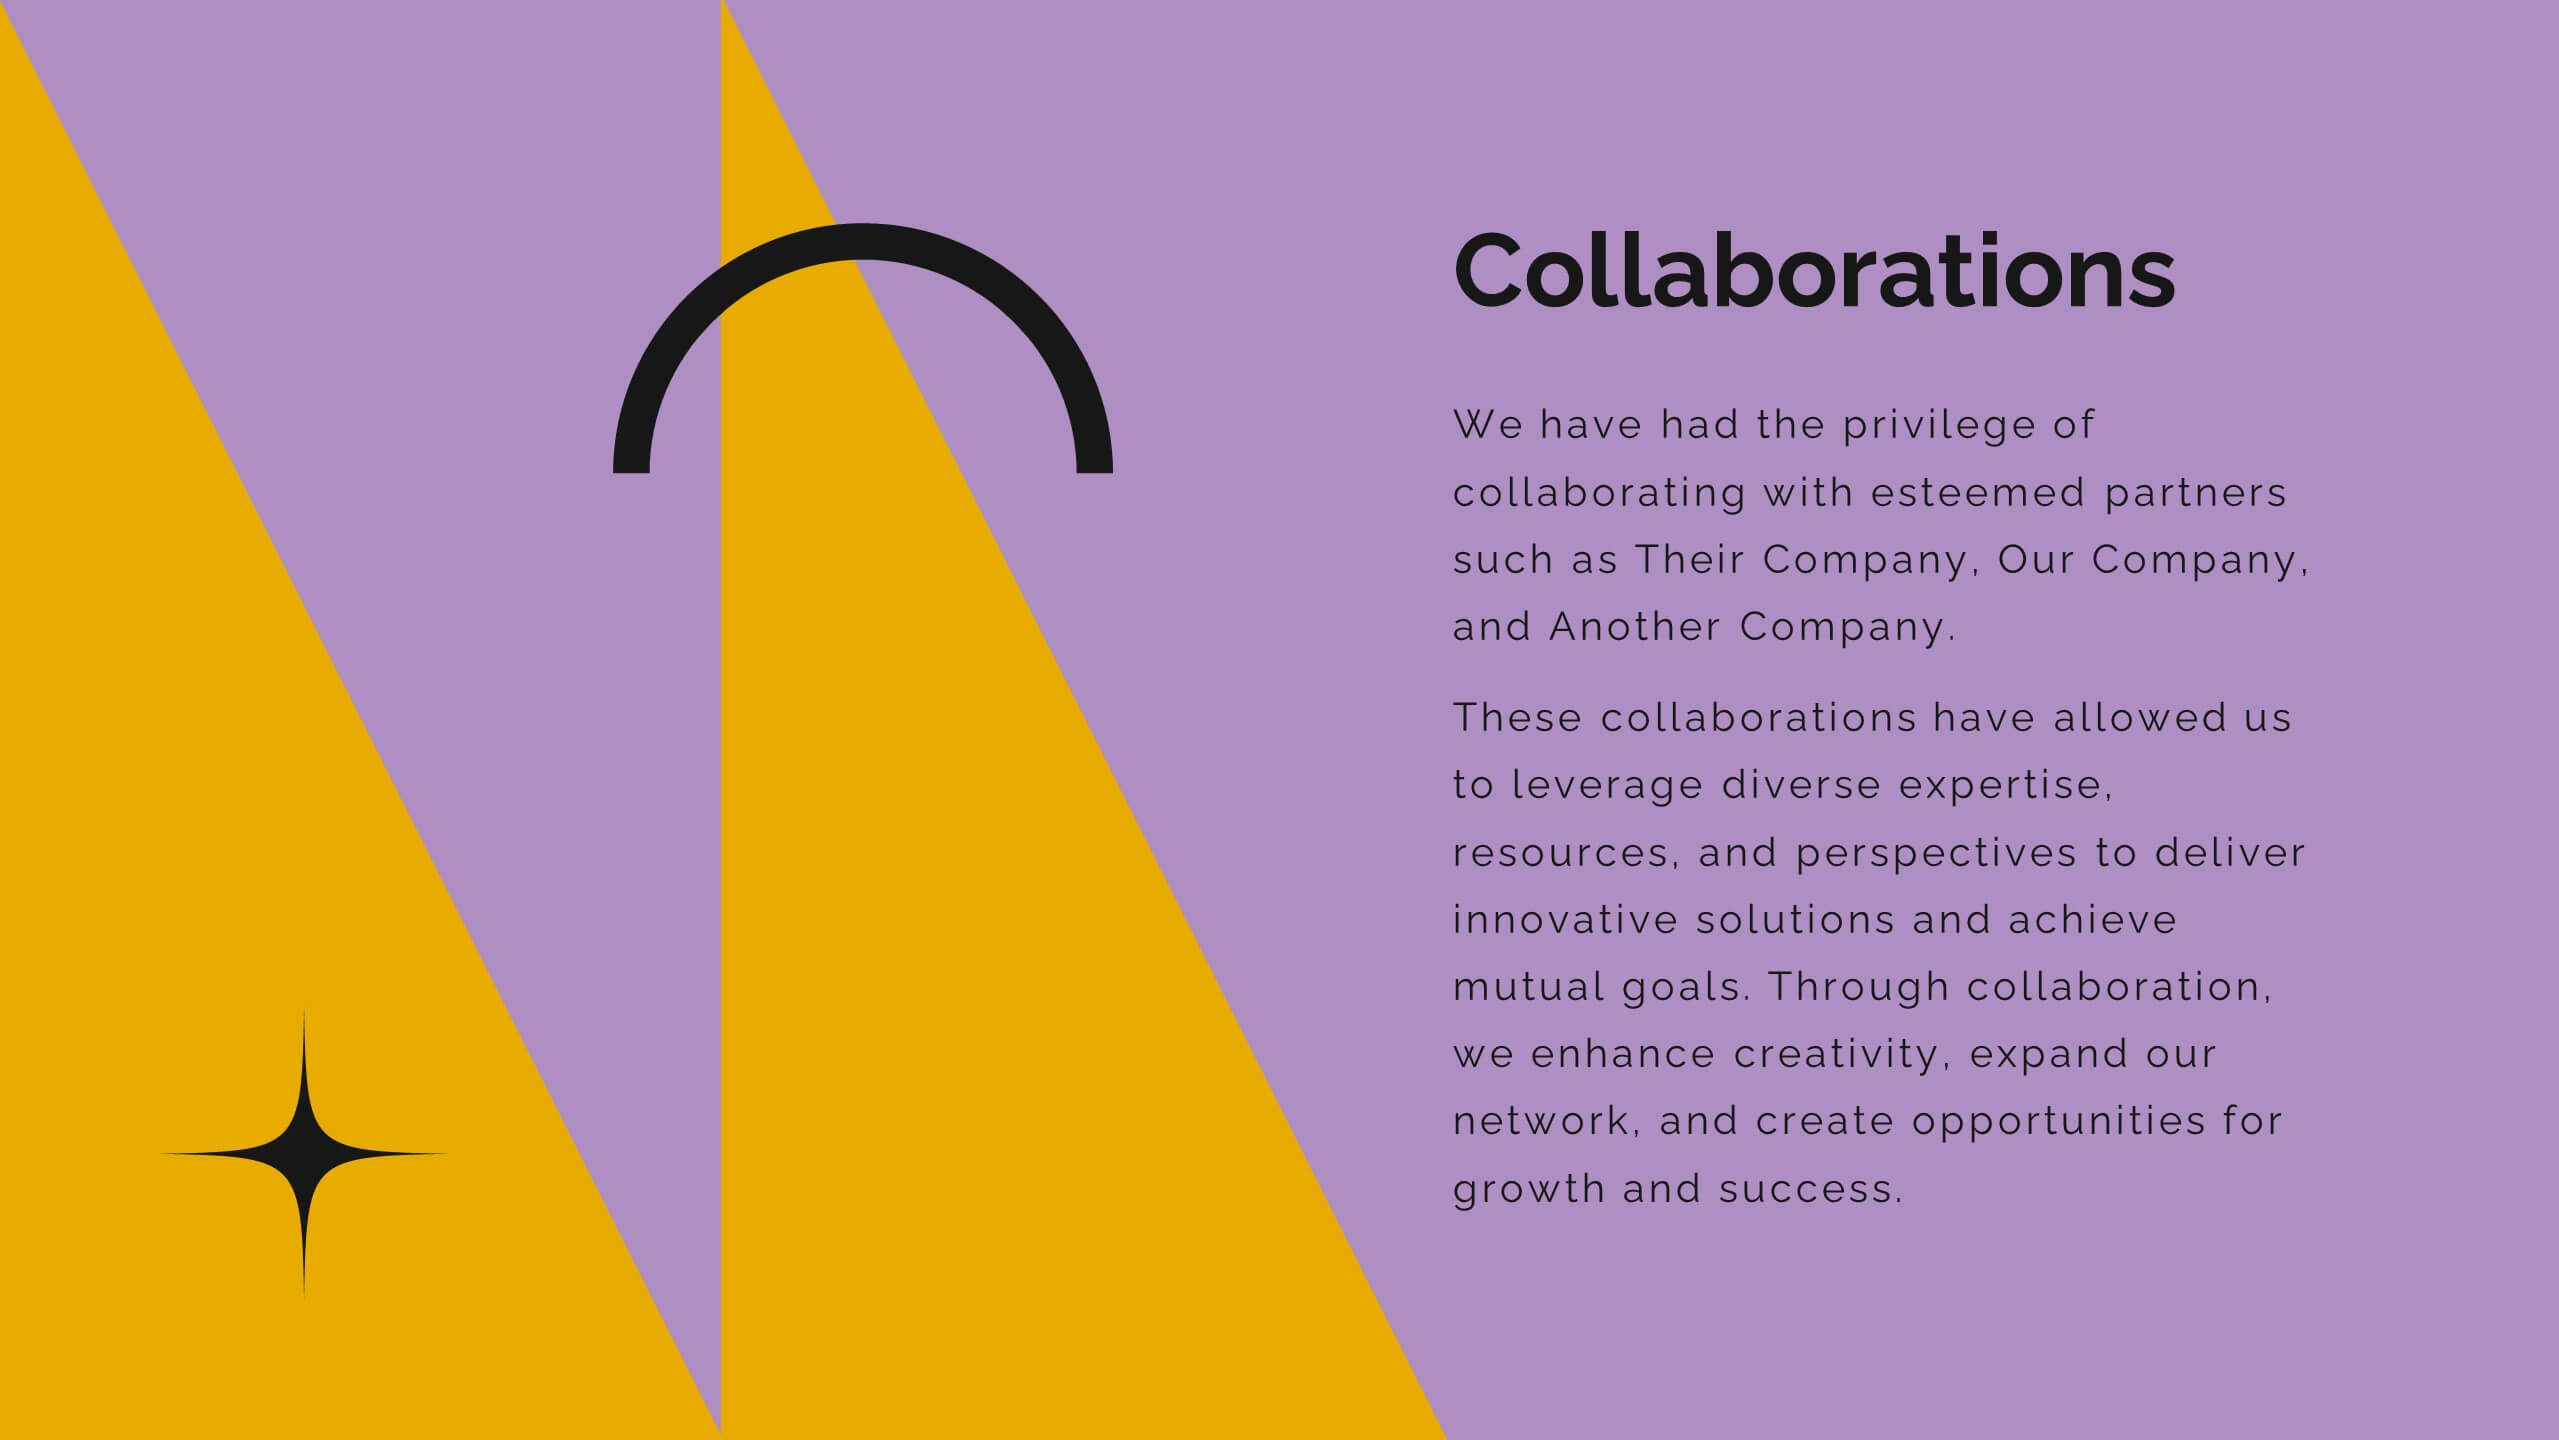
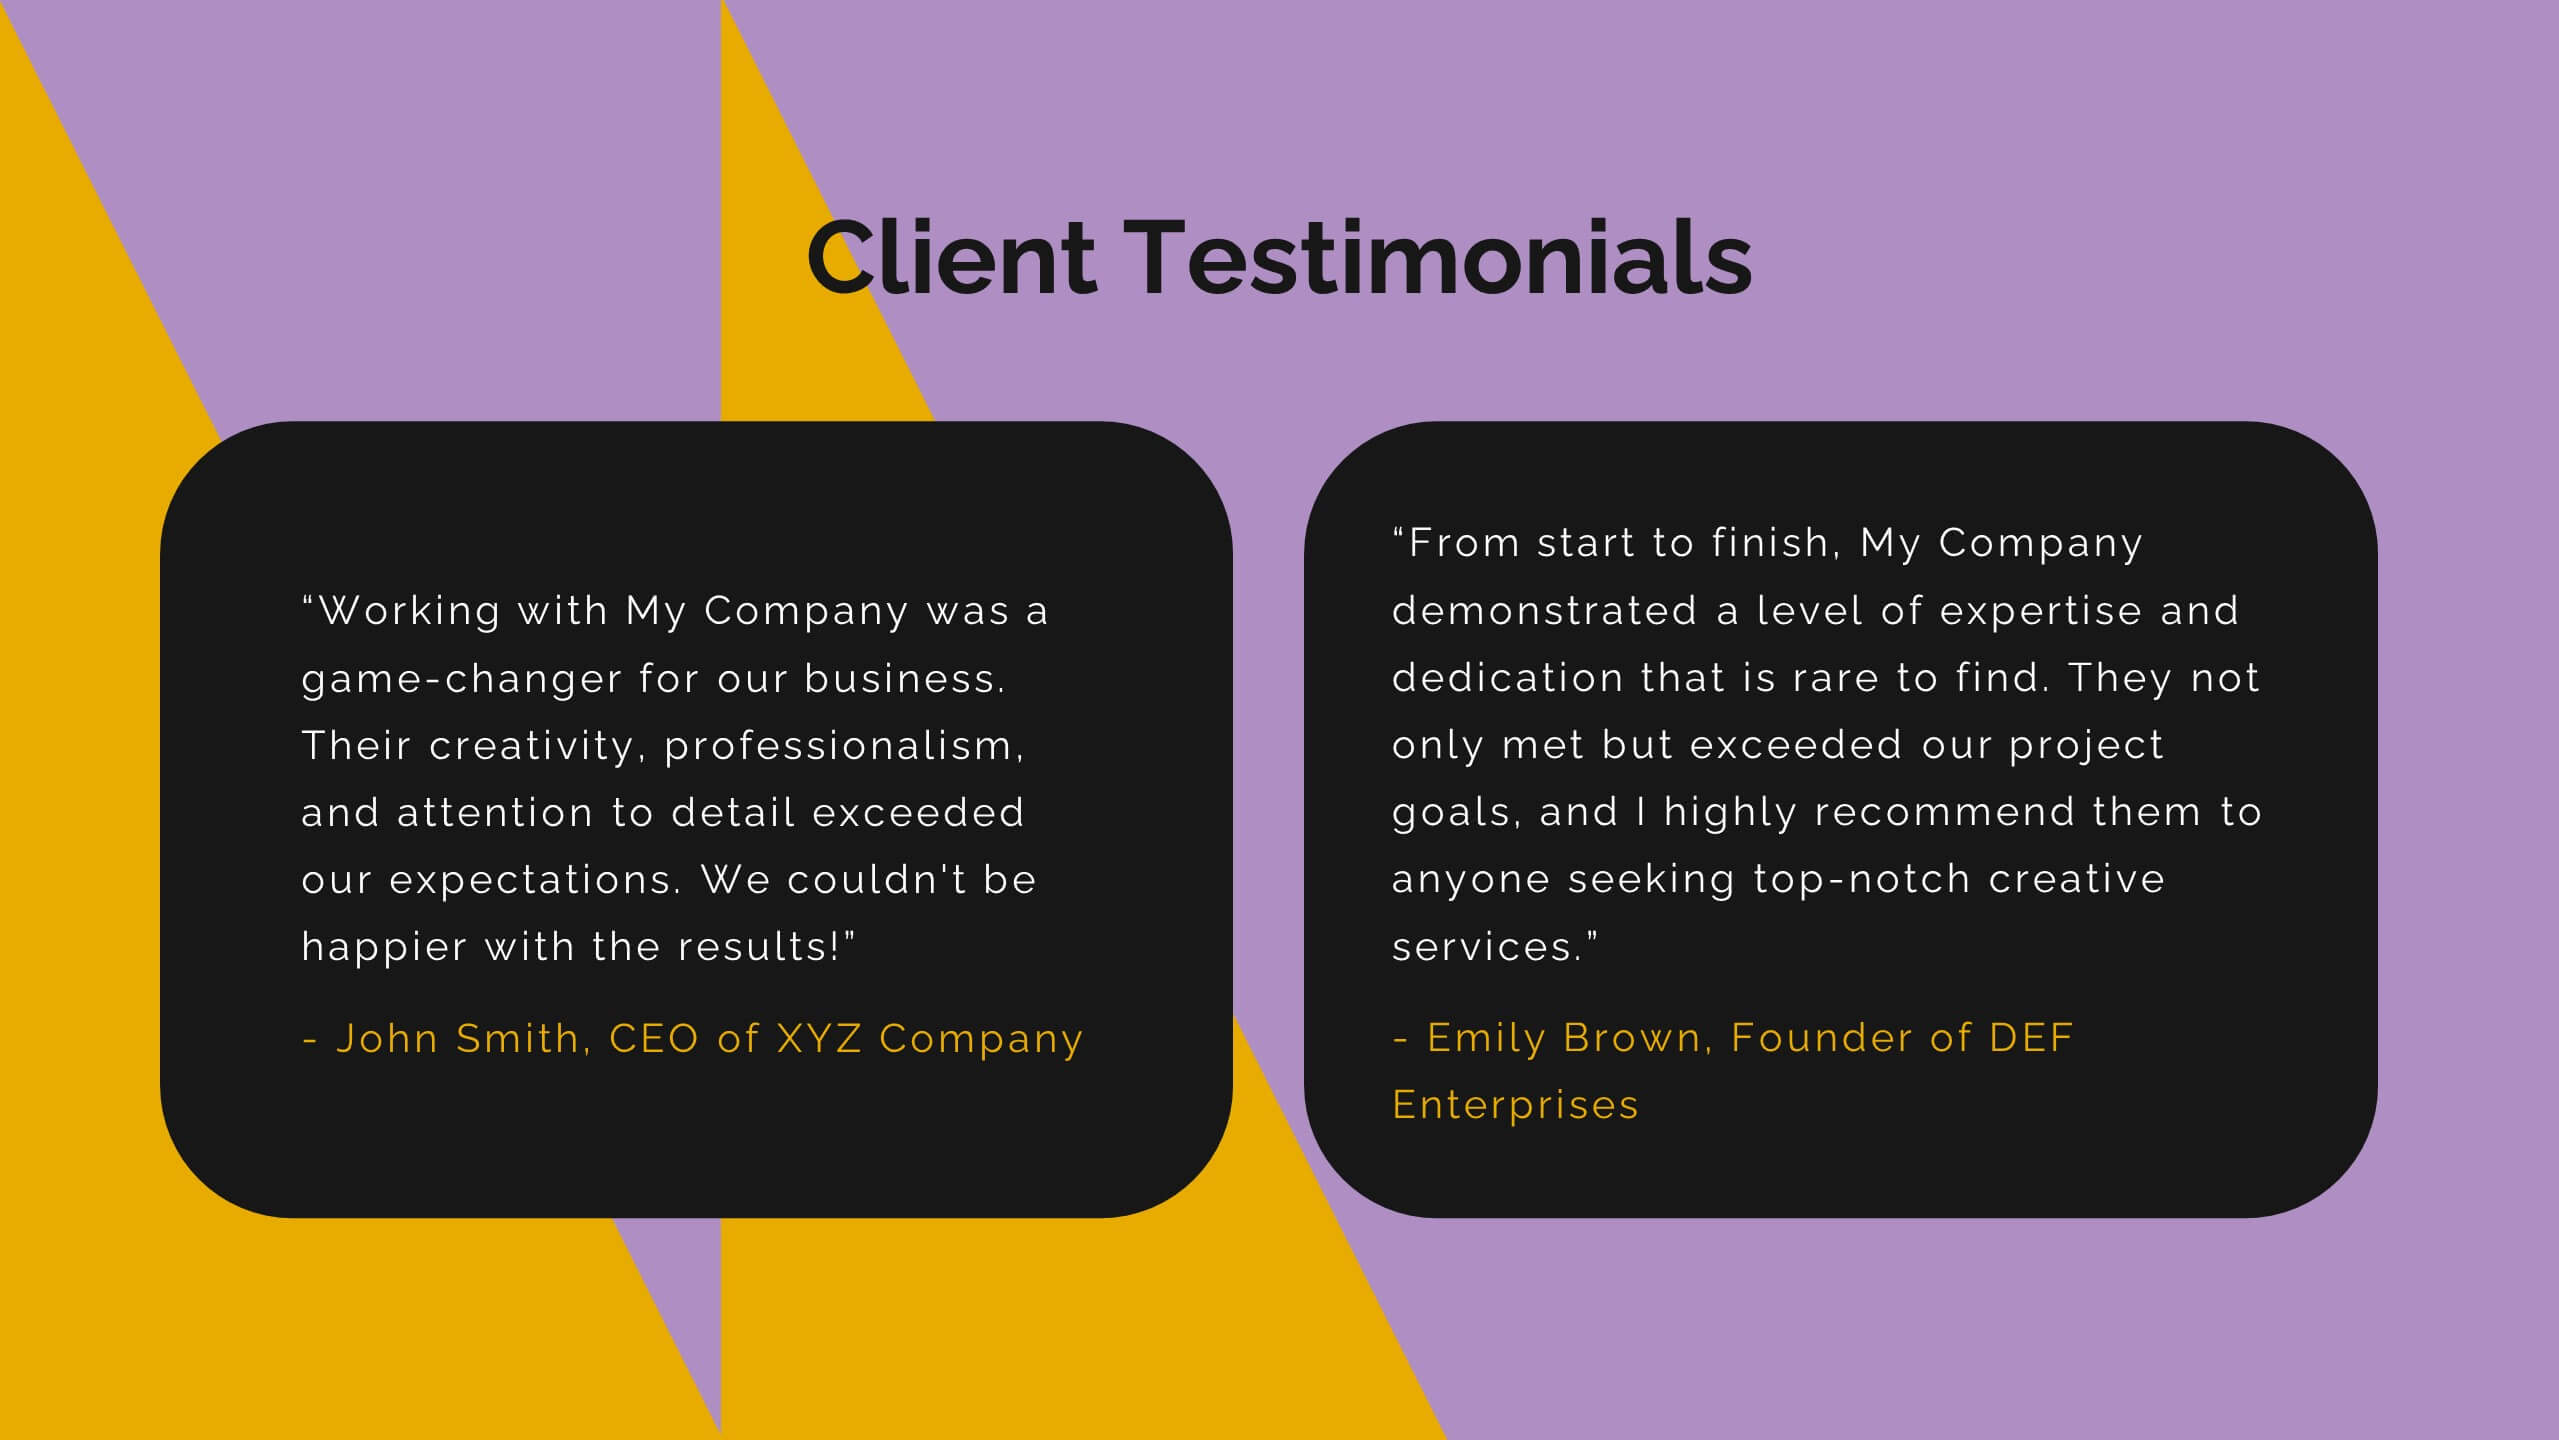
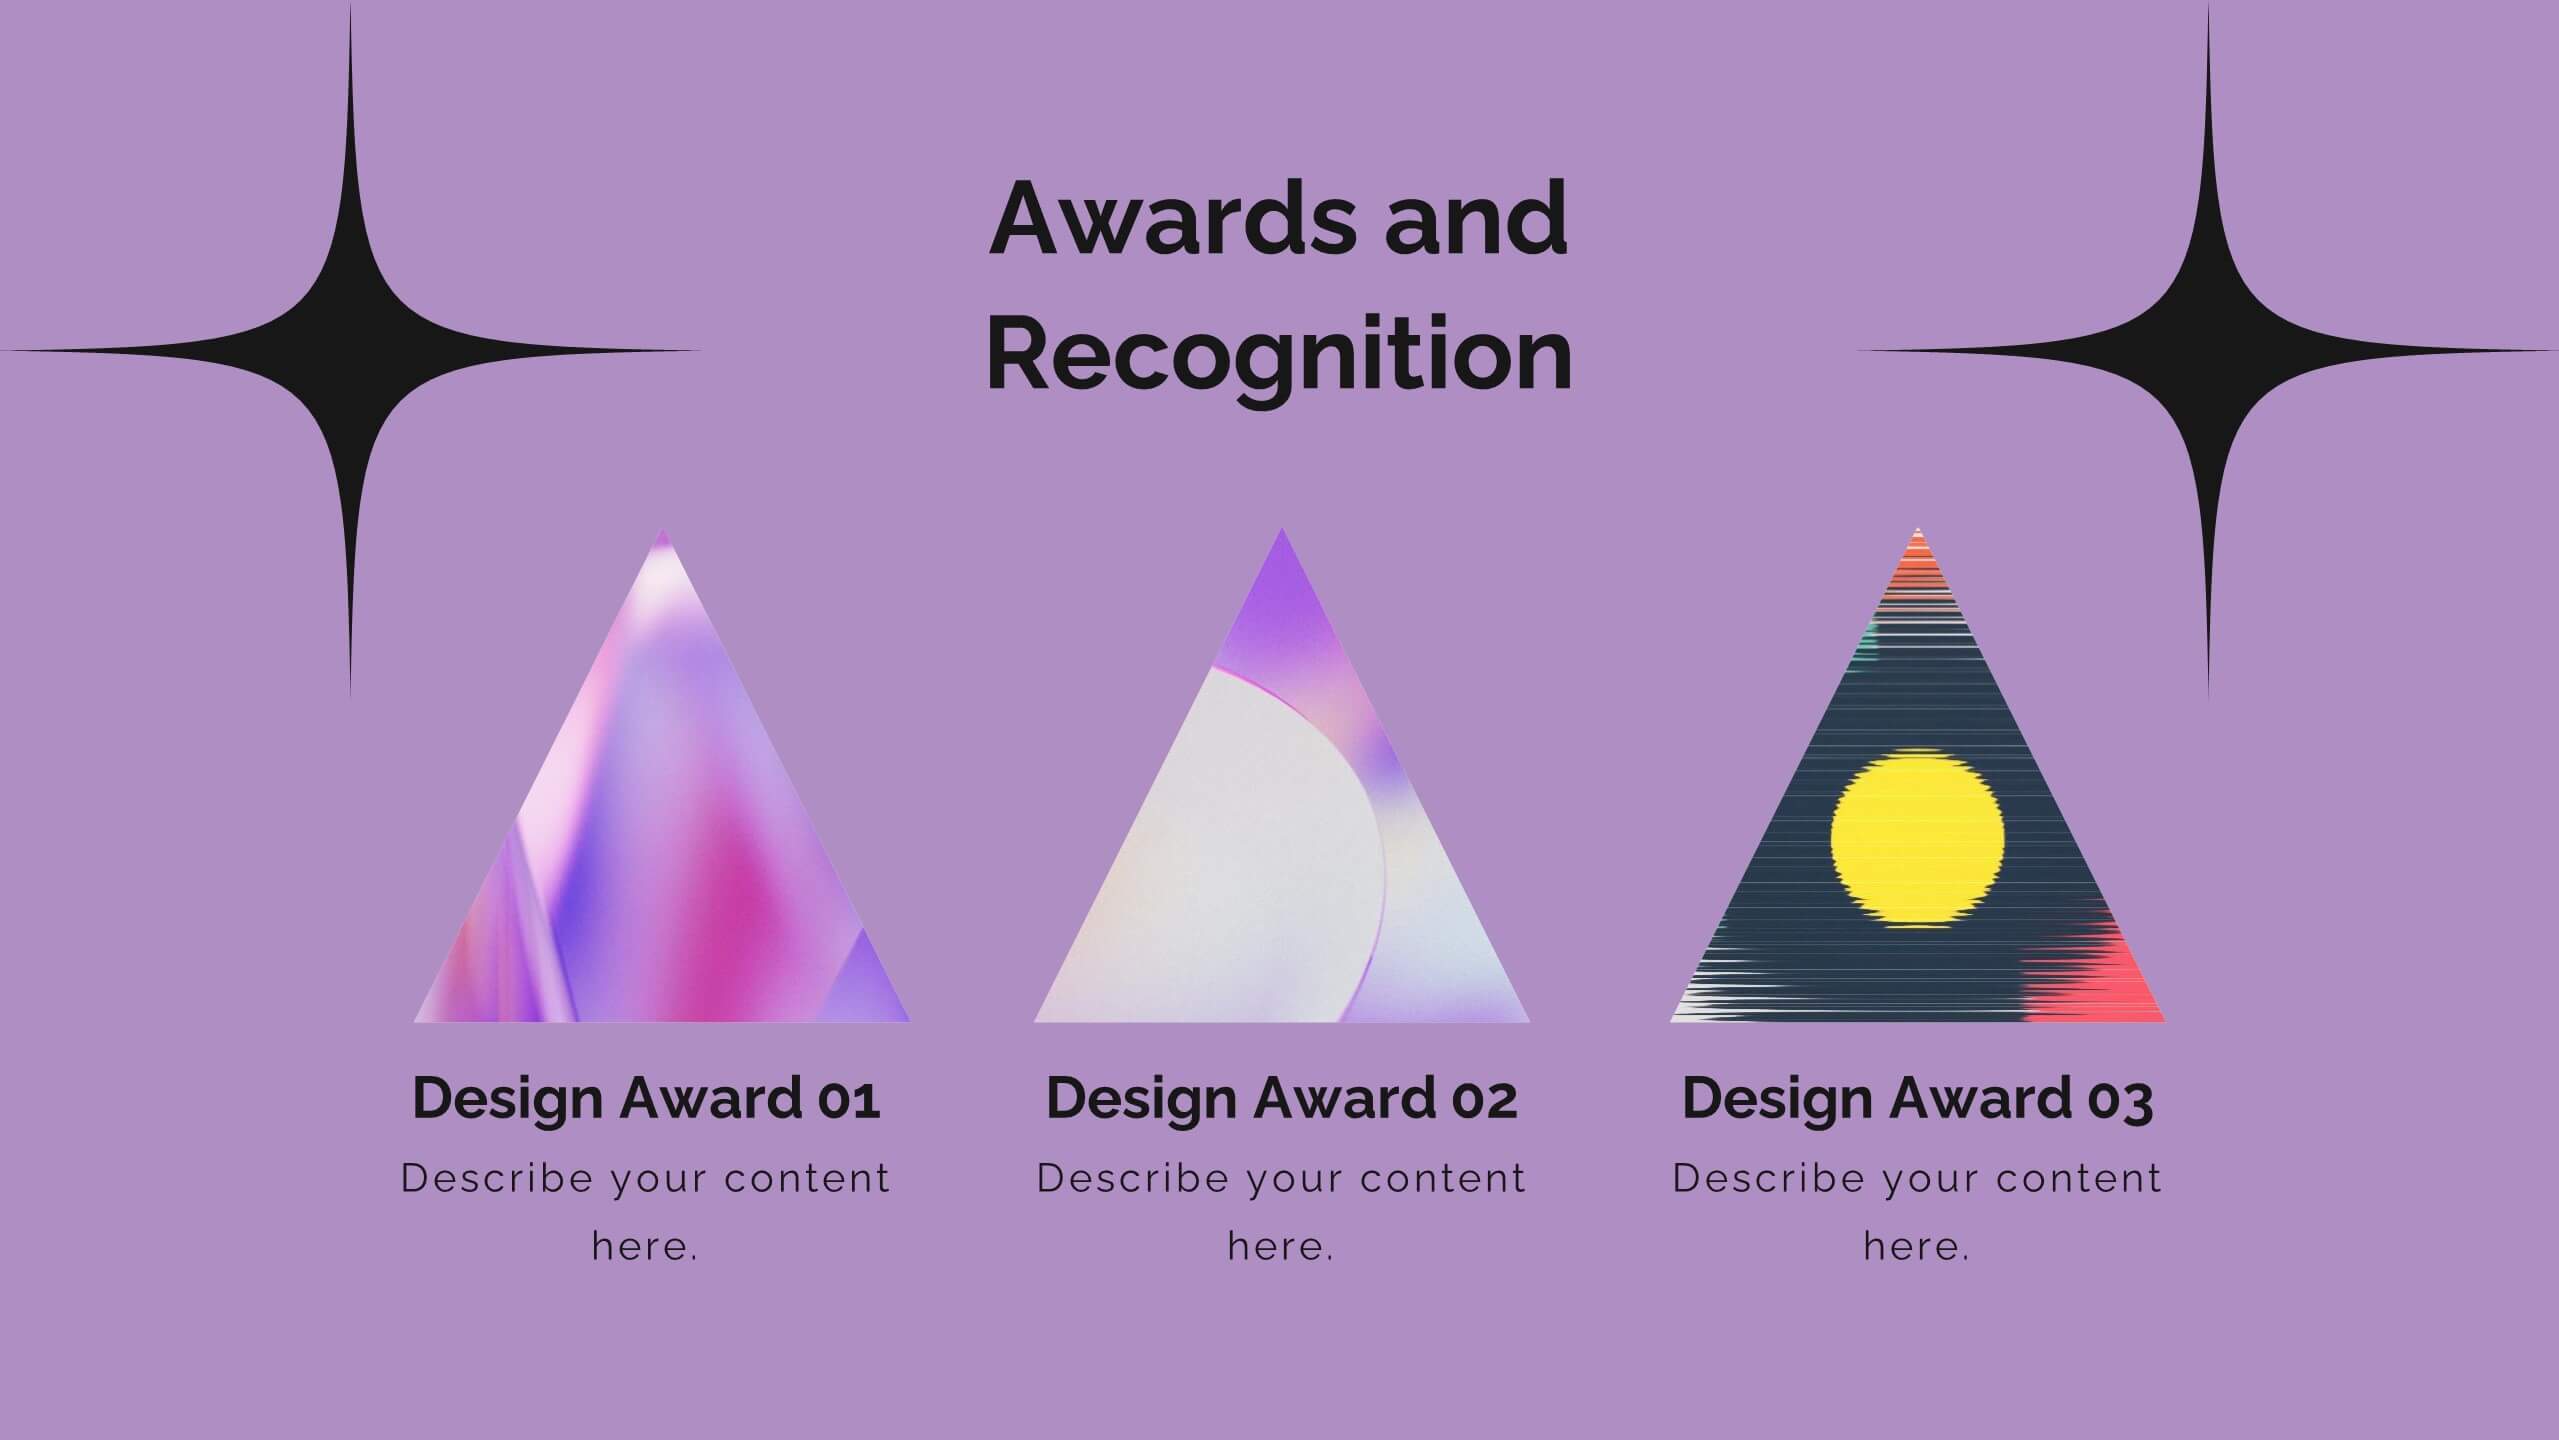
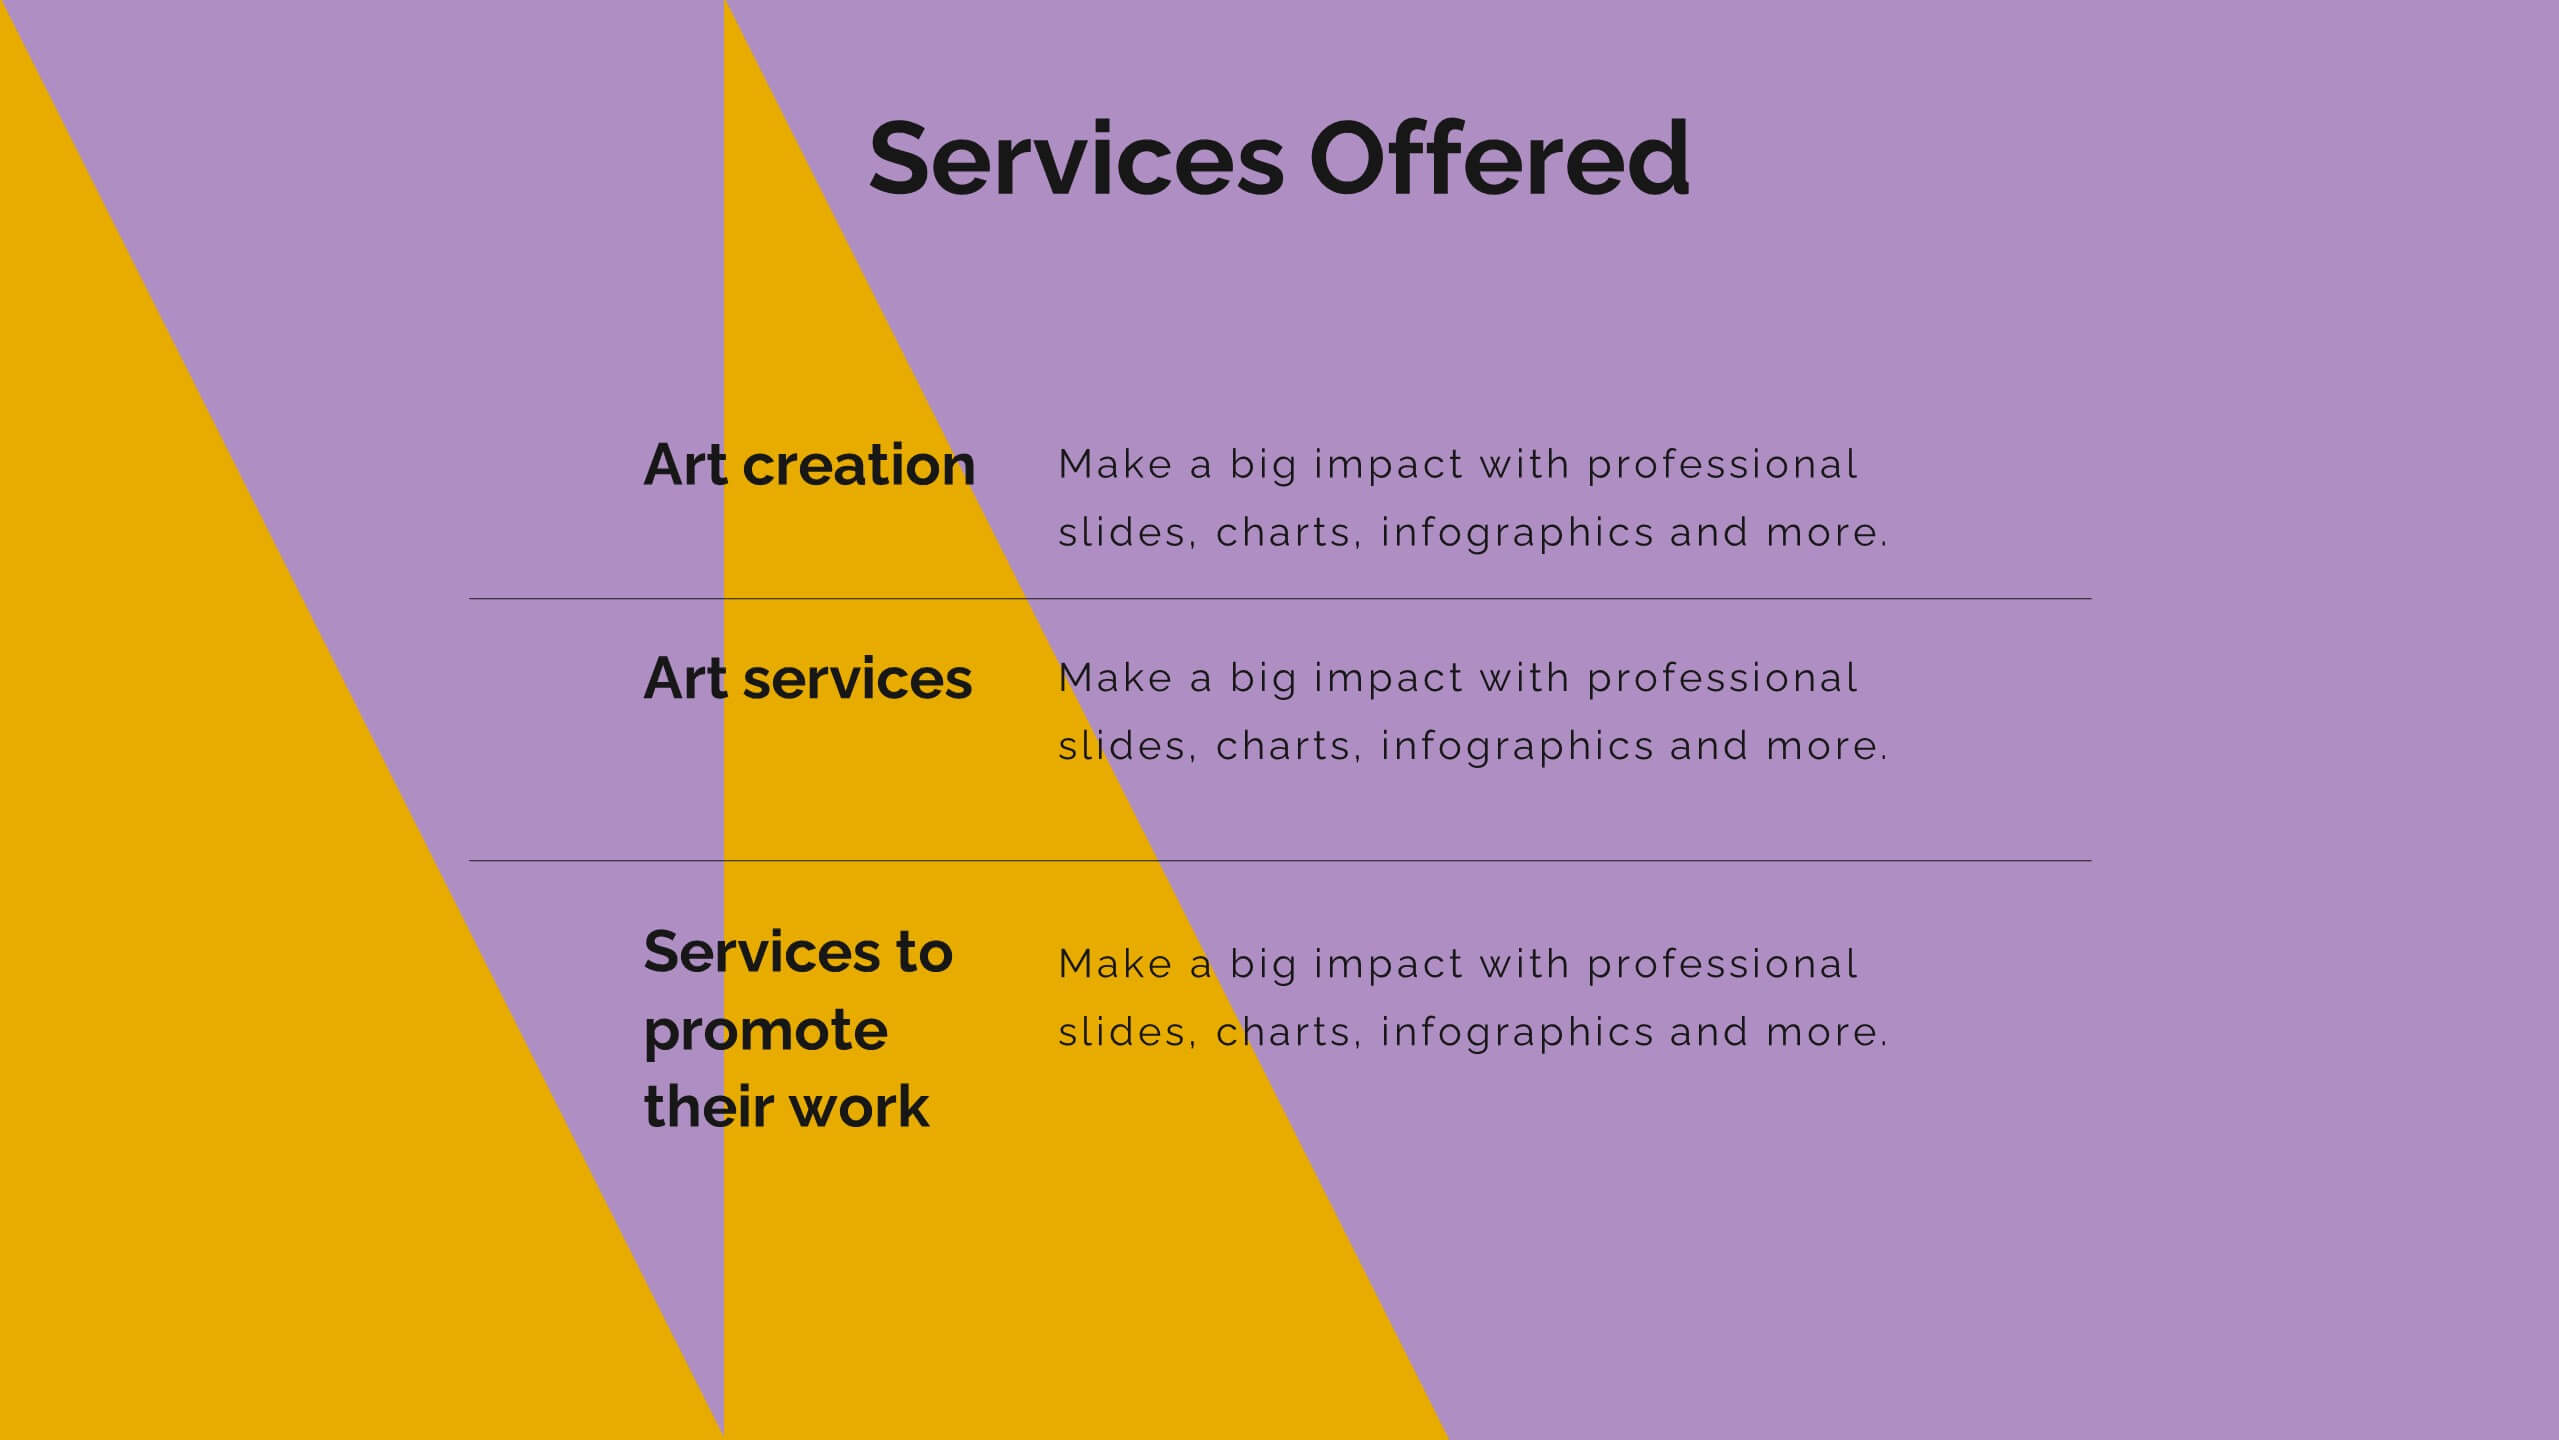
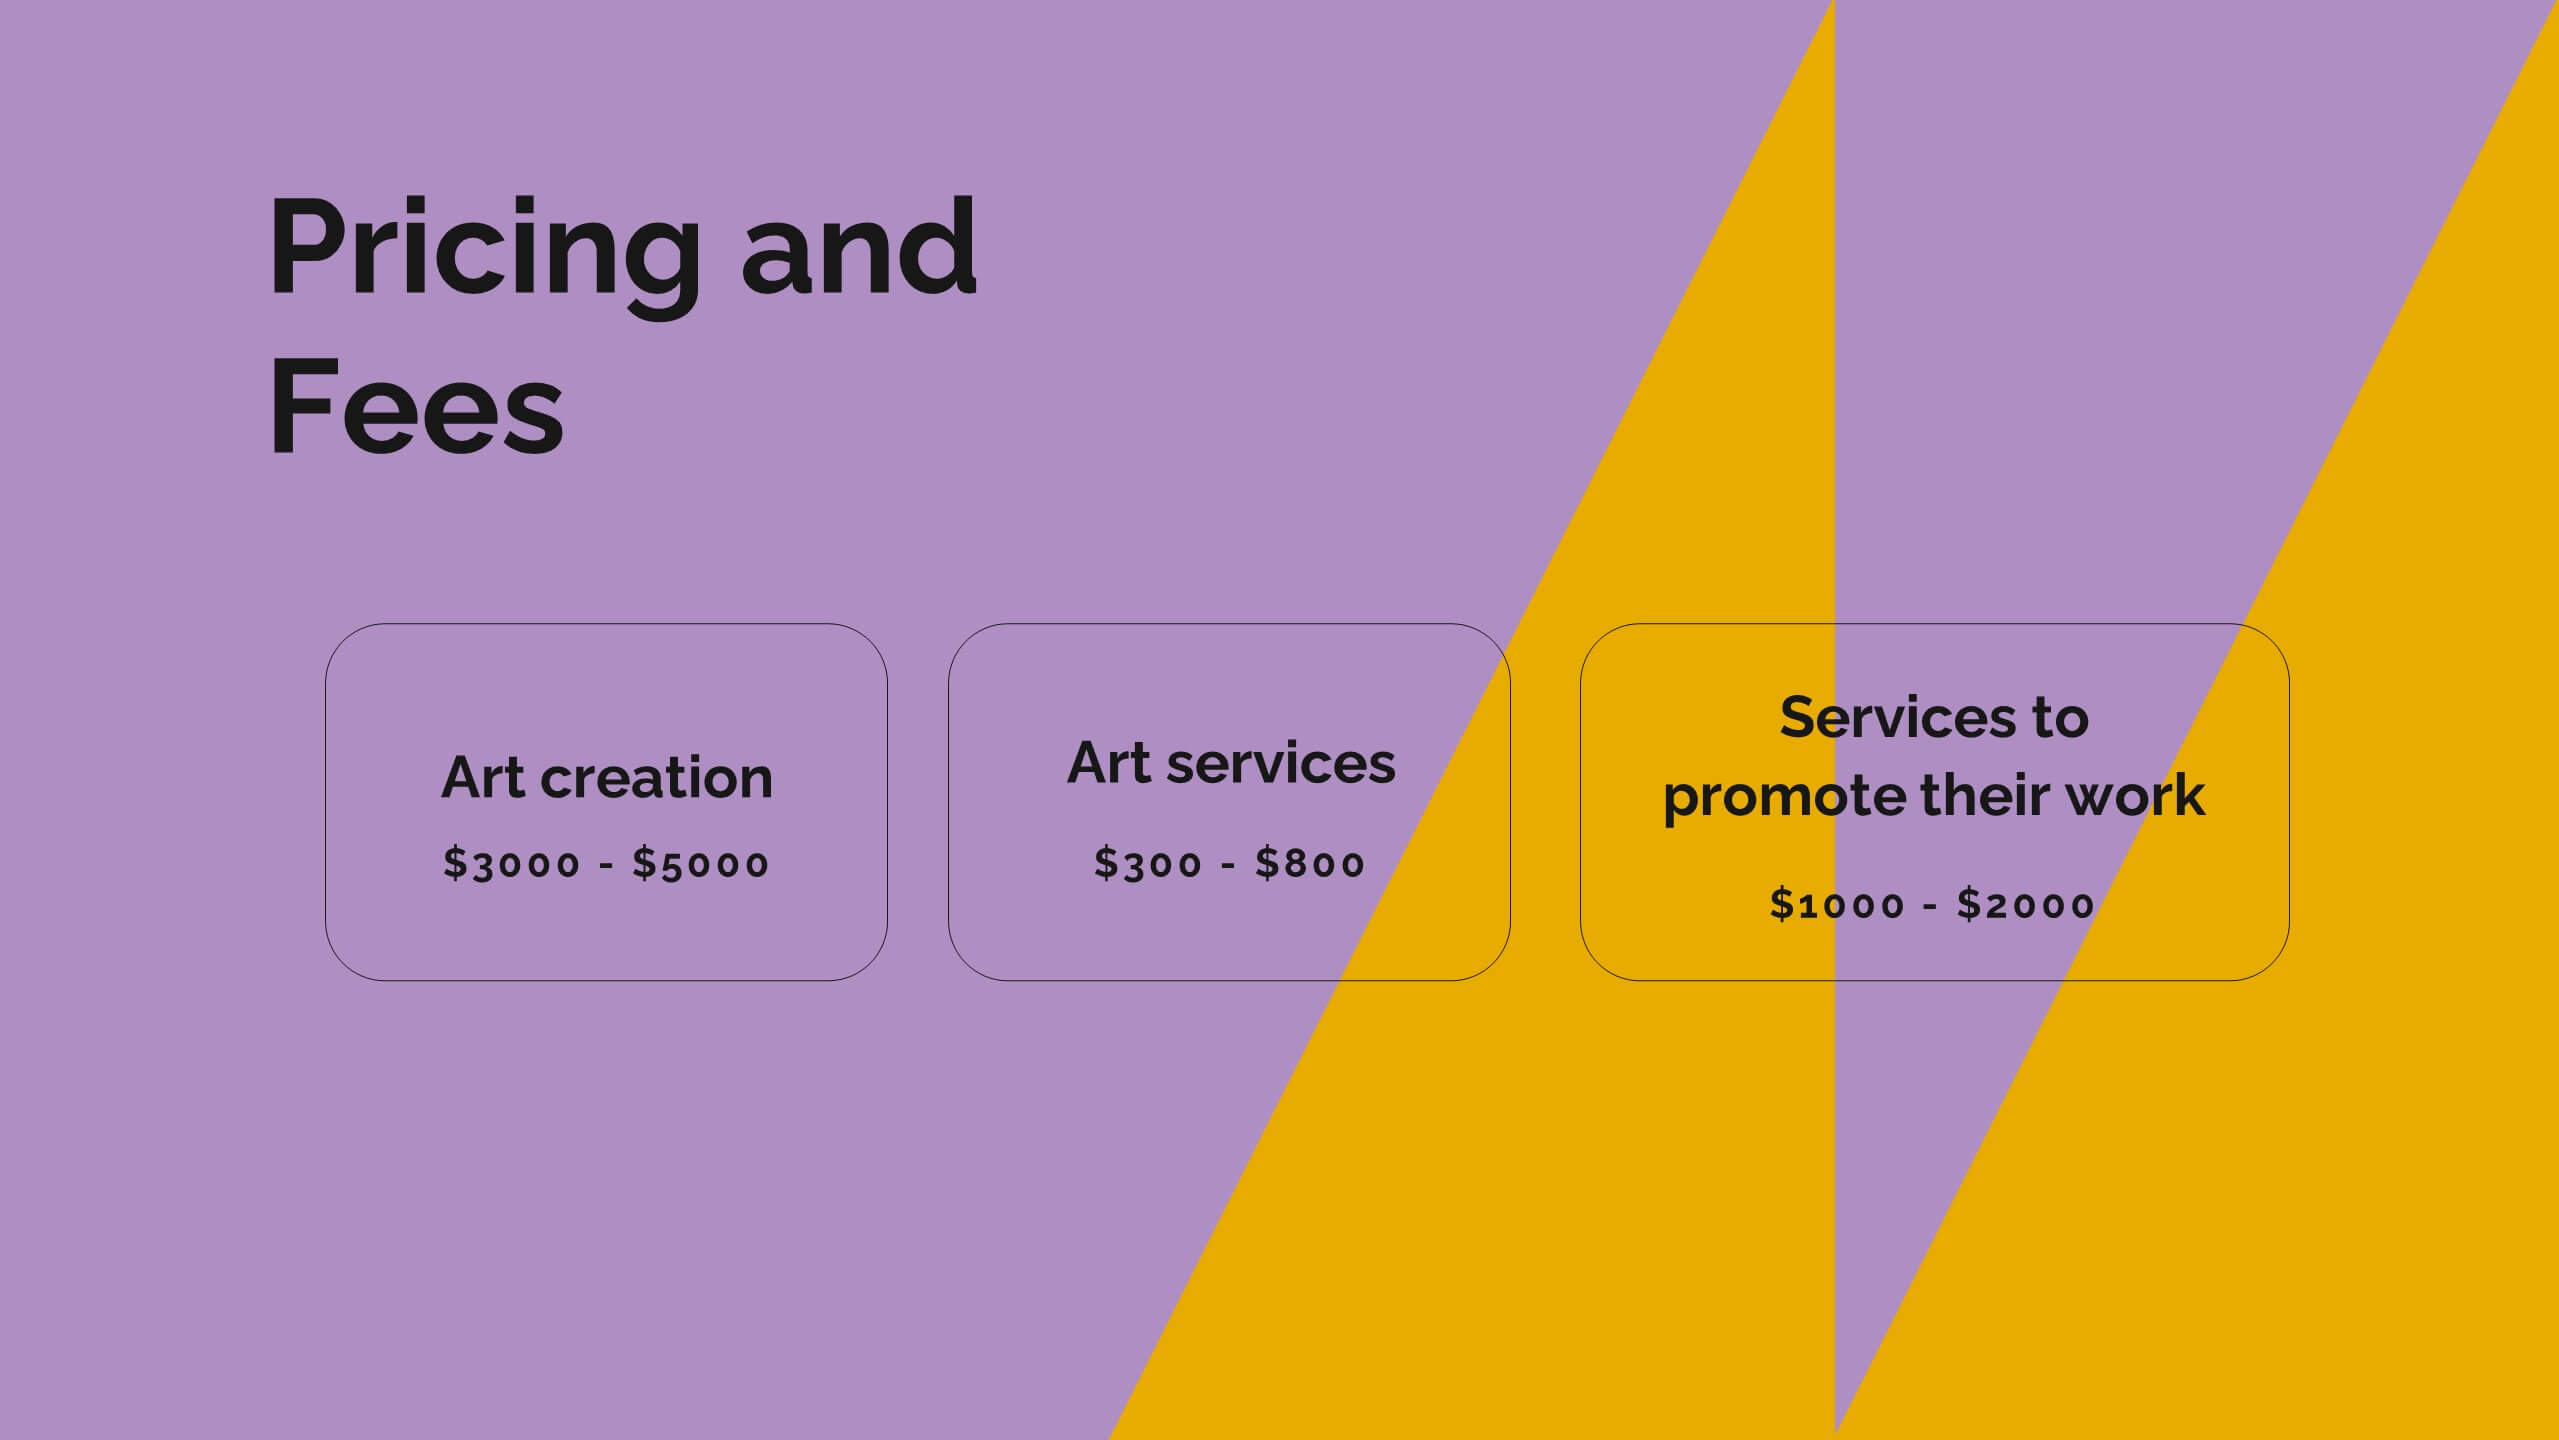
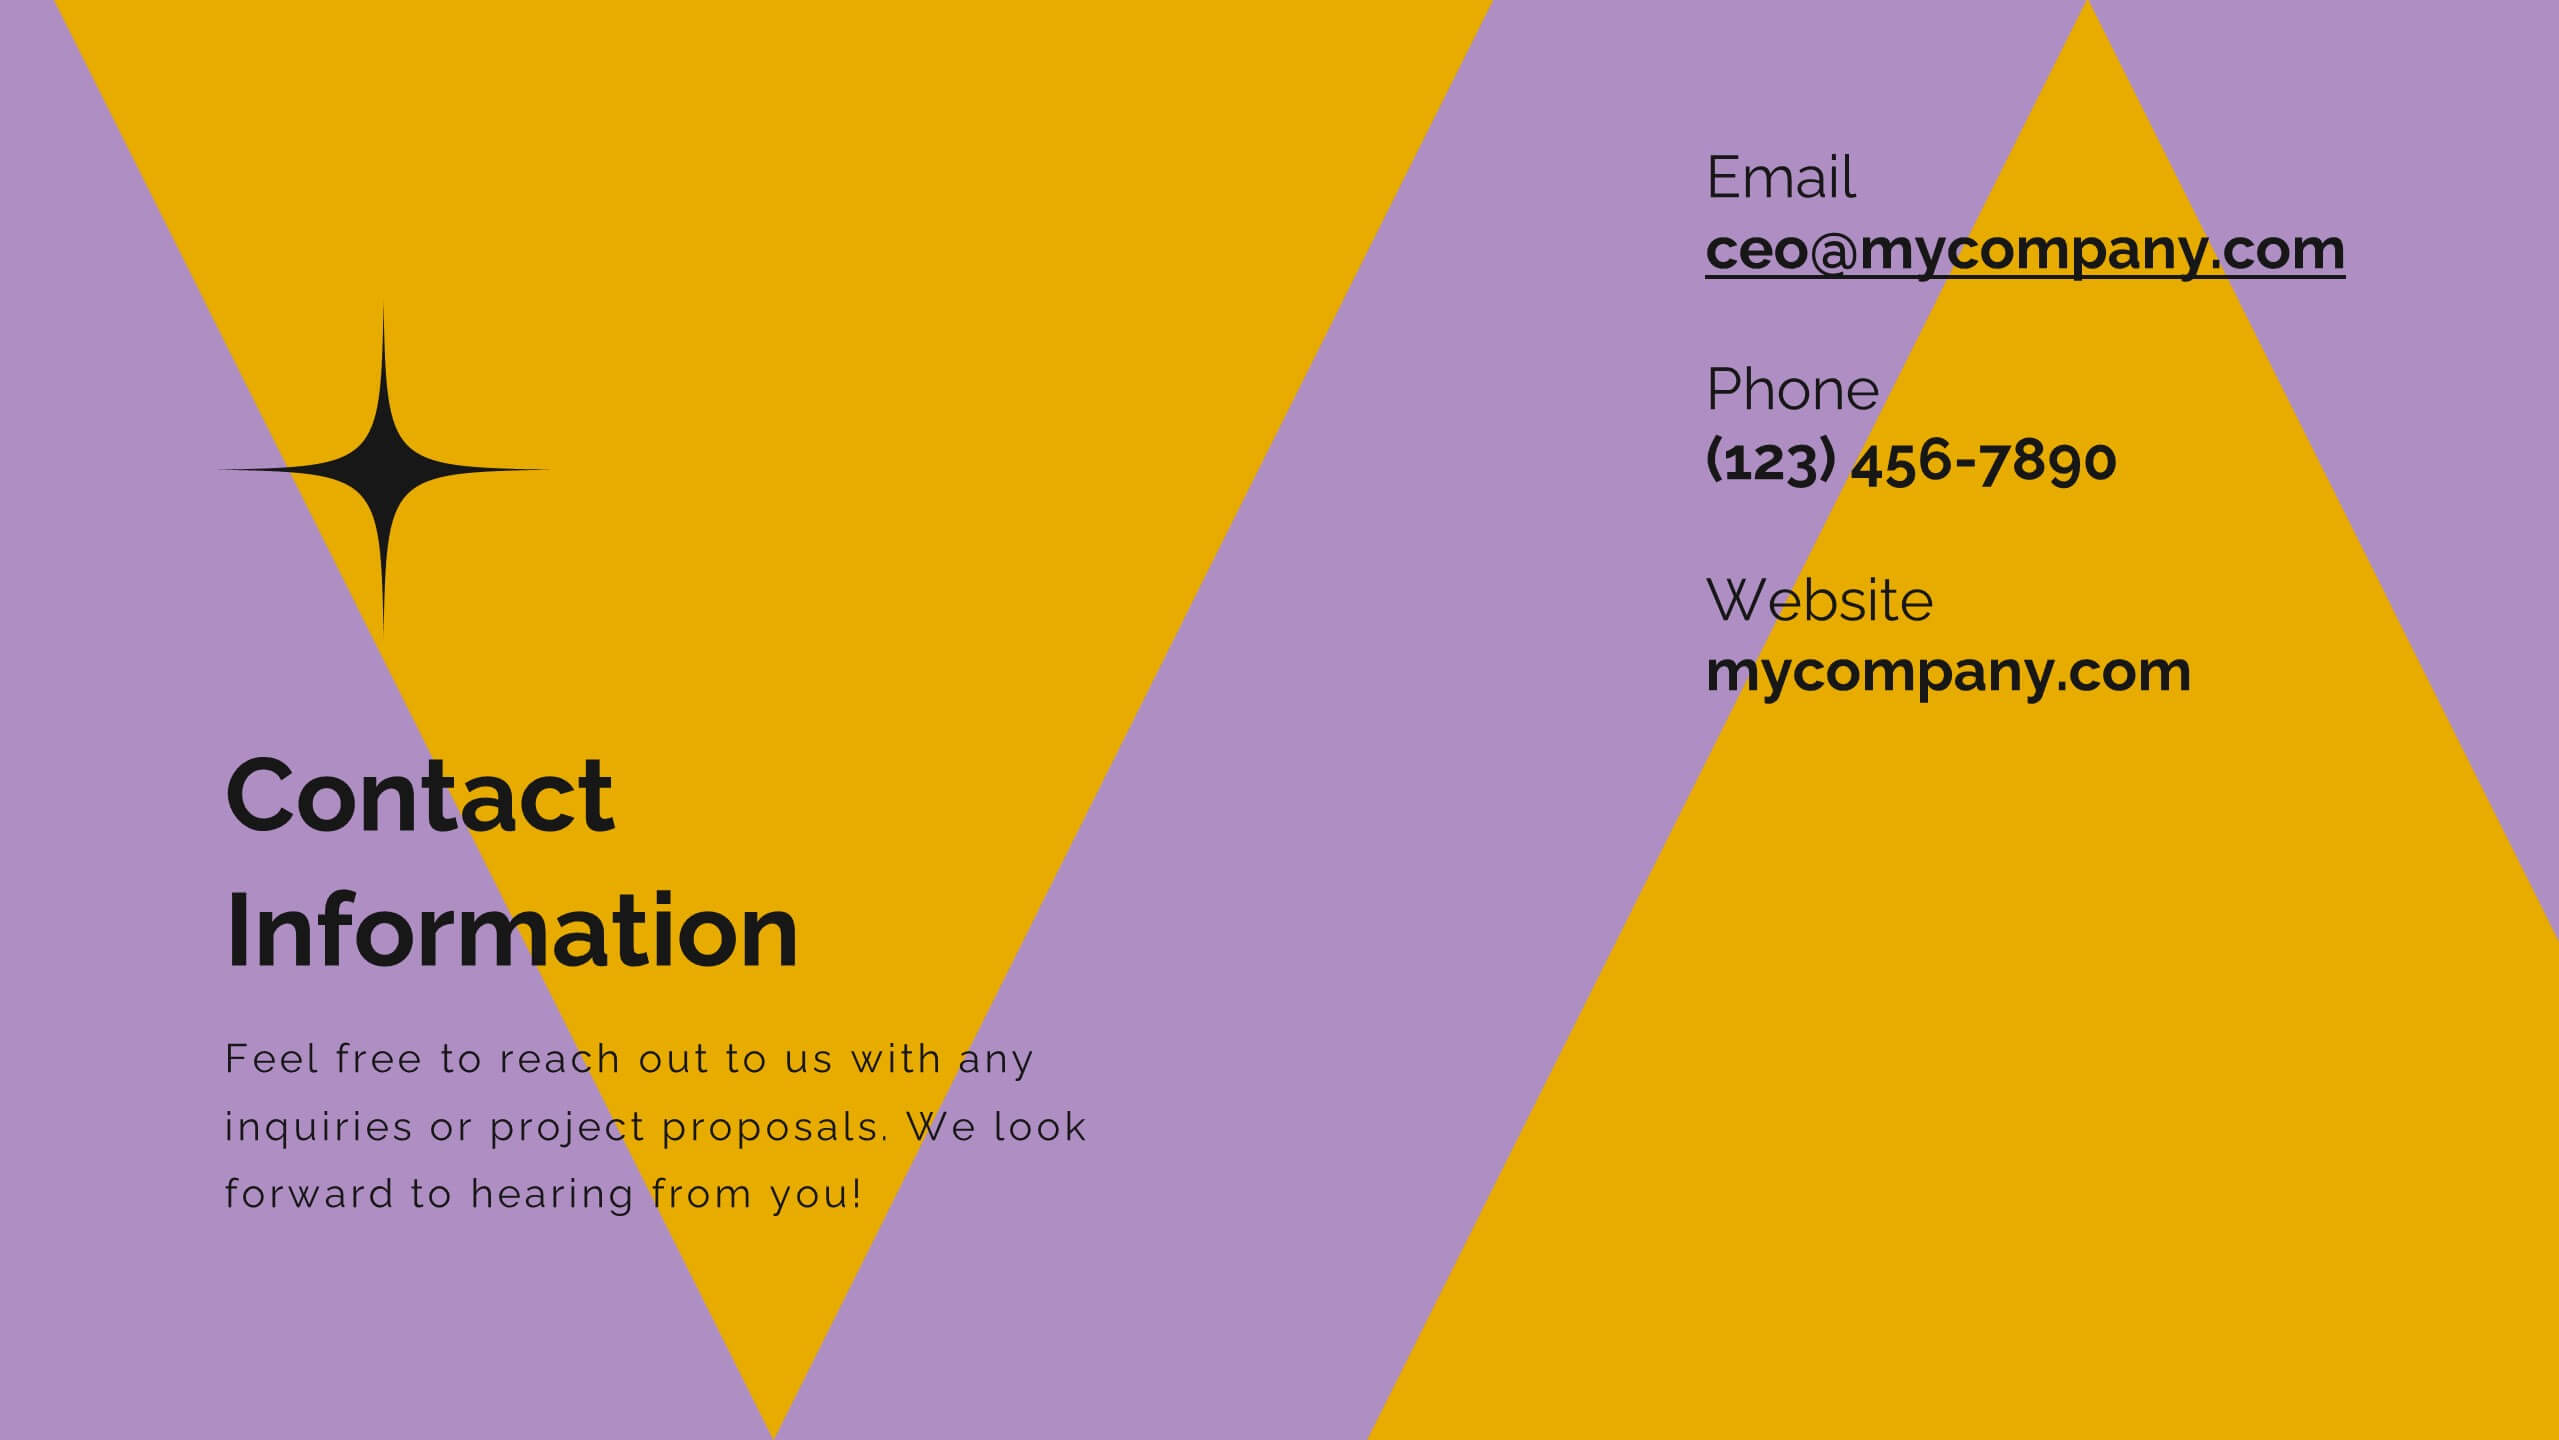
Vortex Artist Portfolio Template Presentation
Showcase your artistic brilliance with this eye-catching portfolio presentation template! Perfect for highlighting your projects, creative process, and awards, it features vibrant slides for your philosophy, collaborations, and client testimonials. Impress potential clients and collaborators with a stunning, well-organized portfolio. Compatible with PowerPoint, Keynote, and Google Slides for seamless presentations on any platform.


6 slides
Ideas Connection Venn Presentation Design
Present interconnected ideas with creativity and impact using the Ideas Connection Venn Presentation Design. This colorful, lightbulb-themed 5-section layout helps you visualize related concepts or stages, ideal for brainstorming, innovation mapping, or content planning. Each segment includes icons, titles, and descriptions to showcase your thoughts clearly. Fully customizable in PowerPoint, Keynote, and Google Slides.


12 slides
Cloud-Based Digital Transformation Presentation
Illustrate your path to digital evolution with this multi-cloud infographic layout. Perfect for visualizing service integrations, SaaS environments, or migration strategies, this slide highlights five key areas of transformation using cloud-shaped icons and a central connectivity hub. Fully customizable in PowerPoint, Keynote, and Google Slides.


26 slides
Katlina Presentation Template
Everyone wants to be on top of their SEO game. This Katlina presentation template provides a way for you to teach your audience about the importance of Search Engine Optimization. Start creating your own slides with this template. With fun graphics that will also make the information more interesting and easy to understand charts and timelines.This presentation will help your audience see how they can increase their sites visibility in search results. It can also be use for your presentations at work or in class due to it's customizability. Get started today makeing an impact in your industry.


7 slides
Creative Thinking and Disruption Model
Visualize your strategy for breakthrough ideas with the Creative Thinking and Disruption Model Presentation. Featuring a bold head silhouette layout, this slide highlights six key elements of innovative thinking—perfect for workshops, leadership discussions, or startup pitches. Fully customizable in PowerPoint, Keynote, and Google Slides.


21 slides
Polaris Startup Strategy Presentation
Set your startup on a path to success with this bold and dynamic strategy presentation template. Featuring key sections like mission and vision, market analysis, business model, and growth plans, it’s perfect for entrepreneurs and teams. Fully compatible with PowerPoint, Keynote, and Google Slides for a seamless presentation experience.


10 slides
Conceptual Mind Map for Projects
Illuminate your strategy with the Conceptual Mind Map for Projects Presentation. Designed in the shape of a lightbulb, this diagram visually connects five key project concepts to a central idea, perfect for presenting innovation, team workflows, or business planning. Easily editable in PowerPoint, Keynote, or Google Slides to suit any industry or audience.


6 slides
Modern Agriculture Industry Trends
Highlight key data and insights with this visually engaging agriculture-themed slide. Designed with circular data visuals and crop illustrations, it's perfect for showcasing percentages, trends, or growth stats in modern farming, agri-tech, and sustainability initiatives. Fully editable in PowerPoint, Keynote, and Google Slides.


6 slides
Business Growth Metrics Butterfly Chart
Highlight performance patterns and opportunities with the Business Growth Metrics Butterfly Chart Presentation. This engaging layout uses mirrored radial segments to present six growth indicators—ideal for tracking progress across two categories, departments, or timeframes. The butterfly-shaped curves draw the viewer’s attention to the center, making comparisons intuitive and visually balanced. Fully customizable in PowerPoint, Keynote, and Google Slides, this template is perfect for showcasing KPI trends, sales metrics, or marketing performance.


7 slides
Secondary Education Infographic
Secondary education, also known as high school education, plays a crucial role in a person's academic and personal development. This template is a useful tool for demonstrating the power of secondary education, as well as educational marketing strategies that offer students a range of tools to help them achieve success. This is ideal for infographics about career goals, student professional development, digital learning and more. Compatible with Powerpoint, keynote and google slides, you can create a powerful and engaging learning experience by presenting your data in a visually appealing way.


7 slides
Geometric Infographic Presentation Template
Our Geometric Infographic template will help you quickly create an original, beautiful and professional presentation with charts and diagrams of any kind. The template includes fully editable slides with a number of built-in shapes, as well as transitions. You can use the template for any kind of presentation involving geometrics. It’s ideal for product presentations and market analysis, but you can also use it to showcase your business case. This geometric Infographic template is a great way to present a large amount of information to an audience and features a clean and modern design!


26 slides
Dayne Presentation Template
This beautiful and professional Wedding Cake Template Dayne is the perfect template to boost your business with impressive wedding cake portfolio. Dayne is a great template for showing off bakers, who are sharing about wedding cakes. It also can be used for other themes, as well as personal or business. The color scheme works well with this theme. Pictures and charts are also made for easy editing as well as easy readability. The design is clean and professional looking, so clients feel comfortable and excited about their upcoming events or products. Look no further this is the one for you!


6 slides
Business Cloud Transformation Strategy Presentation
Streamline your cloud transition with this Business Cloud Transformation Strategy template. Perfect for IT leaders, cloud architects, and business executives, this slide provides a visual roadmap for migrating, integrating, and optimizing cloud solutions. With a modern, data-driven layout, it highlights key transformation phases, challenges, and benefits. Fully customizable and compatible with PowerPoint, Keynote, and Google Slides for professional presentations.


4 slides
Vision Statement Slide Presentation
Spark inspiration from the very first slide with a clean, modern layout designed to express future goals with clarity and confidence. This presentation helps teams communicate direction, long-term aspirations, and strategic focus in a simple, structured format. Fully compatible with PowerPoint, Keynote, and Google Slides.


4 slides
Key Pillar Infographic Slide Presentation
Make your ideas stand tall with this modern pillar-themed infographic layout. Perfect for illustrating strategies, business foundations, or organizational principles, it transforms complex data into visually clear, structured visuals. Fully editable and compatible with PowerPoint, Keynote, and Google Slides for professional and easy-to-customize presentations.


5 slides
End-to-End Process Flow Framework Presentation
Visualize your operations from start to finish with the End-to-End Process Flow Framework Presentation. This clean, arrow-based layout is perfect for outlining workflows, project stages, or business processes step by step. Fully customizable in Canva, PowerPoint, and Google Slides to suit any team or strategic need.