Structured Table of Content for Reports Presentation
PowerPoint Template and Google Slides Theme


Features
- 8 Unique Slides
- Fully editable and easy to edit in Microsoft Powerpoint, Keynote and Google Slides
- 16:9 widescreen layout
- Clean and professional designs
- Export to JPG, PDF or send by email
- Remove from favorites
Powerpoint Template
1 MB
Google Slides Template
External link
Keynote Template
2 MB
Recommend
- Remove from favorites
Powerpoint Template
1 MB
Google Slides Template
External link
Keynote Template
1 MB
6 slides
Business Decision Venn Diagram Presentation
Make complex decision-making simple and visually impactful with this Business Decision Venn Diagram Presentation. Featuring a bold triangular layout with six segmented areas, this slide is ideal for presenting overlapping factors, interconnected strategies, or priority zones. Perfect for business planning, competitive analysis, or project evaluation. Fully editable in PowerPoint, Keynote, and Google Slides for seamless integration into your presentations.
- Remove from favorites
Powerpoint Template
1 MB
Google Slides Template
External link
Keynote Template
1 MB
5 slides
Division List Infographics
A Division List is a list of items or numbers that have been divided or categorized based on a certain criterion or set of criteria. These Infographics are visual representation of data that allows you to divide and categorize information into smaller groups or categories. These can be used to display any kind of data that requires grouping, such as military ranks, airlines, religion or virus symptoms. This template is designed using bold colors, various shapes, and icons to make the data more engaging and visually appealing. These are perfect for business presentations, marketing campaigns, and educational materials.
- Remove from favorites
Powerpoint Template
1 MB
Google Slides Template
External link
Keynote Template
1 MB
6 slides
Corporate Performance Annual Report
Present key business metrics with precision using this Corporate Performance Annual Report slide. Designed with progress bars and intuitive icons, this layout clearly communicates departmental or project-based performance. Ideal for year-end reviews, board meetings, and investor updates. Fully editable in PowerPoint, Keynote, and Google Slides.
- Remove from favorites
Powerpoint Template
1 MB
Google Slides Template
External link
Keynote Template
2 MB
6 slides
5G Wireless Infographics
The "5G Wireless" infographic template is a futuristic and informative resource, perfect for PowerPoint, Keynote, and Google Slides. Designed for telecom companies, tech firms, and educators, this template is an excellent way to present the advancements and potentials of 5G technology. This template features key aspects of 5G technology, including advancements over previous generations, speed comparisons, and potential applications. Its high-tech design and clear layout make it ideal for explaining the complexities and advantages of 5G in a way that is easy to understand and visually appealing. This is especially beneficial for presentations aimed at highlighting the revolutionary impact of 5G on various industries and consumer technology. With a color scheme that uses shades of blue and metallic accents, the design conveys concepts of speed, connectivity, and innovation. This not only makes the template visually striking but also aligns with the cutting-edge nature of 5G technology. Whether used in corporate presentations, educational seminars, or tech expos, this template ensures that your insights into 5G wireless technology are communicated effectively and engagingly.
- Remove from favorites
Powerpoint Template
1 MB
Google Slides Template
External link
Keynote Template
1 MB
7 slides
Developmental Milestone Infographic
Developmental milestones are specific skills or abilities achieved by individuals within a certain age range that indicate their growth and progress in various domains of development, including physical, cognitive, social, and emotional. This infographic template is designed to showcase the key developmental milestones children typically reach at various ages, guiding parents and caregivers in understanding and celebrating these significant achievements. Compatible with Powerpoint, Keynote, and Google Slides. Encourage celebrating each milestone achieved, emphasizing the positive impact on development and motivation.
- Remove from favorites
Powerpoint Template
1 MB
Google Slides Template
External link
Keynote Template
1 MB
5 slides
Team Communication and Info Sharing Presentation
Keep your team aligned and informed with this clear, visual communication flow template. Designed to illustrate how information moves between individuals or departments, it helps teams optimize collaboration and transparency. Great for onboarding, project handoffs, or workflow discussions. Fully compatible with PowerPoint, Keynote, and Google Slides.
- Remove from favorites
Powerpoint Template
7 MB
Google Slides Template
External link
Keynote Template
6 MB
6 slides
Common Question for Businesses Infographic
Captivate your audience and enhance interaction with our collection of slide templates, perfect for engaging beginners and prompting them to ask top questions. These templates feature inviting designs and dynamic layouts, making them ideal for educational sessions, workshops, or any presentation aimed at beginners. Each template employs bright colors and creative graphics to draw attention and stimulate curiosity. The designs are crafted to not only pose questions but also to invite thoughtful responses and active participation. Whether you are hosting a seminar, leading a training session, or facilitating a learning module, these slides provide a friendly and approachable way to encourage questions and discussions. Customize these templates to suit your specific session, adapting the text, colors, and images to fit the theme and audience. They are a fantastic tool for educators and trainers looking to create a more engaging and interactive learning environment.
- Remove from favorites
Powerpoint Template
1 MB
Google Slides Template
External link
Keynote Template
1 MB
5 slides
Company Vision and Operations Overview Presentation
Present your company’s mission and structure with this Company Vision and Operations Overview Presentation. Designed around a central eye graphic, it highlights four strategic pillars or core values. Ideal for executive summaries, leadership decks, or internal briefings. Fully editable in Canva, PowerPoint, or Google Slides.
- Remove from favorites
Powerpoint Template
1 MB
Google Slides Template
External link
Keynote Template
1 MB
6 slides
Search Engine Optimization Campaign Overview Presentation
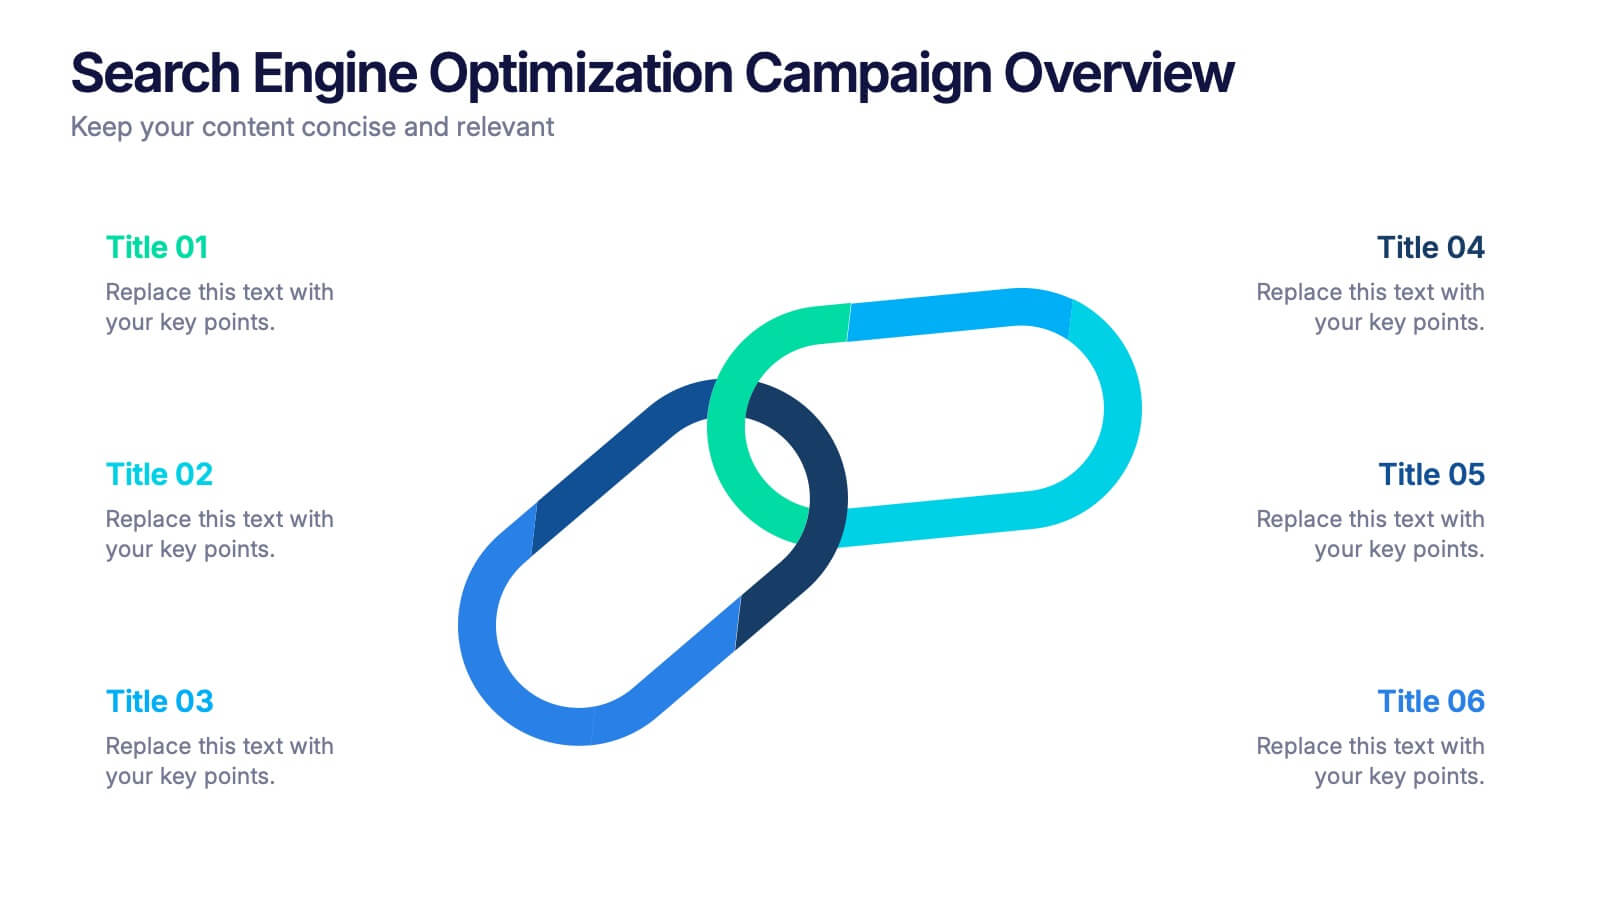
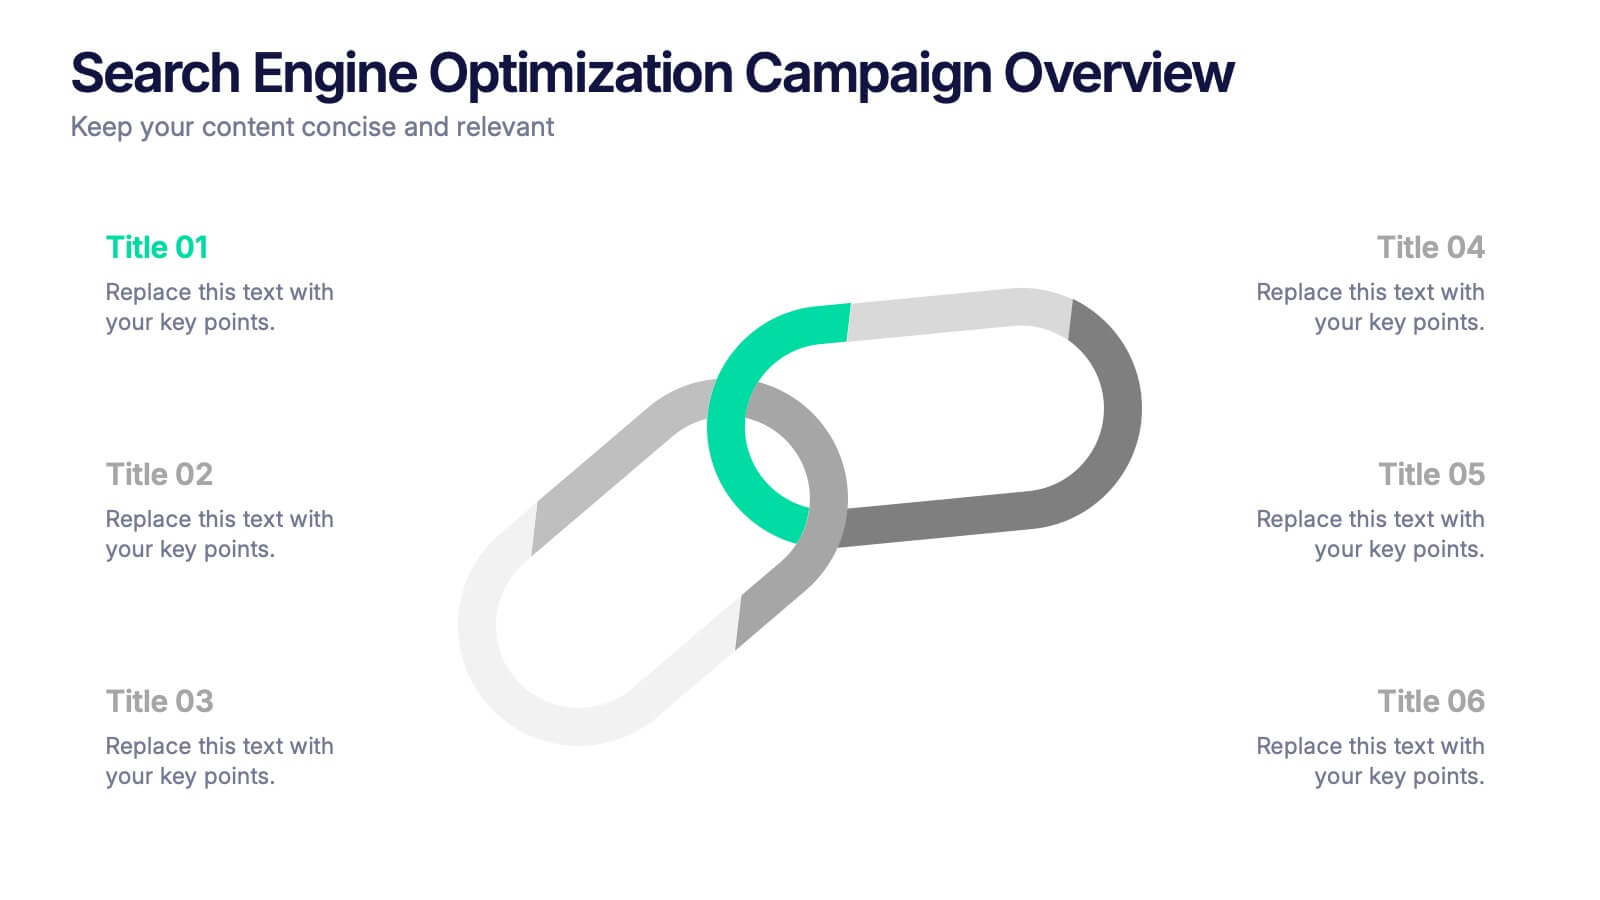
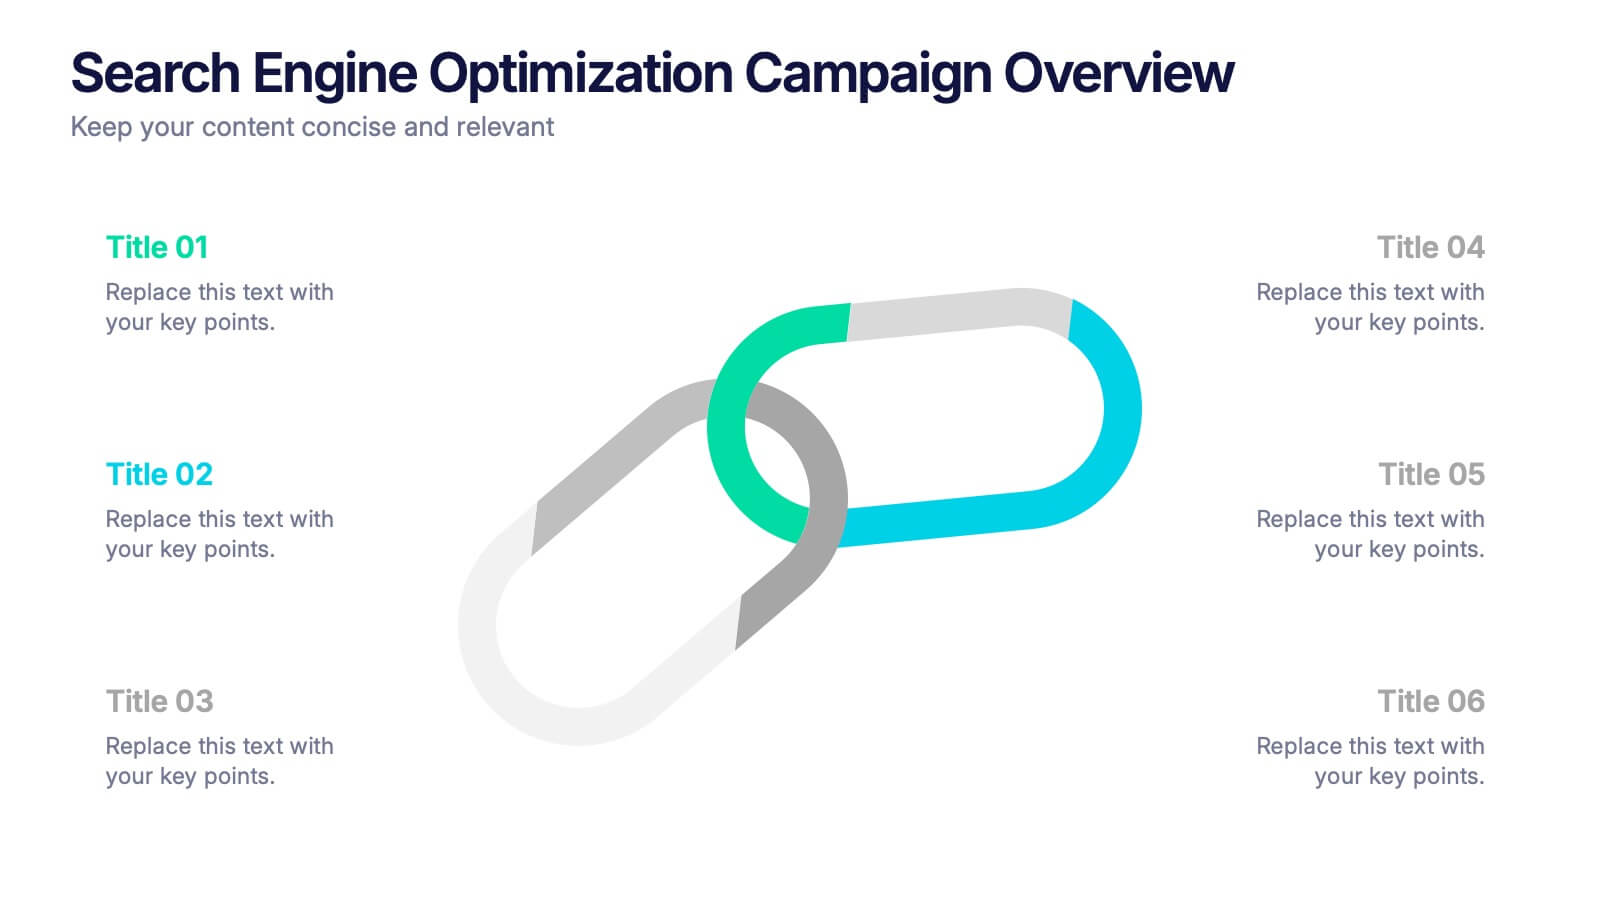
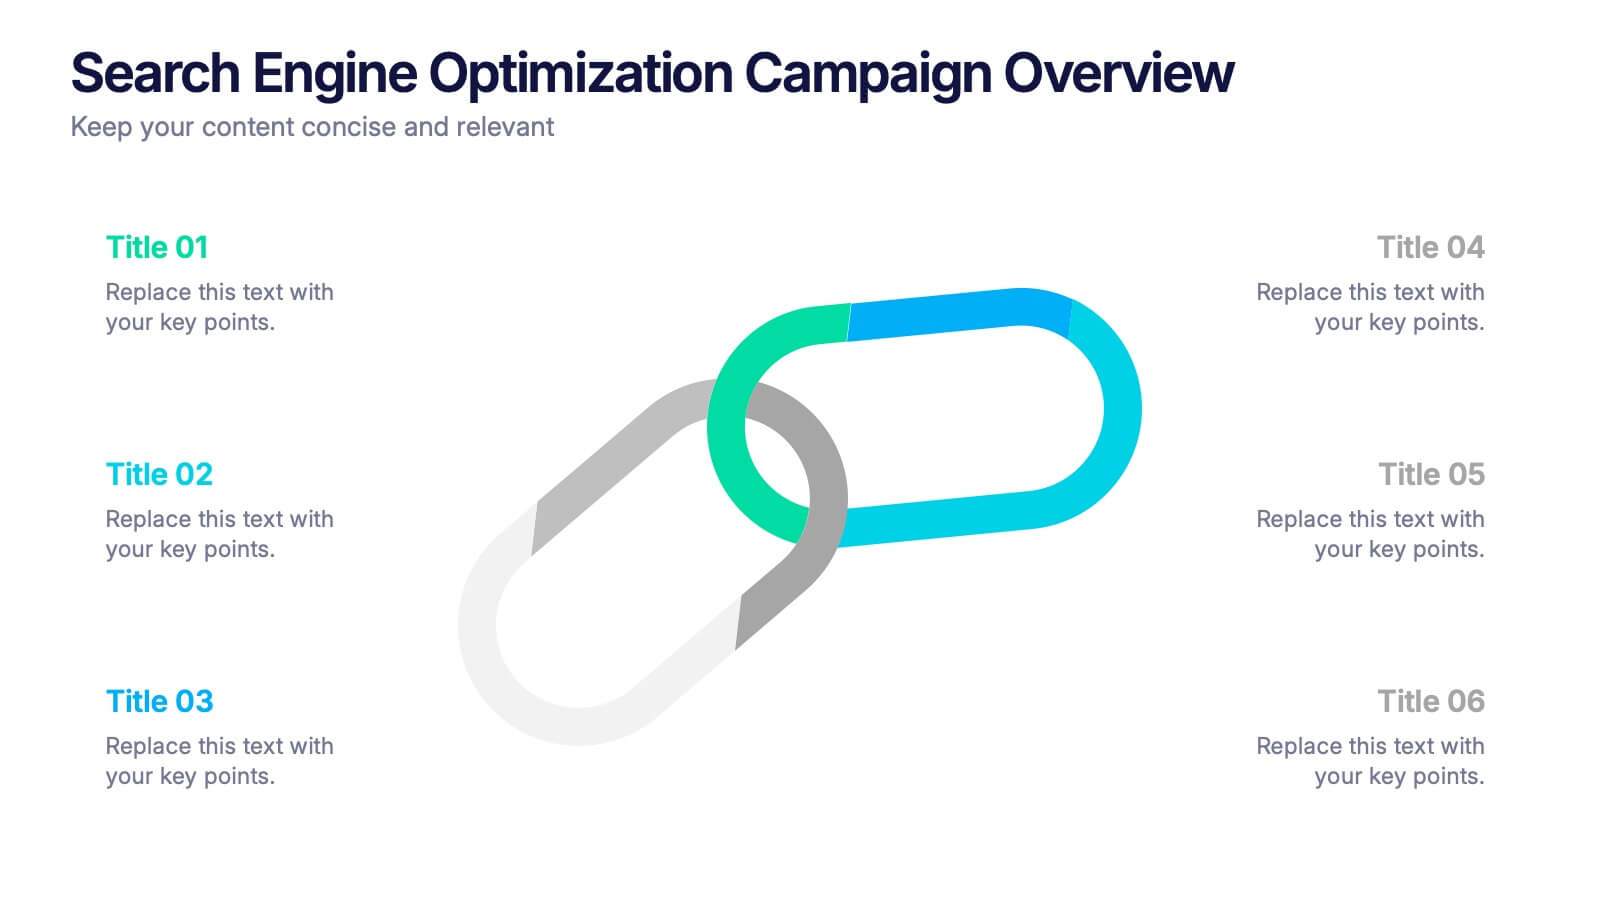
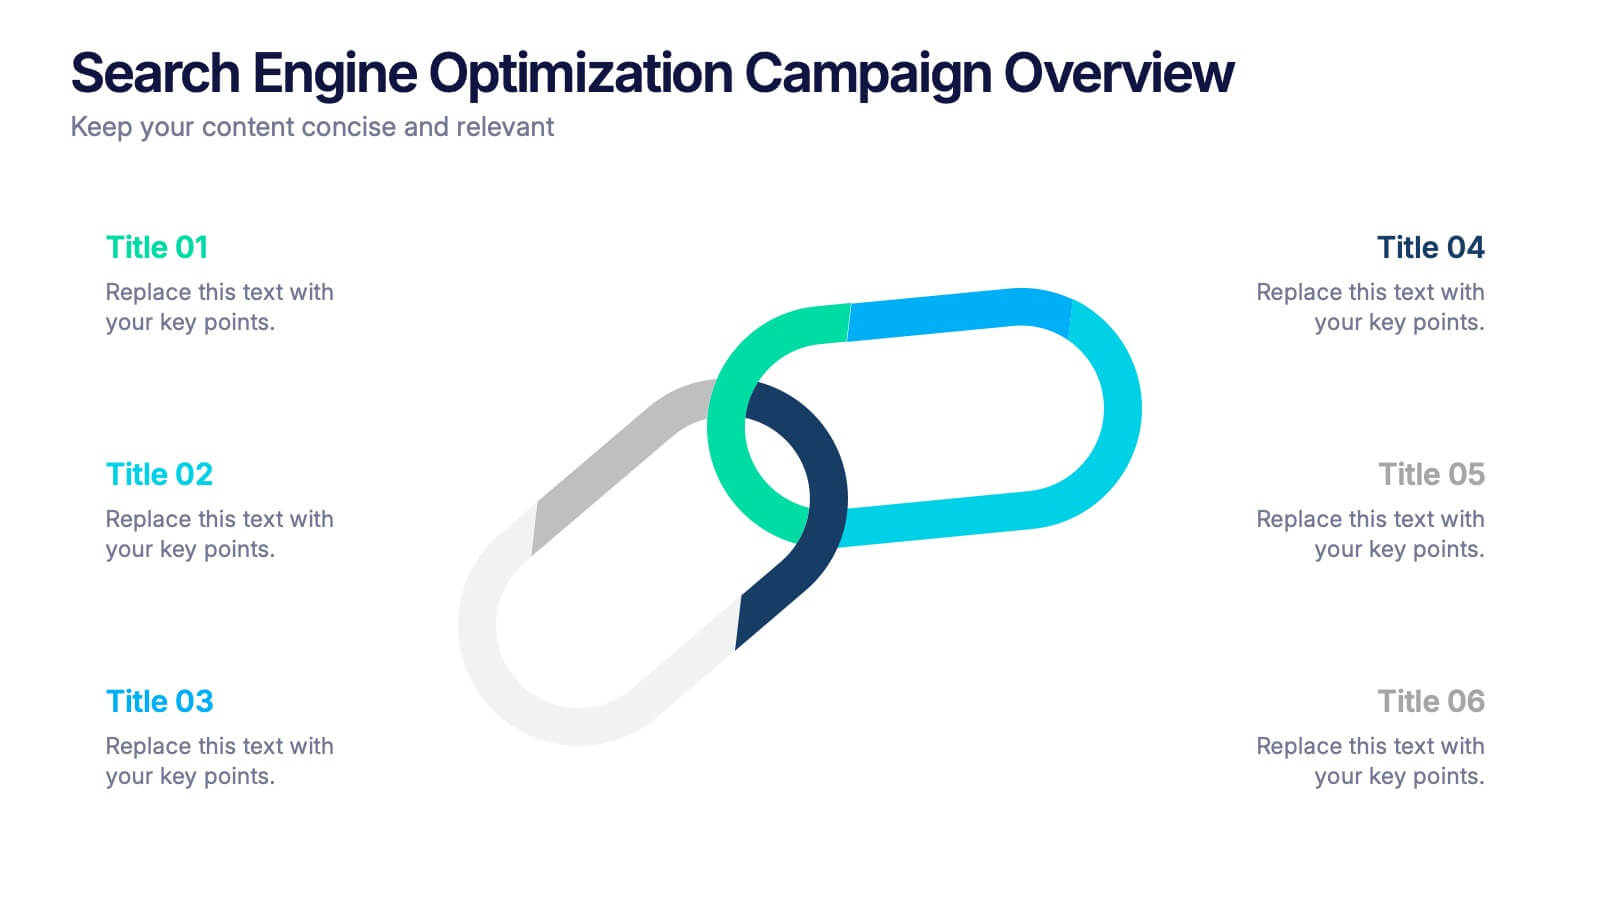
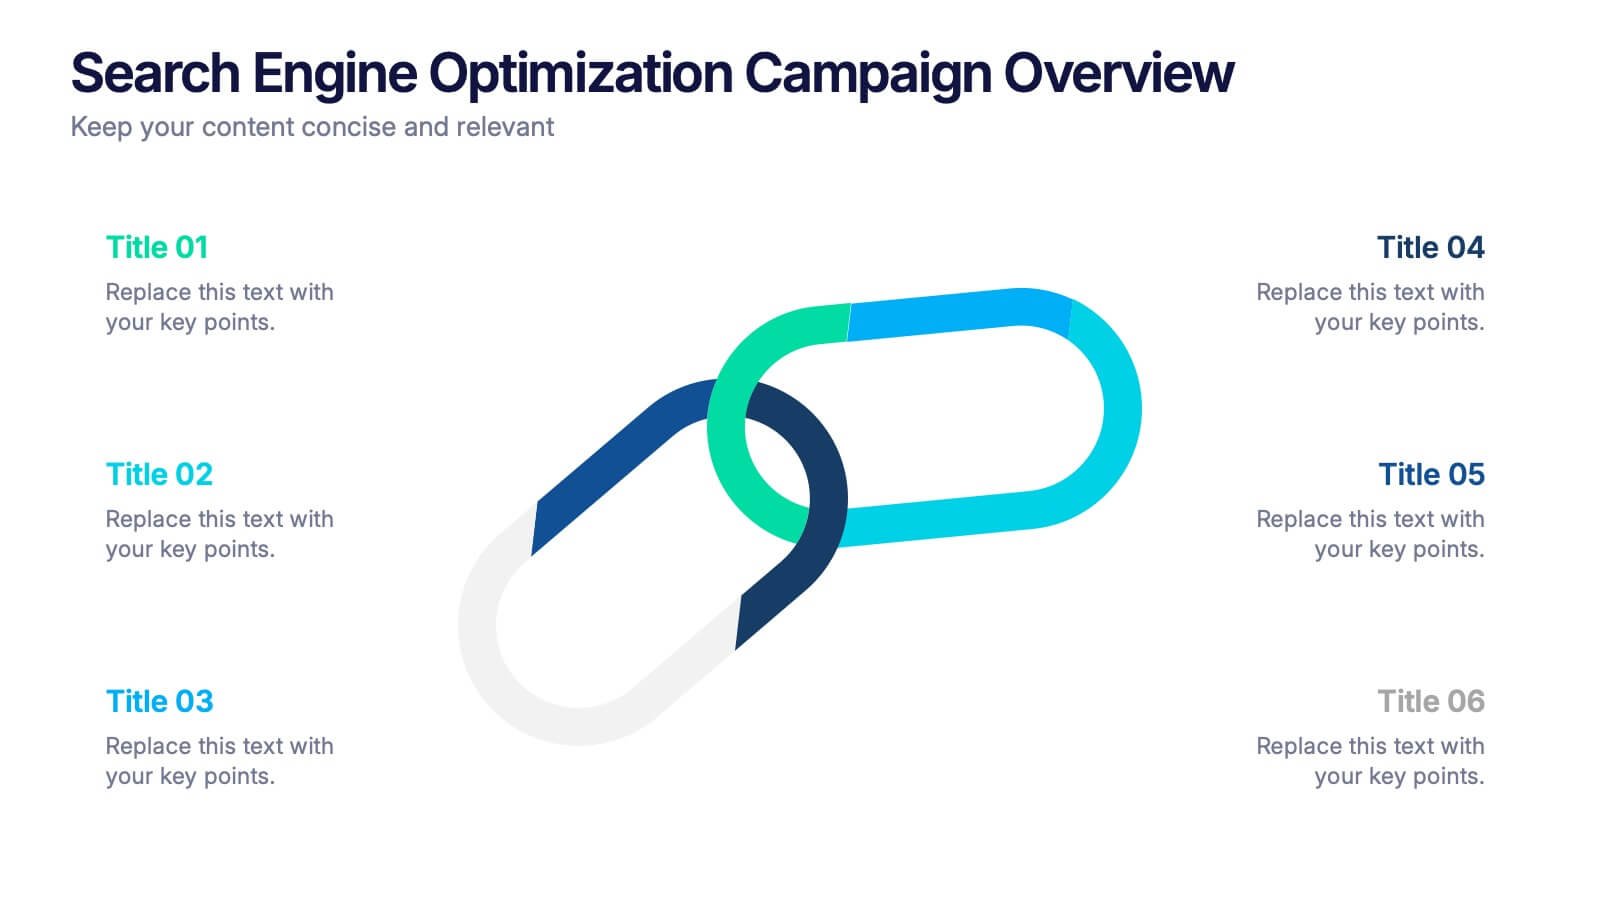
Kick off your digital strategy with a clean, modern layout that makes every key insight feel connected and actionable. This presentation helps you explain campaign goals, highlight SEO priorities, and break down essential tasks in a structured, visual flow. Fully compatible with PowerPoint, Keynote, and Google Slides.
- Remove from favorites
Powerpoint Template
1 MB
Google Slides Template
External link
Keynote Template
2 MB
8 slides
Territorial Reach Map of United States Presentation
Showcase your national footprint with the Territorial Reach Map of United States Presentation. This slide visually highlights specific states and aligns them with key data points—perfect for illustrating market penetration, sales concentration, or operational presence. Designed for clarity and impact, it's fully customizable in Canva, PowerPoint, and Google Slides.
- Remove from favorites
Powerpoint Template
2 MB
Google Slides Template
External link
Keynote Template
2 MB
10 slides
Financial Money Management Strategies Presentation
Break down your key financial strategies with this clear, wheel-style diagram. Perfect for outlining budgeting principles, savings goals, or investment methods, each segment includes space for titles and concise text. Ideal for financial advisors, consultants, or internal team planning. Fully customizable in PowerPoint, Keynote, and Google Slides.
- Remove from favorites
Powerpoint Template
1 MB
Google Slides Template
External link
Keynote Template
2 MB
10 slides
Decision Tree Diagram Presentation
Simplify Decision-Making! The Decision Tree Diagram Presentation helps visualize complex choices with structured branching paths. Perfect for business strategies, process flows, or risk analysis, this template ensures clarity with editable nodes and connectors. Fully customizable and available for PowerPoint, Keynote, and Google Slides to fit your unique needs effortlessly.
- Remove from favorites
Powerpoint Template
1 MB
Google Slides Template
External link
Keynote Template
2 MB
7 slides
Scrum Sprints Planning Presentation
Kick off your workflow with a dynamic visual that maps out every phase of your team’s process in a clean, structured layout. This presentation helps explain planning cycles, task sequencing, and collaborative decision-making in a clear, engaging format. Fully compatible with PowerPoint, Keynote, and Google Slides.
- Remove from favorites
Powerpoint Template
1 MB
Google Slides Template
External link
Keynote Template
2 MB
8 slides
Professional Title Slide Presentation
Start your presentation with impact using a bold, modern cover design that captures attention instantly. Perfect for introducing reports, creative projects, or business pitches, this layout combines professional typography with clean visuals for a polished first impression. Fully editable in PowerPoint, Keynote, and Google Slides for seamless customization.
- Remove from favorites
Powerpoint Template
1 MB
Google Slides Template
External link
Keynote Template
1 MB
4 slides
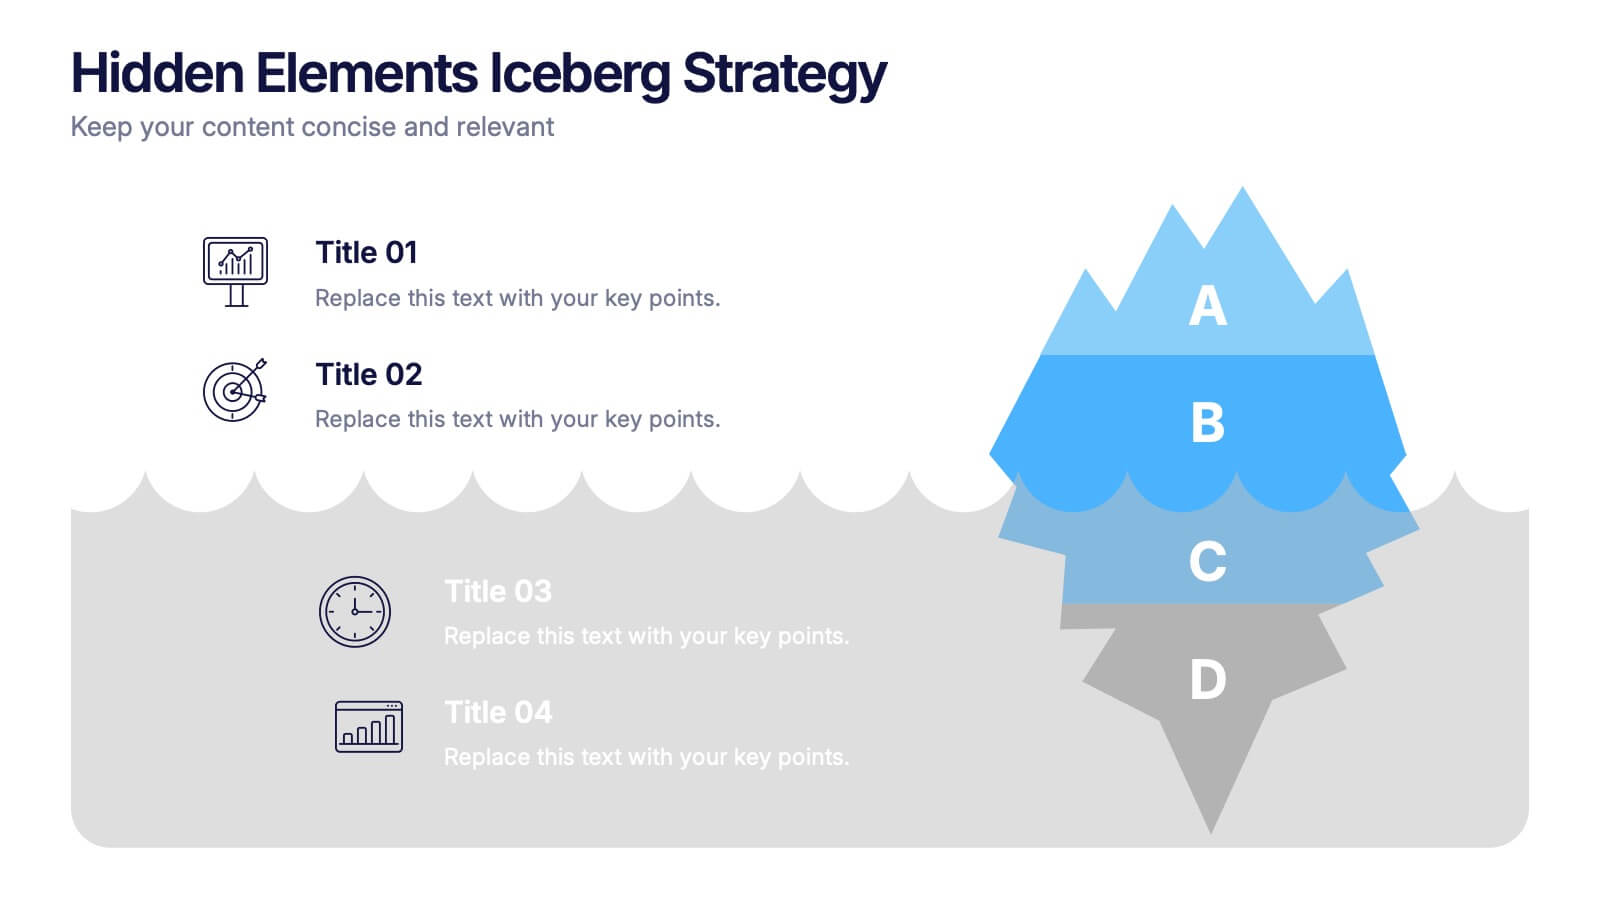
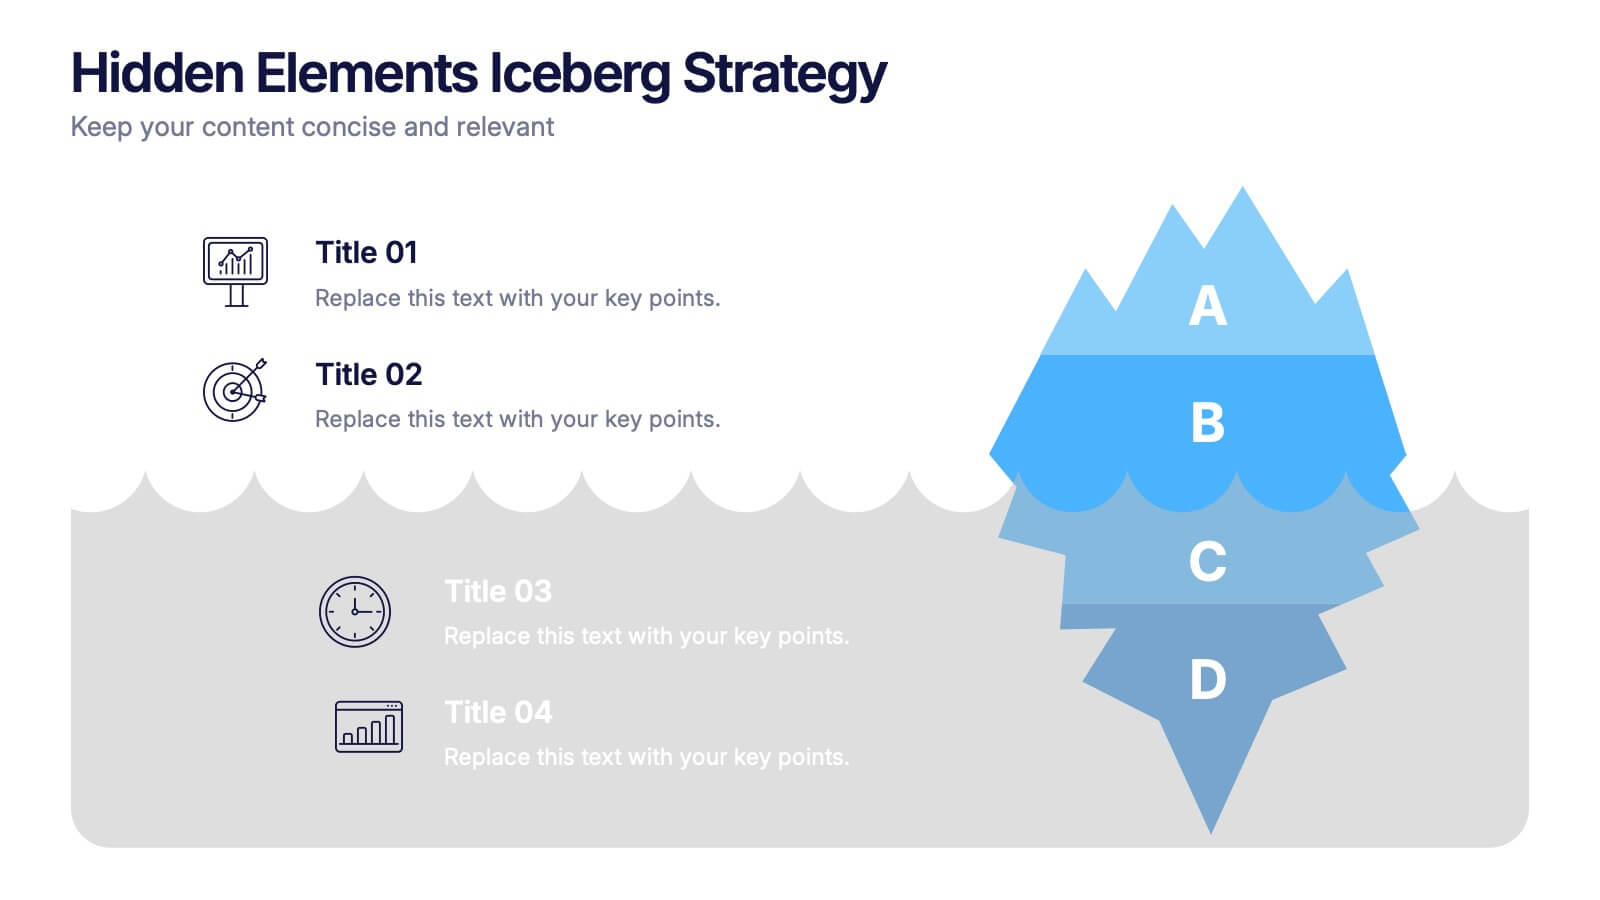
Hidden Elements Iceberg Strategy Presentation
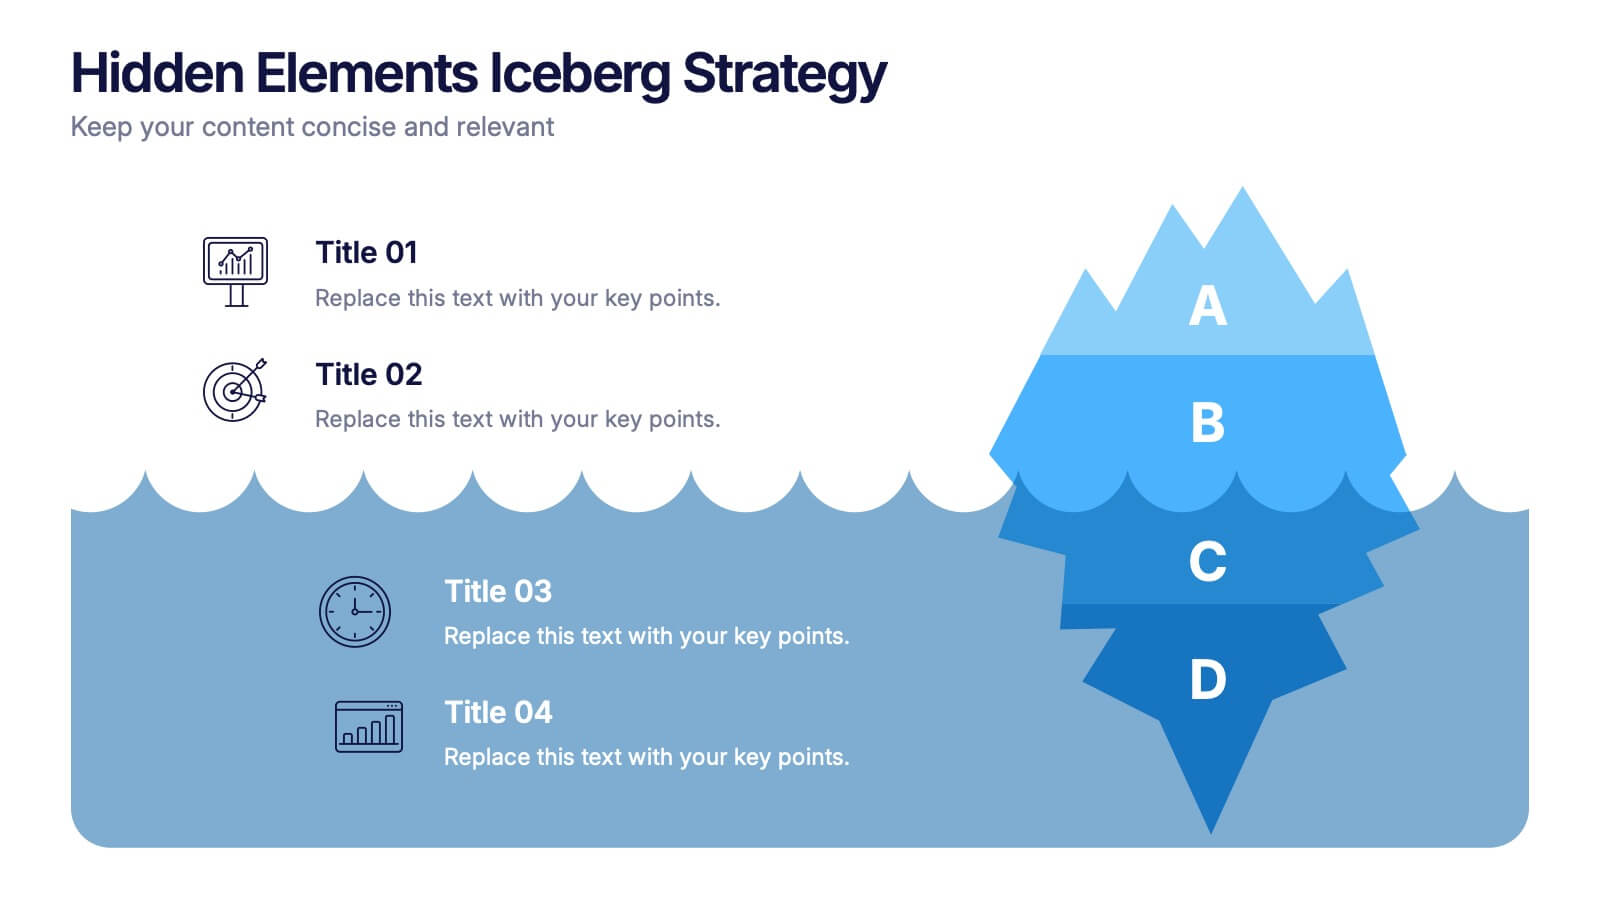
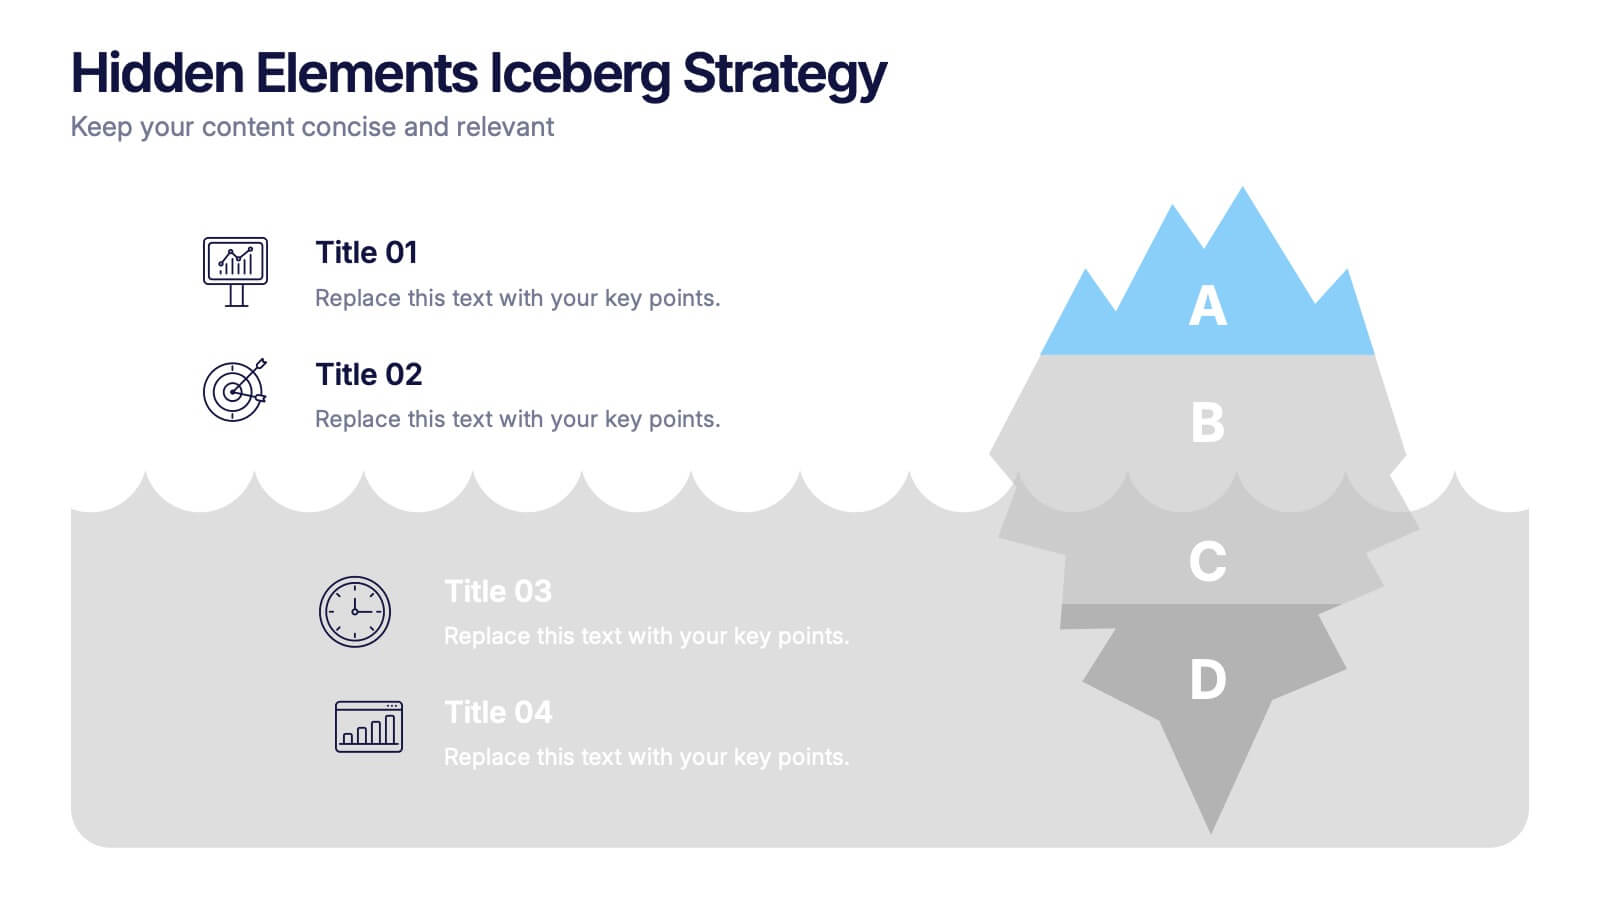
Reveal what lies beneath the surface with this Hidden Elements Iceberg Strategy presentation. Perfect for exploring visible vs. underlying factors in strategy, risk, or behavior. Visually break down your content using layered iceberg graphics. Fully editable in Canva, PowerPoint, and Google Slides to fit your narrative and branding.
- Remove from favorites
Powerpoint Template
1 MB
Google Slides Template
External link
Keynote Template
2 MB
10 slides
Growth Strategy in Four Steps Presentation
Achieve sustainable business expansion with the Growth Strategy in Four Steps presentation. This structured template guides teams through progressive development phases, using clear visuals to illustrate key milestones and percentage-based improvements. Ideal for entrepreneurs, marketers, and business strategists, this slide layout is fully customizable and compatible with PowerPoint, Keynote, and Google Slides for seamless integration into your workflow.
- Remove from favorites
Powerpoint Template
1 MB
Google Slides Template
External link
Keynote Template
2 MB
2 slides
Creative Business Presentation
Showcase your ideas with energy and style using this bold, contemporary presentation layout. Featuring dynamic visuals and clean typography, this template is ideal for business proposals, portfolios, and startup pitches. Easily customizable in PowerPoint, Keynote, and Google Slides to suit your brand's identity.


