


Features
- 4 Unique slides
- Fully editable and easy to edit in Microsoft Powerpoint, Keynote and Google Slides
- 16:9 widescreen layout
- Clean and professional designs
- Export to JPG, PDF or send by email


Do you have any questions?
Recommend


12 slides
Corporate Growth Strategy Steps Presentation
Showcase your expansion roadmap with this Corporate Growth Strategy Steps Presentation. Designed as a five-step vertical ladder, this layout is perfect for illustrating progressive stages like market entry, development, scaling, innovation, and leadership. Each level includes editable icons and text placeholders for clarity and customization. Fully compatible with PowerPoint, Keynote, and Google Slides.


7 slides
Structure Diagram Infographics
Structure is important because it provides a framework for organization and order, which helps to facilitate efficiency, productivity, and success in many different areas of life. This template is a powerful tool that can help you organize, visualize, and present your data in a compelling way. This infographic template is designed to illustrate the structure and workings of a company or organization. It includes a variety of customizable photo layouts and charts so you can edit the look to suit your needs. This presentation is designed for use in Powerpoint, Keynote and Google Slides.


10 slides
Digital Transformation Strategy Presentation
The "Digital Transformation Strategy Presentation" template is designed to clearly showcase the stages of digital transformation initiatives. It features a visually appealing layout with concentric circles or varying targets that focus on key elements of transformation strategy. This format is ideal for emphasizing the progression from planning to execution and monitoring of digital strategies. Each section is distinctly colored and provides a space for succinctly labeled titles and detailed descriptions, making it perfect for presenting strategic initiatives, technology implementation, or progress metrics in corporate settings. The template ensures that complex strategies are communicated in an understandable and visually engaging manner.


7 slides
30 60 90 Nutritional Plan Infographic
Chart a path to healthful living with the 30 60 90 Nutritional Plan Infographic. In a vibrant mix of yellow, purple, blue, and white, this template presents a visually delightful guide to nutrition enthusiasts and health-conscious audiences. The tailored design encourages a gradual approach to dietary transitions, making it easier to understand and adhere to. Health coaches, dietitians, or fitness trainers will find this as an indispensable tool for workshops, webinars, or consultations. Its seamless integration with PowerPoint, Keynote, and Google Slides enhances the user experience during presentations.


21 slides
Eldritch Product Roadmap Presentation
The Product Roadmap Presentation Template features 21 modern slides, including product overviews, features, pain points, technical specs, and marketing strategies. Its sleek gray-yellow design ensures professionalism. Perfect for startups or businesses, it’s fully customizable and compatible with PowerPoint, Keynote, and Google Slides, ideal for impactful product-focused presentations.


6 slides
Real Estate Housing Solutions Presentation
Present property features and real estate plans with this creative multi-level housing diagram. Designed for agents, developers, or housing consultants, this layout clearly segments space usage or service offerings. Fully customizable in PowerPoint, Keynote, and Google Slides—perfect for showcasing floor plans, room functions, or housing solutions with vibrant clarity.


7 slides
Enterprise Governance Infographics
A Governance Infographic provides information about the principles and practices of governance, particularly in the context of organizations or institutions. This governance template can be used to cover a wide range of topics related to governance, including organizational structures, decision-making processes, risk management, compliance, and ethical standards. You can use this to include information on the roles and responsibilities of different stakeholders, such as board members, executives, and employees, as well as the policies and procedures that govern their interactions.


7 slides
Break Even Analysis Infographics Presentation Template
Break Even Analysis is a type of cost accounting, It's a critical tool for all businesses from start-ups to established firms. It allows you to evaluate how changes in the level of sales affect your total profit, or the number of purchases that must be made before the company or product makes a profit. This is also known as a break even point. Use this template to analyze your break-even point, the volume and price at which you will begin to earn a profit. This template comes with graphs and charts that will allow you to track the volume of your sales, monthly revenues, and variable expenses.


21 slides
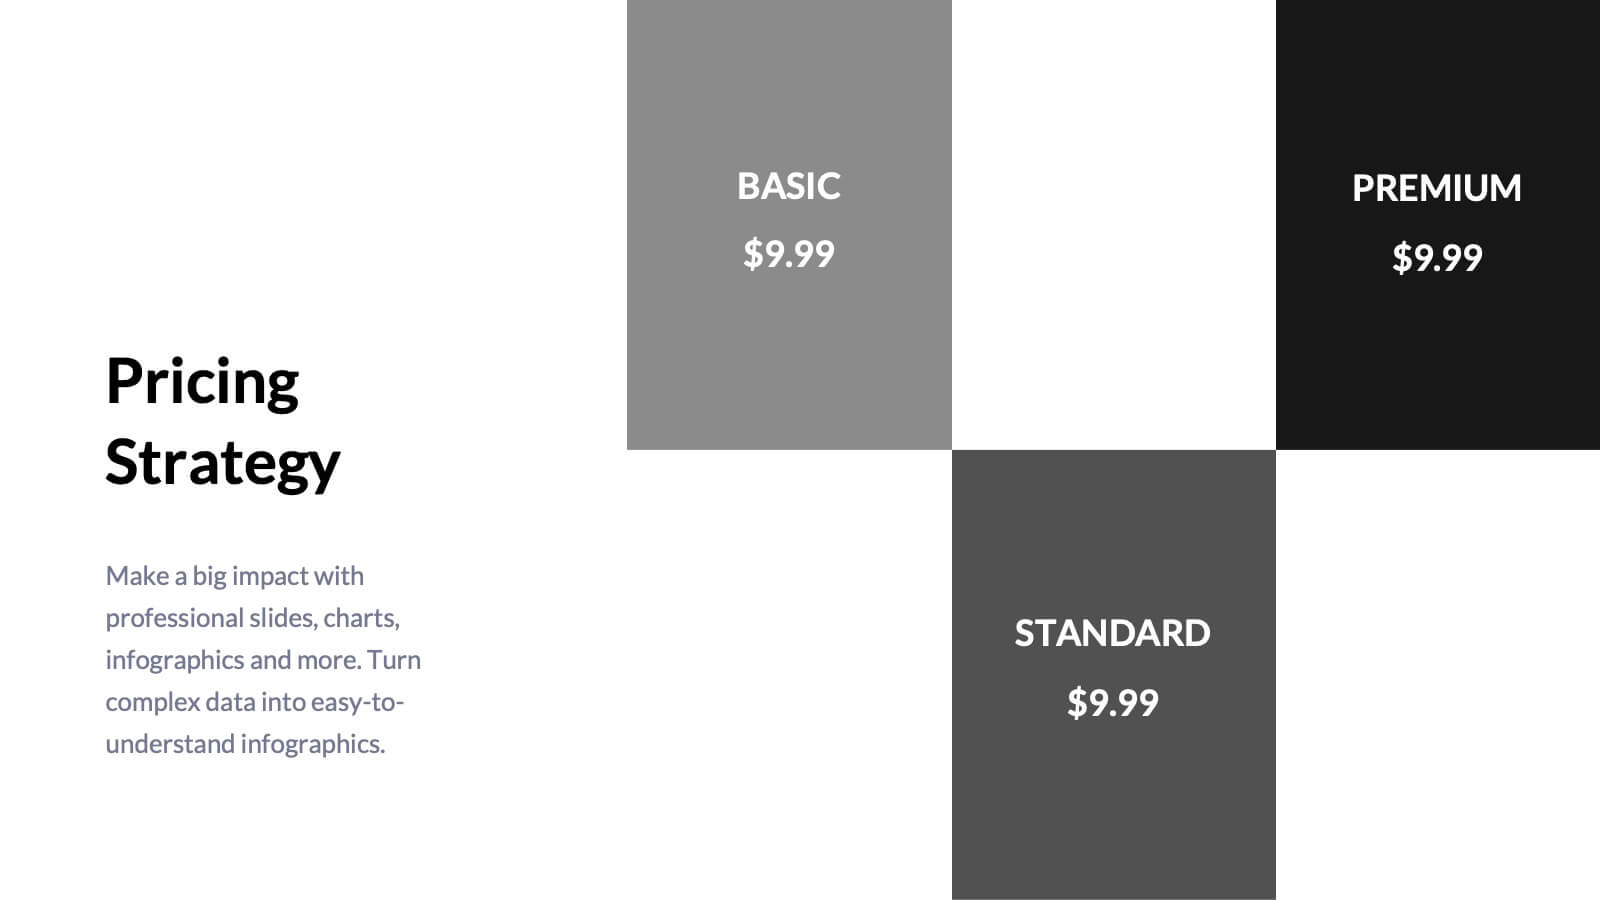
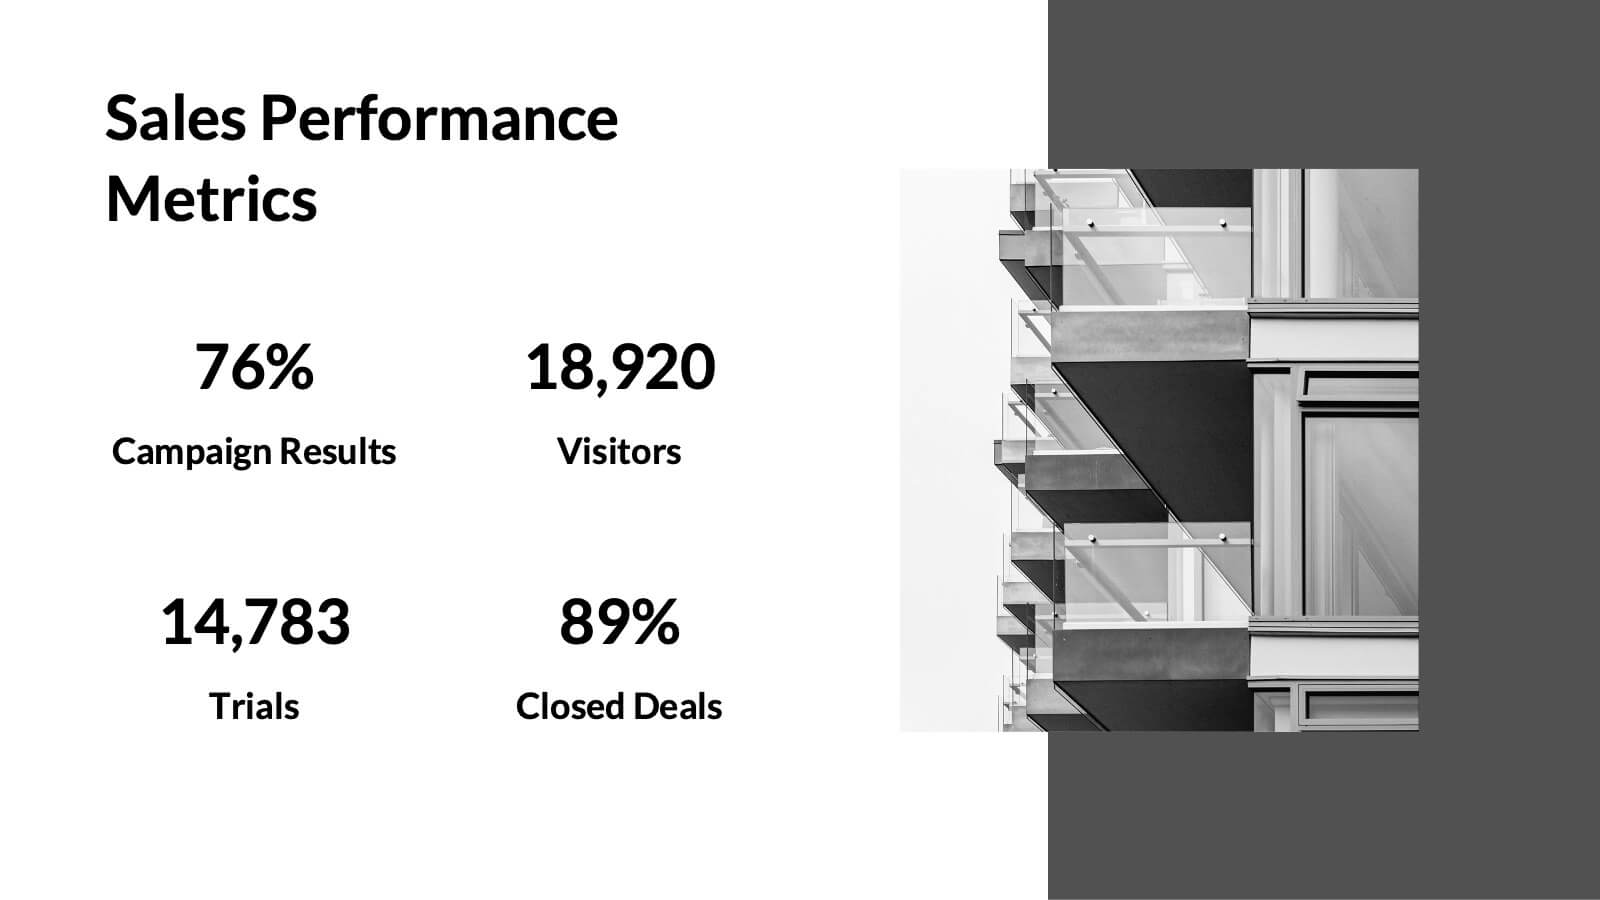
Tempest Sales Performance Report Presentation
Supercharge your sales presentations with this sleek, professional template. Perfect for outlining sales objectives, processes, and performance metrics, it features a clean, minimalist design that enhances clarity and impact. Highlight key elements like competitive analysis, pricing strategy, and future opportunities to captivate your audience. Compatible with PowerPoint, Keynote, and Google Slides, it ensures seamless presentations on any platform.


7 slides
Innovation Technology Infographics
Innovation technology refers to the application of technology or the use of innovative approaches to create new products, services, processes, or business models. This infographic template is designed to showcase the cutting-edge technologies shaping our future. Let the vibrant visuals and insightful content guide you through the exciting realm of innovation and technology. Compatible with Powerpoint, Keynote, and Google Slides. Fully customizable, explore this infographic and step into the future. The visuals are designed to ignite your imagination and enlighten your audience about the limitless potential of innovation and technology.


12 slides
Attention Interest Desire Actions Presentation
Spark curiosity from the very first slide with a bold, layered visual that turns complex ideas into a clear, memorable journey. This presentation walks viewers through each stage of your message, helping you build momentum and guide decisions with ease. Fully editable and compatible with PowerPoint, Keynote, and Google Slides.


2 slides
Client-Oriented Project Proposal Deck Presentation
Deliver polished, persuasive proposals with the Client-Oriented Project Proposal Deck Presentation. Designed to balance visual appeal and clarity, this layout is perfect for consultants, agencies, or freelancers presenting solutions to clients. Includes space for project overviews, photos, and key value points. Fully editable in PowerPoint, Keynote, and Google Slides.


7 slides
Website Mockup Infographic
Enhance your digital presence with this curated collection of website mockup templates, meticulously designed to showcase your online projects with clarity and professional flair. Each template features vibrant layouts that display your website designs on various digital devices, providing a comprehensive view of how your site will look across different platforms. These mockups are crafted with precision, emphasizing the responsive nature of web design and ensuring that your visuals translate beautifully from desktops to mobile devices. The use of bright colors and clear, concise text areas within the mockups makes them both attention-grabbing and informative. Perfect for web designers, developers, or digital marketers, these mockups are essential tools for client presentations, portfolio displays, or marketing pitches. They allow you to demonstrate the functionality and aesthetics of your website effectively, ensuring your digital projects resonate with your target audience.


20 slides
Dreamspire Academic Research Report Presentation
Present your research findings with impact using this bold and dynamic report template! It includes essential sections such as objectives, methodology, key findings, and future research directions, ensuring a comprehensive overview. Perfect for academic, business, or industry research presentations, this template is fully compatible with PowerPoint, Keynote, and Google Slides.


5 slides
CBD Black Market Infographics
Navigate the intricate realities of the cannabis industry with our CBD black market infographics. This essential visual resource, marked by its striking use of pink, orange, and purple hues. It's a tool for law enforcement agencies, legal consultants, and market researchers who are tracking or presenting on the unauthorized distribution within the cannabis industry. The template doesn't just illustrate statistics; it educates on the precautions and market dynamics overshadowed by the black market's presence. Featuring compelling graphics, relevant icons, these infographics synthesize data into more digestible content, aiding in informed decision-making and public awareness campaigns.


10 slides
Projects Completion Checklist Presentation
Keep every milestone visible and celebrate progress with a clean, structured layout designed to track project achievements. This presentation helps teams communicate goals, timelines, and completed tasks clearly and professionally. Fully customizable and compatible with PowerPoint, Keynote, and Google Slides for seamless editing and polished project reporting.


7 slides
Smile Rating Importance Infographic Presentation
Smile Rating is a metric used in customer service to measure the level of customer satisfaction or happiness with a particular experience, interaction or service. This template will help you make a vibrant, friendly and original presentation. This smile rating infographic is easy to use and customize. It is fully editable and the layout allows you to personalize it. This template can be edited in PowerPoint, Keynote, and Google Slides. This is perfect for business presentations, strategic planning, idea-sharing sessions or just a fun way to share your thoughts on this design topic.