


Features
- 23 Unique Slides
- Fully editable and easy to edit in Microsoft Powerpoint, Keynote and Google Slides
- 16:9 widescreen layout
- Clean and professional designs
- Export to JPG, PDF or send by email


Do you have any questions?
Recommend
20 slides
Obsidian Creative Design Report Presentation
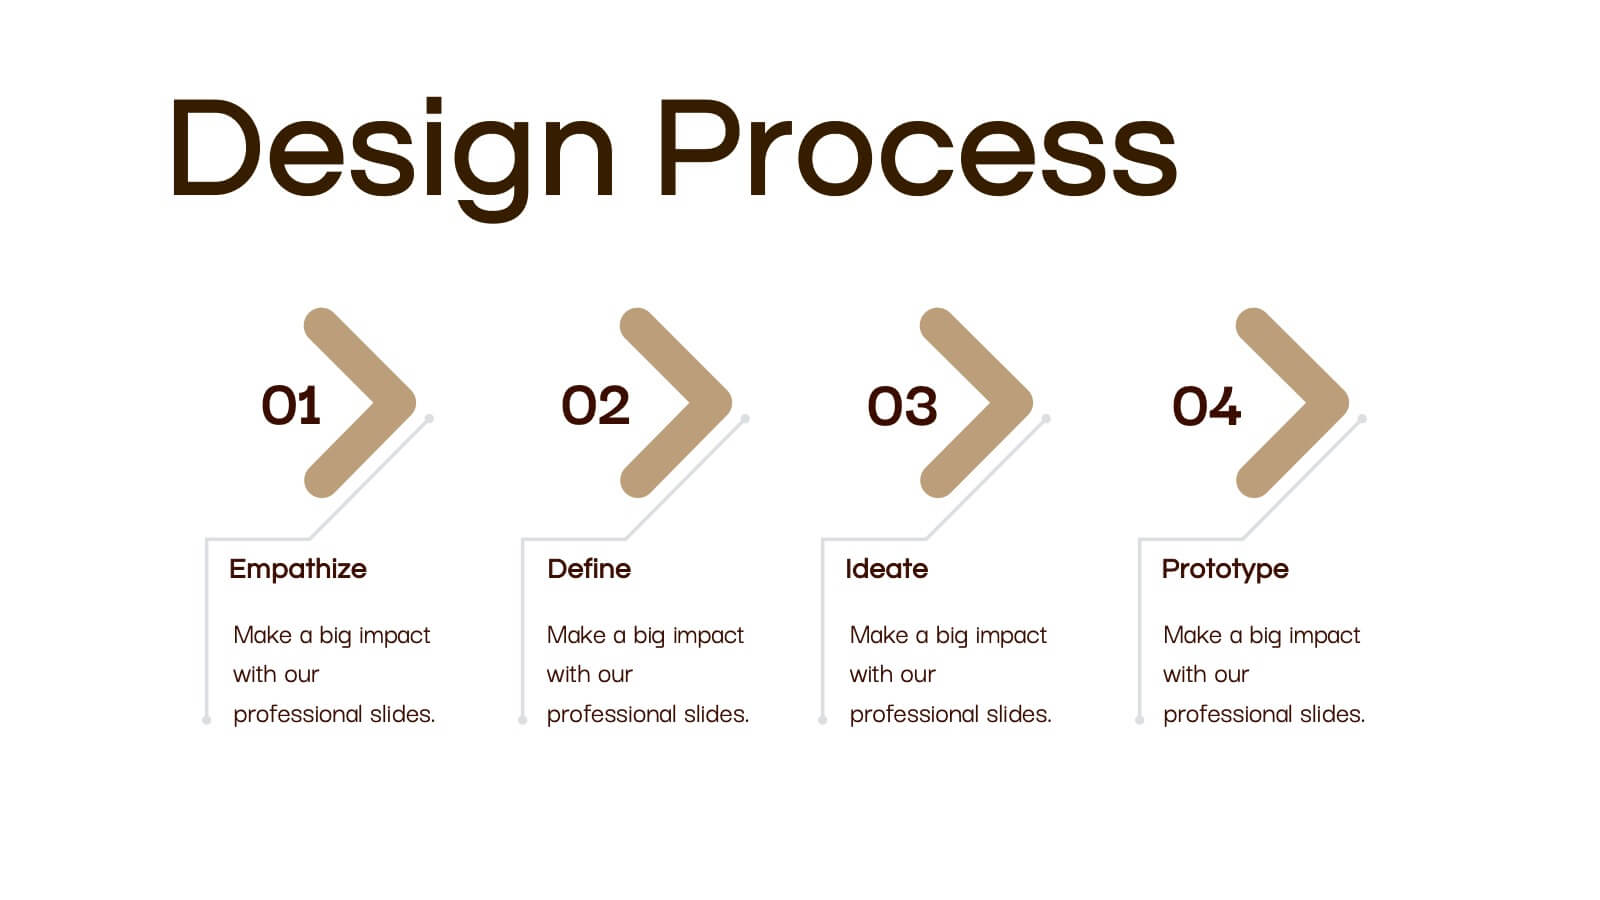
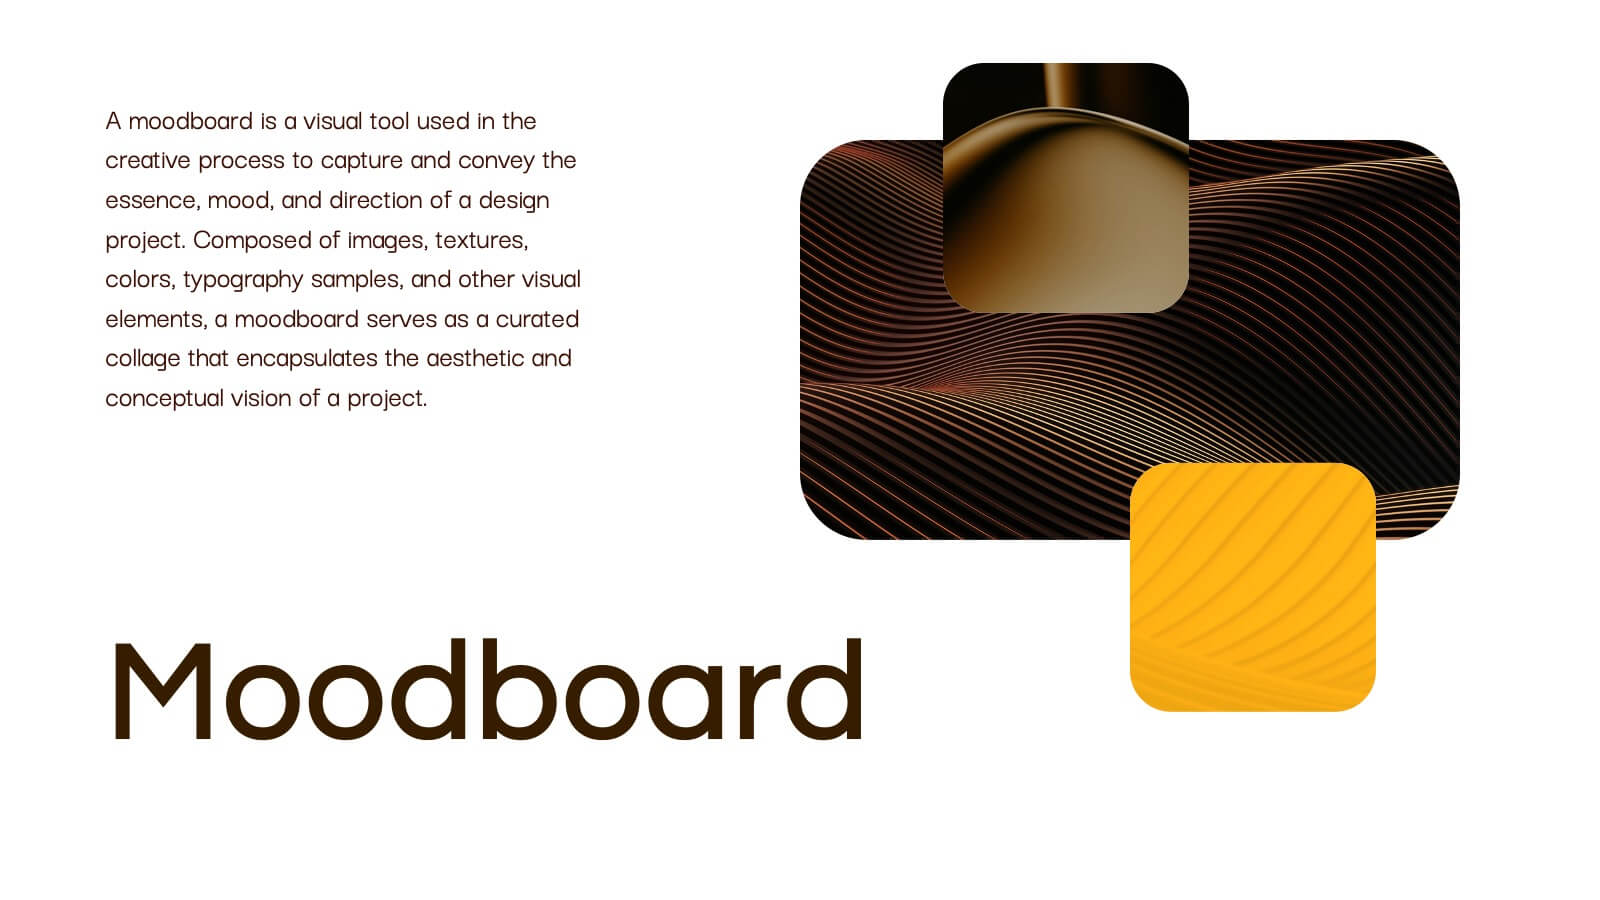
Bring your creative vision to life with this stunning design presentation template! Perfect for showcasing your design process, from concept development and mood boards to typography and final assets. Ideal for creative professionals, this template offers clarity and style at every step. Compatible with PowerPoint, Keynote, and Google Slides, it’s your ultimate tool for design presentations.


26 slides
Law Firm and Research Presentation
Discover the fantastic Law Firm Presentation Template, perfect for showcasing your legal expertise! With its clean, beautiful design and easy-to-understand visuals, this template is great for all ages. This versatile template works with both PowerPoint and Google Slides, allowing you to choose your preferred platform. Customizing the template is a breeze, thanks to its simple-to-edit features. With image placeholders, effortlessly drag and drop your favorite photos to create a unique, professional presentation. The clean design helps your audience focus on crucial content, while the beautiful elements provide a polished, modern look. Creative modern icons allow you to emphasize key points, making your presentation engaging and memorable. Our Law Firm Presentation Template is a time-saver, designed for quick, efficient editing. Create a powerful presentation that leaves a lasting impression on your audience with ease. Enhance your legal presentations with this amazing template. Its clean design, creative icons, easy editing, and compatibility with PowerPoint and Google Slides make it the perfect solution for your needs. Download now and elevate your legal presentations!
22 slides
Aurora Agency Portfolio Presentation
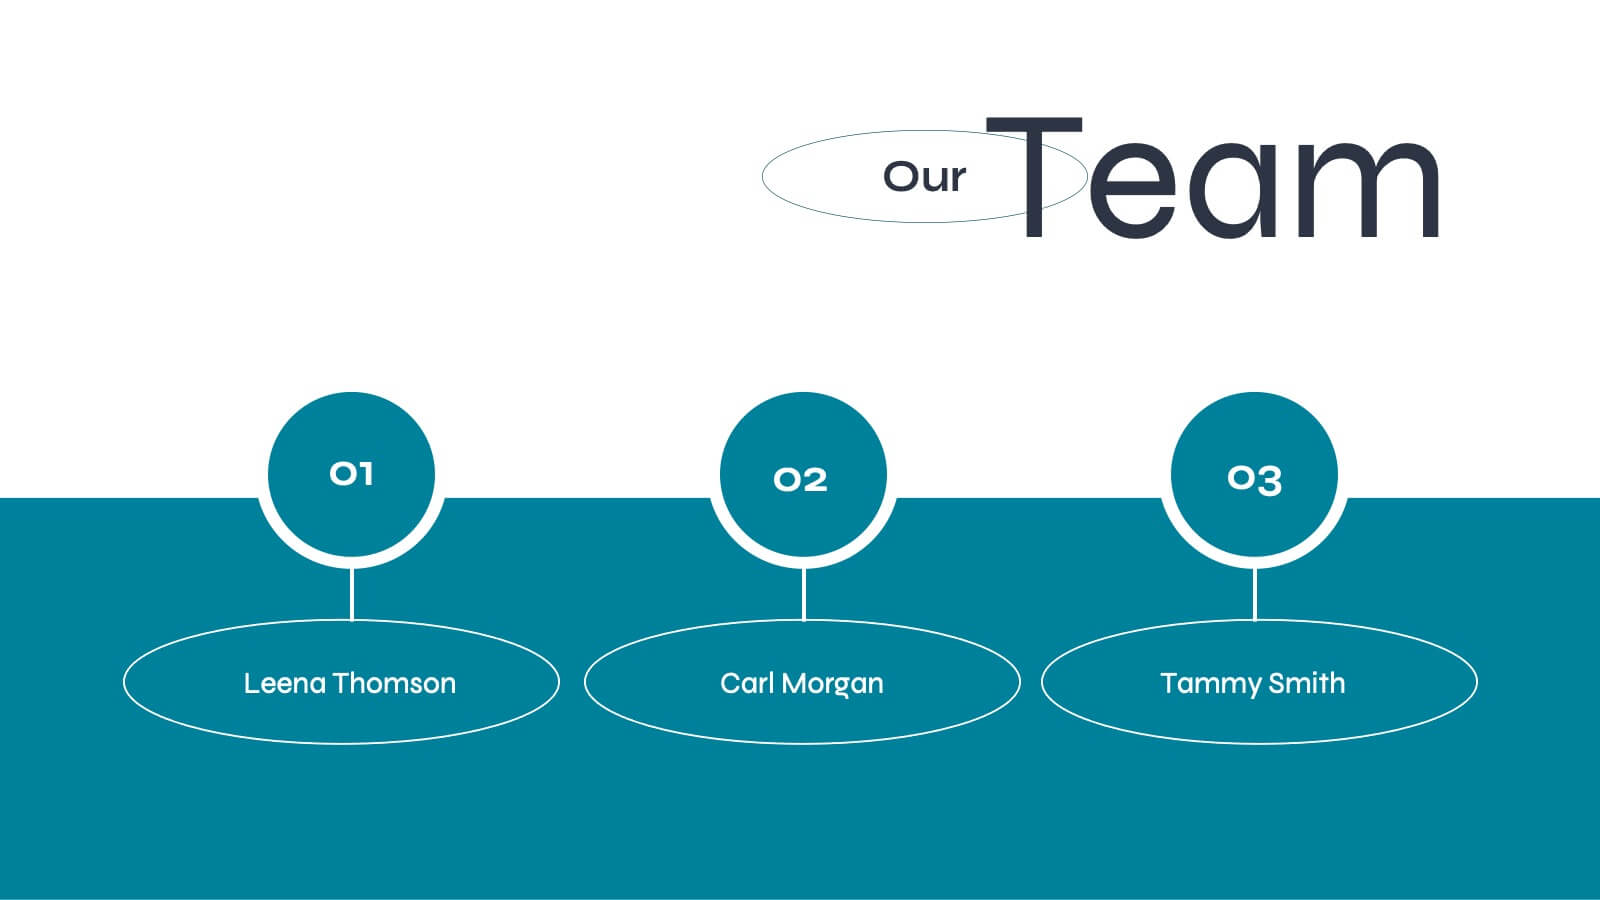
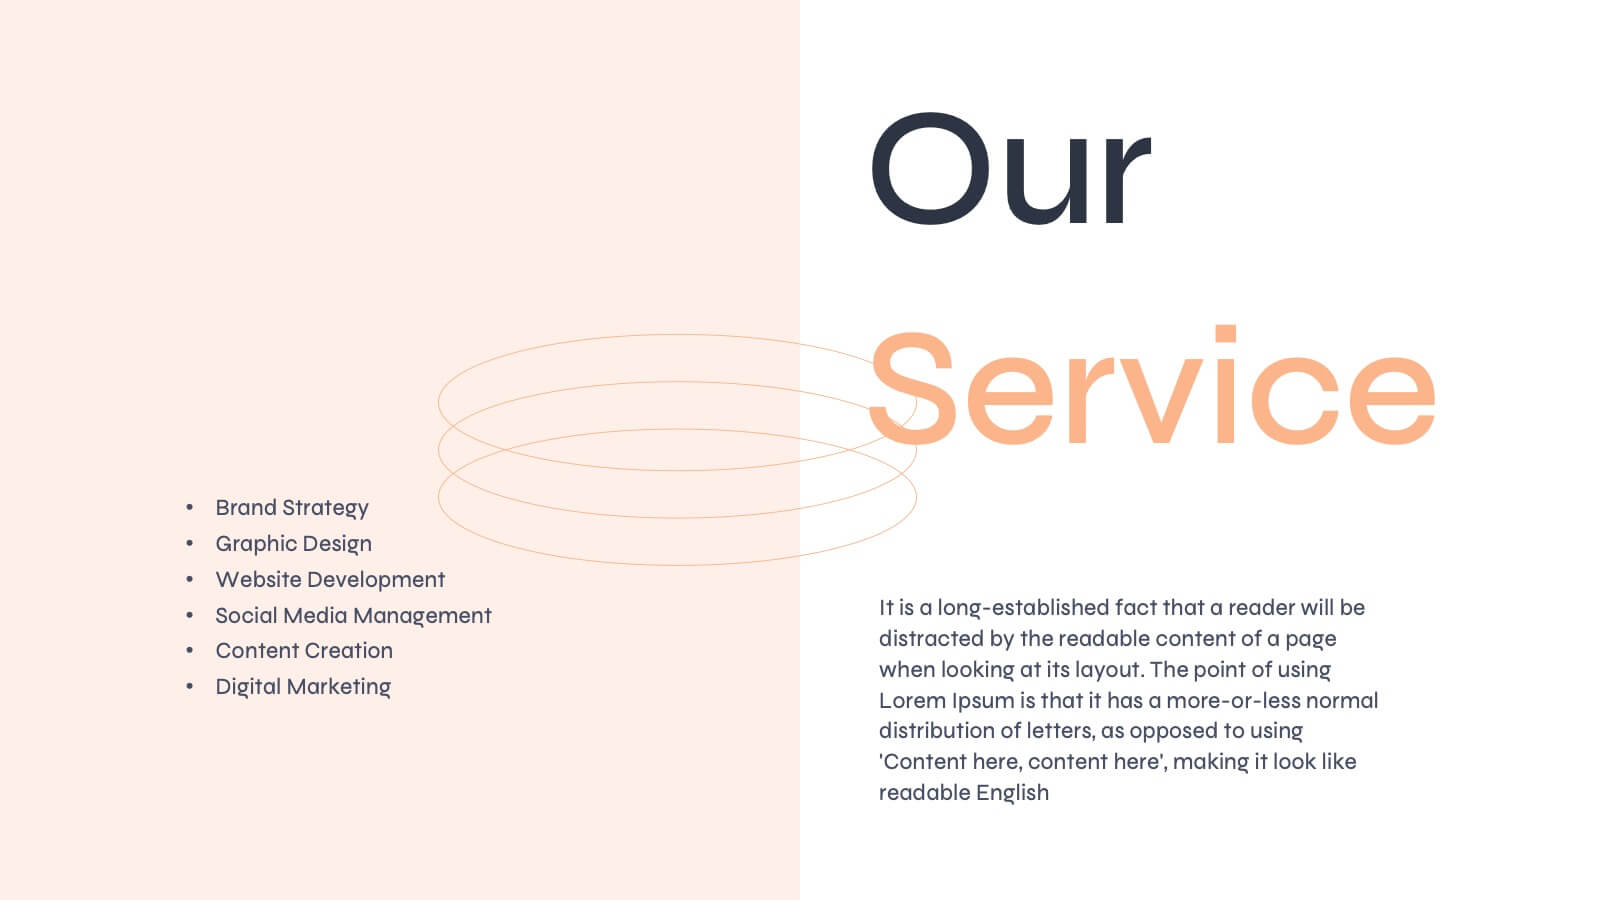
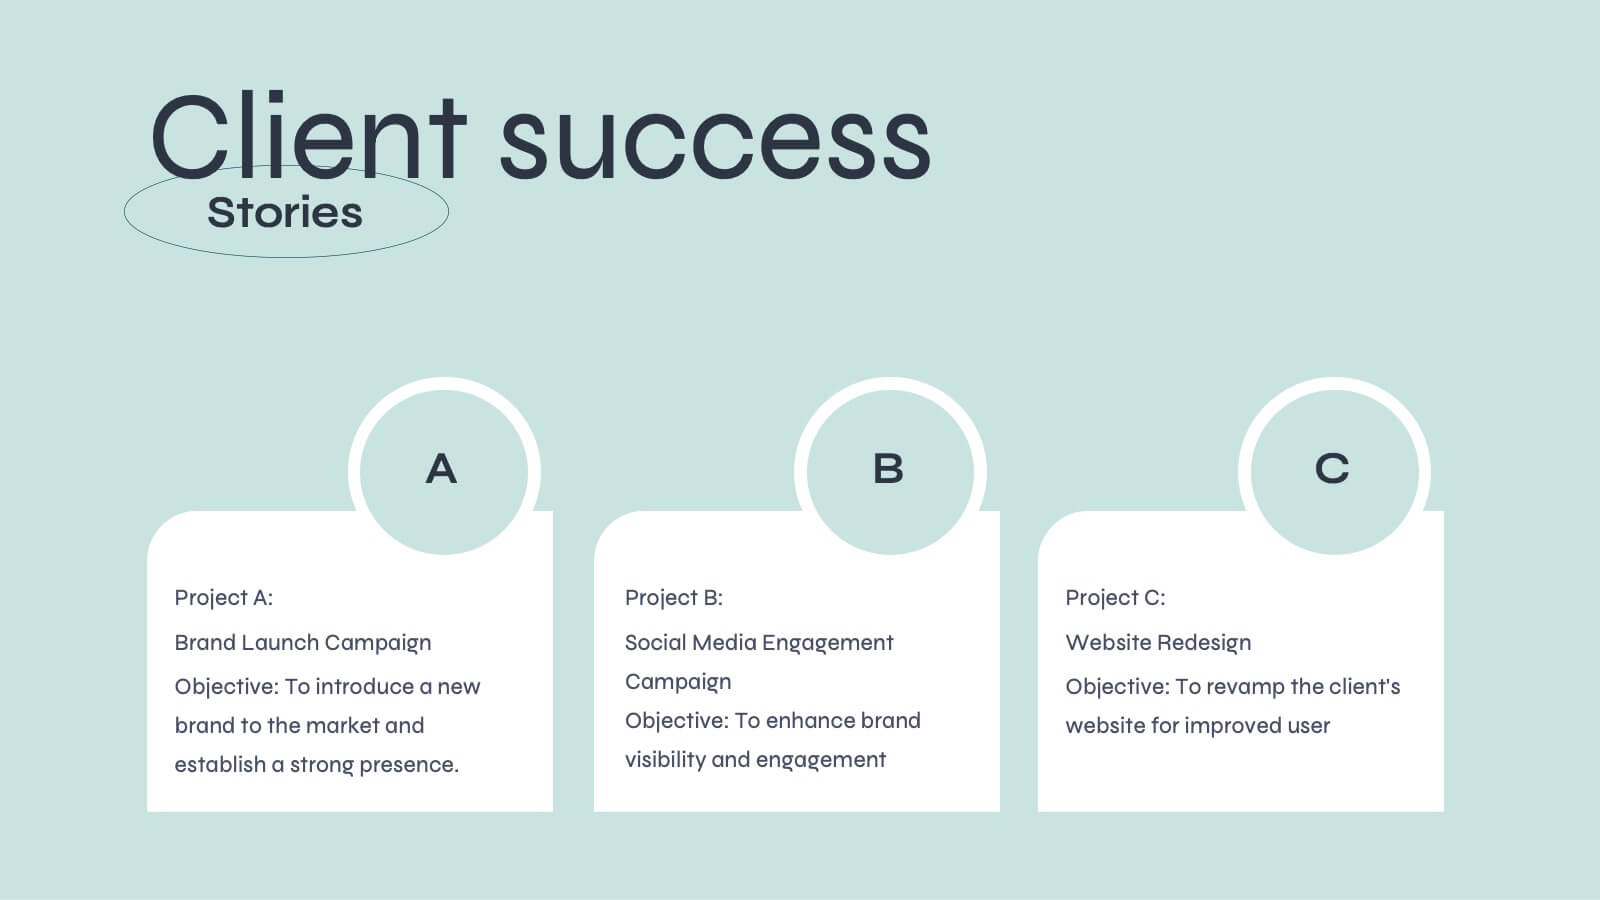
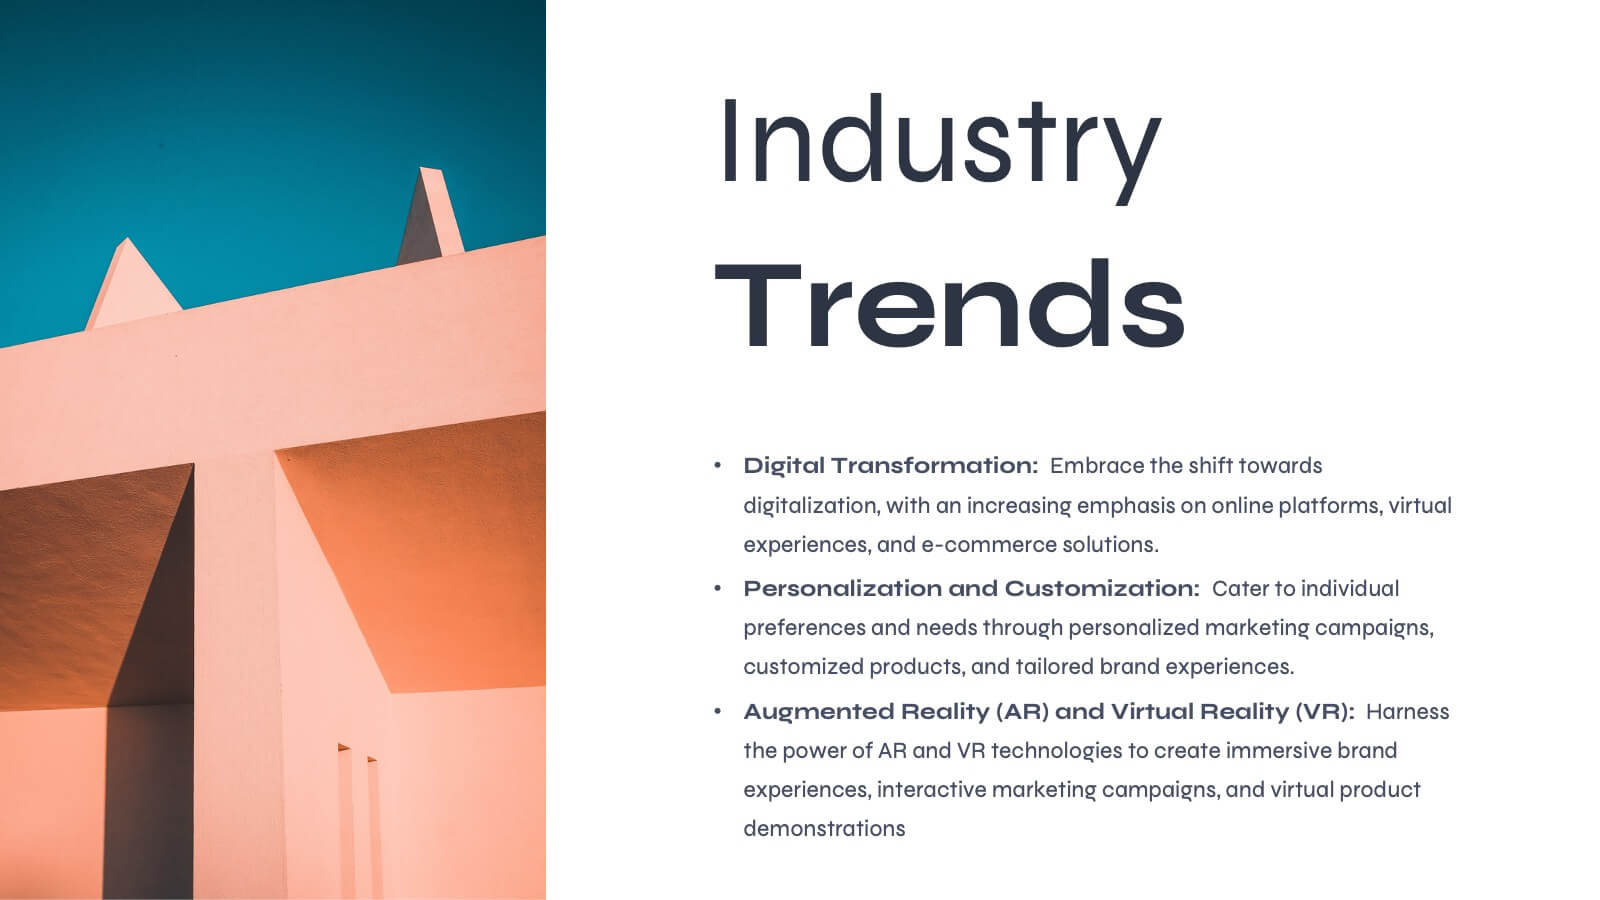
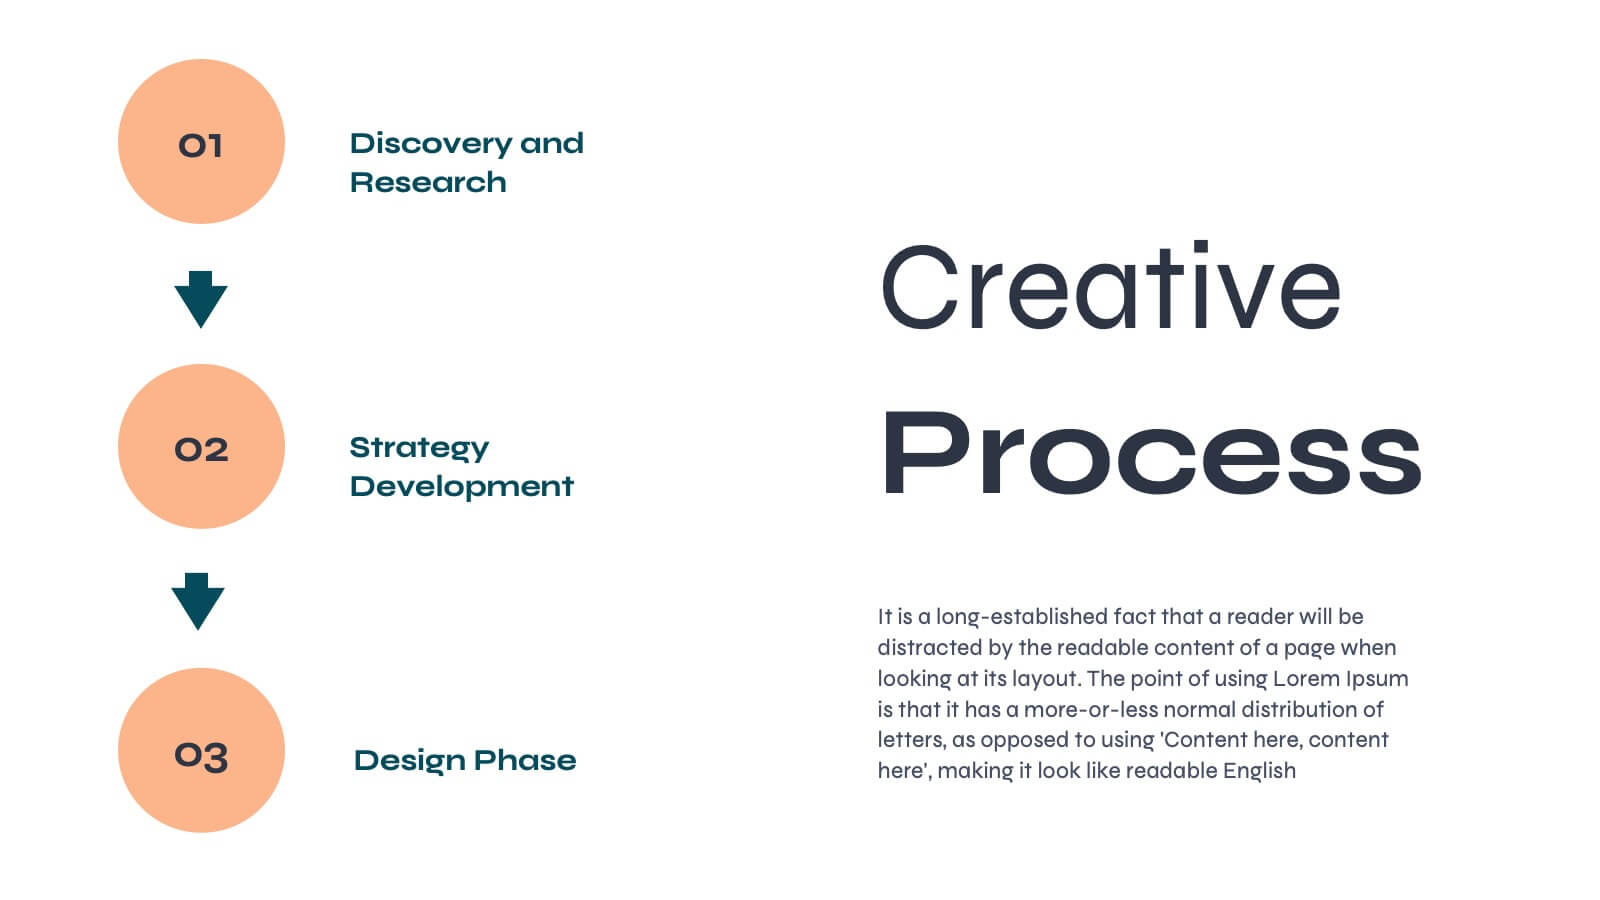
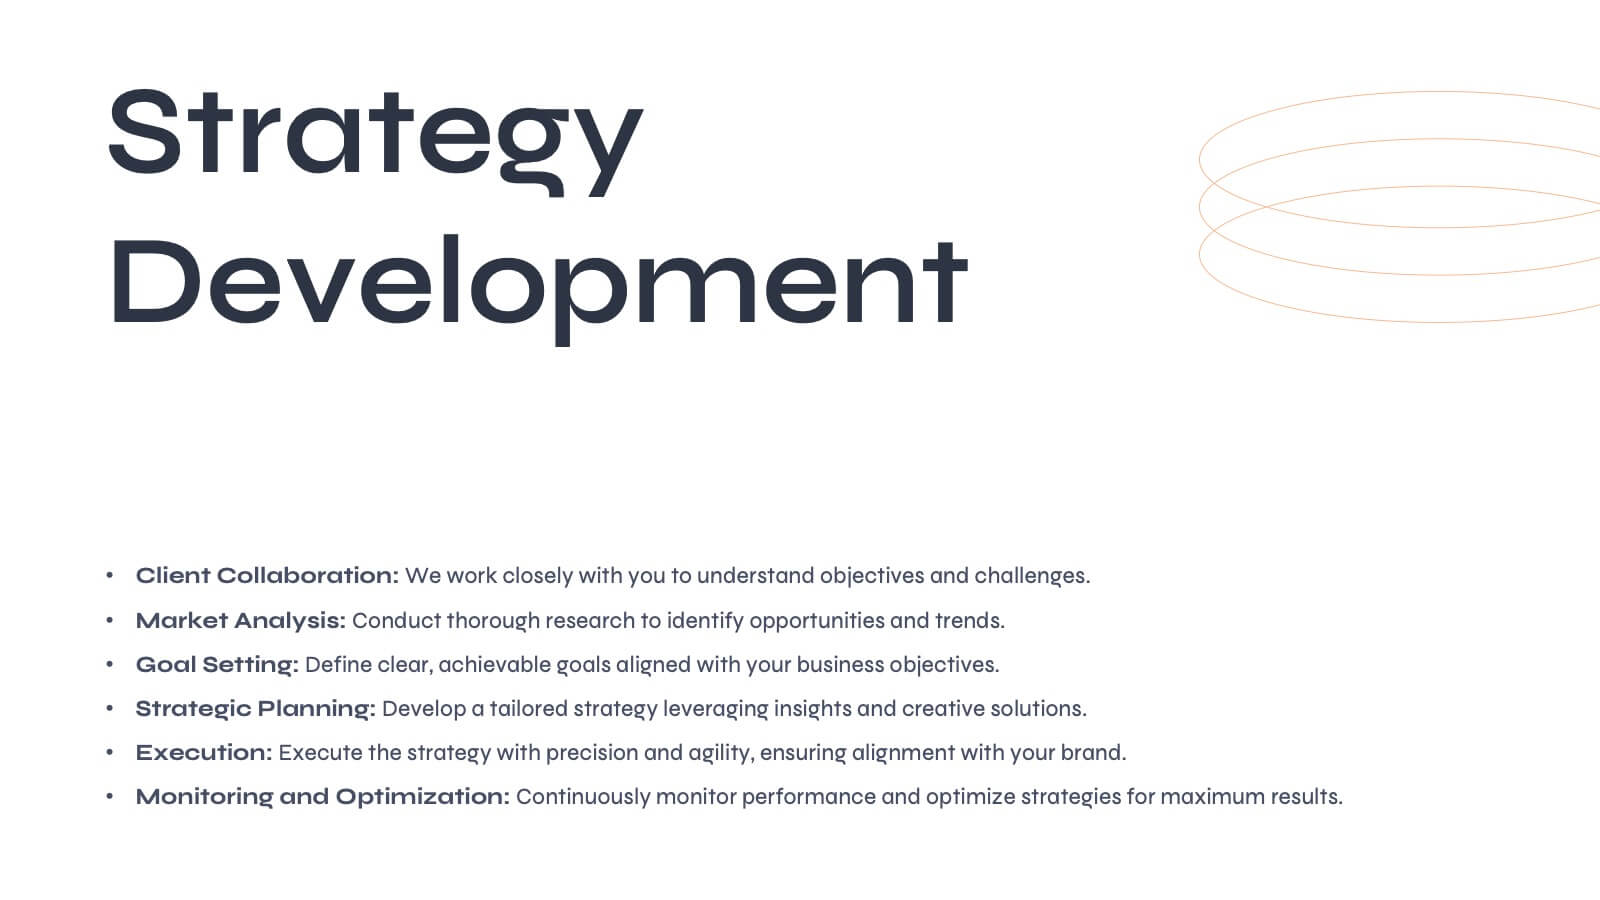
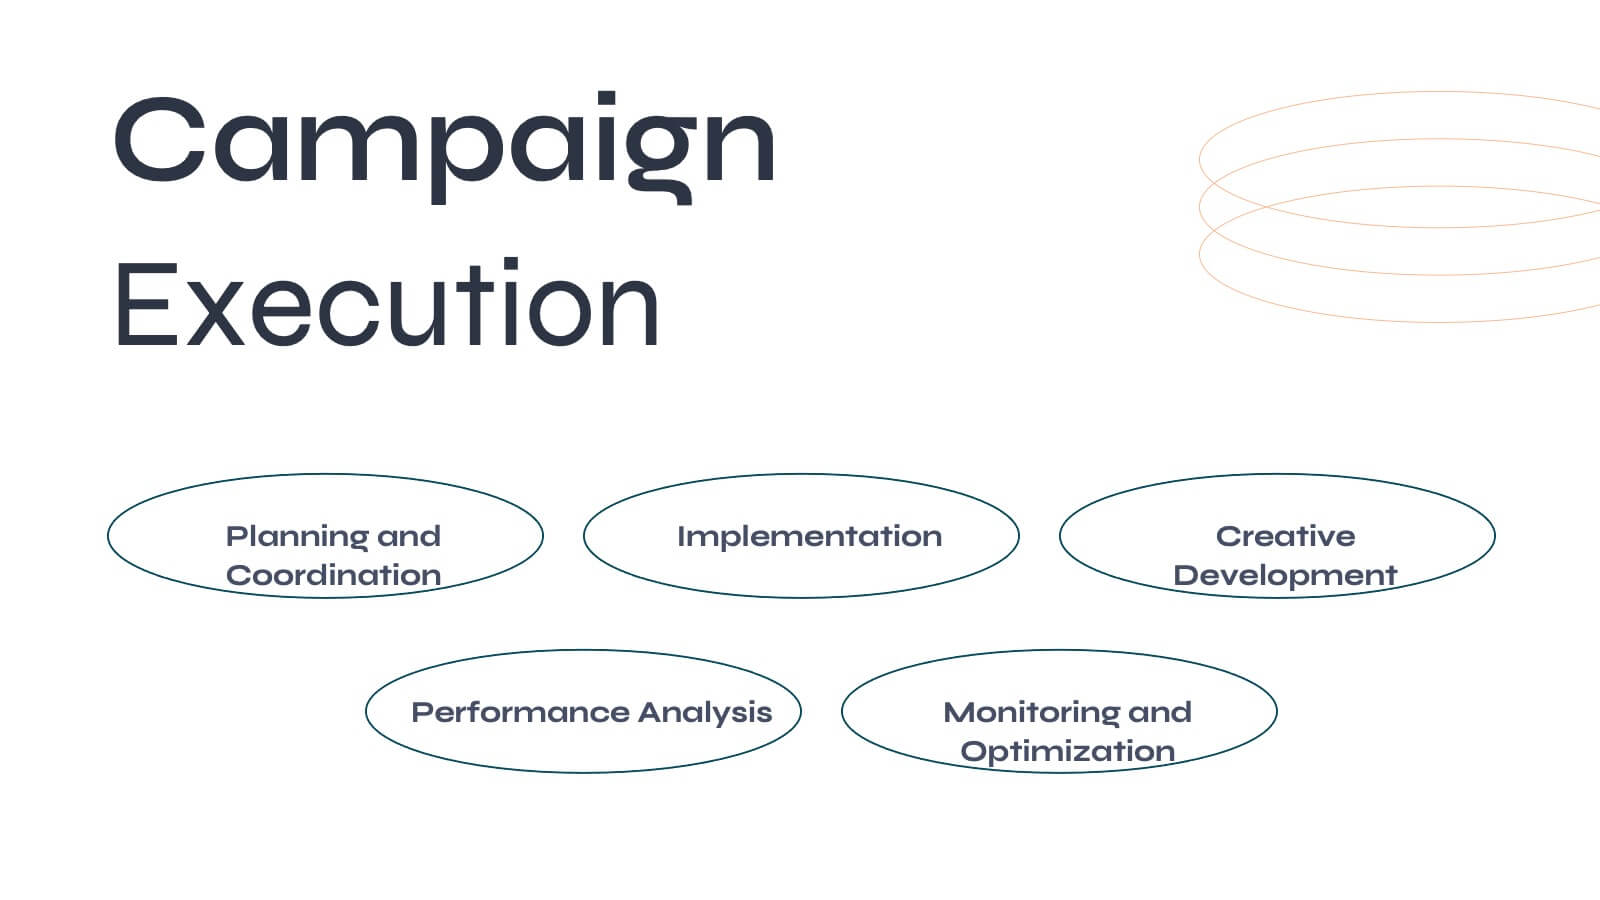
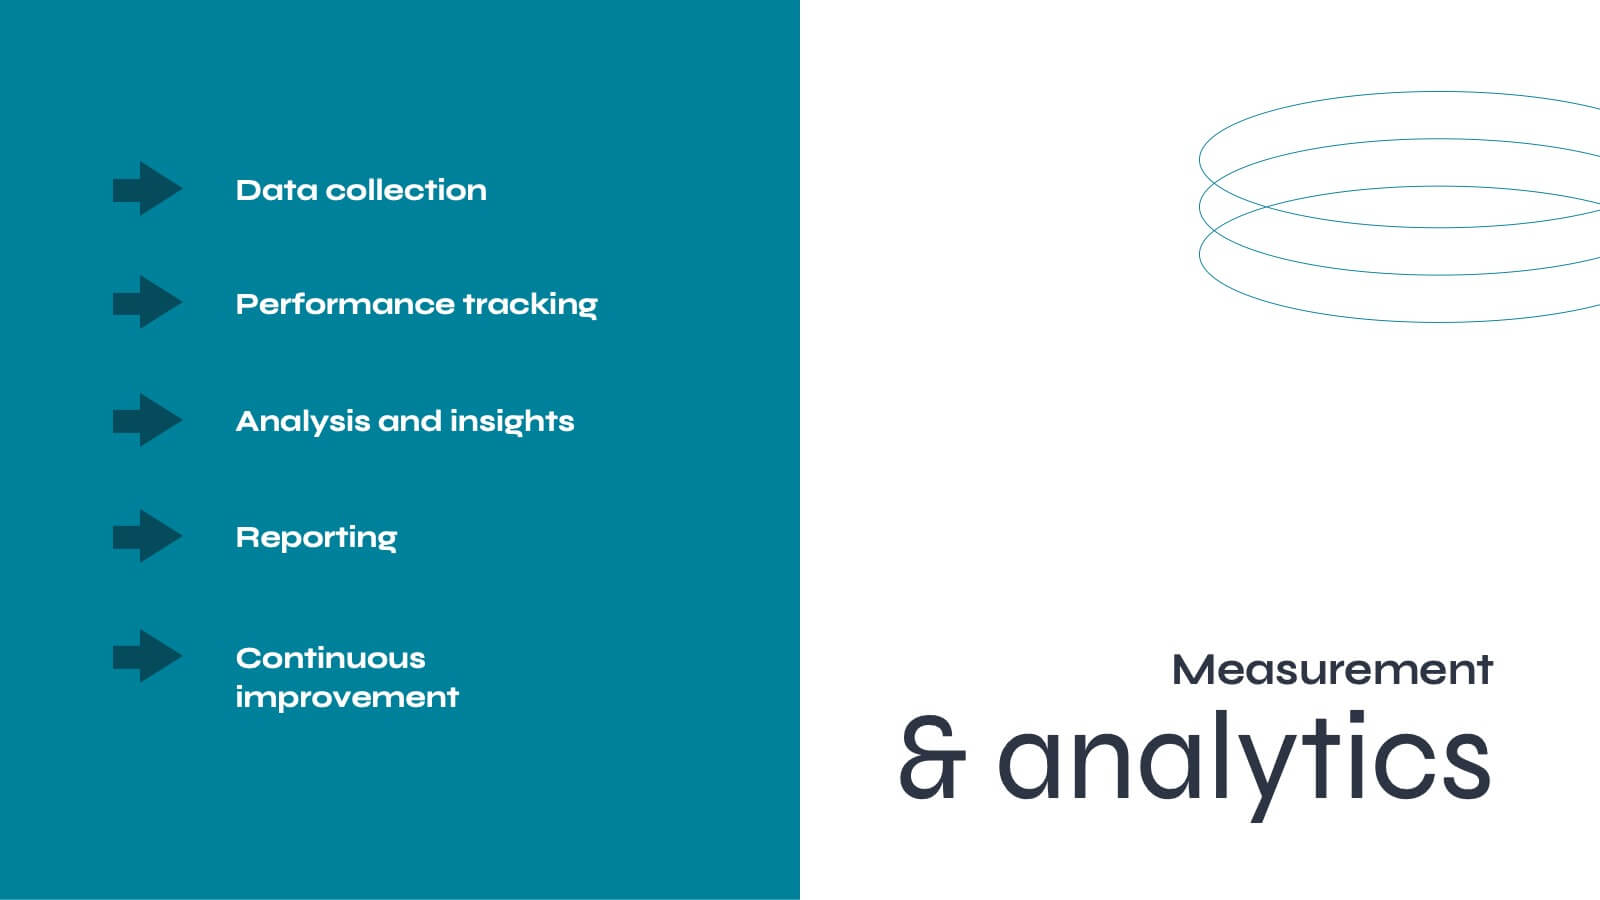
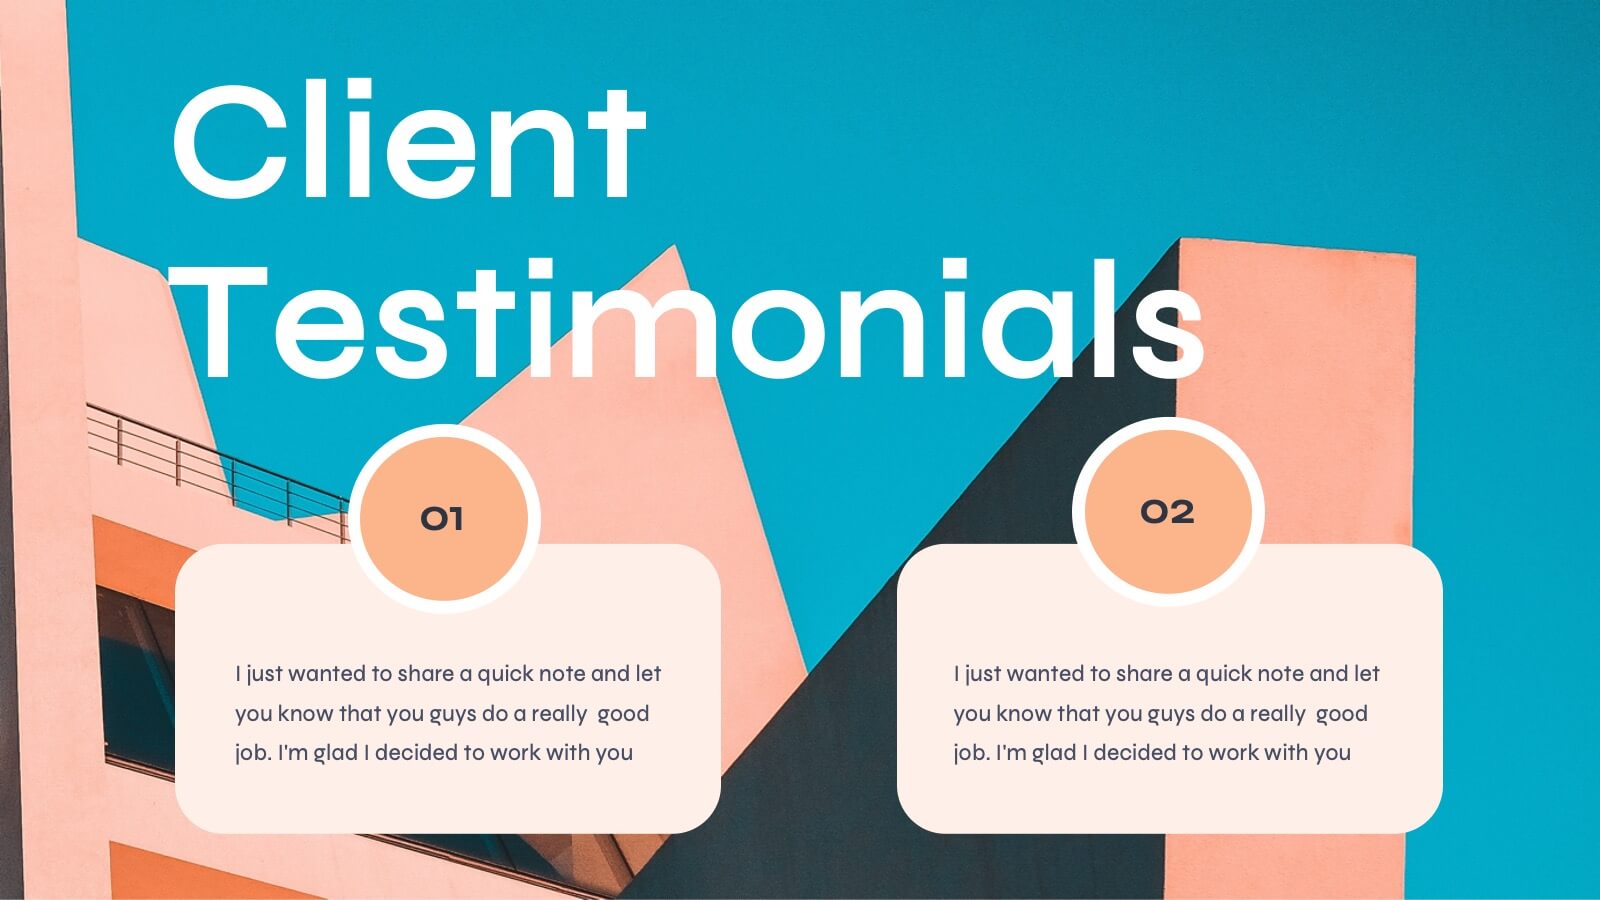
Showcase your agency's strengths with this polished, modern presentation template. Perfect for presenting market analysis, client success stories, and creative processes, it features a clean and professional design. Highlight your team's expertise and strategic approach to impress potential clients. Compatible with PowerPoint, Keynote, and Google Slides, it ensures seamless presentations on any platform.


12 slides
Geometric Shapes Design Slide Presentation
Make your content stand out with a bold, modern layout built from clean geometric forms that guide the viewer’s eye effortlessly. This presentation helps you organize ideas, highlight key points, and create a polished visual flow without distractions. Fully editable and compatible with PowerPoint, Keynote, and Google Slides.


26 slides
Carson Presentation Template
If you want a futuristic and bold design, this is the presentation template for you. The colors are bold and captivating to the eye. The font goes with technology and security. We designed the template to provide a magnificent structure for information. It's easy to use, resulting in high quality presentations. Since the colors are editable, you can personalize this presentation by adding colors that tie directly back to your company and its image. This template can be used for both personal use as well as professional use. Enhance your details with our Carson template for your next project.


4 slides
Freelancer Portfolio Showcase Presentation
Showcase your talents with this clean and modern portfolio slide. Featuring a photo placeholder, bold typography, and a vertical skill layout, it's perfect for freelancers and creatives. Easily customizable in PowerPoint, Keynote, or Google Slides—ideal for highlighting services, experience, and personal branding with a sleek, professional flair.


21 slides
Ecliptica Design Strategy Proposal Presentation
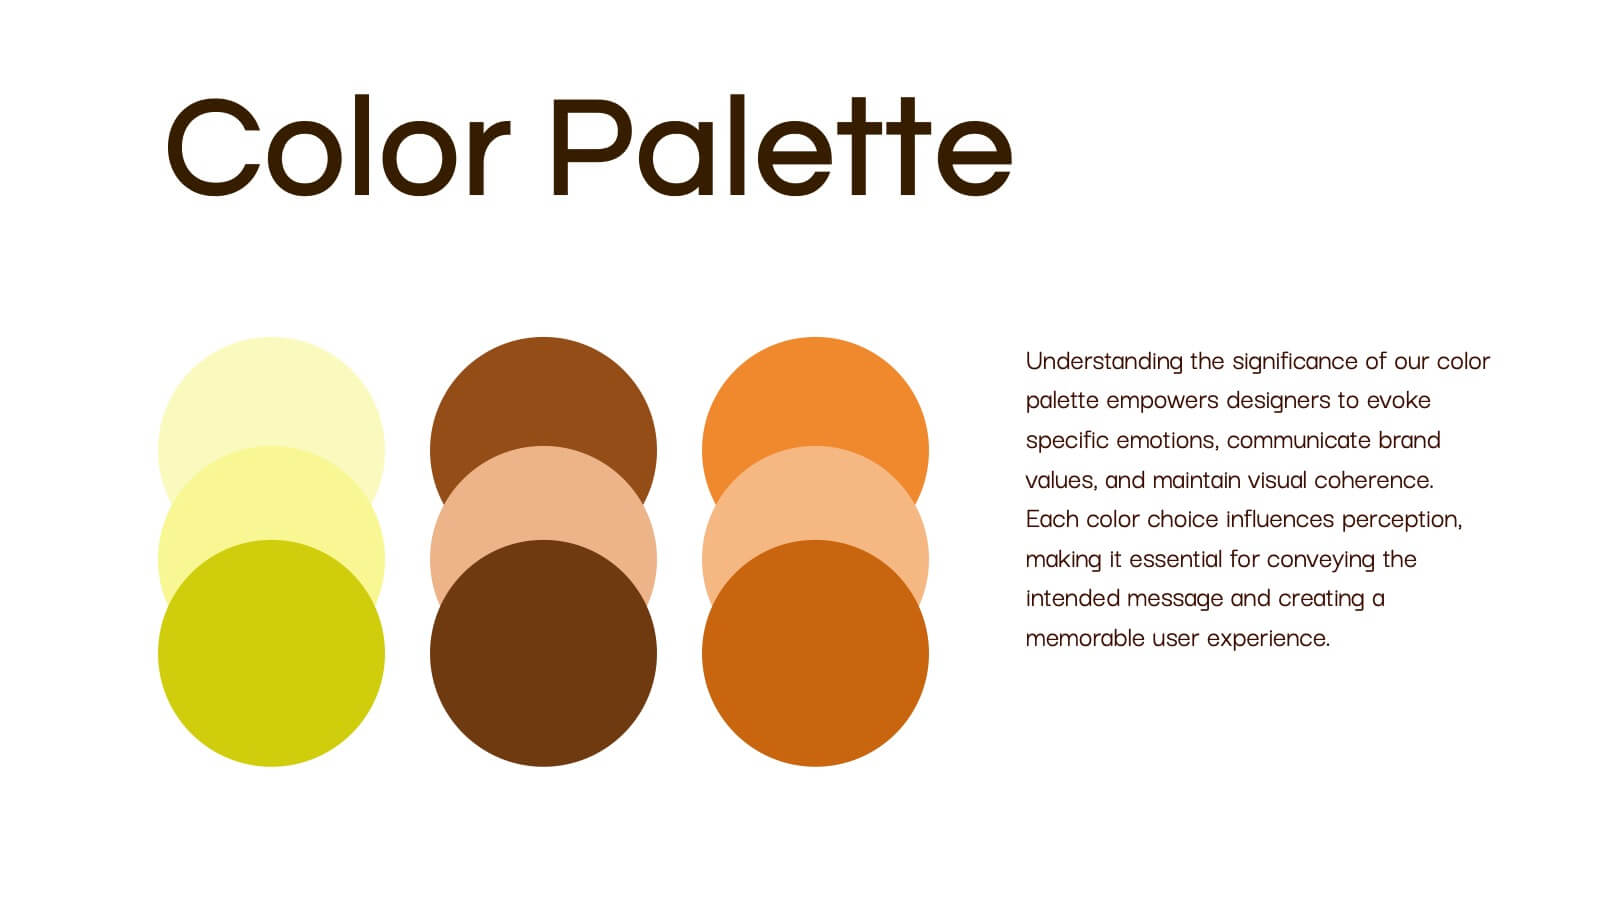
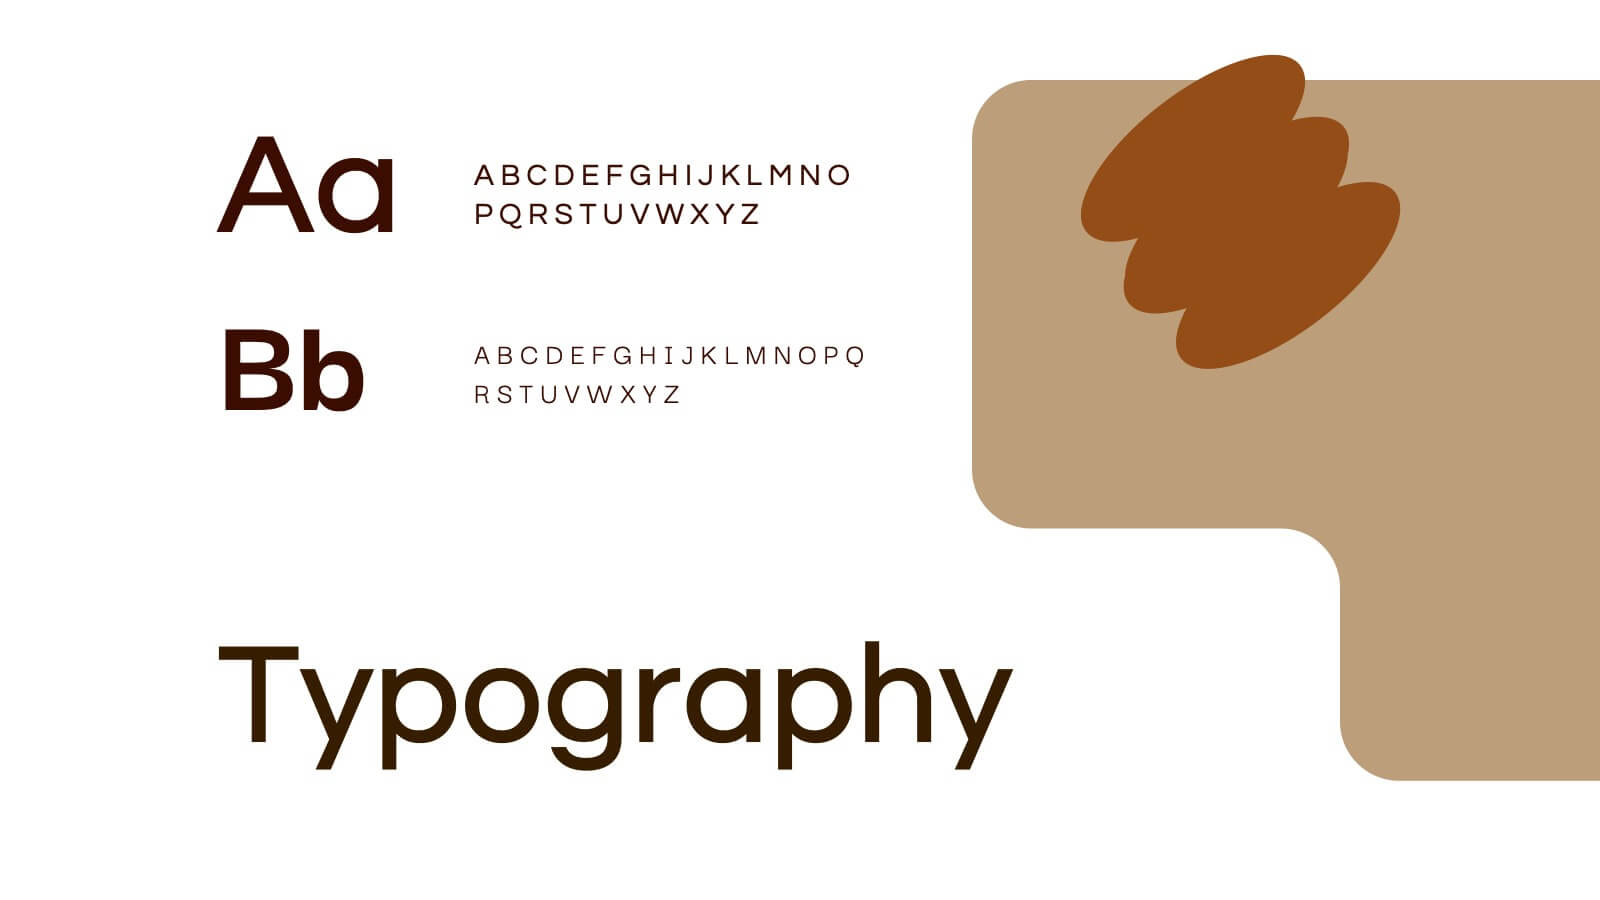
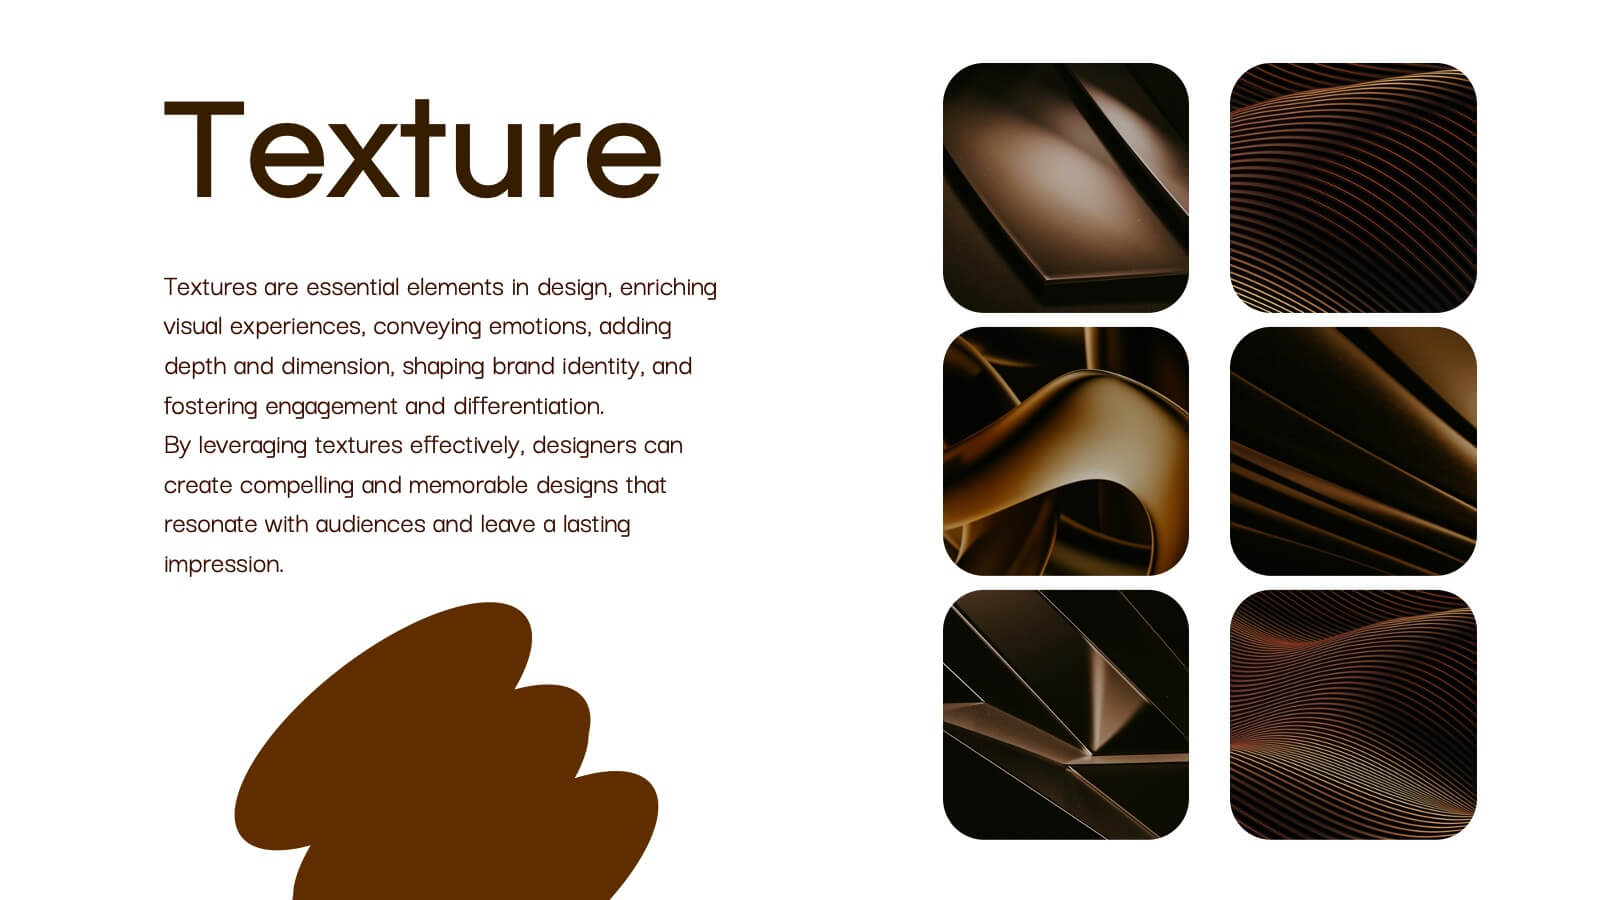
Elevate your design strategy proposals with this clean and professional presentation template. Featuring a structured layout, it covers essential sections like design briefs, target audience analysis, concept development, and final presentation deliverables. Visuals such as wireframes, design process breakdowns, and project timelines help convey your creative ideas effectively. With placeholders for typography, color schemes, and visual direction, this template is tailored for creative professionals, agencies, and designers. Easily adaptable to suit your branding needs, it's compatible with PowerPoint, Google Slides, and Keynote for seamless customization and presentation. Perfect for pitching new strategies or showcasing your design process.


7 slides
Agenda and Sections TOC Presentation
Bring your audience in with a dynamic, story-driven overview that makes each section feel intentional and easy to follow. This presentation highlights key agenda points in a clean, structured layout, helping you introduce topics with clarity and flow. Fully compatible with PowerPoint, Keynote, and Google Slides.


8 slides
Marketing Plan and Audience Targeting Presentation
Visualize your audience segmentation strategy with the Marketing Plan and Audience Targeting Presentation. This bullseye diagram template highlights three key focus areas, making it ideal for showcasing market research, targeting tactics, or funnel stages. Fully editable in Canva, PowerPoint, Keynote, and Google Slides to match your branding and goals.


4 slides
3-Tier Pricing Table Layout Presentation
Make your pricing pitch pop with this bold and modern layout! This presentation template is perfect for showcasing product or service plans with clear comparisons across three tiers. Designed to streamline pricing communication, it’s ideal for SaaS, consulting, or digital services. Fully compatible with PowerPoint, Keynote, and Google Slides.


4 slides
Pyramid Model Template for Strategy Presentation
Bring your strategic ideas to life with a bold layered visual that makes priorities and planning feel instantly clear. This presentation helps you break down concepts, illustrate hierarchy, and communicate long-term direction with confidence and simplicity. Fully compatible with PowerPoint, Keynote, and Google Slides.


12 slides
Compliance and Policy Management Presentation
Visualize your compliance ecosystem with the Compliance and Policy Management Presentation. Designed around a planetary orbit concept, this slide maps core policies at the center with surrounding regulations and enforcement layers. Each orbit can represent levels of governance, department roles, or regulatory zones—making it ideal for risk teams, auditors, and legal advisors. Fully customizable in PowerPoint, Keynote, and Google Slides for seamless use.


6 slides
User-Centered Design Thinking Model Presentation
Highlight the key phases of your design process with the User-Centered Design Thinking Model Presentation. This slide features a profile silhouette with a segmented circular path inside the head, clearly representing five sequential stages. Perfect for illustrating empathy-driven innovation, product development, or user experience workflows. Fully editable in Canva, PowerPoint, Google Slides, and Keynote.


23 slides
Dragonveil Product Launch Pitch Deck Presentation
The Product Launch Pitch Deck Presentation Template features 23 fully customizable slides designed to outline key aspects such as market opportunity, revenue model, and sales strategy. Ideal for startups and businesses launching new products, it ensures a compelling pitch. Compatible with PowerPoint, Keynote, and Google Slides.


4 slides
Aviation Industry Overview Presentation
Bring your data in for a smooth takeoff with this clean and modern visual layout. Perfect for presenting industry insights, market trends, or operational performance, this design helps convey complex information with clarity and flow. Fully editable and compatible with PowerPoint, Keynote, and Google Slides for seamless customization.


22 slides
Gale Gust Financial Report Presentation
Unleash the power of your financial presentations with the Gale Gust Financial Report template! This sleek, modern design features a captivating black theme that radiates professionalism and confidence. The layout is meticulously structured to guide your audience through key highlights, performance metrics, sales performance, and financial summaries with ease. Each slide is designed to keep the focus on your data, with clean lines and a minimalist aesthetic that enhances readability and impact. Whether you're showcasing operational updates, market trends, or strategic initiatives, this template ensures that your content shines. Ideal for corporate meetings, investor updates, and financial reviews, this template is fully compatible with PowerPoint, Keynote, and Google Slides. The Gale Gust template is your perfect companion for delivering financial reports that command attention and leave a lasting impression. Get ready to make your numbers speak volumes!


5 slides
Data-Driven Statistics Slide Presentation
Turn your numbers into a story that’s clear, bold, and easy to follow. This modern layout is perfect for presenting metrics, comparisons, or performance insights with precision and style. Customize colors, data, and text effortlessly—compatible with PowerPoint, Keynote, and Google Slides for seamless editing and presentation flexibility.