


Features
- 5 Unique slides
- Fully editable and easy to edit in Microsoft Powerpoint, Keynote and Google Slides
- 16:9 widescreen layout
- Clean and professional designs
- Export to JPG, PDF or send by email


Do you have any questions?
Recommend


6 slides
Trip Planning Framework and Schedule Presentation
Plan every detail of your journey with ease using this Trip Planning Framework and Schedule Presentation. This template includes dedicated sections for dates, destinations, transportation, to-do lists, and shopping needs, all structured in a clean and colorful layout. Ideal for travel agents, personal planners, and group trip organizers. Fully editable in PowerPoint, Keynote, and Google Slides.


4 slides
Iceberg Metaphor Diagram Presentation
Make your message feel deeper and more intriguing with a visual that instantly shows there’s more beneath the surface. This presentation helps you highlight hidden factors, core insights, and layered data using a clear, structured iceberg illustration. Ideal for strategy, analysis, and storytelling. Fully compatible with PowerPoint, Keynote, and Google Slides.


7 slides
Money Market Infographic
The money market is a sector of the financial market where short-term borrowing and lending occur, typically in the form of highly liquid and low-risk instruments. Navigate the financial landscape with our Money Market Infographic. This colorful and informative template is designed to help you understand the dynamics of the money market, empowering you to make sound financial decisions. Compatible with Powerpoint, Keynote, and Google Slides. This infographic demystifies the money market, offering valuable insights and knowledge to help you navigate the world of investments and financial growth.


5 slides
USA Regional Map Slide Presentation
Bring your data to life with a bold, colorful snapshot of regional insights across the United States. This presentation makes it easy to highlight state-level trends, compare demographics, and visualize performance using clean map graphics and simple icons. Fully compatible with PowerPoint, Keynote, and Google Slides.


4 slides
Ishikawa Diagram for Process Review Presentation
Visualize cause-and-effect relationships with the Ishikawa Diagram for Process Review Presentation. Also known as a fishbone diagram, this template is perfect for identifying potential root causes during quality control or team brainstorming sessions. Easily editable in Canva, PowerPoint, and Google Slides to match your workflow and style.


20 slides
Miragyn Project Proposal Presentation
Showcase your project proposal with confidence using this visually appealing and structured template. Featuring a clear layout, it includes slides for project summaries, problem statements, and proposed solutions, allowing you to effectively communicate your vision and strategy. This template highlights essential details such as objectives and goals, timeline and milestones, and budget breakdown, making it ideal for delivering concise and impactful proposals. It also includes dedicated sections for team expertise, client testimonials, and terms and conditions, ensuring every aspect of your project is covered. Fully editable and compatible with PowerPoint, Google Slides, and Keynote, this template is perfect for professionals aiming to leave a lasting impression with their project presentations.


5 slides
Group Dynamics and Work Roles Presentation
Visualize team roles and responsibilities clearly with the Group Dynamics and Work Roles Presentation. This horizontal timeline layout highlights individual contributions and their position in the workflow, making it ideal for team structure, leadership roles, or project stages. Fully editable in Canva, PowerPoint, or Google Slides for smooth collaboration.


6 slides
Multiple Choice Options Slide Presentation
Make your ideas stand out with a bold, interactive design that organizes multiple options clearly and visually. Ideal for showcasing comparisons, scenarios, or decision pathways, this presentation keeps audiences engaged and informed. Fully compatible with PowerPoint, Keynote, and Google Slides for seamless customization and professional results.


4 slides
Editable Table Chart Presentation
Simplify side-by-side evaluations with the Editable Table Chart Presentation. Designed for clear comparisons, this layout uses checkmarks, icons, and a clean structure to display features or data across multiple categories. It's perfect for showcasing product options, service tiers, or strategic alternatives. Fully customizable and compatible with PowerPoint, Keynote, and Google Slides.


5 slides
2024 Financial Report Summary Presentation
Turn complex financial data into a clear visual story that’s easy to follow and engaging to present. This clean, data-focused design helps highlight yearly performance, key insights, and budget breakdowns with precision. Fully editable and compatible with PowerPoint, Keynote, and Google Slides for effortless customization and presentation delivery.

24 slides
Banshee Business Operations Plan Presentation
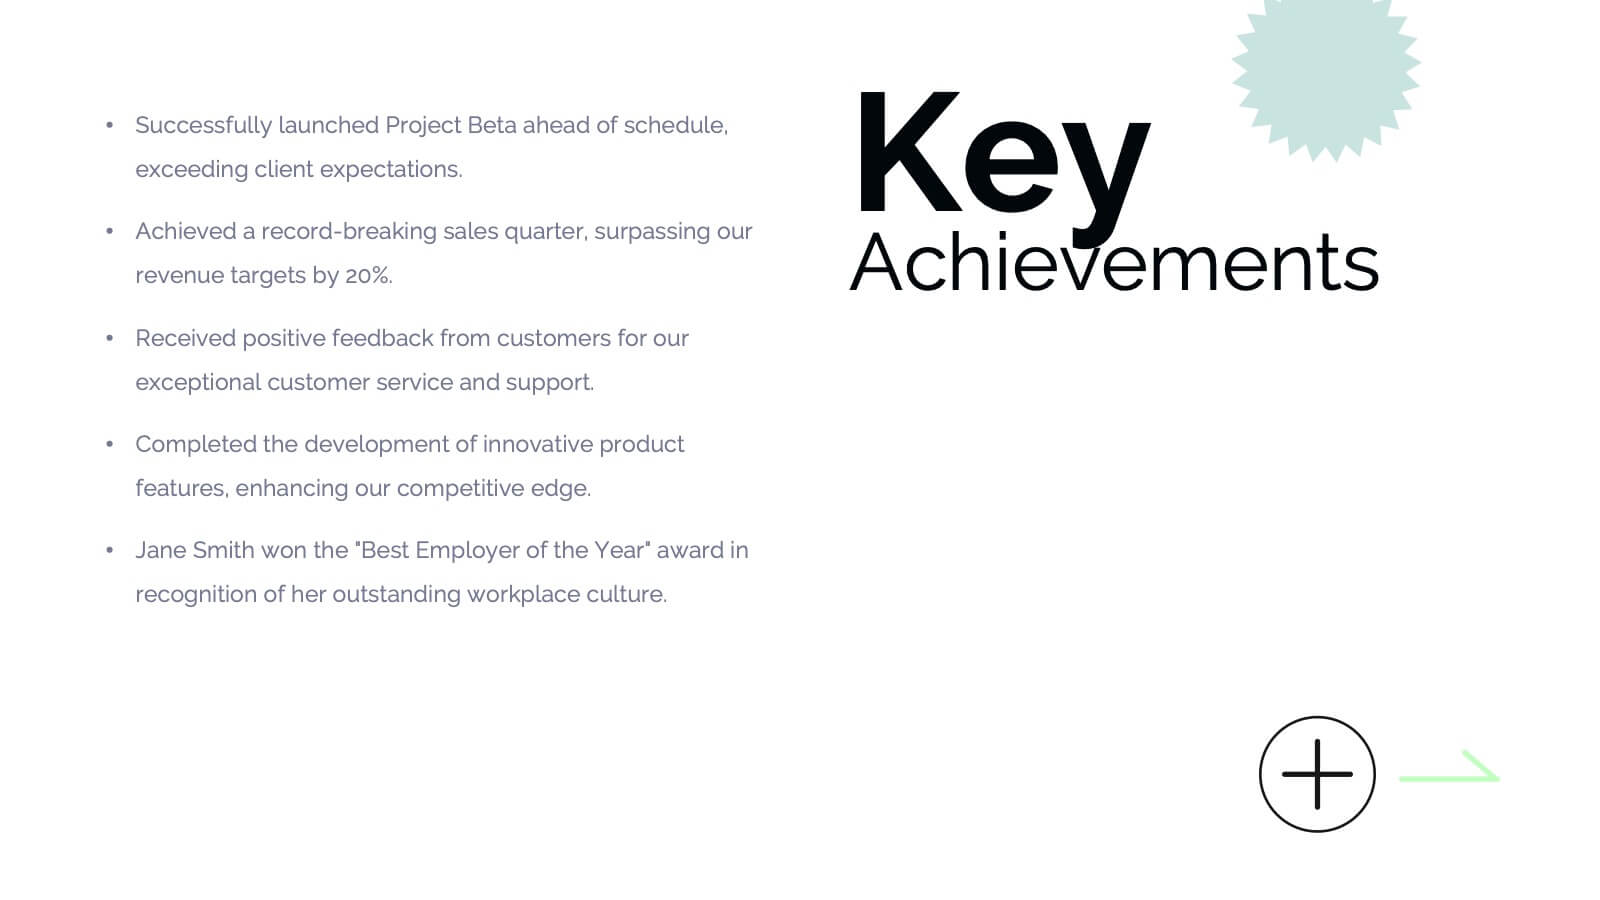
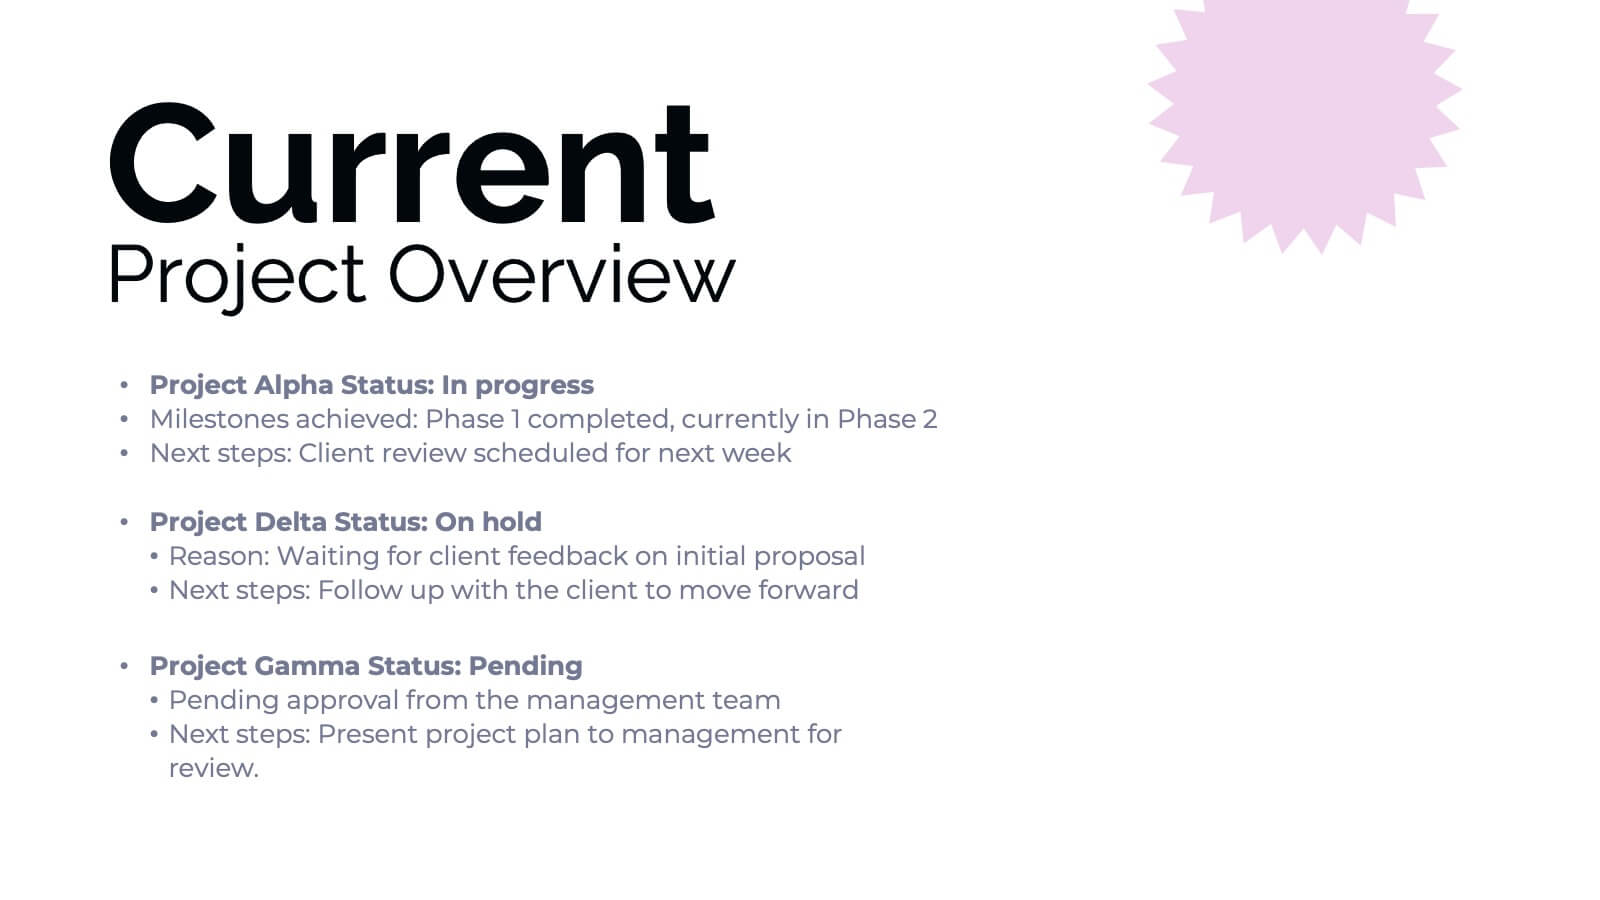
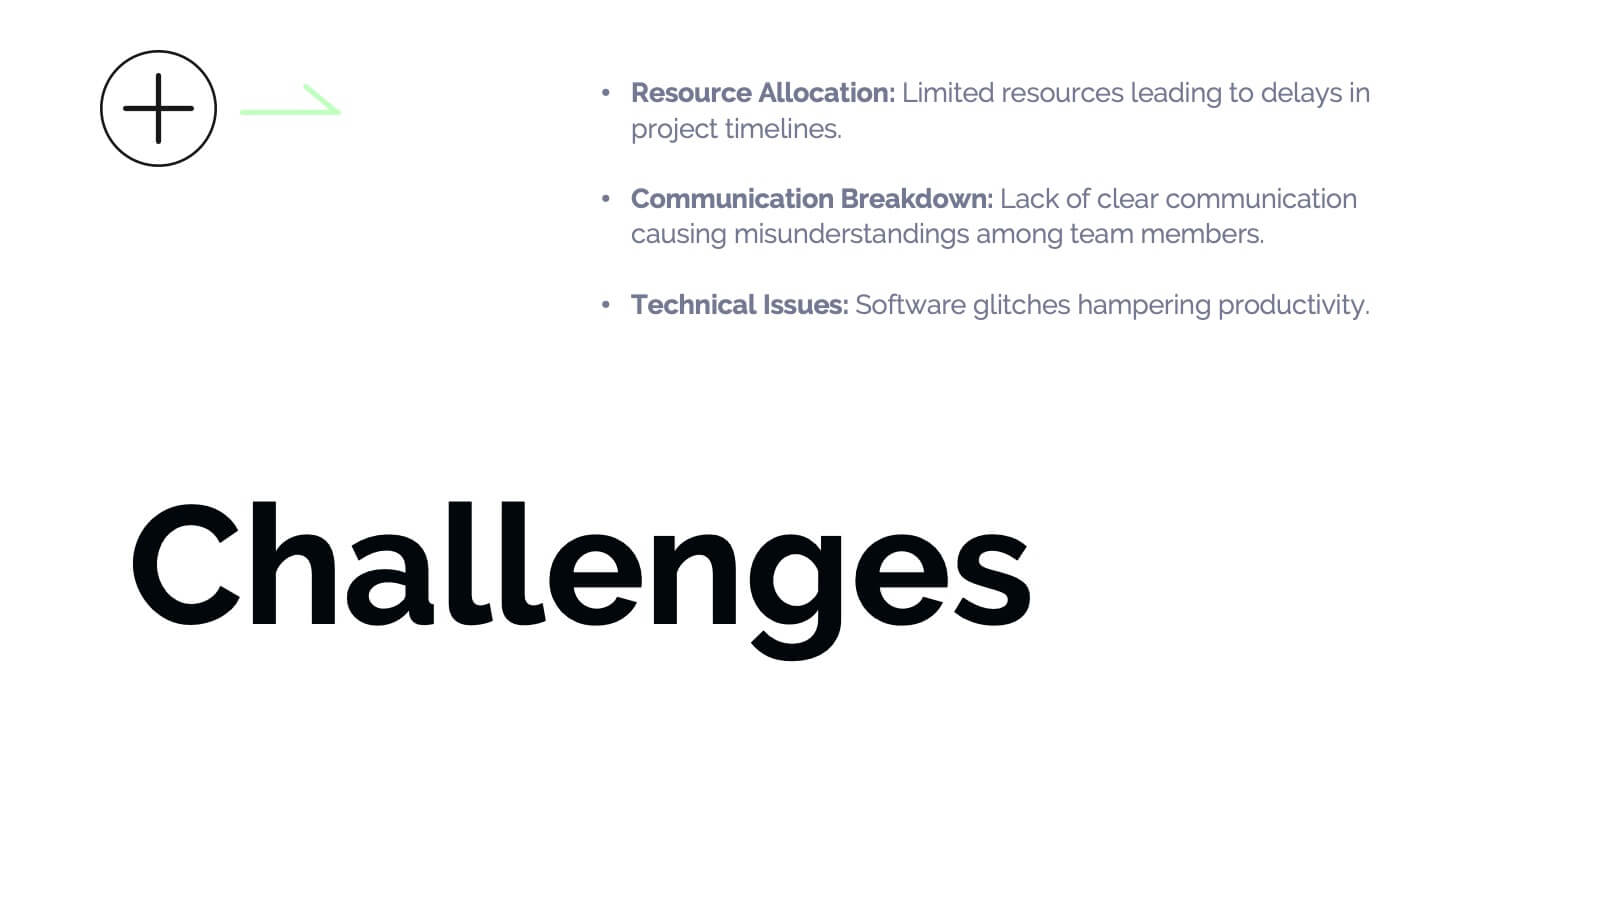
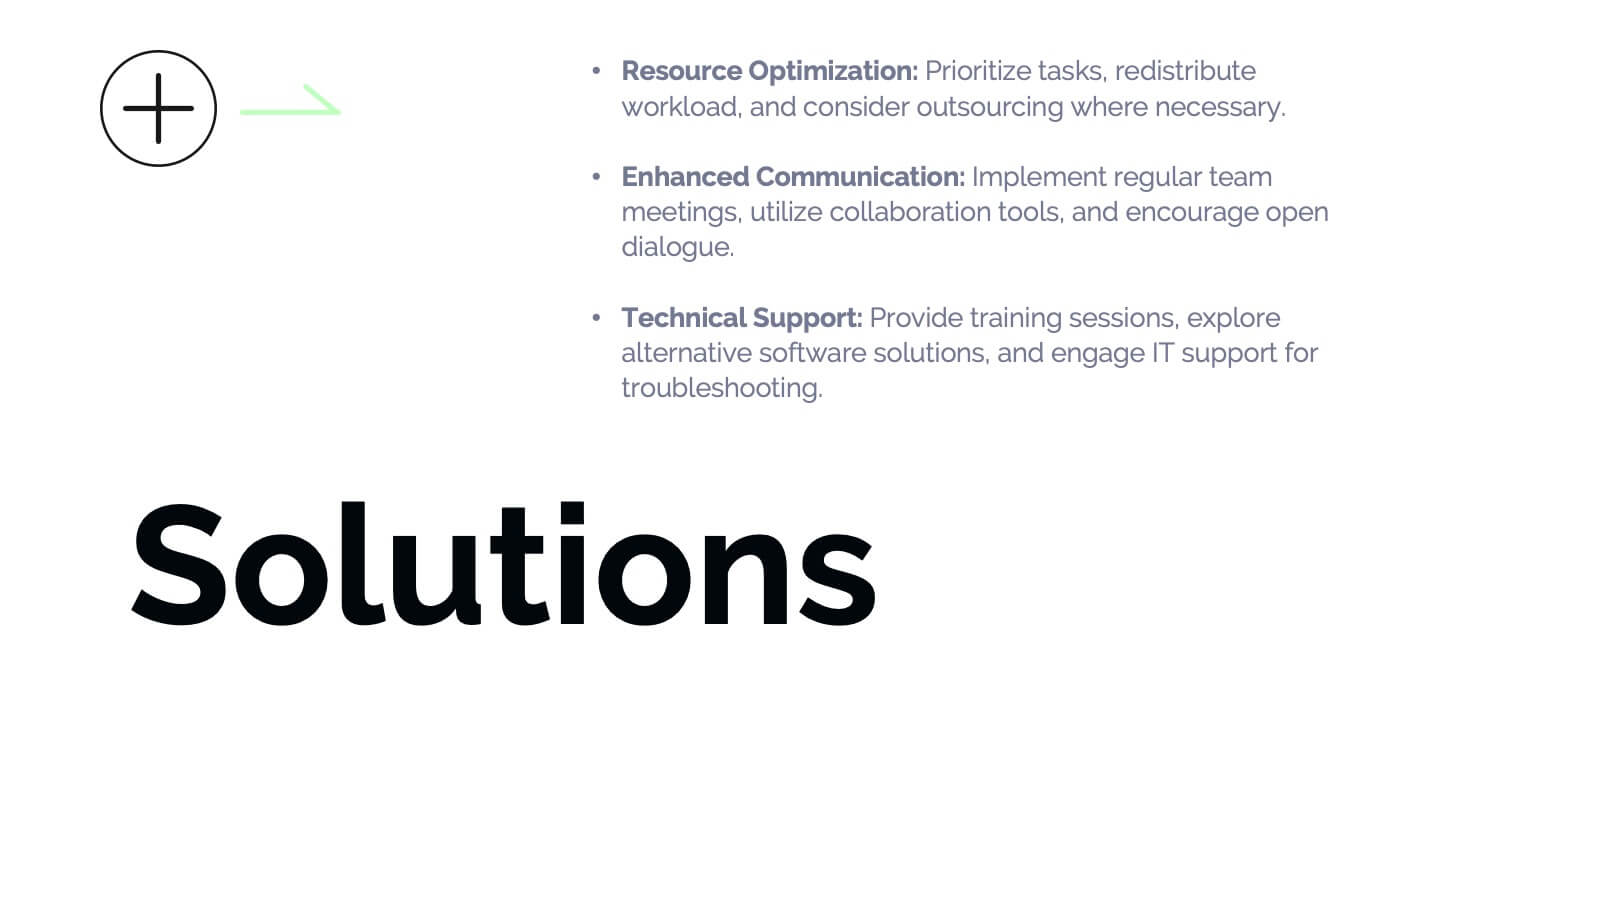
Streamline your business operations with this comprehensive presentation template! From team updates and key achievements to challenges and solutions, every aspect of your business plan is covered. Ideal for tracking performance metrics, resource allocation, and upcoming events, this design keeps your operations organized and efficient. Compatible with PowerPoint, Keynote, and Google Slides for seamless integration.


5 slides
Easy Dinner Recipes Infographics
Easy Dinner Recipes offer a practical solution for busy individuals or those who are new to cooking. These infographic templates offer a practical resource for meal planning and preparation. Its visually appealing design, clear instructions, and organized layout make it easy to follow and implement. Whether for personal use or as a presentation tool in cooking classes this template simplifies the process of discovering and trying out delicious dinner recipes. Use these to provide a collection of quick and delicious dinner recipes. This is designed to make meal planning easier, providing step-by-step instructions, ingredient lists, and visuals.


6 slides
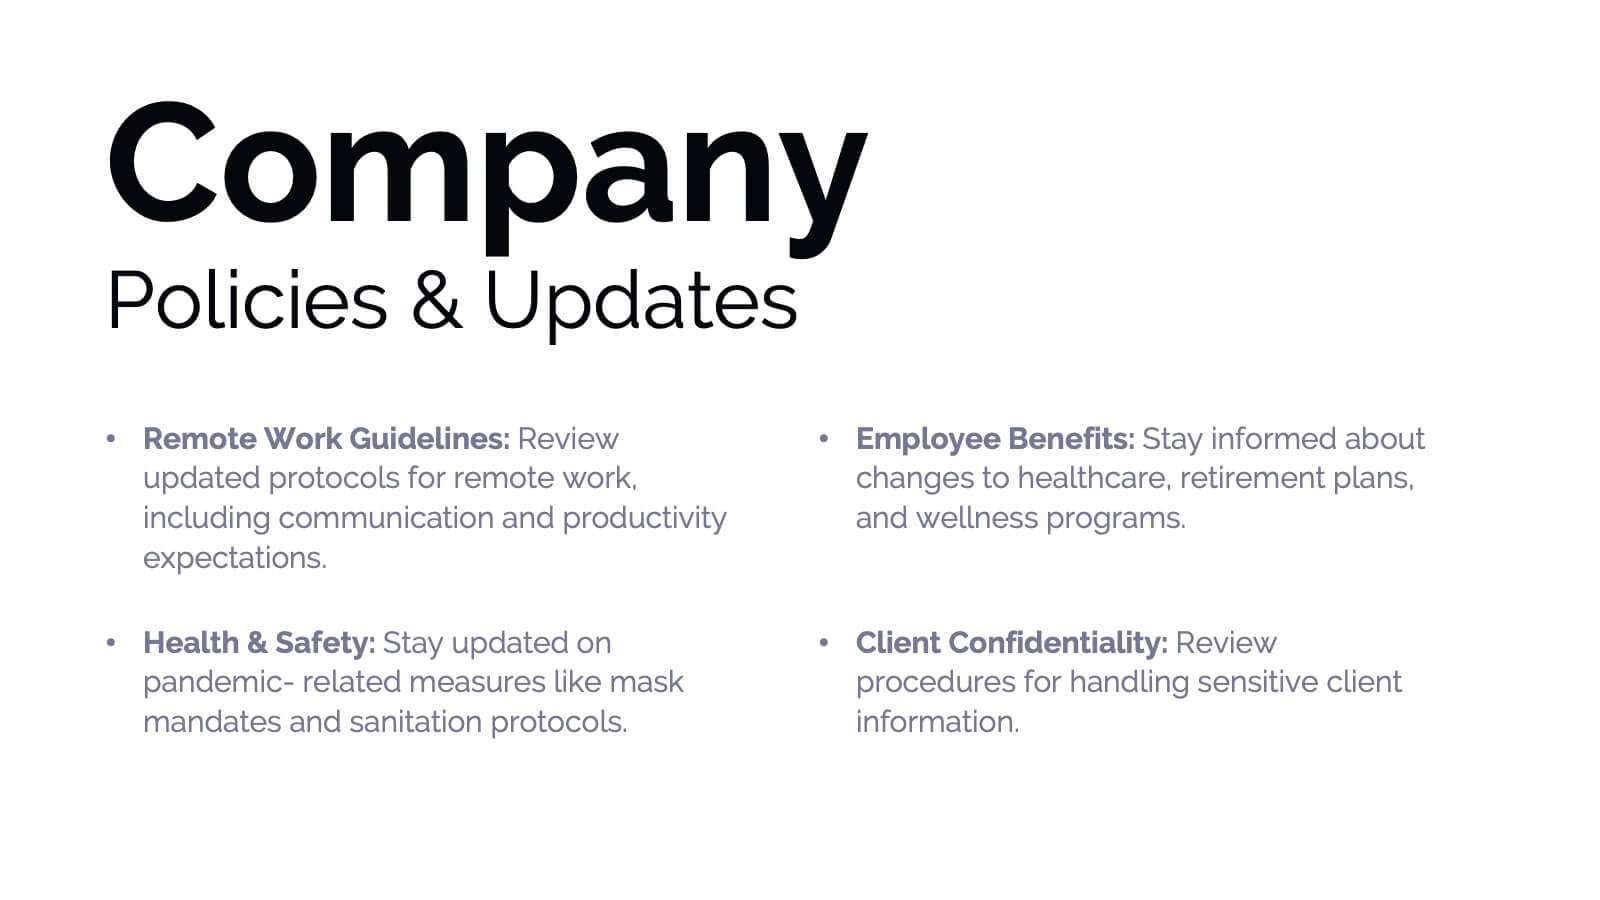
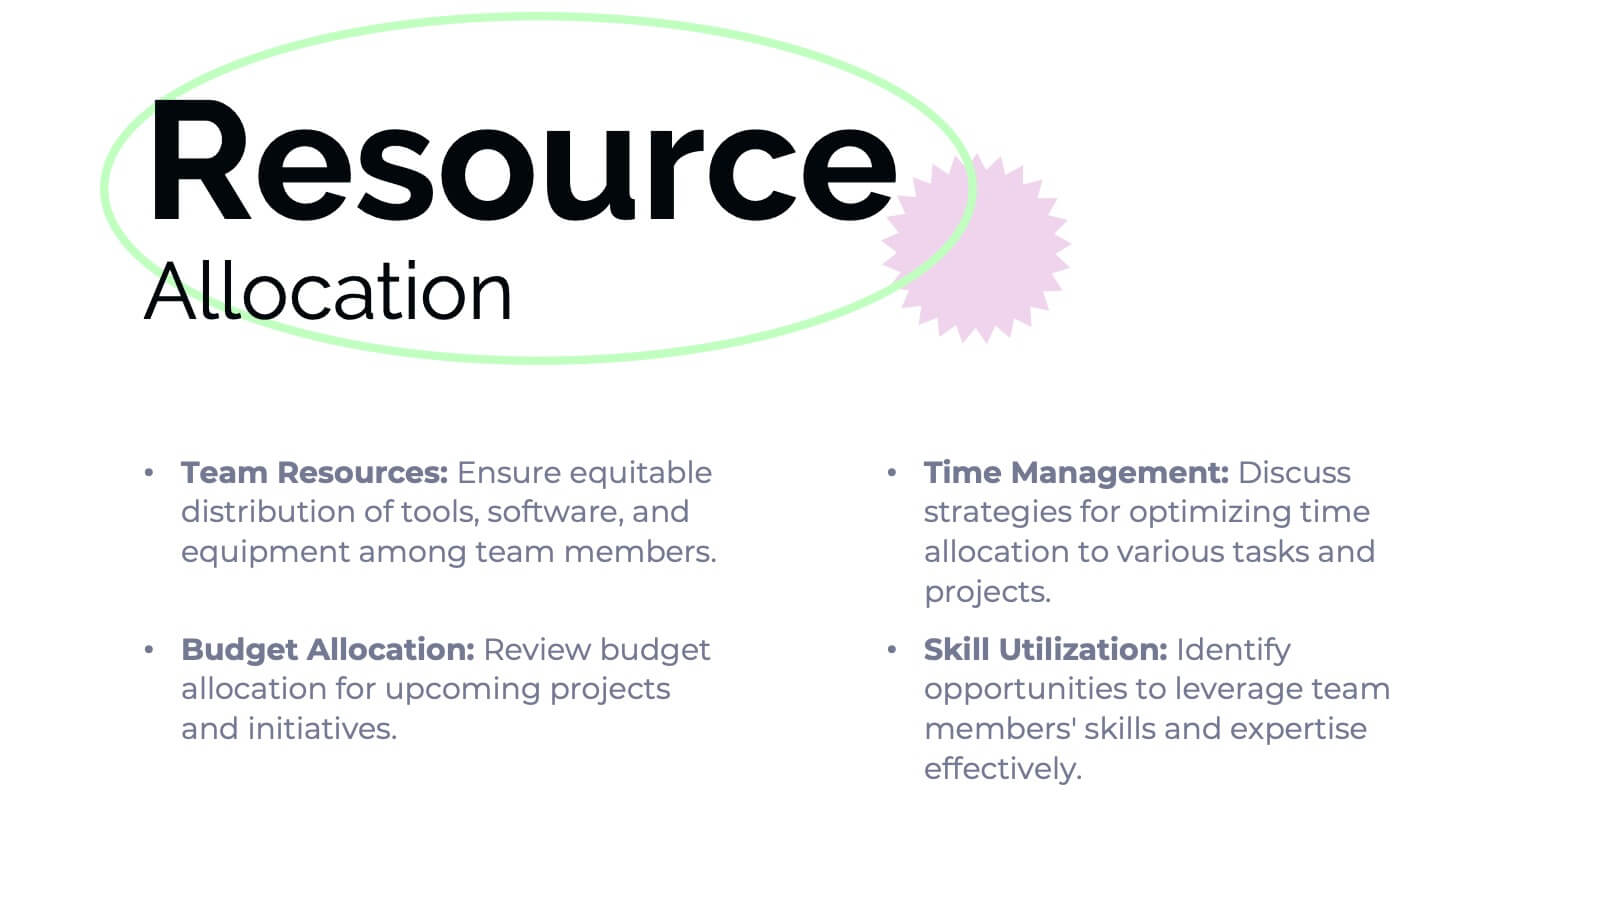
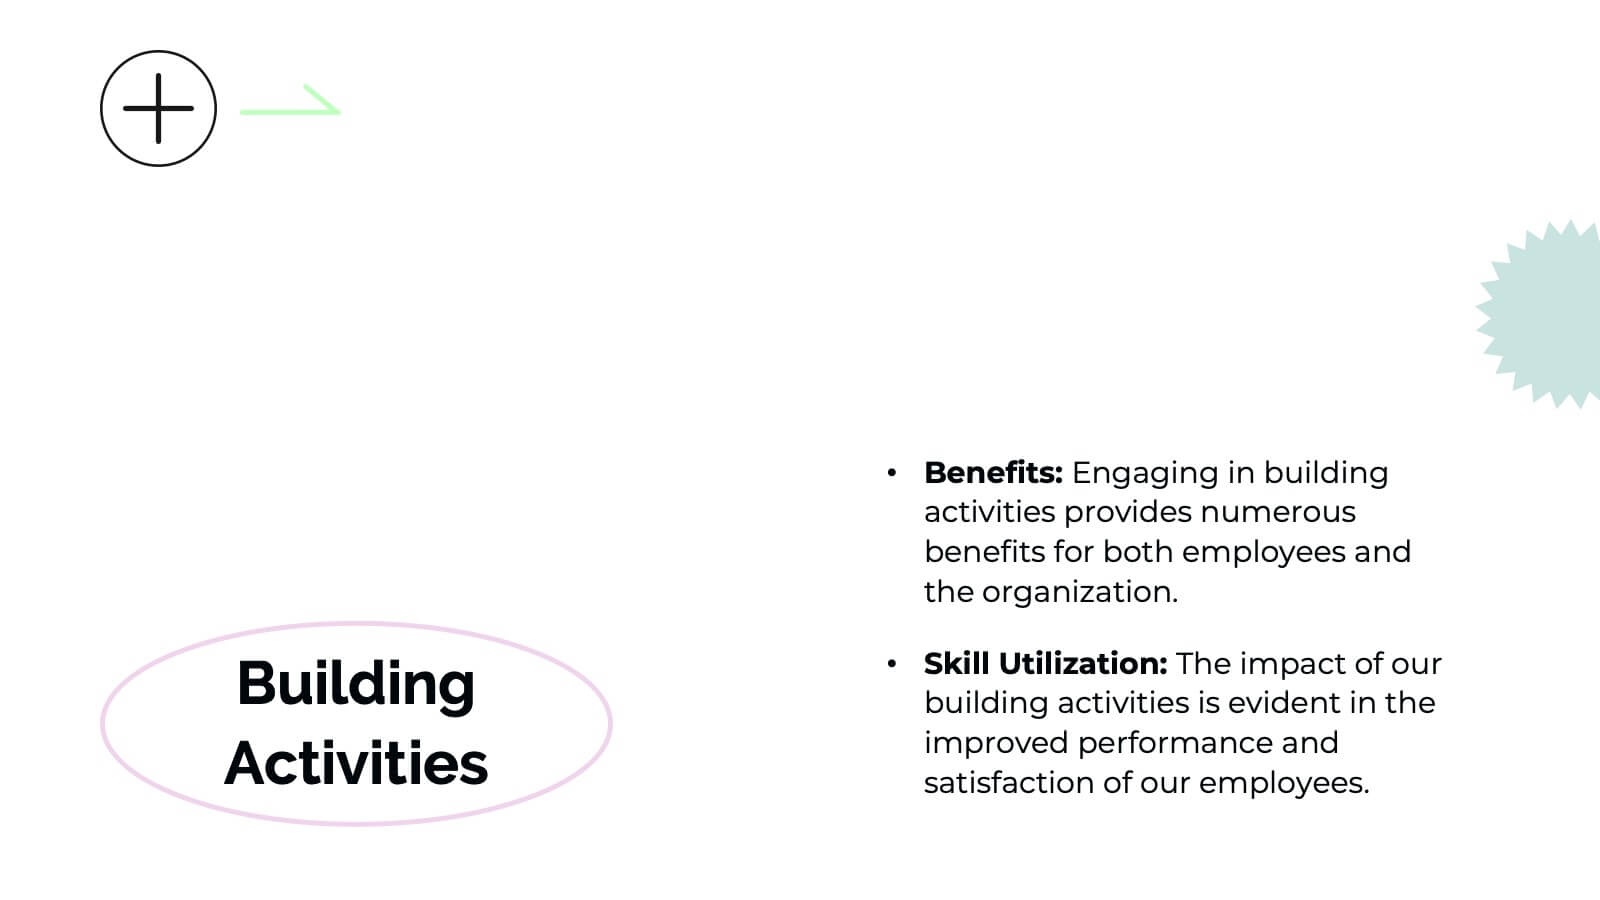
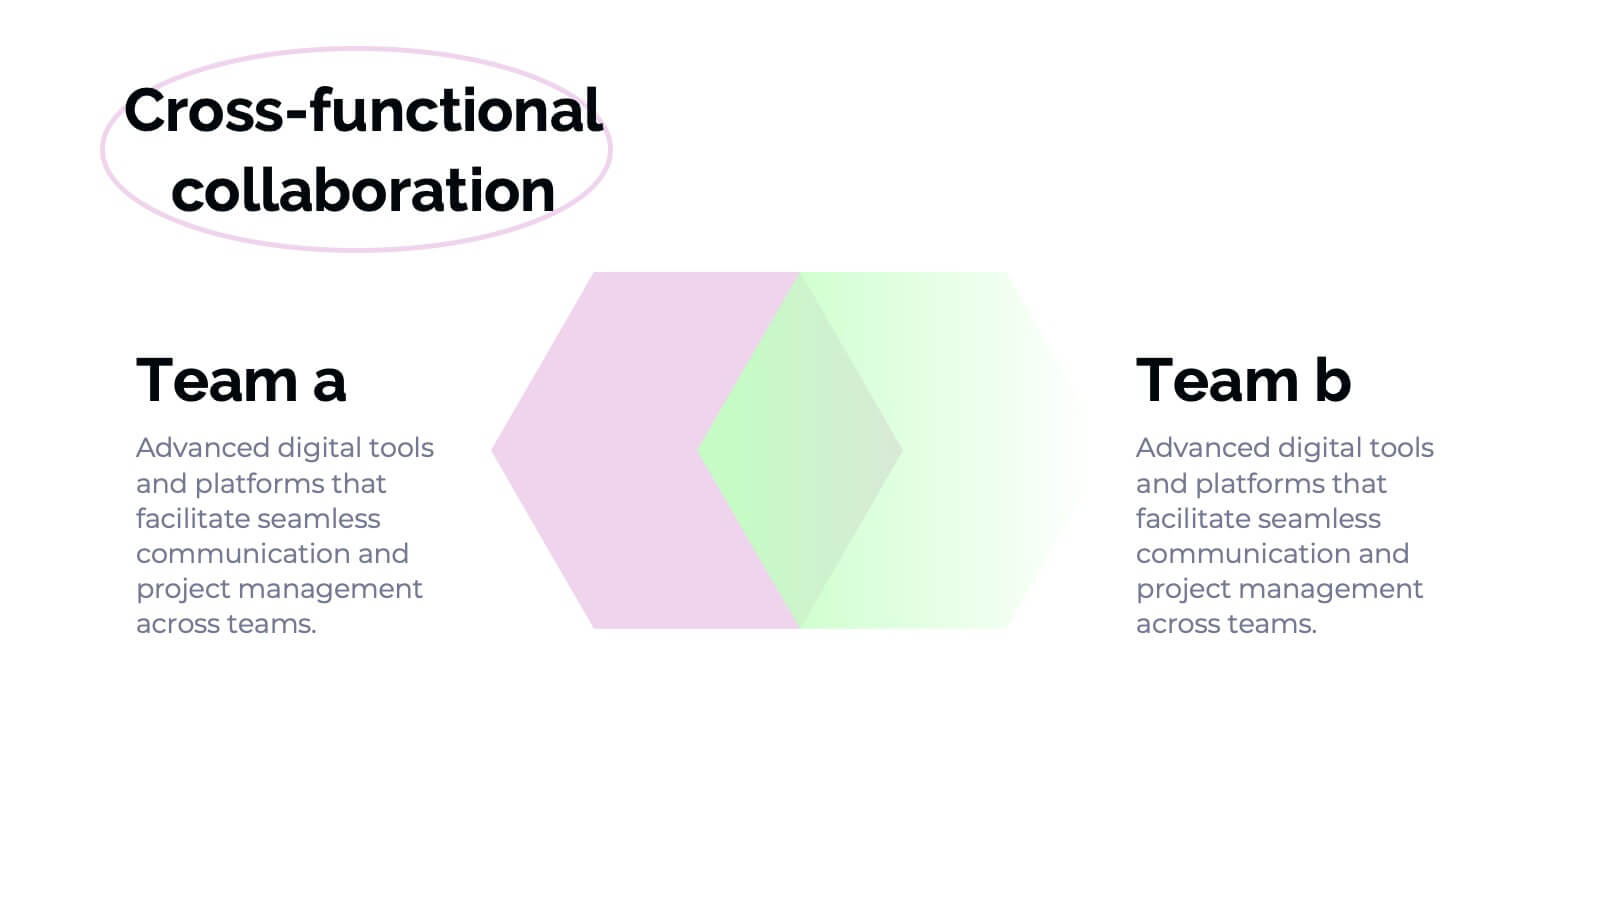
Effective Leadership Skills Presentation
Build stronger teams with this effective leadership skills template, featuring a colorful building block design to represent key competencies. Ideal for leadership workshops, corporate training, and professional development, it visually organizes six core skills. Fully editable in Canva, PowerPoint, or Google Slides for easy customization to match your organization’s style.


20 slides
Radiance Sales Forecast Presentation
This vibrant sales presentation template is perfect for showcasing your strategy, objectives, and team. It highlights key areas like pricing, sales process, and performance metrics with a modern and eye-catching design. Compatible with PowerPoint, Keynote, and Google Slides, it ensures you’ll deliver impactful and professional presentations every time. Get ready to wow your audience!


5 slides
Economic Analysis of North America Map Presentation
The Economic Analysis of North America Map template provides a focused visual tool for displaying economic data across different regions. With dedicated spots for key statistics and trends, this template enhances presentations with clear, data-driven insights. It is designed to be user-friendly and is compatible with PowerPoint, Keynote, and Google Slides.


4 slides
Banking Products and Credit Overview Presentation
Make your next presentation feel like a swipe of a card—clear, sleek, and purposeful. This layout is perfect for explaining the differences between financial products, highlighting banking services, and breaking down credit-related insights. Fully customizable and professionally designed for PowerPoint, Keynote, and Google Slides, it's ideal for any financial overview presentation.


5 slides
Business Vision Statement Presentation
Focus on the future with our "Business Vision Statement" presentation template, ideal for outlining your company's aspirations. This visually engaging template helps you present your business's core values and long-term goals, ensuring alignment across the organization. Perfect for strategic meetings and stakeholder presentations, it is compatible with PowerPoint, Keynote, and Google Slides. This template is a crucial tool for leaders looking to inspire and direct their teams towards common objectives.