


Features
- 6 Unique slides
- Fully editable and easy to edit in Microsoft Powerpoint, Keynote and Google Slides
- 16:9 widescreen layout
- Clean and professional designs
- Export to JPG, PDF or send by email


Do you have any questions?
Recommend


7 slides
Mortgage Comparison Infographic
Make the home buying decision easier with our mortgage comparison infographic template. This user-friendly and visually engaging infographic allows you to compare different mortgage options, helping your audience make informed financial choices. Use the charts to illustrate how the loan term impacts the total cost of the mortgage, making it easier to choose the right term. Fully customizable and compatible with Powerpoint, Keynote, and Google Slides. With this template, you can demystify mortgage options and empower individuals to choose the mortgage that best fits their needs and financial goals.


21 slides
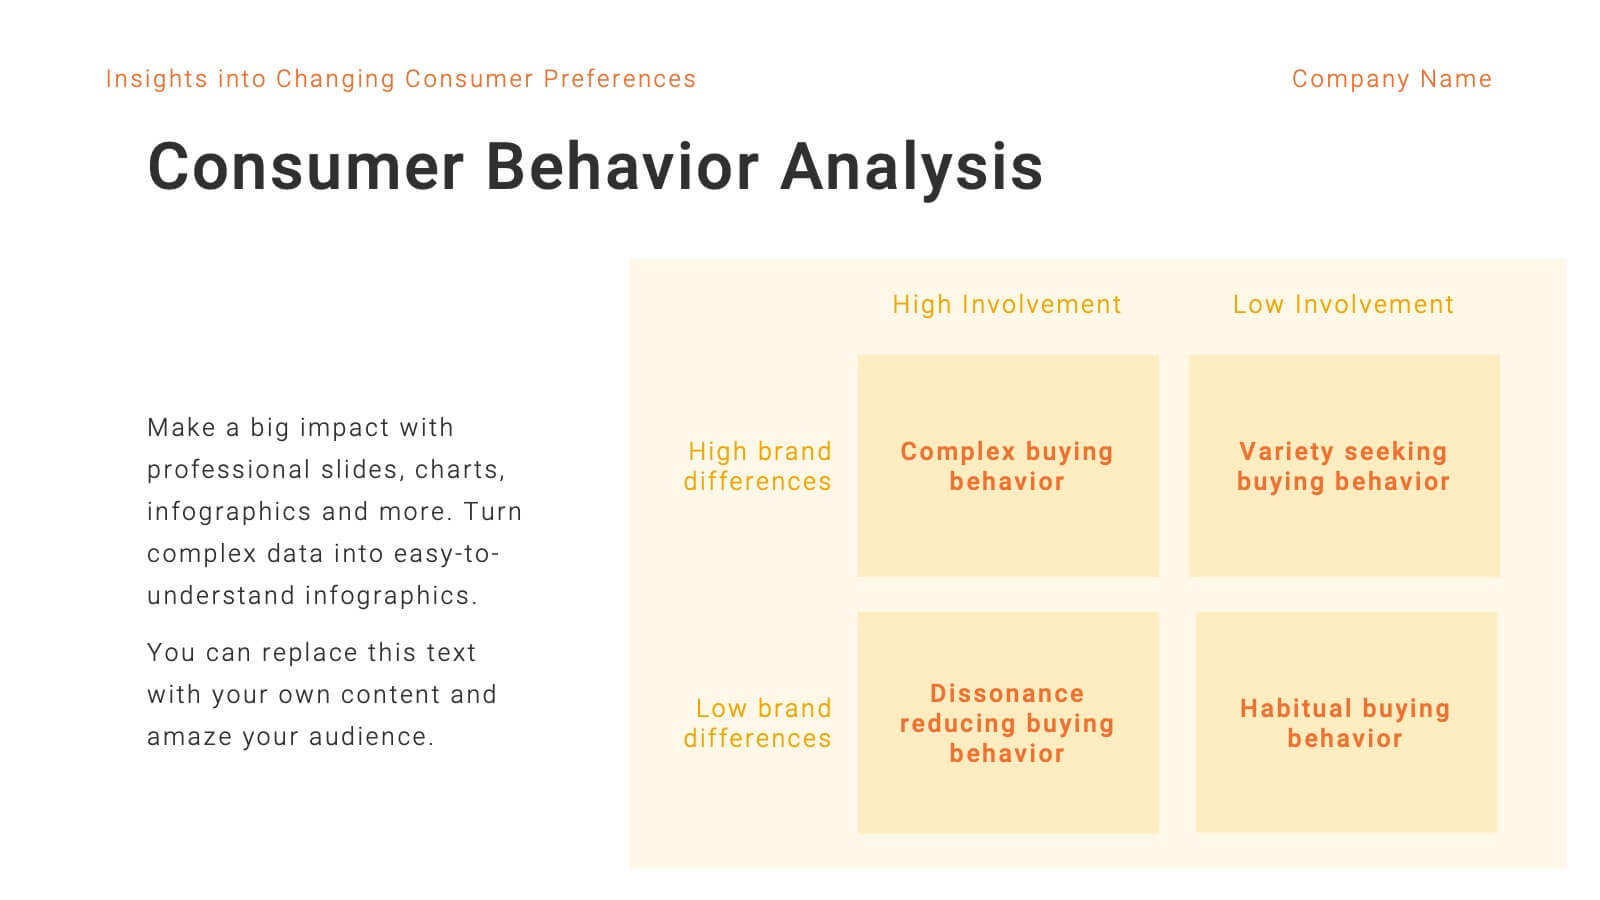
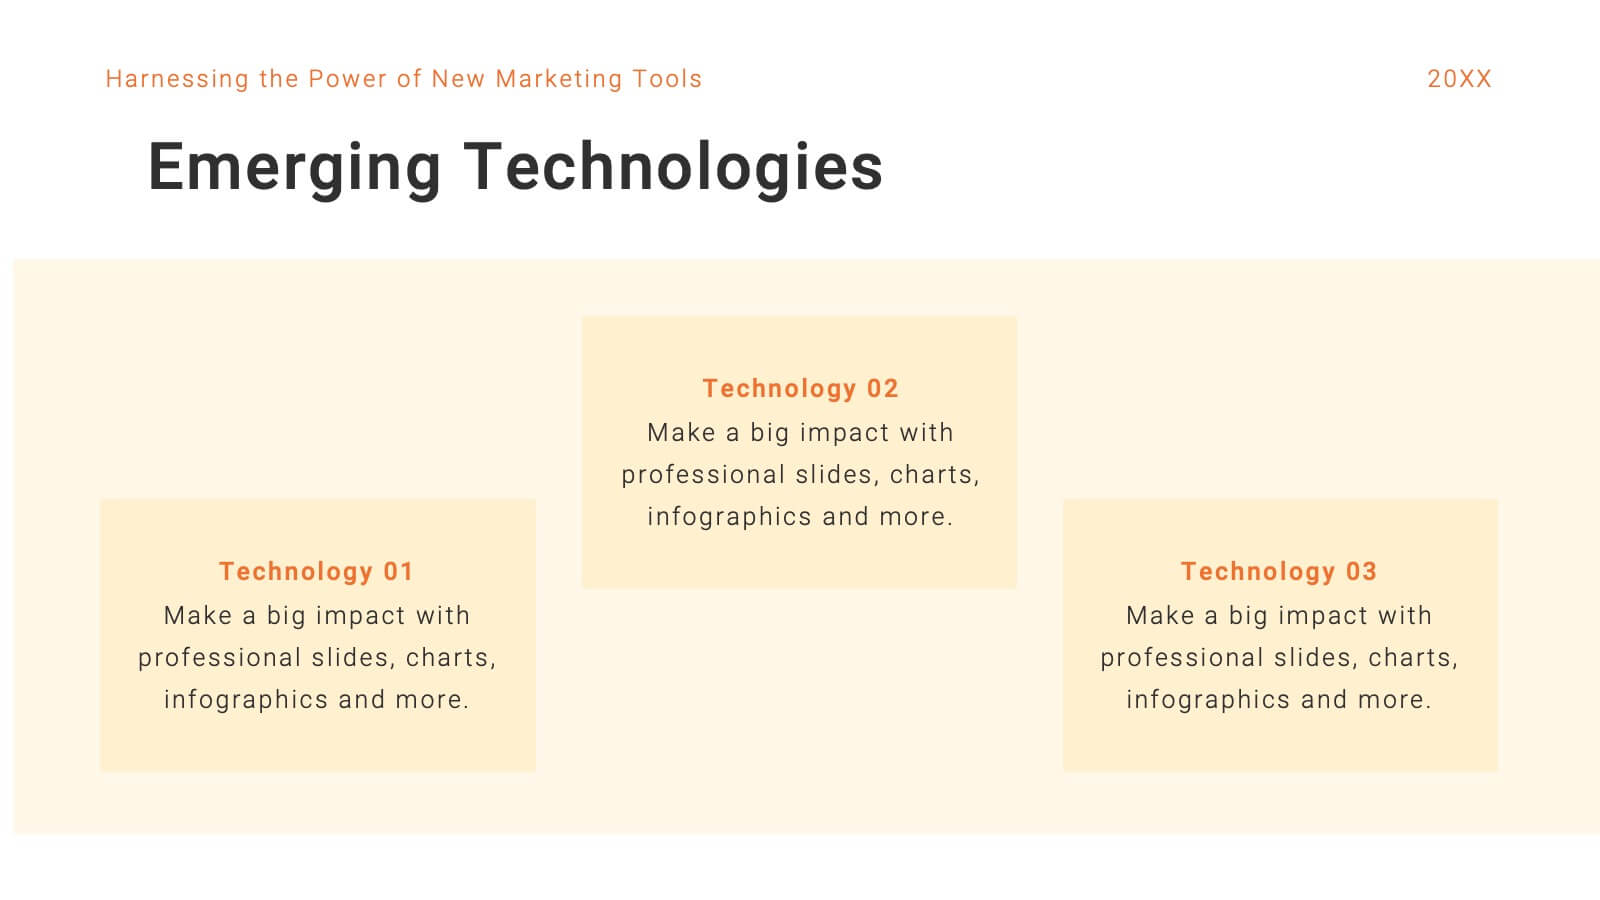
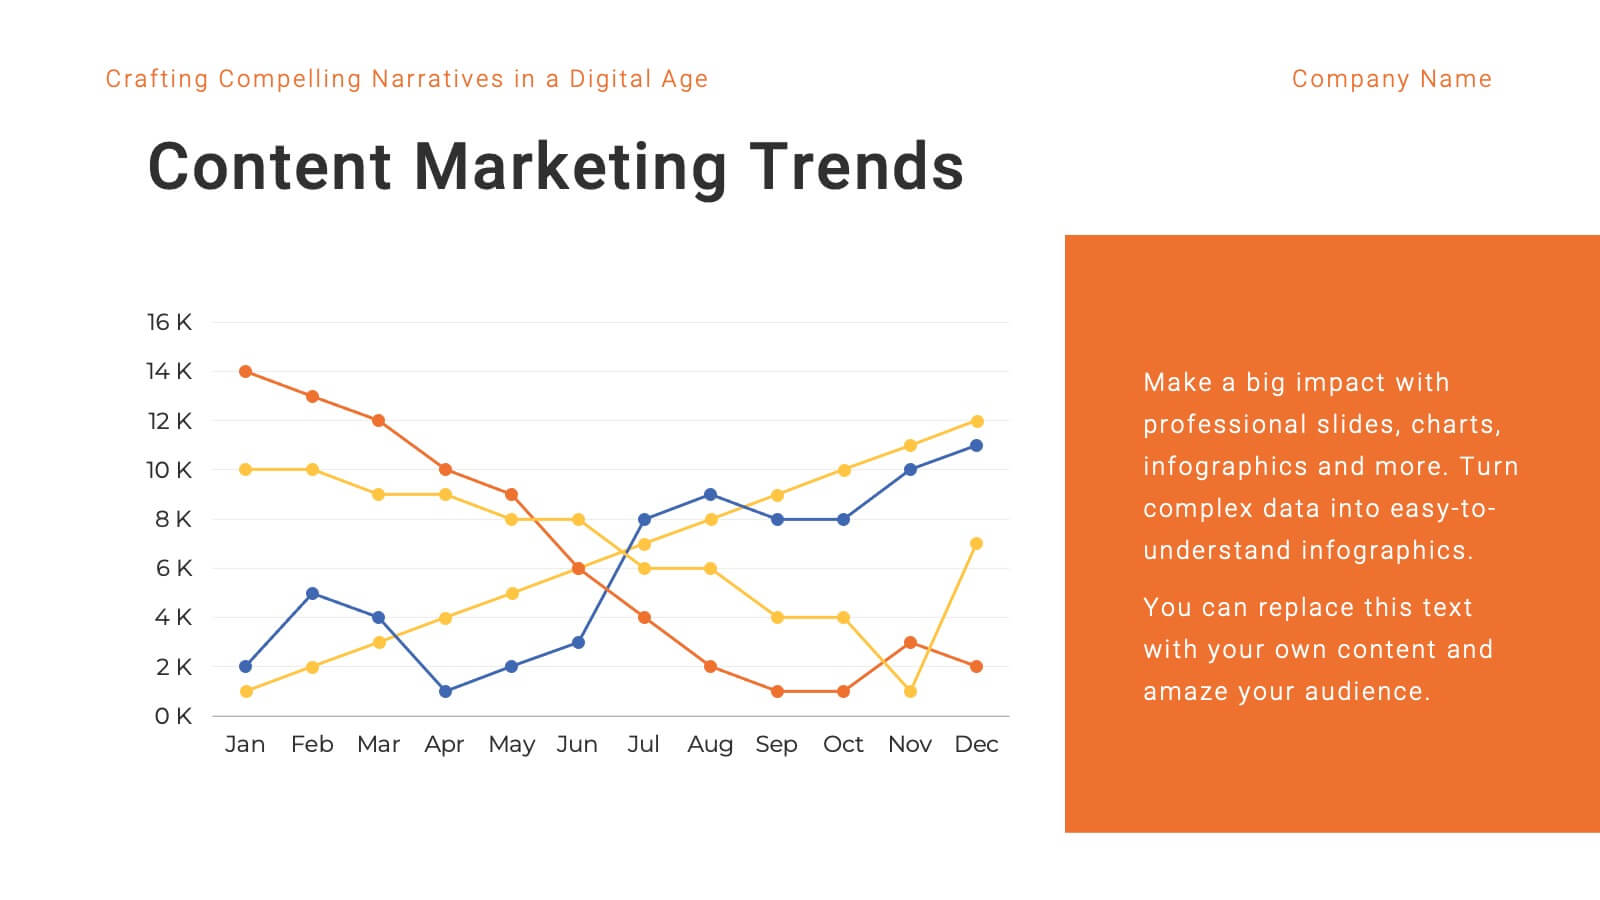
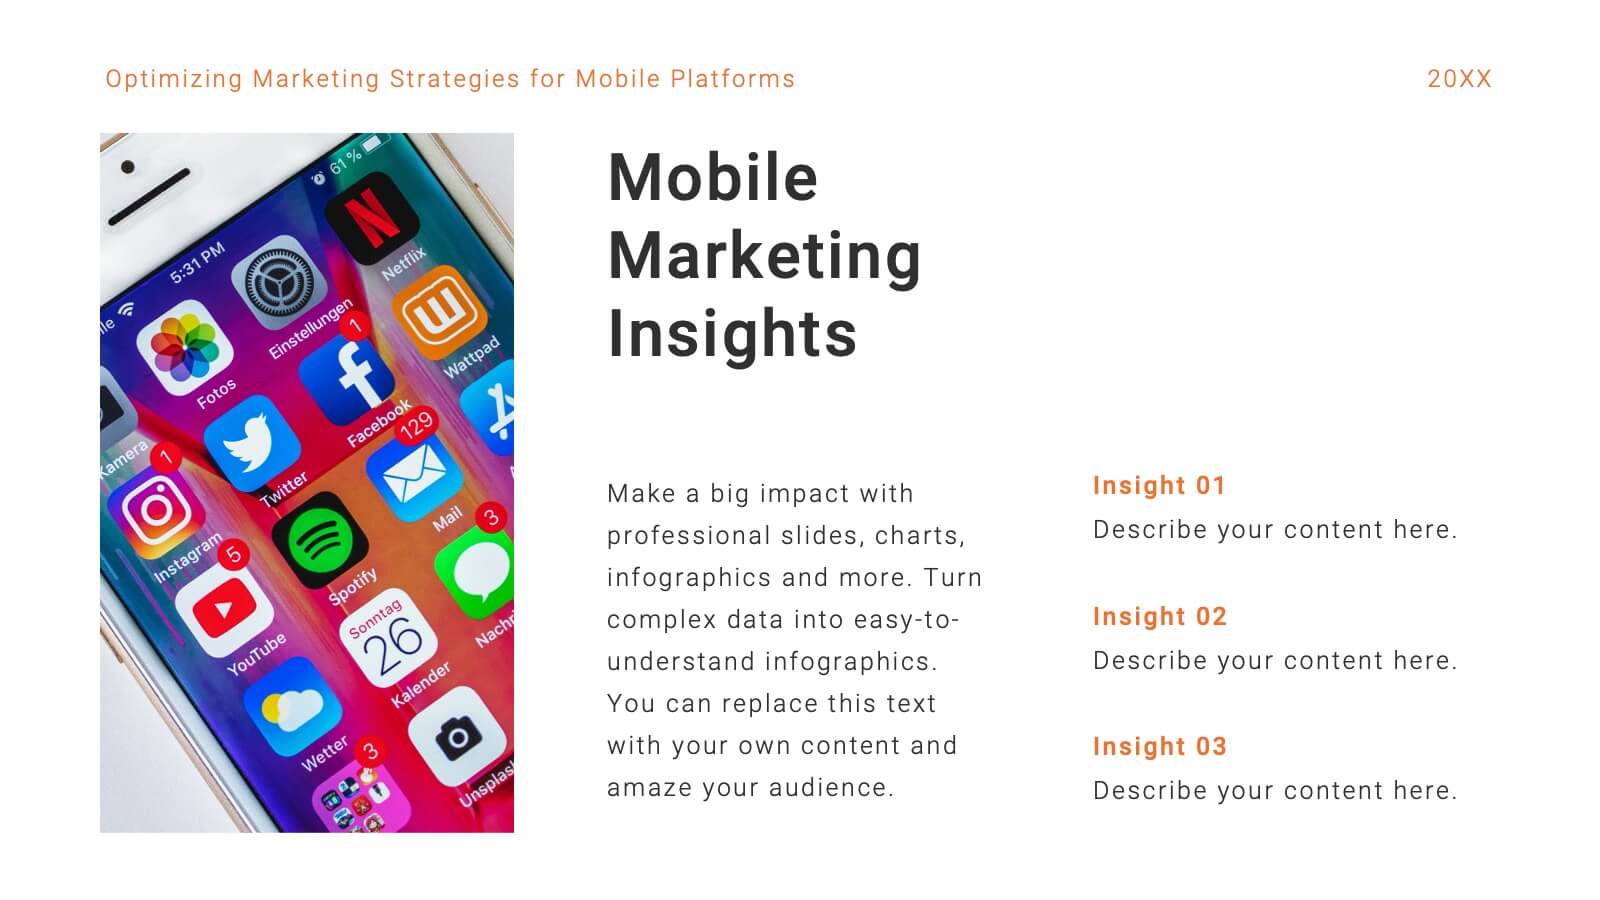
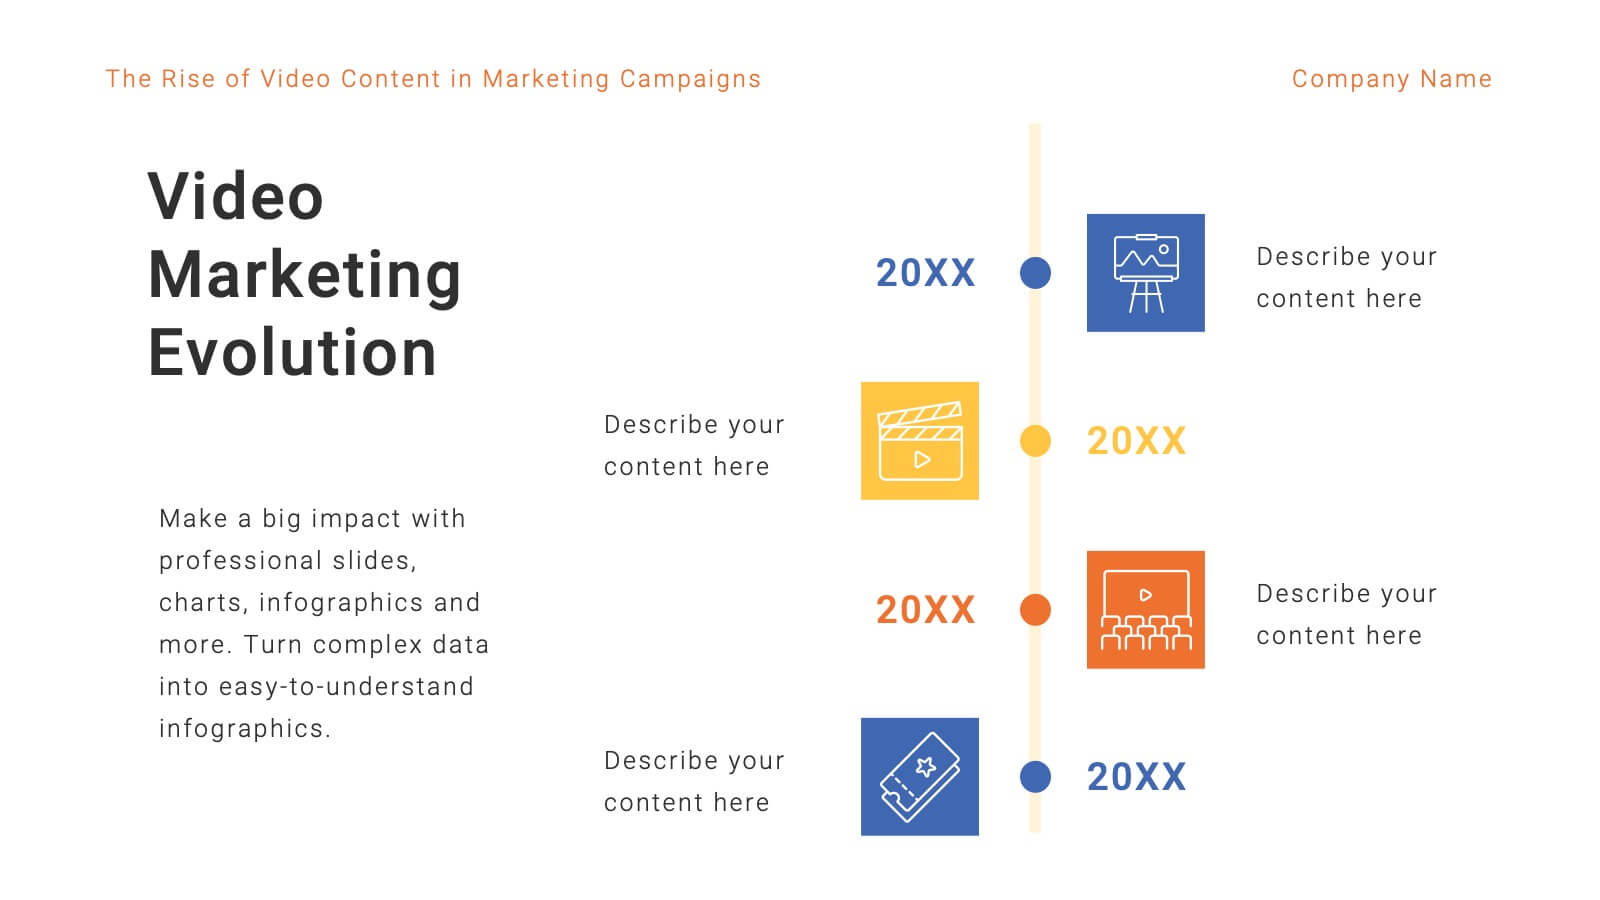
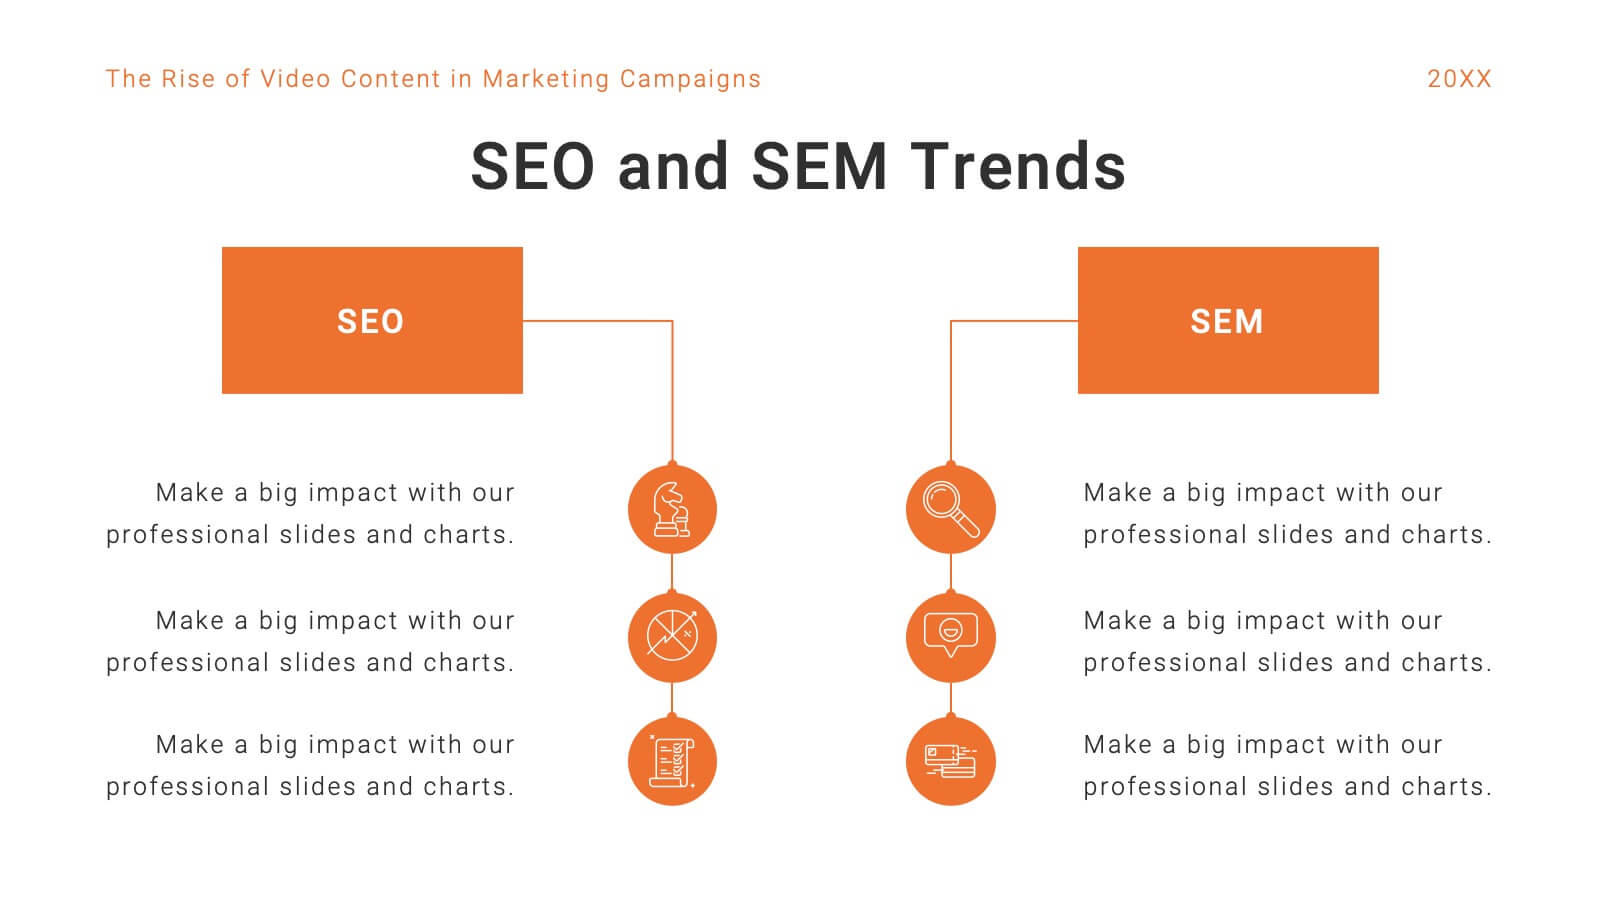
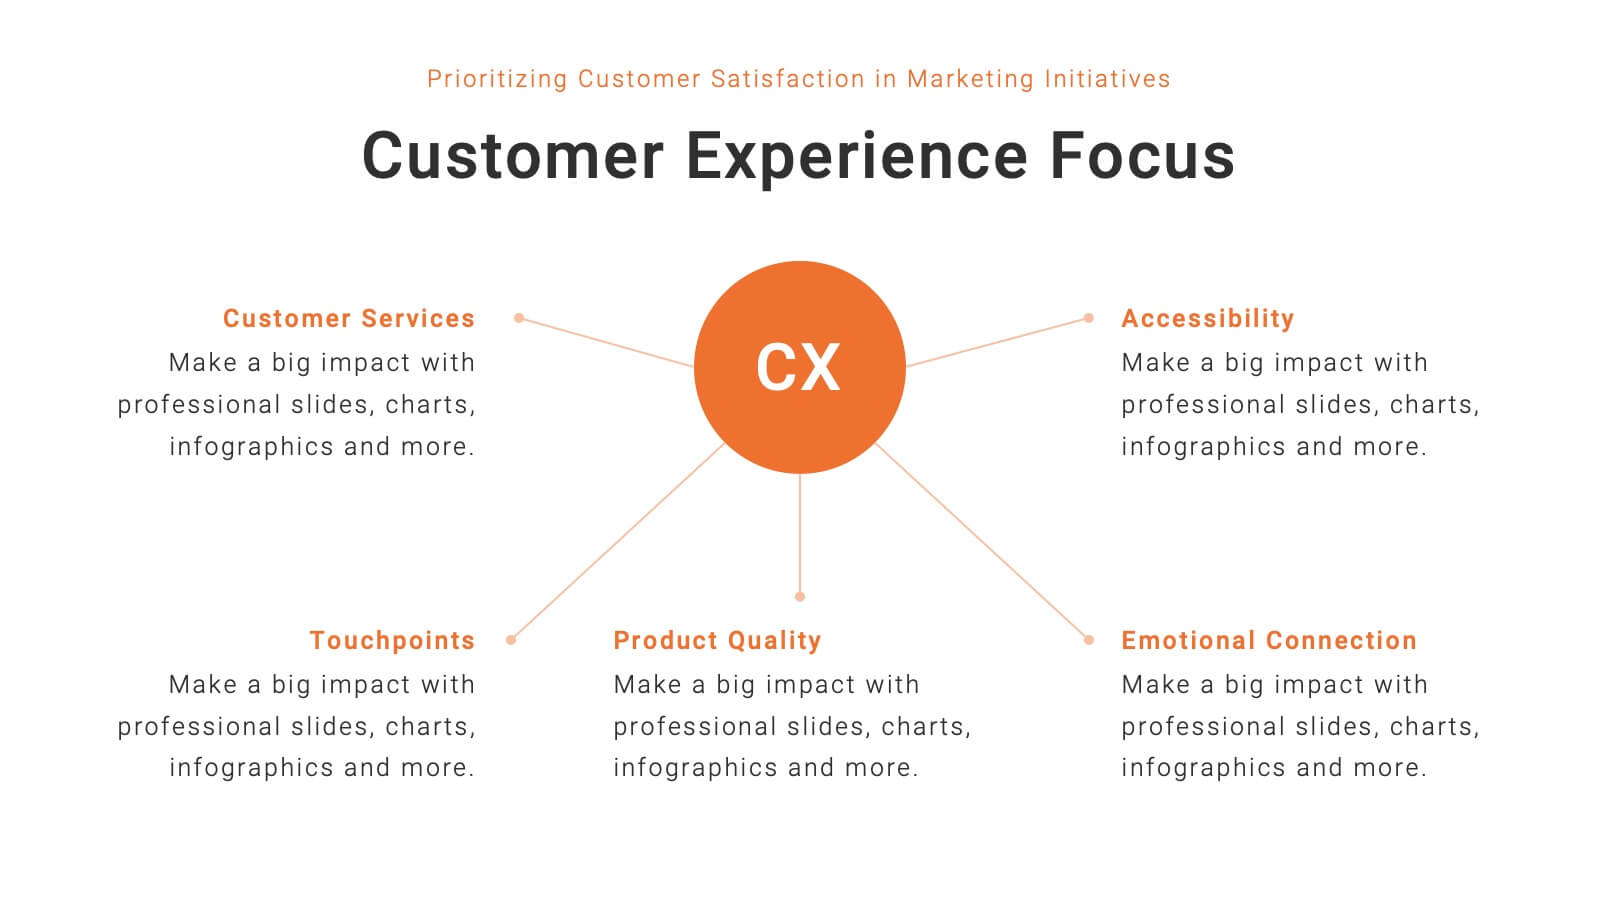
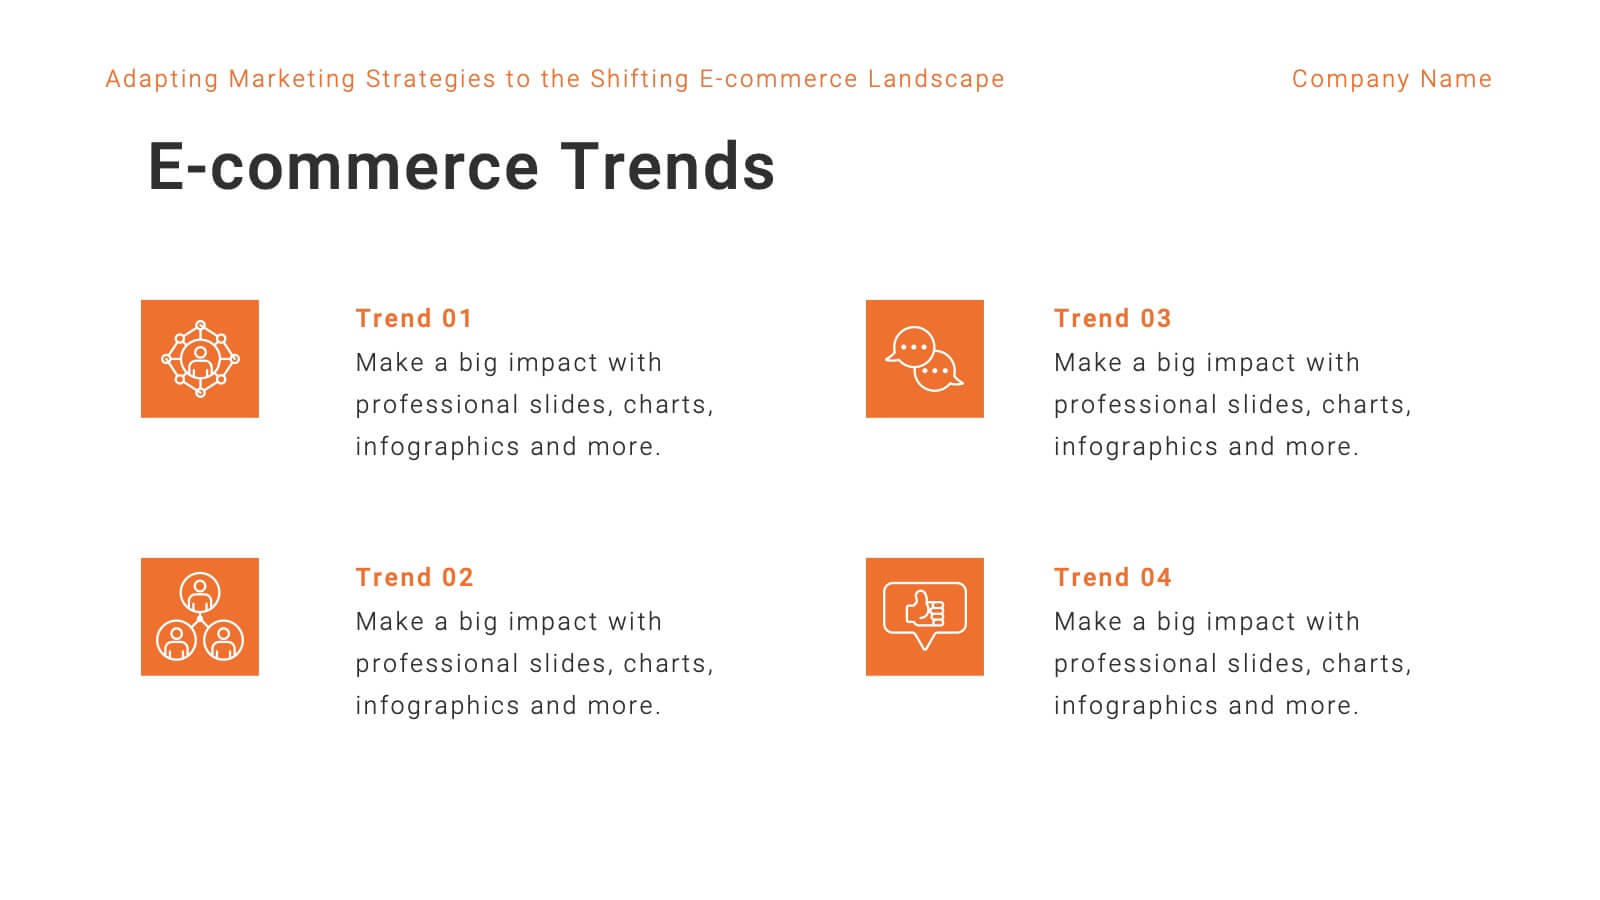
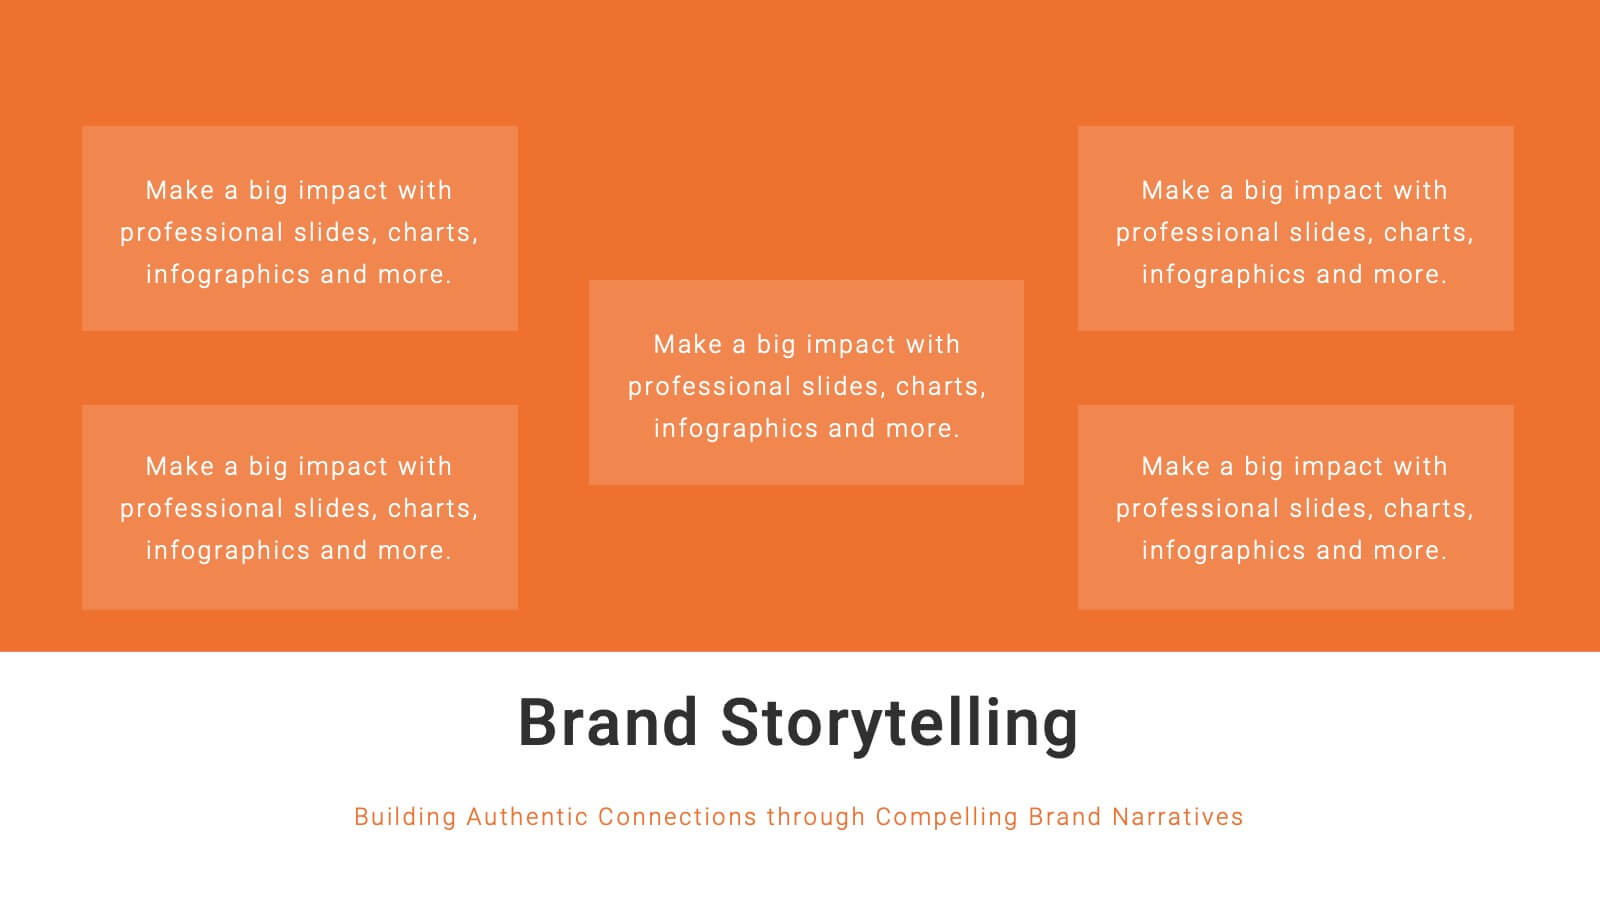
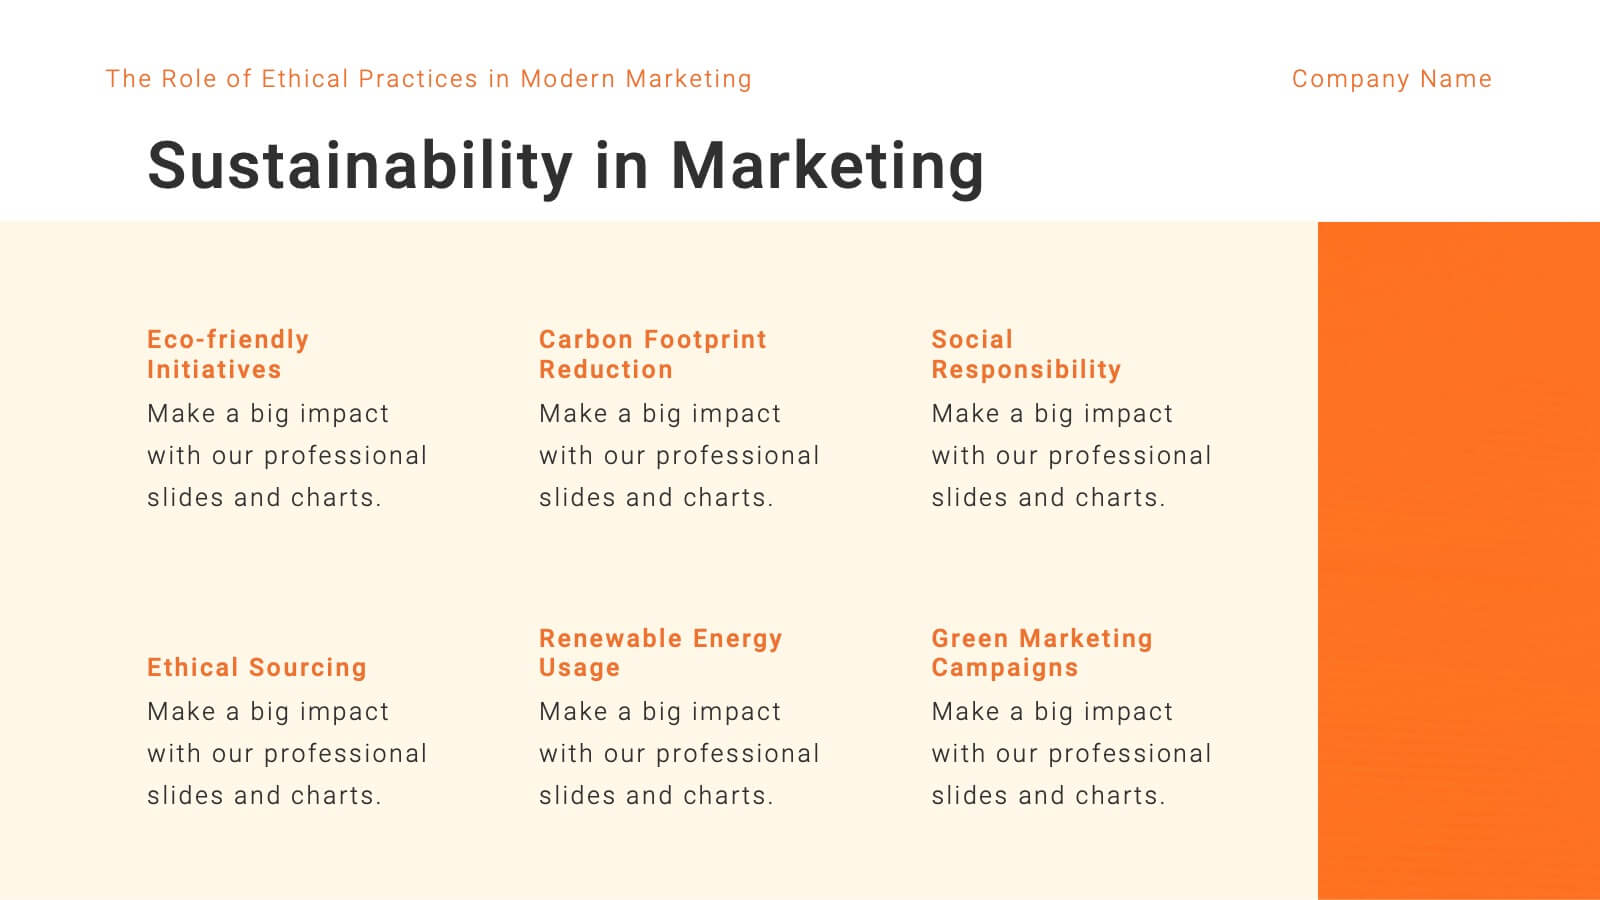
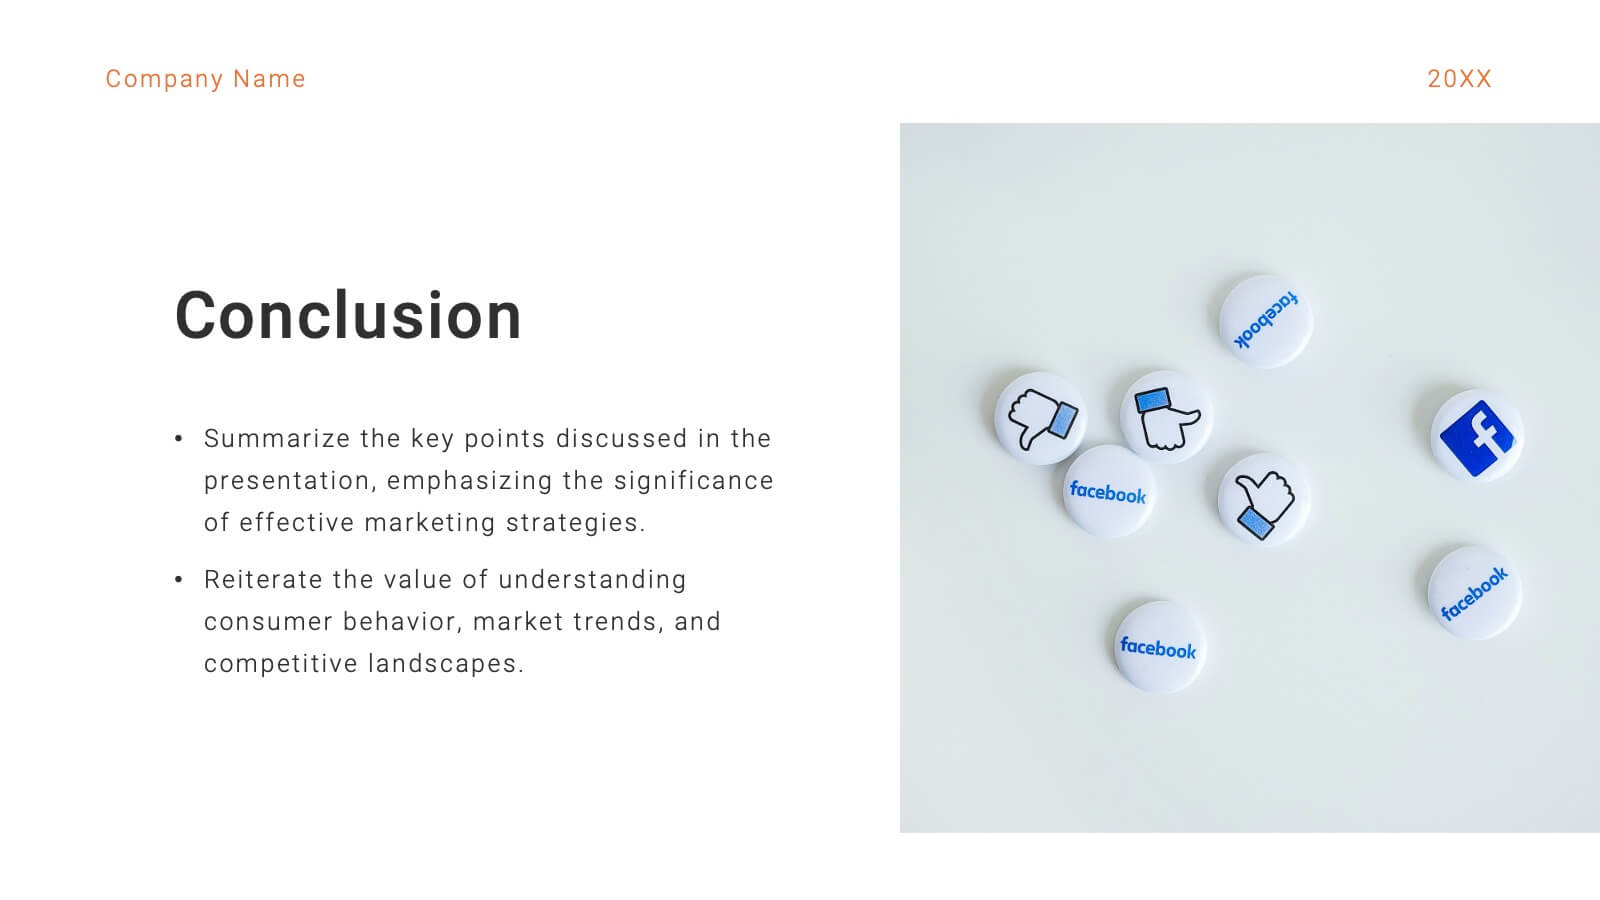
Mercury Marketing Research Report Presentation
Elevate your marketing strategy with this insightful and data-driven presentation template! Perfect for analyzing trends, consumer behavior, and emerging technologies, this template provides a thorough overview of today’s marketing landscape. From social media strategies to e-commerce trends, it covers all key areas. Fully customizable and compatible with PowerPoint, Keynote, and Google Slides for easy use.


6 slides
Child Development Psychology Presentation
Bright colors and geometric birds bring this slide to life, making complex concepts easy to follow. This presentation template simplifies the key stages of emotional and psychological growth in children, helping you explain theories and behaviors clearly. Compatible with PowerPoint, Keynote, and Google Slides for seamless use across platforms.


4 slides
Stakeholder Analysis Matrix Example Presentation
Make every relationship in your project strategy crystal clear with this smart and colorful matrix design. Perfect for mapping influence, interest, and engagement levels, it helps teams identify priorities and manage communication effectively. Fully editable and compatible with PowerPoint, Keynote, and Google Slides for seamless customization.


5 slides
Scrum Methodology for Product Development Presentation
Visualize each phase of your product development lifecycle using this Scrum methodology diagram. Highlight team roles, sprint cycles, and delivery steps with clear, color-coded sections. Ideal for Agile coaches, product managers, and tech teams. Fully editable in PowerPoint, Keynote, and Google Slides to align with your project planning needs.


5 slides
Project Task Allocation Chart Presentation
Track project progress with this clear Task Allocation Chart. Assign team members, visualize task completion, and streamline planning in one editable slide. Perfect for managing responsibilities across departments or sprints, this layout keeps teams aligned. Fully customizable in PowerPoint, Keynote, and Google Slides for professional and agile teams.


4 slides
3-Level Tree Chart Presentation
Grow your ideas from concept to execution with this beautifully designed visual layout. Perfect for showcasing layered strategies, hierarchical processes, or business development stages, it balances clarity and creativity through a clean, tree-inspired design. Fully editable and compatible with PowerPoint, Keynote, and Google Slides for seamless professional use.


8 slides
Inbound and Outbound Value Chain Strategy Presentation
Streamline your supply chain insights with the Inbound and Outbound Value Chain Strategy Presentation. This structured layout highlights the key components of internal and external logistics—from sourcing and procurement to product delivery. Use this template to showcase strategic operations, process optimization, and value-adding activities. Fully editable in PowerPoint, Keynote, Canva, and Google Slides.


6 slides
Sales Team Infographic
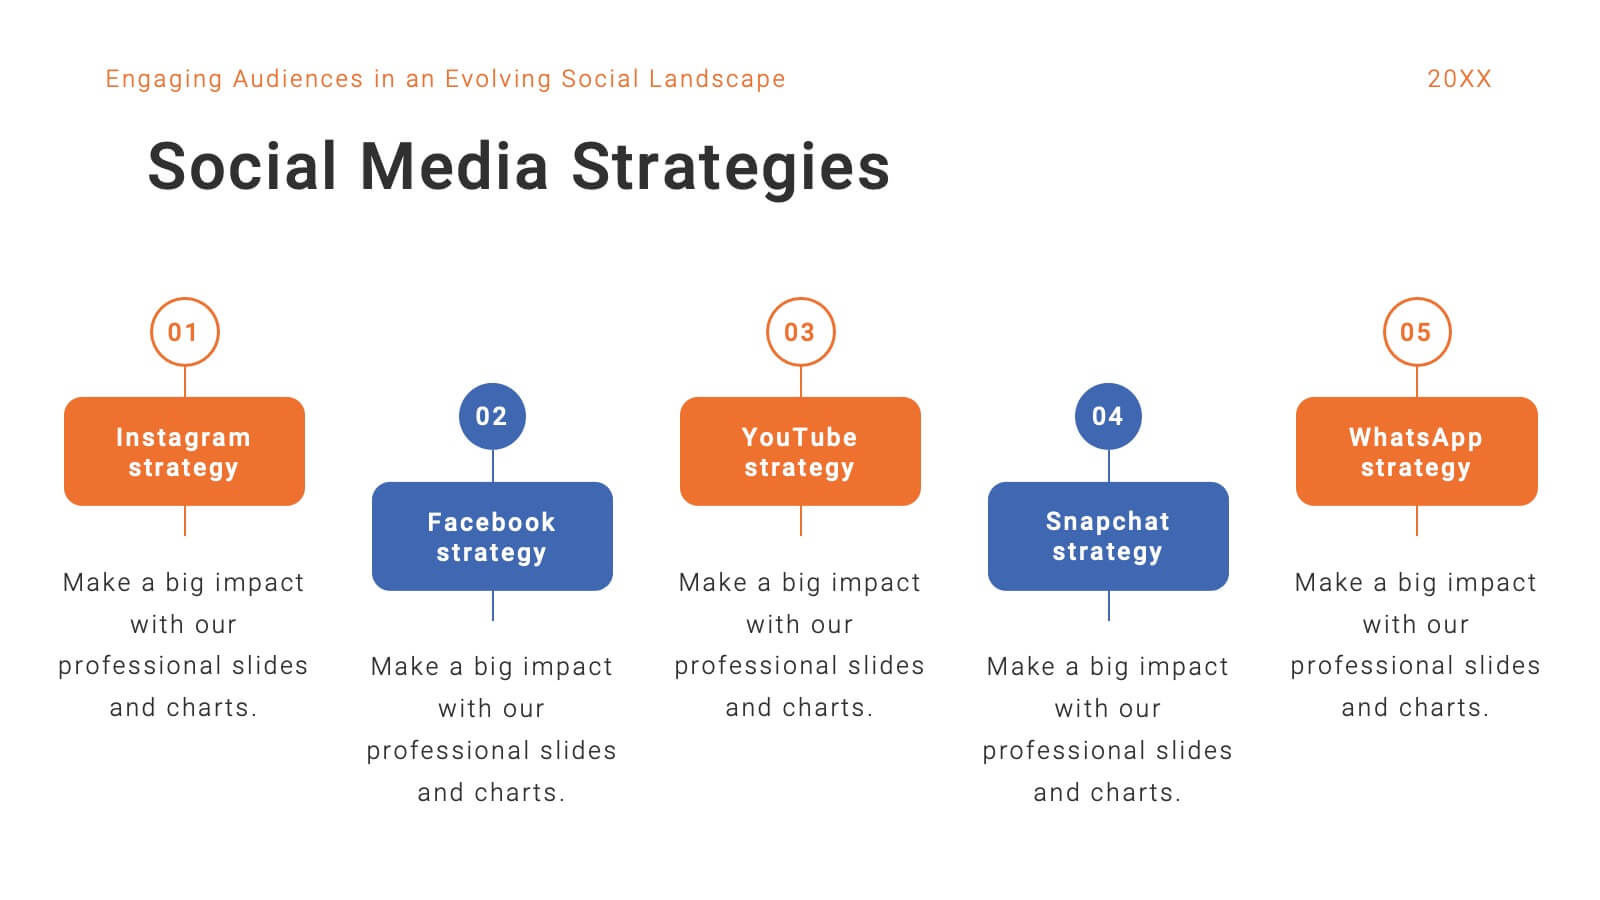
The series presented showcases various slide templates tailored for enhancing sales team strategies and communication. Each slide is crafted to assist sales professionals in detailing team structures, sales goals, performance metrics, and strategic initiatives effectively. Utilizing vibrant color blocks and streamlined design elements, these templates make complex sales data approachable and engaging, facilitating clear and impactful presentations. The collection is designed with adaptability in mind, incorporating elements that can be easily customized to fit different team needs and company branding. These include comparative layouts for benchmarking, timeline formats for showcasing sales cycles, and diagrammatic representations for visualizing sales processes and results. Perfect for internal meetings, sales training sessions, and stakeholder presentations, these templates serve as essential tools for sales leaders to convey their team’s progress, celebrate wins, and strategize for future sales endeavors.


5 slides
Project Goals and Objectives Presentation
Bring clarity and momentum to your planning with a slide that highlights goals and aligns them with clear, actionable objectives. This presentation helps teams define priorities, communicate expectations, and track progress with a clean, structured layout built for any project. Fully compatible with PowerPoint, Keynote, and Google Slides.


10 slides
Customer Demographic Breakdown Presentation
Give your insights a bold, modern look with a clear visual layout that turns customer data into an easy-to-follow story. This presentation helps you explain key demographic patterns, highlight audience behavior, and support smarter decisions with clean, structured visuals. Fully editable and compatible with PowerPoint, Keynote, and Google Slides.


23 slides
Staccato Business Plan Presentation
Present your business plan with this elegant and structured template, designed for clarity and professionalism. This presentation layout provides all the essential elements for showcasing your strategy, goals, and objectives, ideal for entrepreneurs, startups, and established businesses alike. Featuring dedicated sections for company overview, panel discussions, workshop sessions, and closing remarks, the slides are organized for seamless storytelling. Highlight your team, workshop takeaways, and key resources with polished visuals and easy-to-follow layouts. The Q&A and networking break slides allow you to engage your audience effectively while maintaining a professional tone. Fully compatible with PowerPoint, Google Slides, and Keynote, this template is fully editable, allowing you to customize colors, text, and images to reflect your brand. Deliver your business ideas confidently with a presentation template that ensures a strong, lasting impression.


6 slides
4-Segment Ideal Buyer Persona Presentation
Bring clarity to your audience with a clean, structured slide that breaks down who your ideal customer truly is. This presentation helps you outline background, goals, challenges, learning habits, interests, and preferences in an easy-to-follow format. Fully compatible with PowerPoint, Keynote, and Google Slides.


6 slides
Business Challenge Identification Presentation
Spotting roadblocks has never looked this good! This infographic presentation template helps you map out key pain points across departments or processes, making it easier to analyze, discuss, and resolve challenges visually. It’s a perfect tool for business strategy teams and consultants. Fully compatible with PowerPoint, Keynote, and Google Slides.


4 slides
Pharmaceutical Industry Overview Presentation
Get a comprehensive view of the pharmaceutical sector with the Pharmaceutical Industry Overview Presentation template. This well-structured layout is designed to present key insights, industry trends, and regulatory frameworks in a visually compelling format. Perfect for industry analysts, healthcare professionals, and business executives, this template is fully editable and compatible with PowerPoint, Keynote, and Google Slides.


6 slides
Demographic Data Analysis Presentation
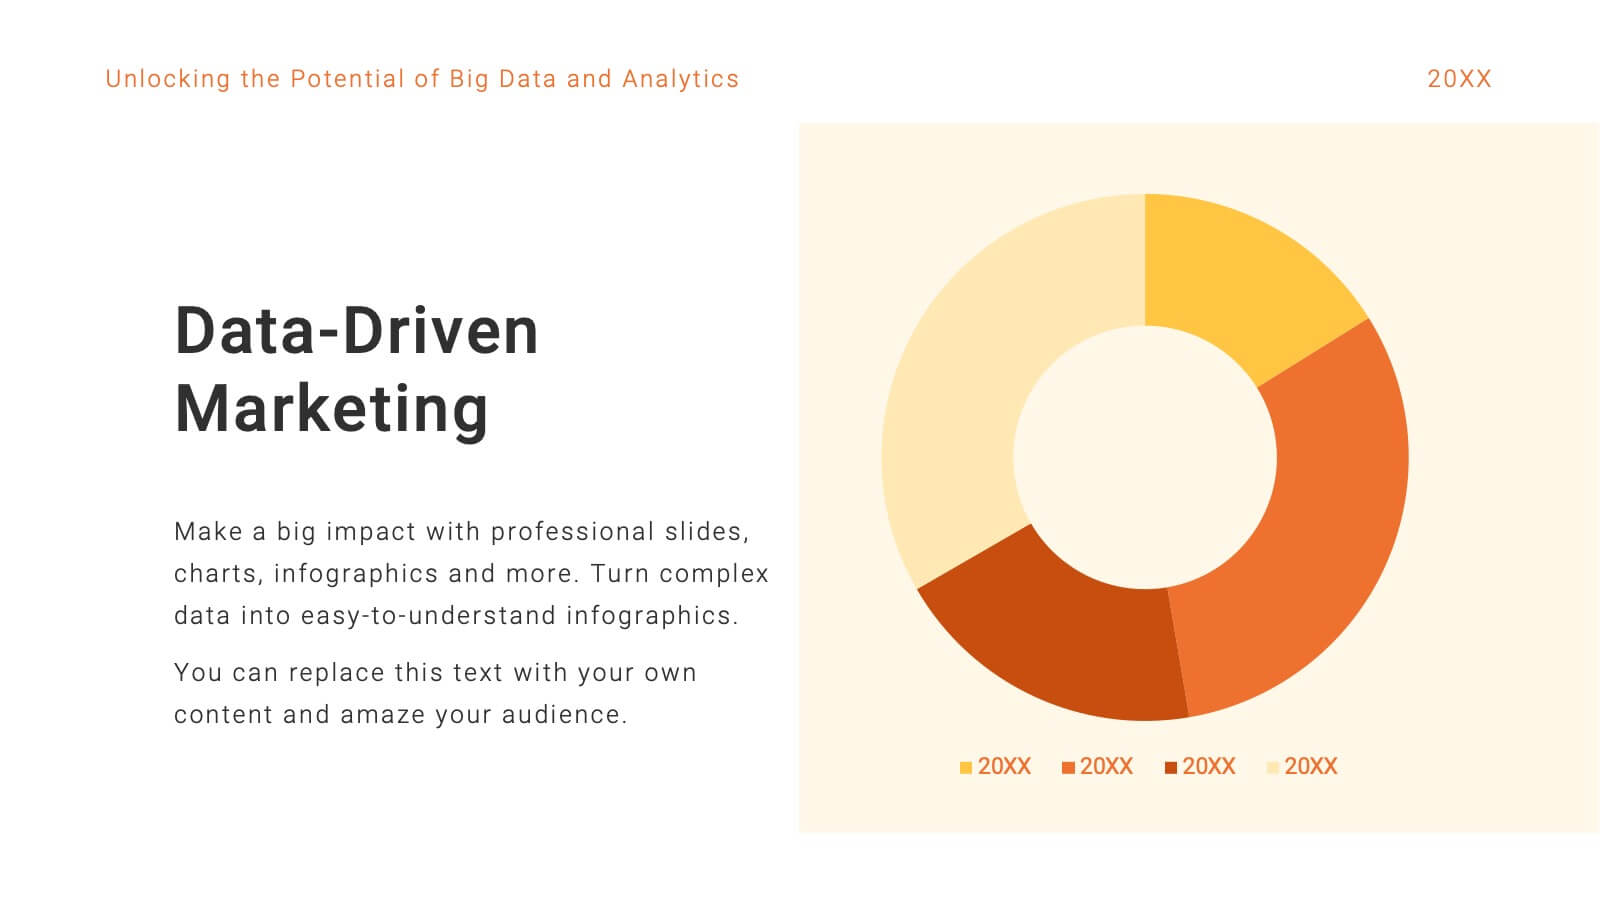
The "Demographic Data Analysis" presentation effectively visualizes demographic splits using a simple yet engaging pie chart. The template features a clean layout with distinct sections labeled for different demographic metrics, represented by the percentage splits of 35% and 65%. Each section includes placeholder text for inserting detailed insights, making it an excellent tool for presentations that need to communicate demographic data clearly and attractively. The design is versatile and can be adapted for various analysis needs in business or research contexts.


6 slides
Process Flow in Wheel Format Presentation
Showcase cyclical processes and step-by-step workflows with this Process Flow in Wheel Format. This dynamic, circular diagram is perfect for illustrating ongoing operations, development cycles, or organizational stages. Each section is clearly labeled and color-coded for easy customization. Fully editable in PowerPoint, Keynote, and Google Slides — ideal for operations managers, project leads, and consultants.