


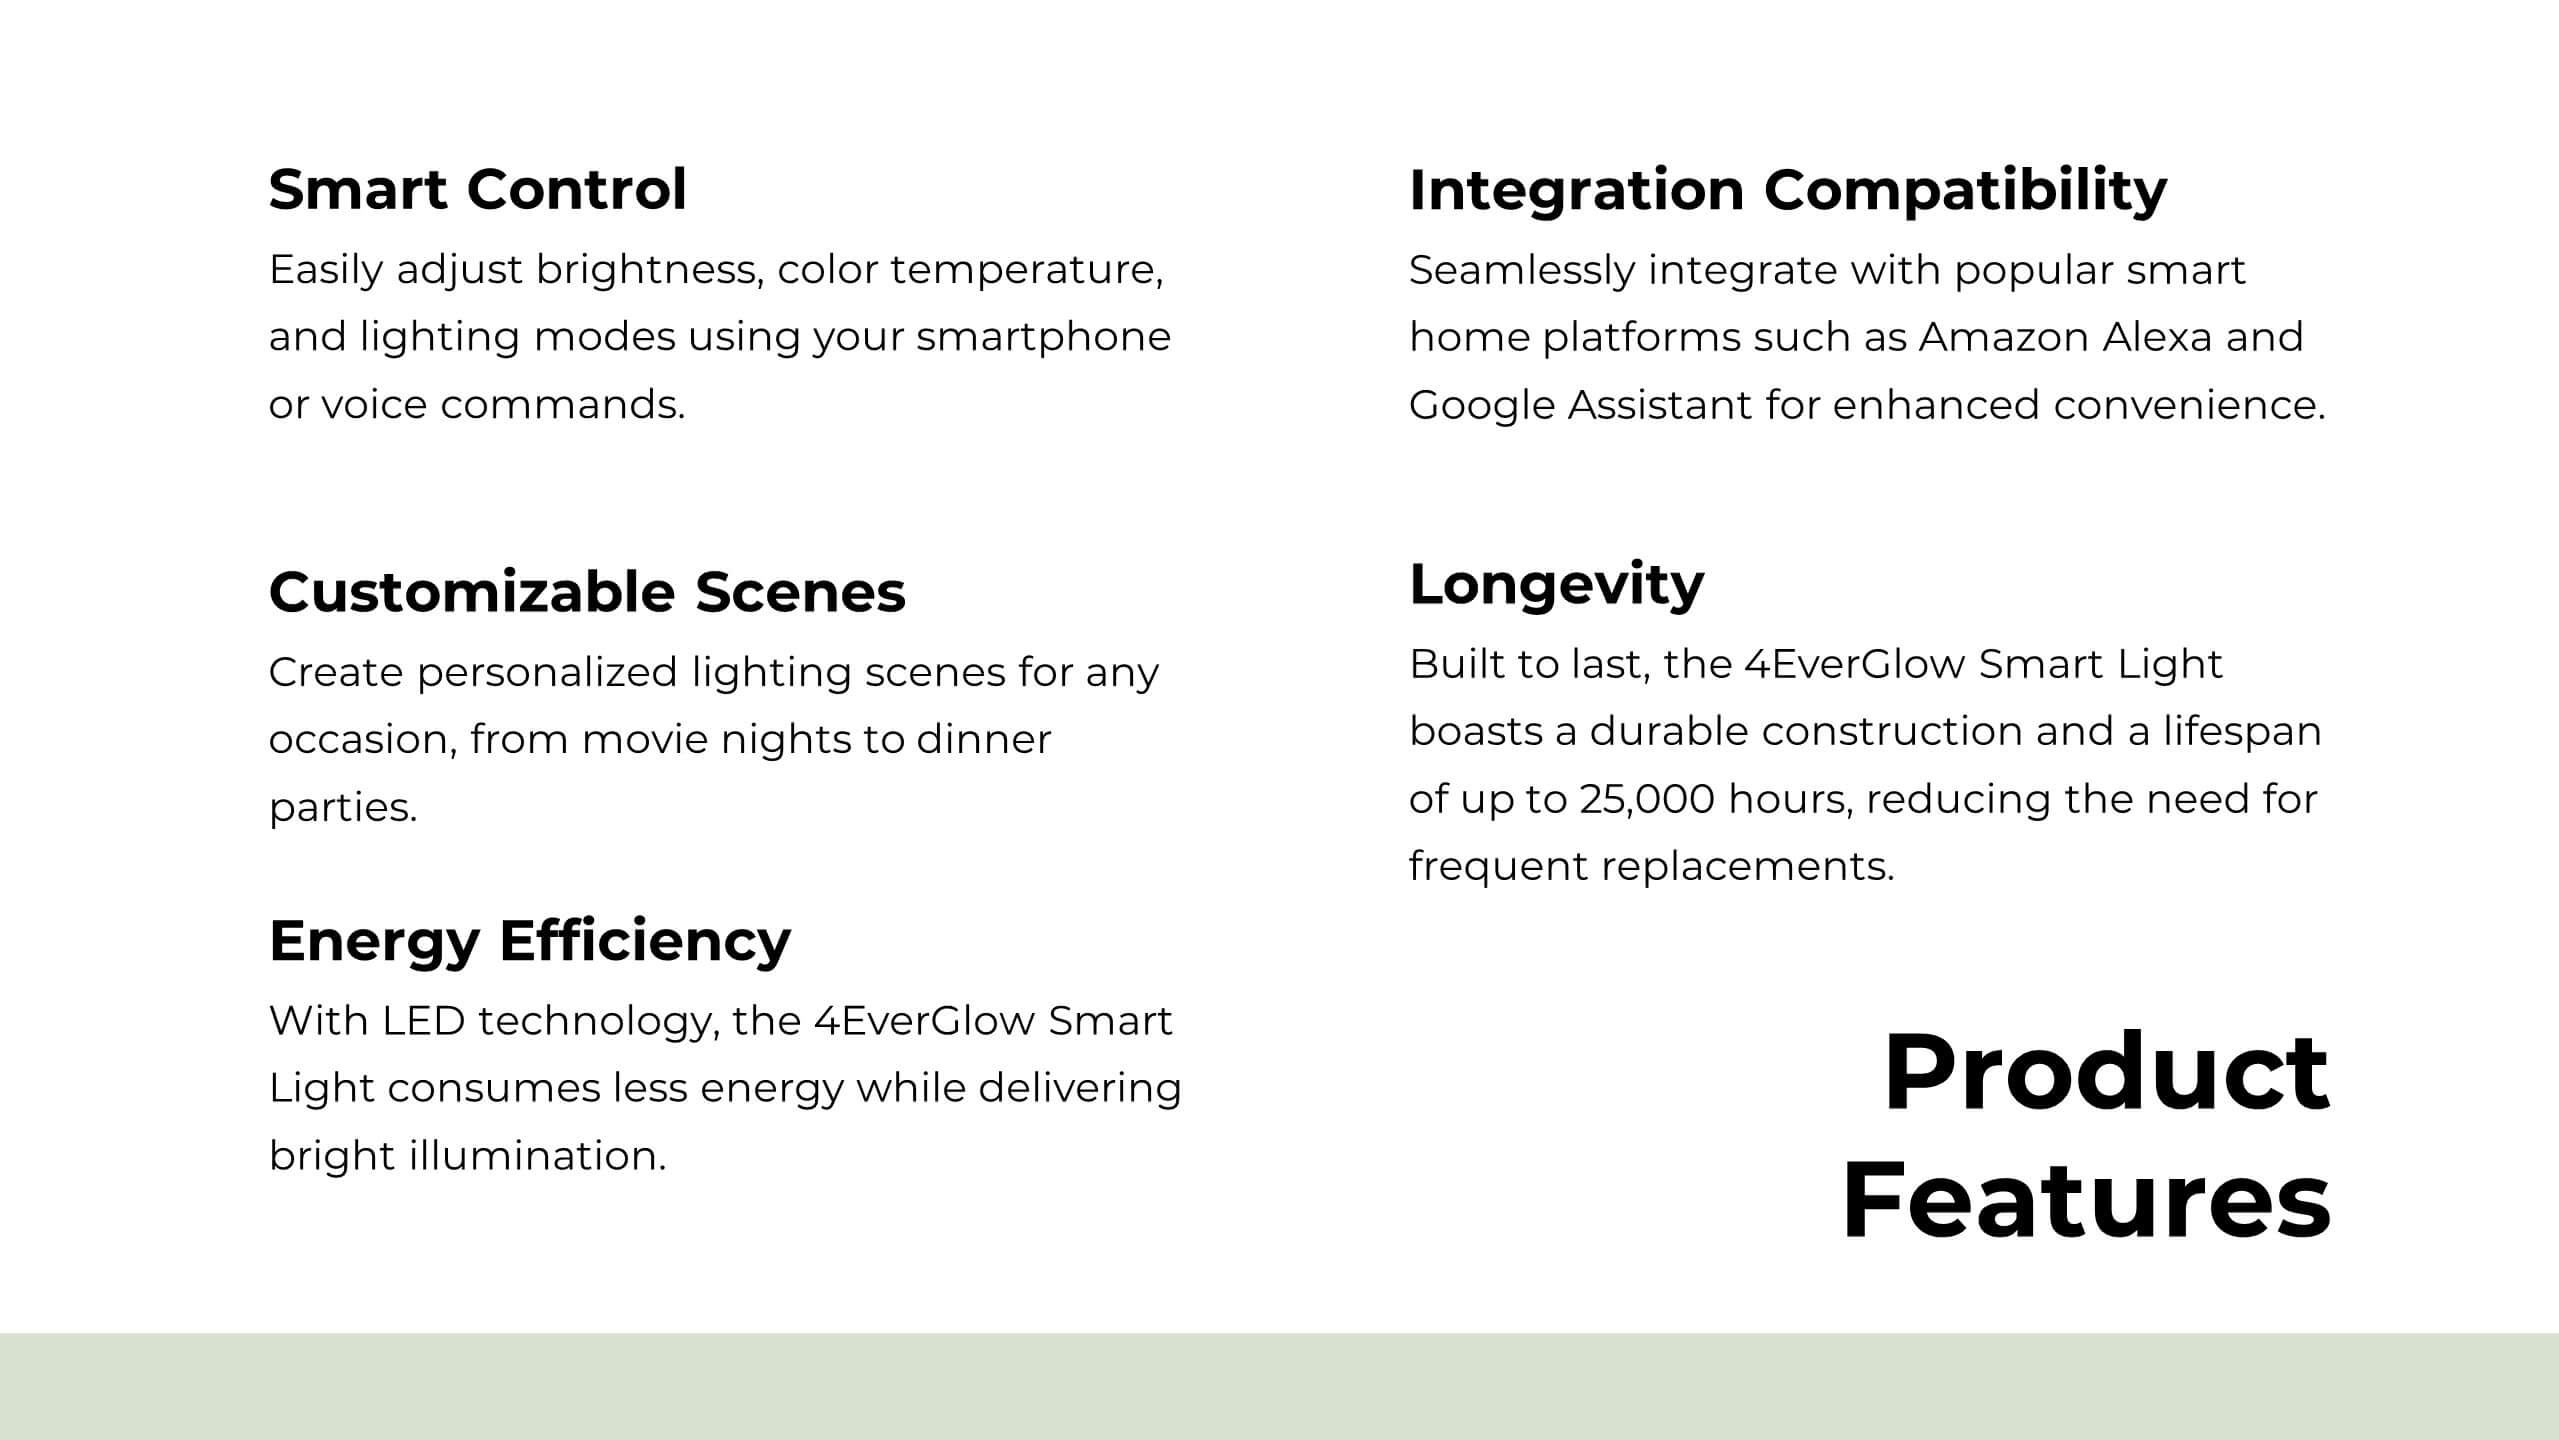
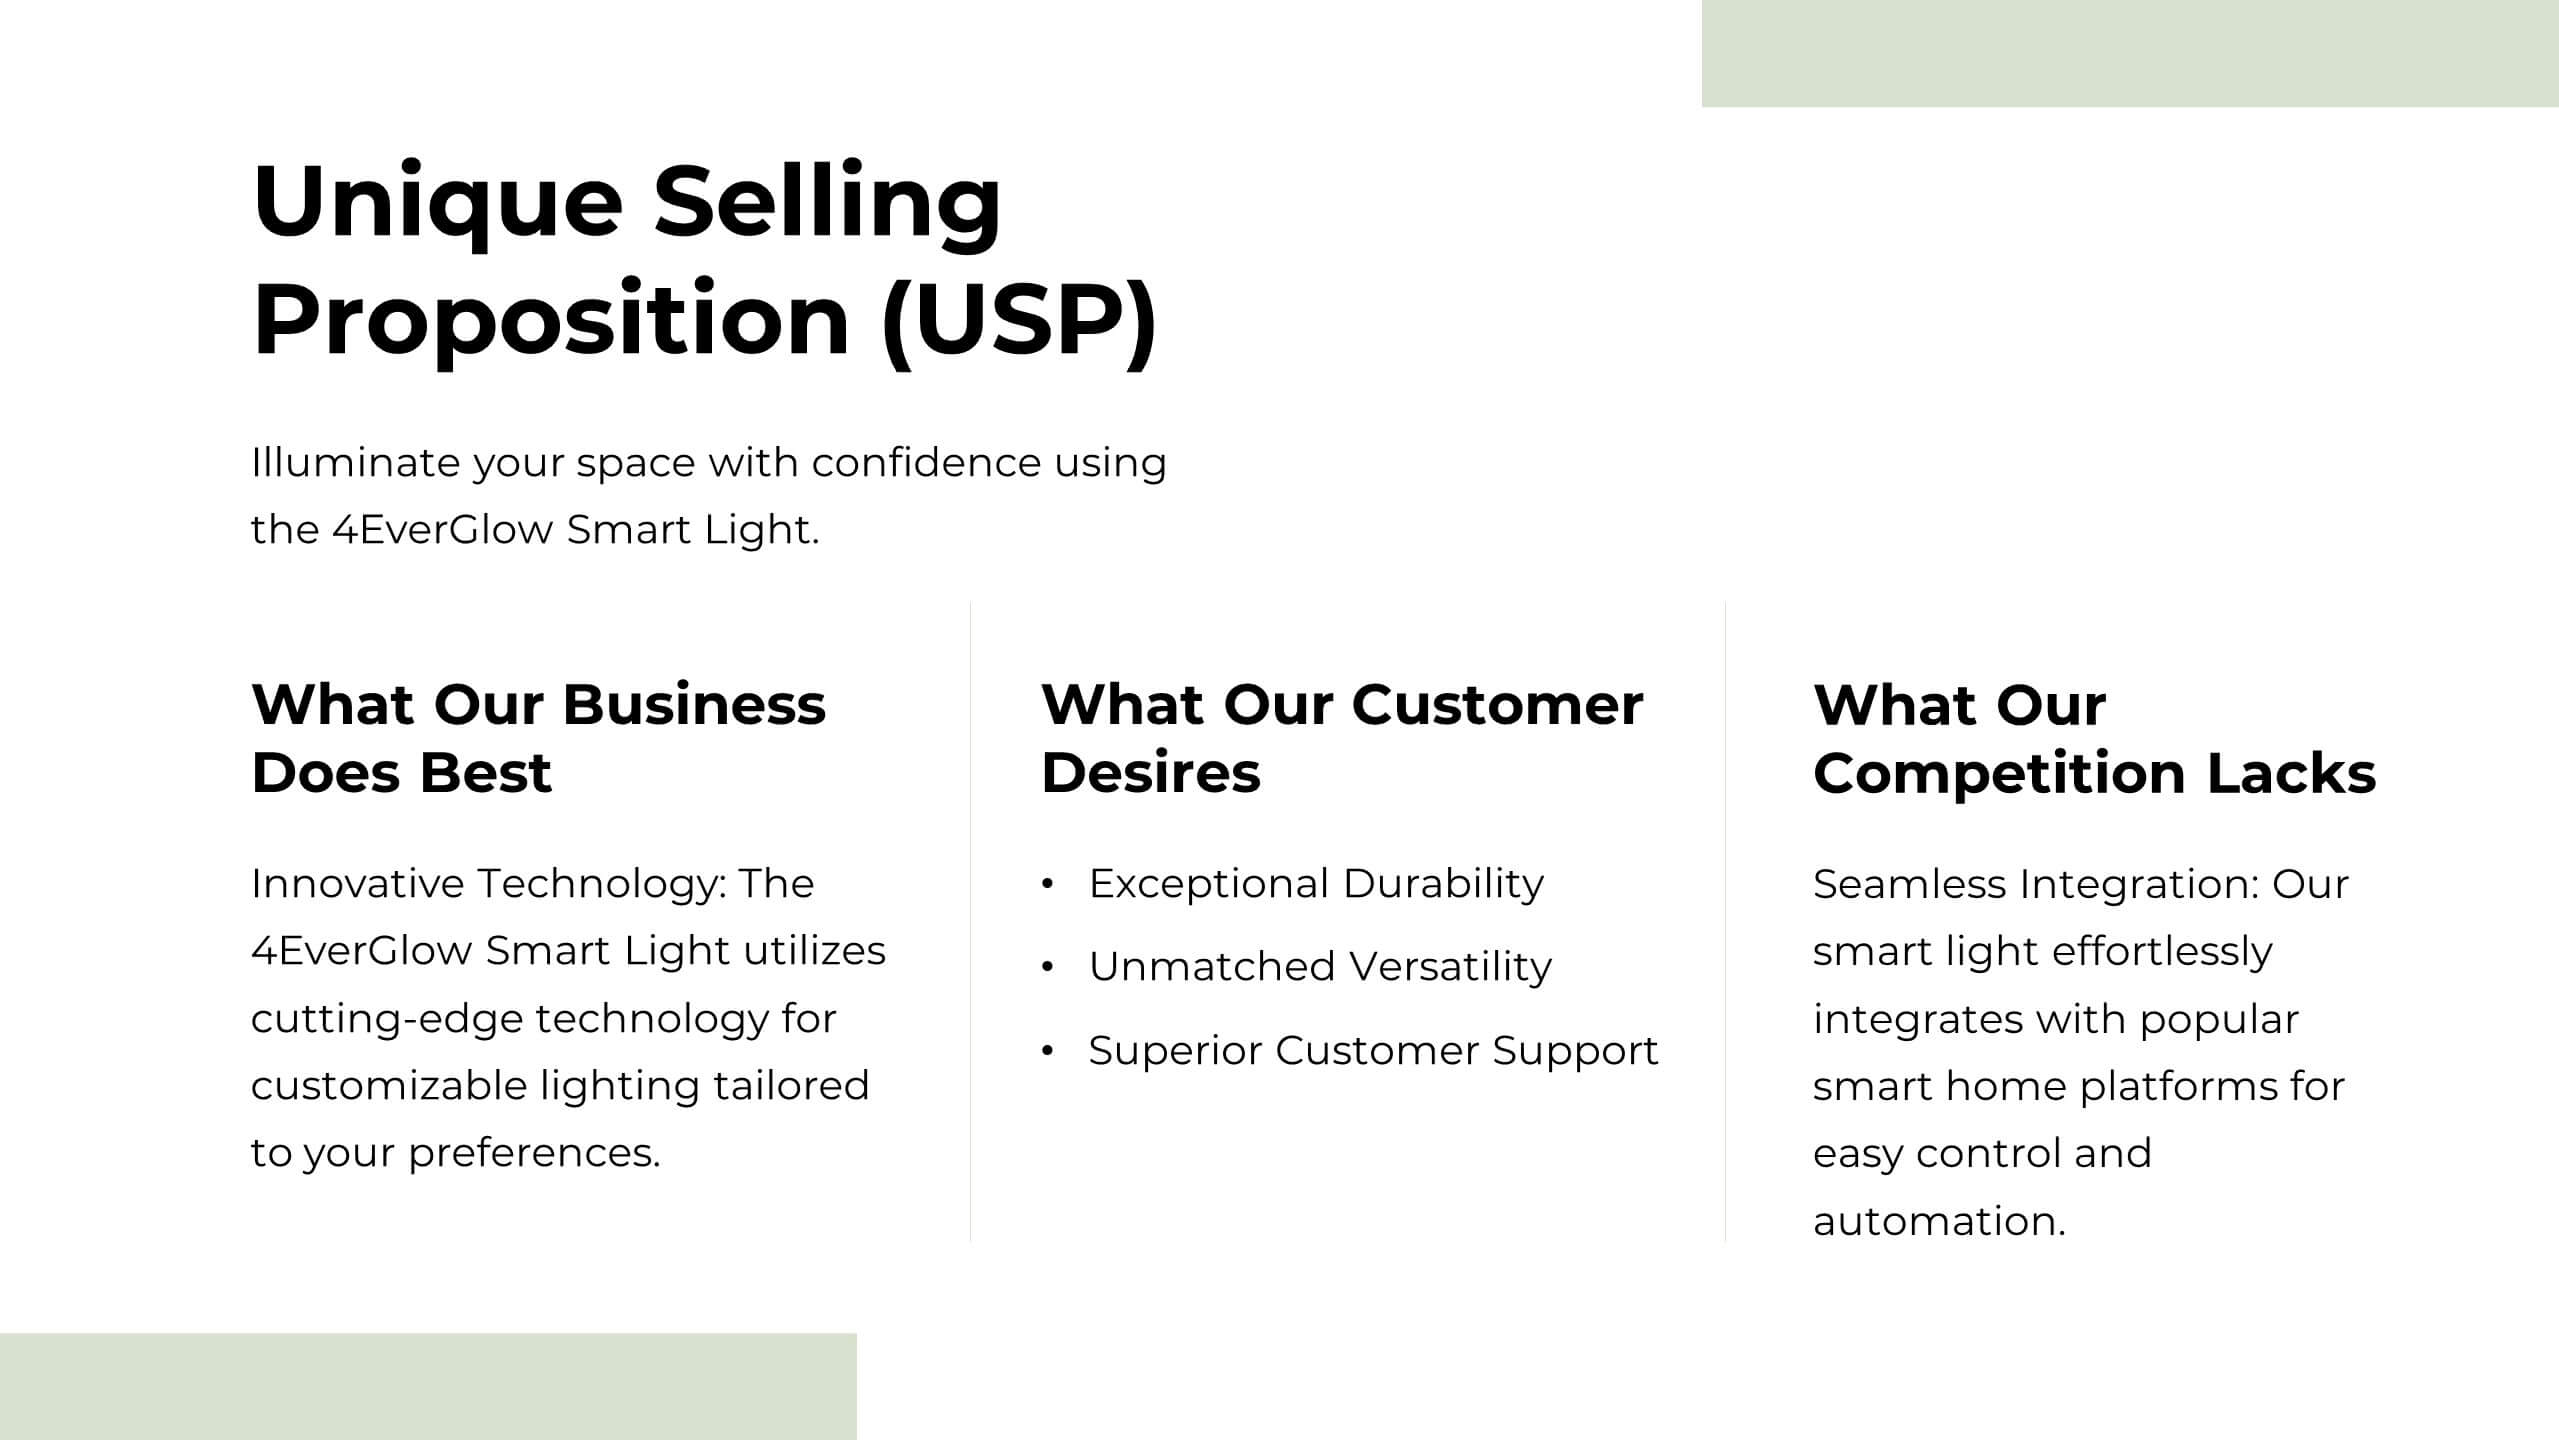
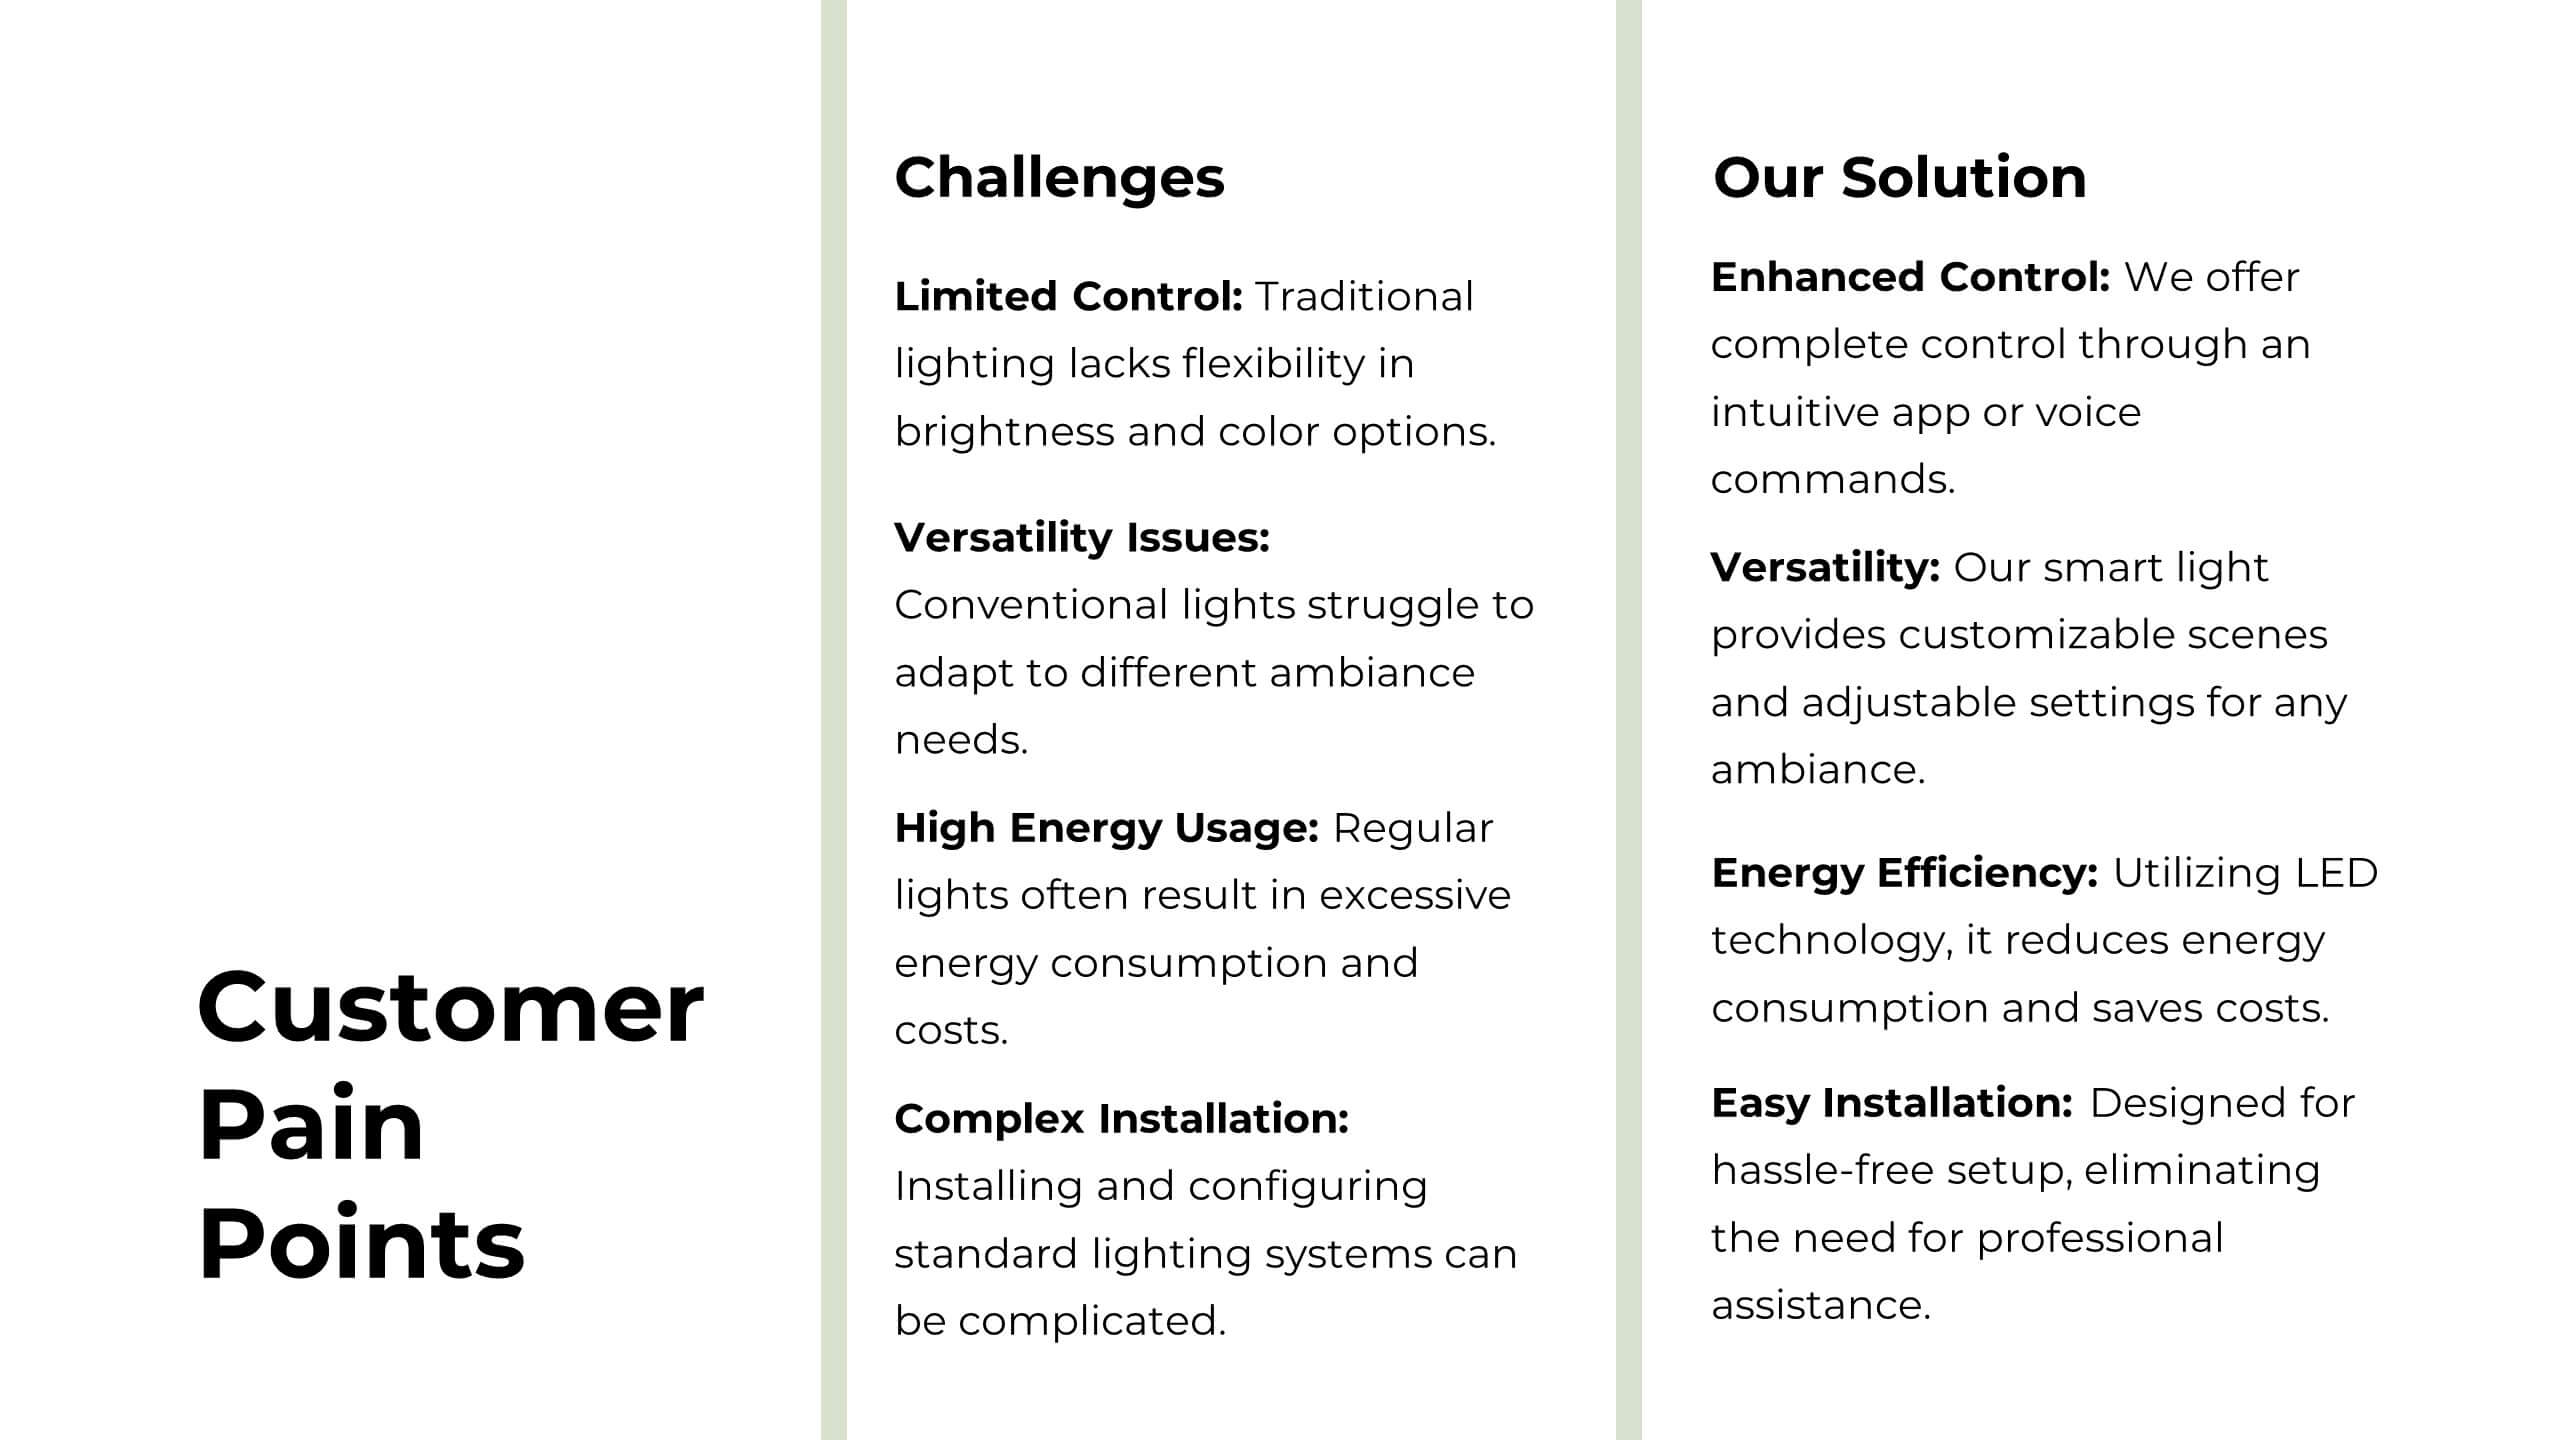
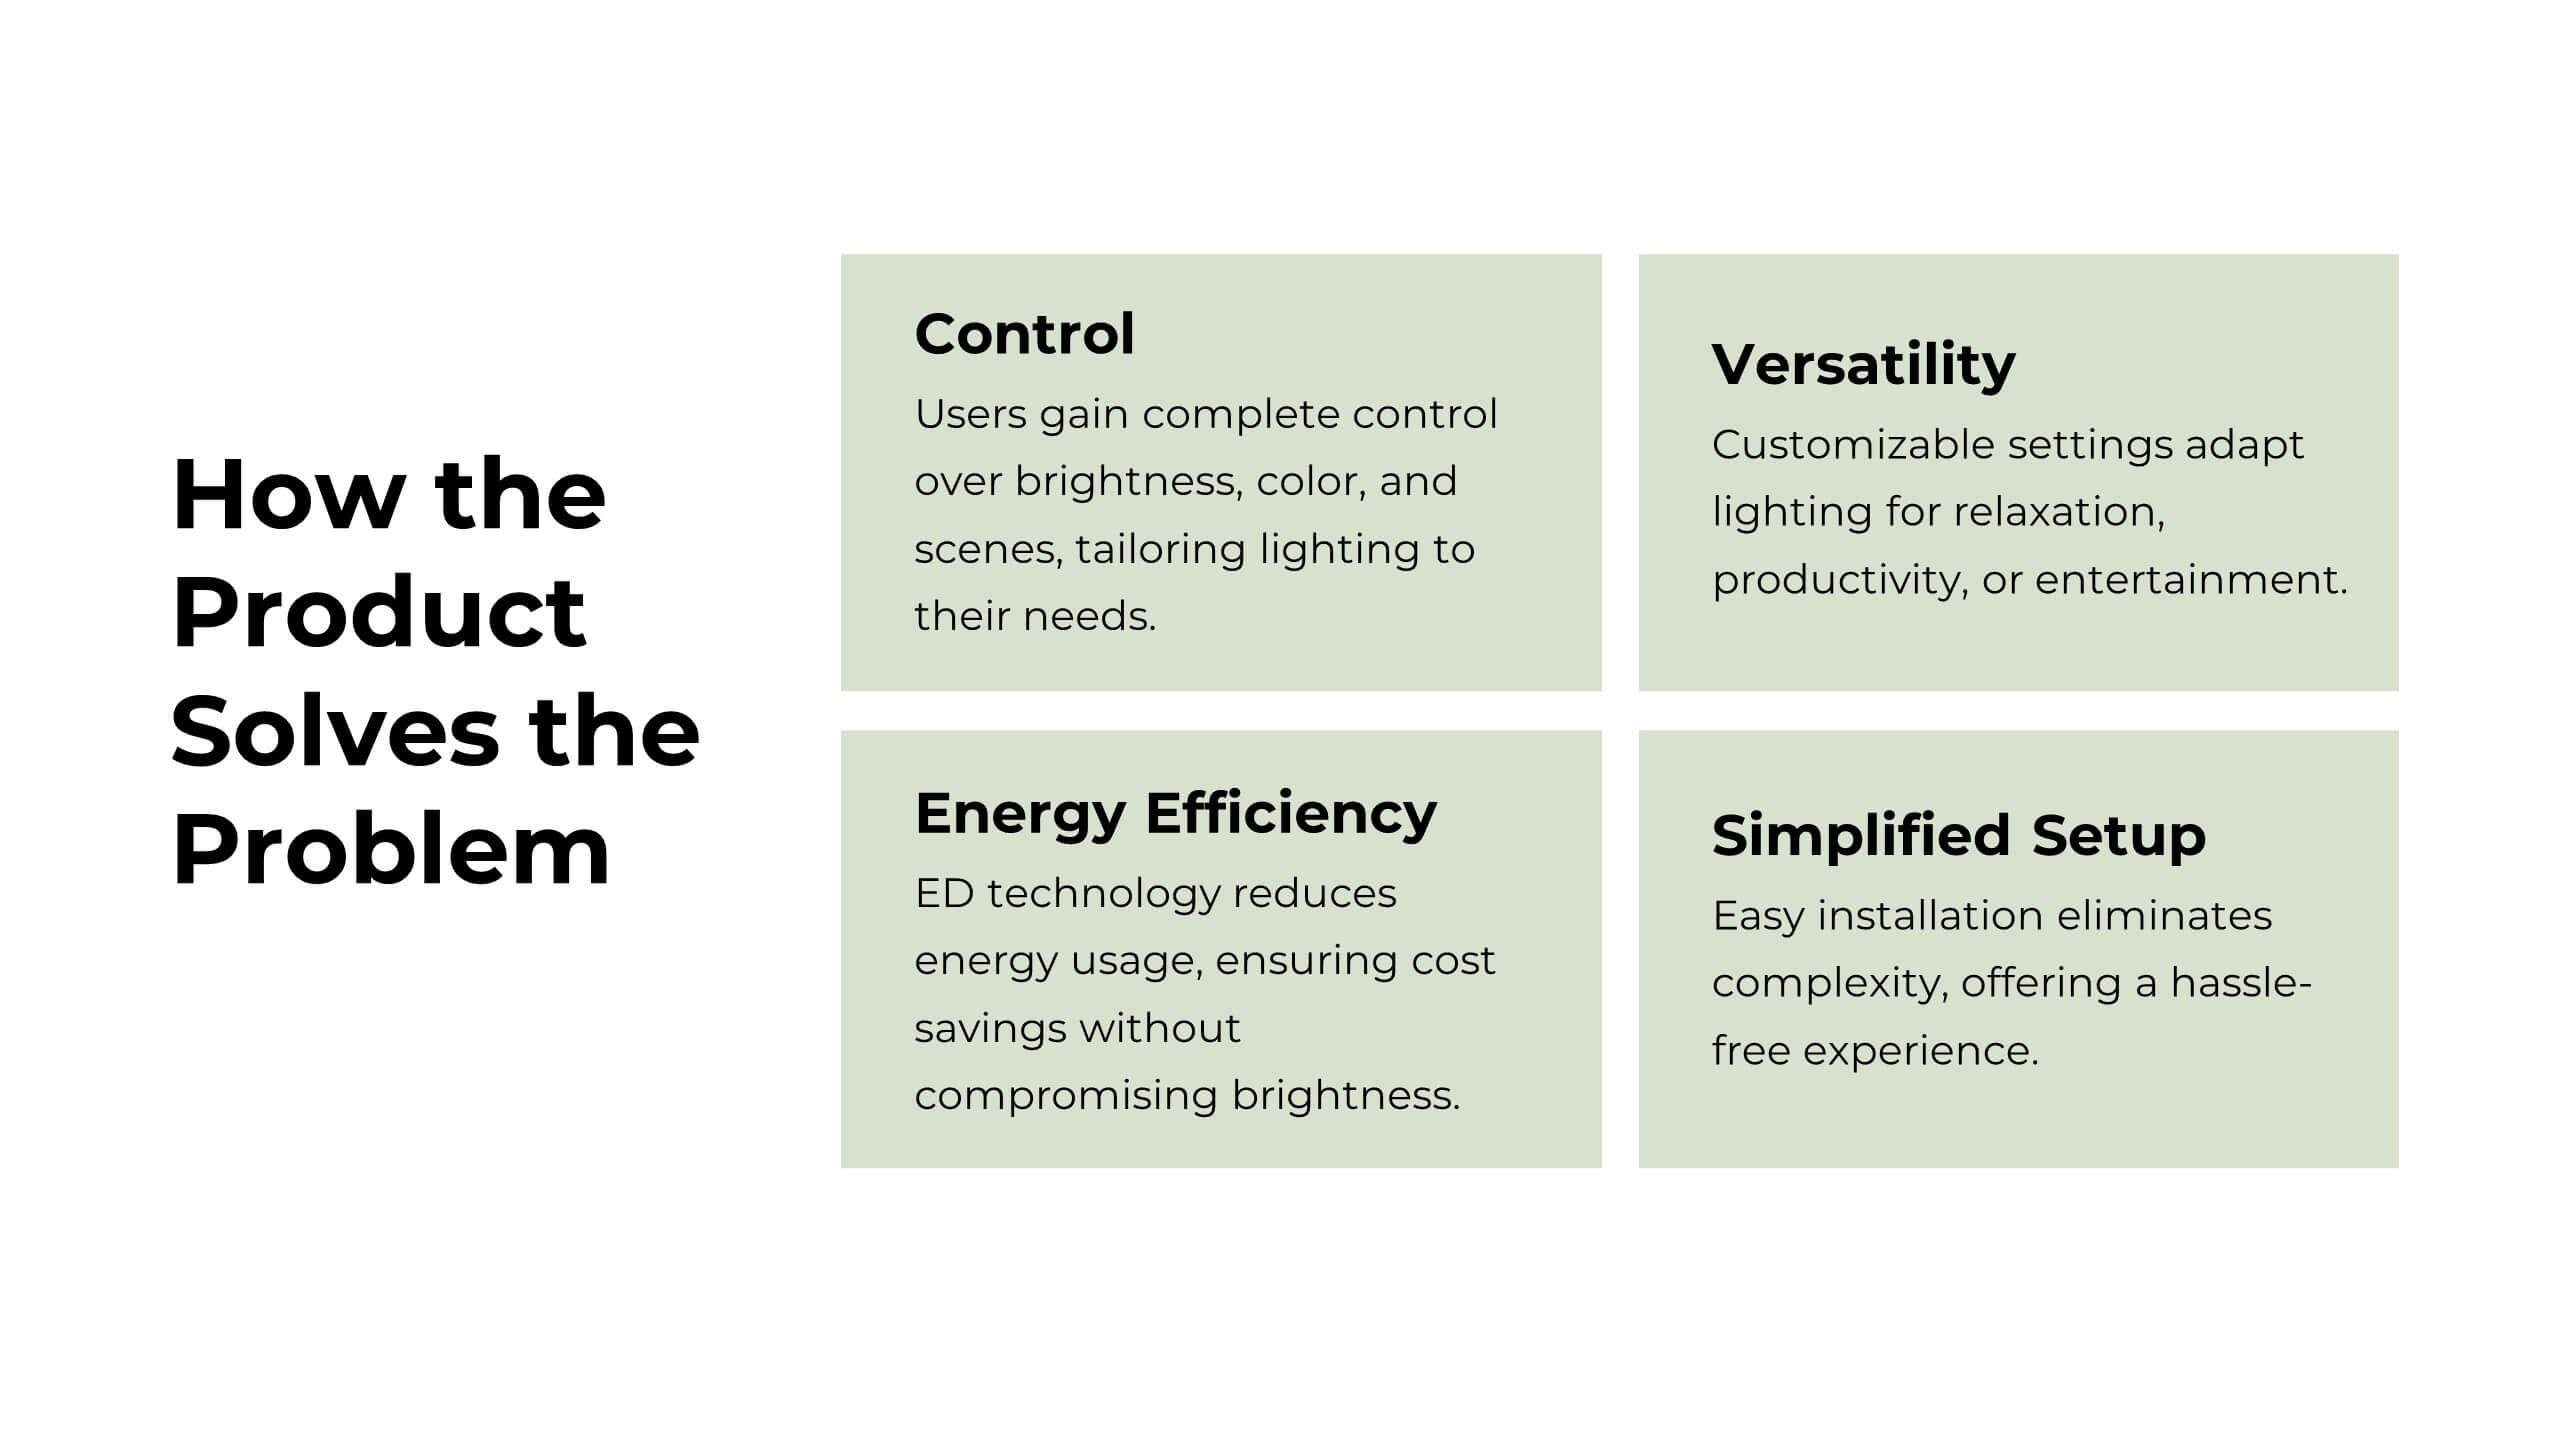
Features
- 8 Unique slides
- Fully editable and easy to edit in Microsoft Powerpoint, Keynote and Google Slides
- 16:9 widescreen layout
- Clean and professional designs
- Export to JPG, PDF or send by email


Do you have any questions?
Recommend


6 slides
COVID-19 Impact on Business Presentation
Visually communicate the key effects of the pandemic with this clean and engaging slide layout. Featuring a central storefront icon surrounded by six customizable virus-themed icons, this design allows you to outline critical changes, challenges, or strategic shifts. Ideal for presentations on crisis management, business continuity, or recovery planning. Fully editable in PowerPoint, Keynote, and Google Slides.


2 slides
Engaging Opening Introduction Presentation
Make a lasting first impression with this Engaging Opening Introduction Slide. Designed for professional presentations, networking events, and business pitches, this slide offers a modern, structured layout with a dynamic image section and clear text area. Fully customizable in PowerPoint, Keynote, and Google Slides, you can easily adjust colors, fonts, and content to match your brand.


4 slides
Key Business Statistics Presentation
Transform raw numbers into a compelling visual story with a clean and structured layout that highlights key insights effortlessly. Ideal for showcasing progress, analytics, and results, this design helps simplify complex data for clear communication. Fully editable and compatible with PowerPoint, Keynote, and Google Slides for seamless customization.


10 slides
Process Flow Chart Presentation
Visualize your process with clarity using the Process Flow Chart Presentation. Featuring a central hexagon design branching out into four sequential steps, this layout is perfect for showcasing workflows, procedures, or business strategies. Color-coded options and dark/light theme variations add versatility. Fully customizable in PowerPoint, Keynote, and Google Slides.


24 slides
Blazewind User Experience Proposal Presentation
This UX Strategy Plan Presentation Template is a comprehensive and visually engaging solution for presenting user experience design strategies. Covering key elements such as research, wireframing, prototyping, user testing, and design principles, it ensures a structured approach to showcasing your UX process. Ideal for UX/UI designers, agencies, and businesses looking to communicate their design strategies effectively. Fully compatible with PowerPoint, Keynote, and Google Slides for seamless customization.


31 slides
Astralis Brand Strategy Report Presentation
Present your brand strategy effectively with this well-structured presentation template. This comprehensive design covers all essential aspects, including vision and positioning, identity components, brand guidelines, and touchpoints. It is perfect for showcasing how your brand stands out, communicates, and connects with its audience. Highlight your unique selling points, ensure visual consistency with color palettes, and emphasize your brand's voice through tailored sections. This template is easy to customize and works seamlessly across PowerPoint, Google Slides, and Keynote, ensuring accessibility for all. Empower your brand strategy discussions with a professional and polished design.


7 slides
Africa Regions Map Infographic
This Africa Regions Map infographic template is a comprehensive visual tool designed to highlight key data points across the continent's diverse regions. It is versatile and easily adaptable for use in PowerPoint, Google Slides, and Keynote. The template includes various geographic layouts and data visualization elements like human figures for population representation, color-coded regions for quick reference, and icon-based markers for specific data points such as economic indicators or social statistics. Each slide is crafted to allow for clear presentation of information ranging from demographic distributions to project locations, making it an invaluable resource for educators, and organizations working with African continental data.


5 slides
Financial Credit Card Management Presentation
Present credit card processes, workflows, or customer engagement steps with this clean, step-by-step infographic layout. Featuring five clearly defined stages, icons, and space for key insights, it’s perfect for visualizing application journeys, fraud prevention, or usage optimization. Great for banks, fintech presentations, or financial coaching. Fully editable in PowerPoint, Keynote, and Google Slides.


5 slides
Strategic Inquiry Mapping Presentation
Bring your ideas to life with a fresh visual flow that maps key questions into action. This strategic template helps you organize complex inquiries across five stages—from insights and communication to analysis and execution. Fully editable and easy to use in PowerPoint, Keynote, and Google Slides for clear visual storytelling.

20 slides
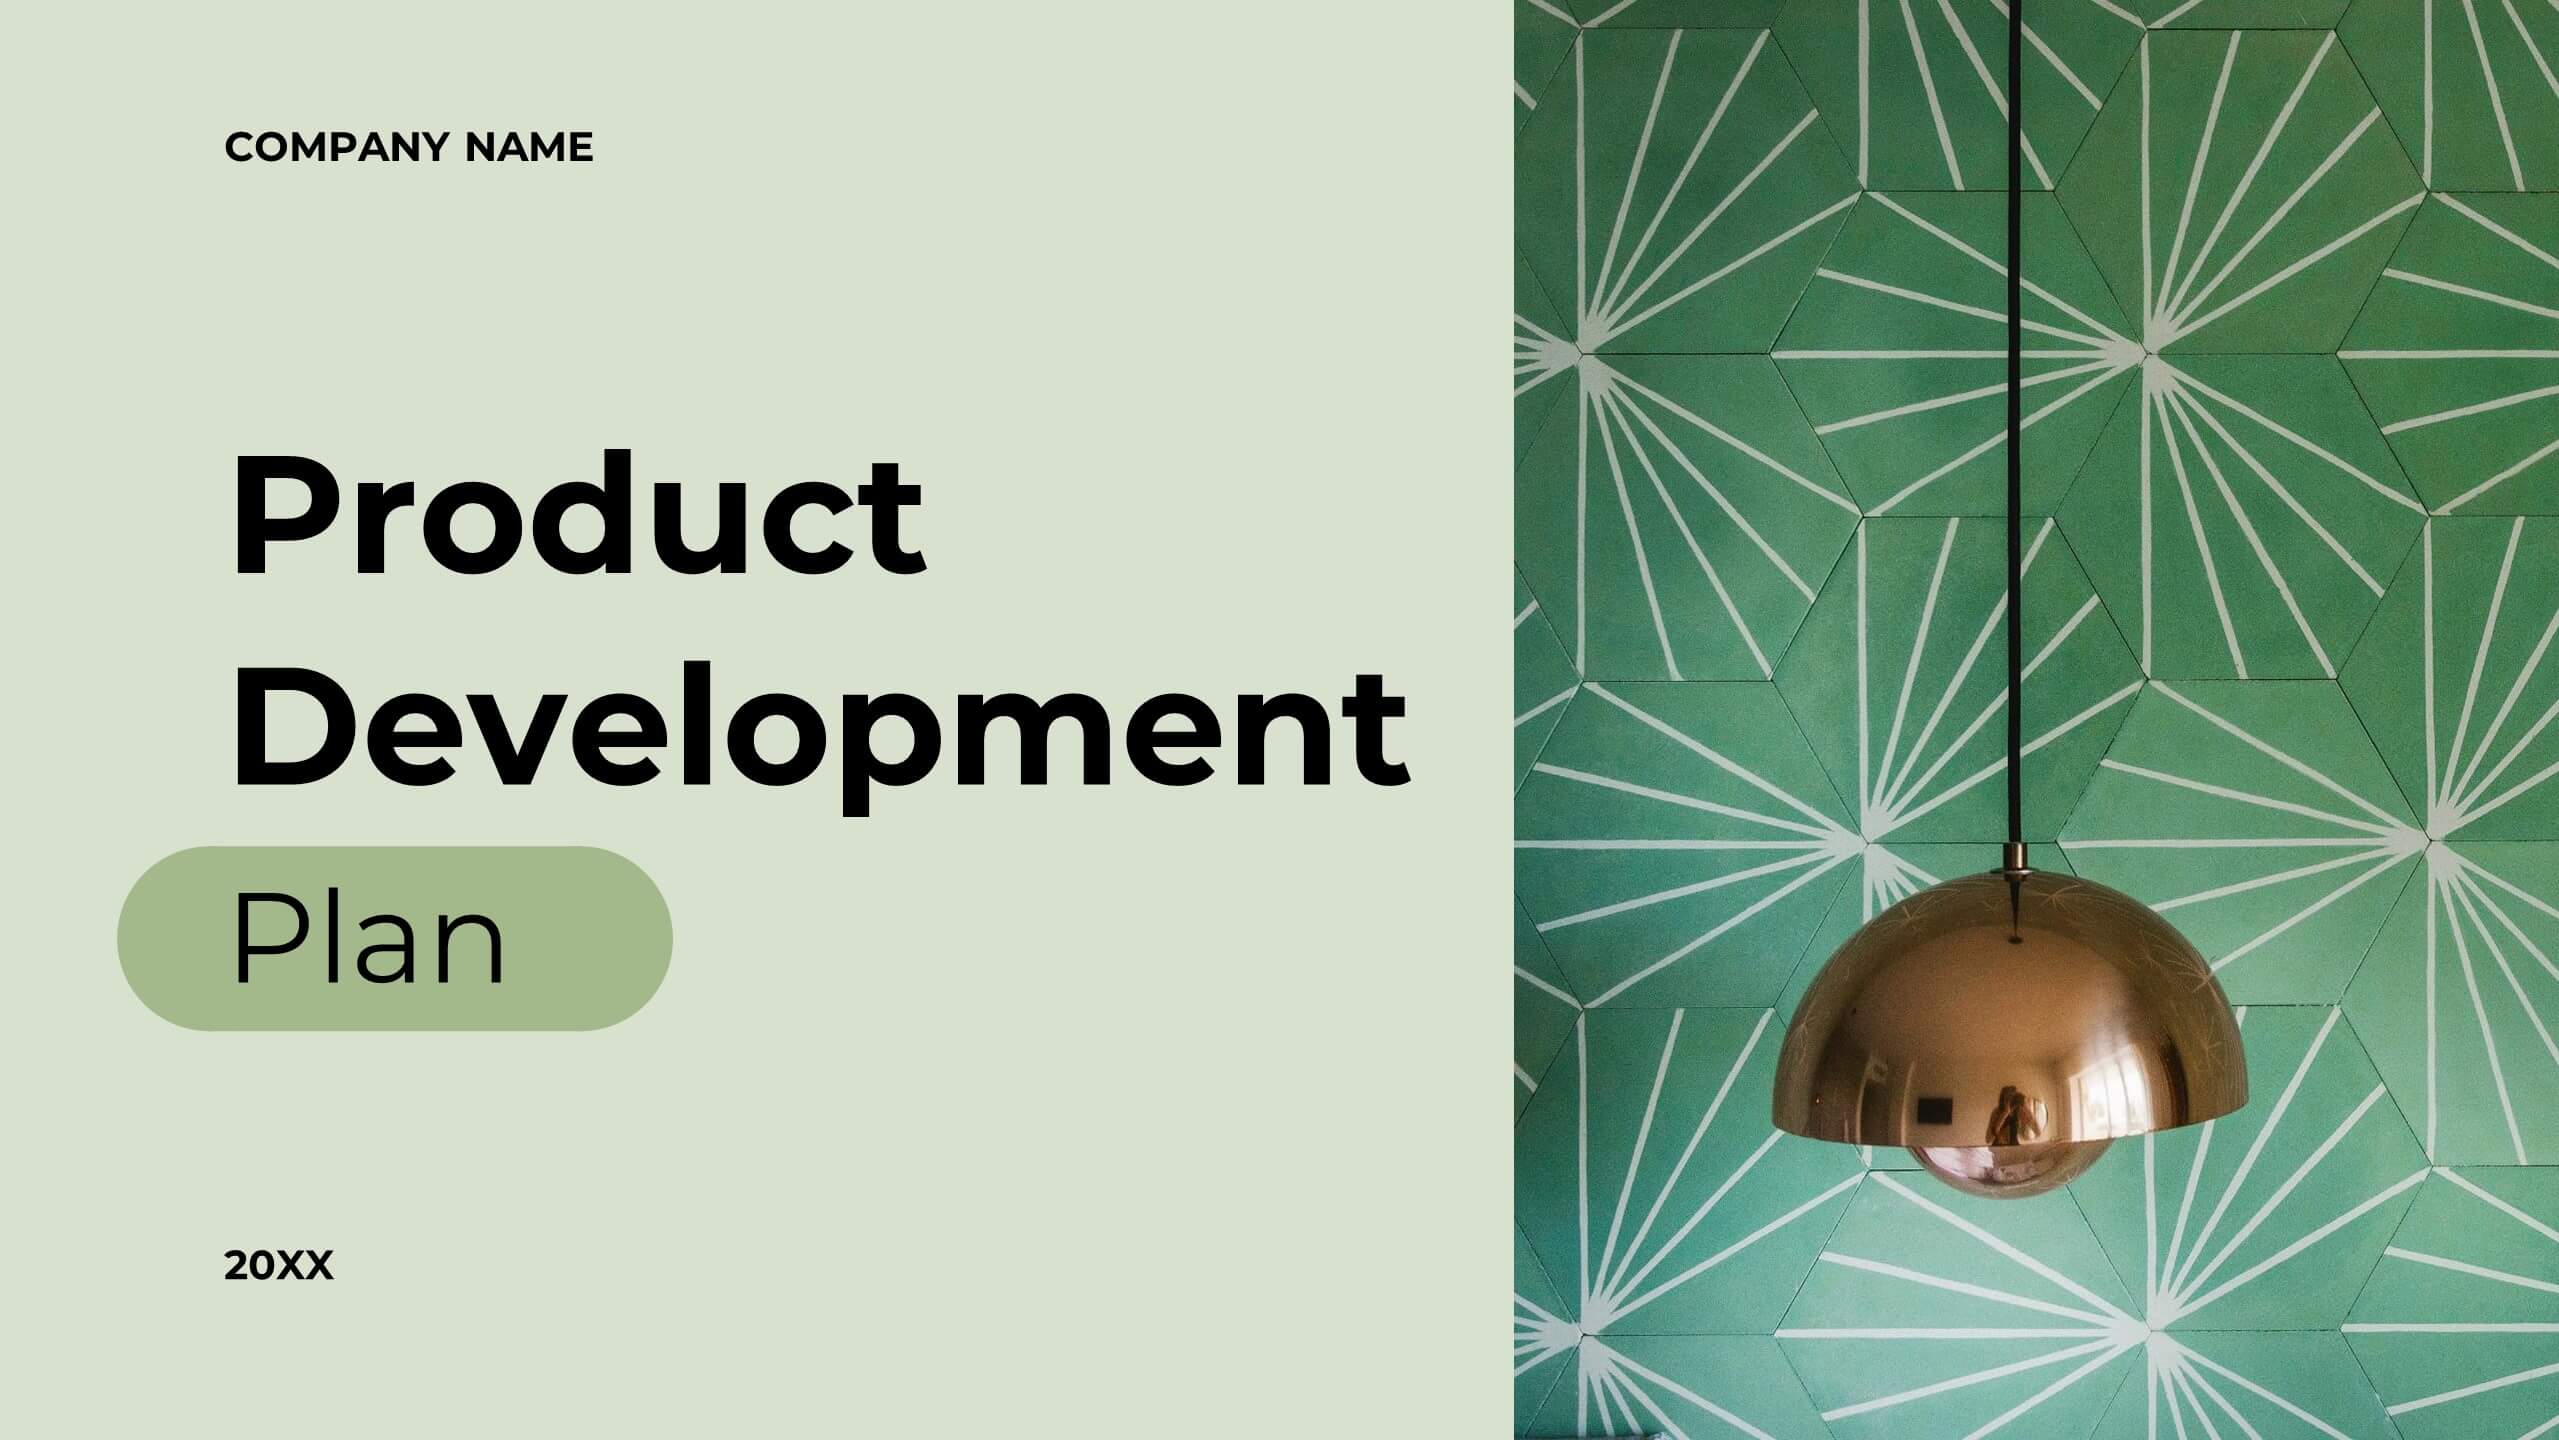
Glint Product Launch Presentation
Develop your product with confidence using this detailed product development plan template! Perfect for outlining features, market analysis, and competitive advantages. Ensure your team's efforts are aligned and maximize the impact of your product launch. Compatible with PowerPoint, Keynote, and Google Slides, it’s your ideal companion for successful product development.


5 slides
Real Estate Investing Infographics
Real estate investing refers to the purchase, ownership, management, rental, or sale of real estate properties with the objective of generating income and/or capital appreciation. These infographic templates can be used to provide key information and insights about real estate investing. These are designed to educate individuals about the basics of real estate investing, its benefits, and important considerations to help them make informed investment decisions. These infographics are great for anyone seeking to understand the basics of real estate. Compatible with Powerpoint, Keynote, and Google Slides.


7 slides
SEO Agency Infographic
A Search Engine Optimization (SEO) agency is a company or organization that provides specialized services aimed at improving a website's visibility in search engines like Google, Bing, and Yahoo. The primary goal of this infographic is to help businesses increase their online presence and drive more organic traffic to their website, ultimately leading to higher visibility, increased website visitors, and potential customers. Compatible with Powerpoint, Keynote, and Google Slides. This vibrant, energetic template is tailor-made for the modern-day digital warrior, ready to conquer the realm of online visibility.


21 slides
Stellar Content Marketing Pitch Deck Presentation
The Stellar Marketing Pitch Deck template is designed to make your marketing strategies shine like never before! This template is perfect for showcasing your business's potential and engaging your audience with sleek, modern designs that capture attention. Start with a powerful introduction, leading into an in-depth industry overview that highlights key trends and consumer behaviors. With dedicated sections for emerging technologies, content marketing trends, and data-driven marketing, you'll have everything you need to present your innovative approach. The template also includes slides for social media strategies, influencer marketing, and SEO trends, ensuring you're covering all the bases. Personalization trends and video marketing evolution are featured to show your forward-thinking approach, while the customer experience focus slide emphasizes your commitment to quality. Finish strong with insights into e-commerce trends, brand storytelling, and sustainability in marketing. This template is fully compatible with PowerPoint, Keynote, and Google Slides, making it versatile and easy to use for any marketing presentation.


8 slides
Medical Anatomy Study
Deliver engaging medical insights with this professionally designed anatomy slide. Perfect for health education, biology lessons, or healthcare proposals, this layout highlights key internal systems with clean visuals. Editable in PowerPoint, Keynote, and Google Slides—customize the organs, labels, and notes with ease.


26 slides
Raoul Presentation Template
Are you looking for business presentation template with a powerful framework that allows you to present and promote your latest ideas? Raoul is a sleek and clean, bold business presentation template. It's perfect for sharing your ideas, brand identity and how you want to be perceived with the world, in an appealing way. Raoul is great presentation for big or small businesses, company owners, reporters or managers. This template is all about simplicity and style. You will gain authority and convince others with this masterfully crafted professional presentation design.


10 slides
Logistics and Procurement Supply Chain
Streamline your supply chain narrative with this clean, visual timeline layout. Perfect for operations managers, logistics planners, or procurement leads, this slide breaks down each stage of the supply chain process with color-coded segments and intuitive icons. Fully editable in PowerPoint, Keynote, and Google Slides.


10 slides
Risk Management in Insurance
Visualize your insurance risk strategies with this engaging umbrella-themed presentation. Designed to illustrate layered risk coverage or multi-step assessments, this slide set is ideal for analysts, agents, or consultants. Each section is clearly numbered and color-coded for easy understanding. Fully editable in PowerPoint, Keynote, and Google Slides.