


Features
- 26 Unique slides
- Fully editable and easy to edit in Microsoft Powerpoint, Keynote and Google Slides
- 16:9 widescreen layout
- Clean and professional designs
- Export to JPG, PDF or send by email


Do you have any questions?
Recommend


5 slides
Project Boundaries and Deliverables Presentation
Visualize key checkpoints with the Project Boundaries and Deliverables Presentation. This flag-style timeline infographic clearly marks each phase of your project journey—ideal for outlining scope, goals, and delivery milestones. Designed for clarity and progress tracking, this template works seamlessly in PowerPoint, Keynote, and Google Slides.


6 slides
Business Strategy Wheel Model Presentation
Present your key strategic components in a clear, circular layout with this wheel model template. Ideal for outlining interconnected steps, departments, or initiatives, this design allows you to visualize all six elements of your strategy at once. Fully customizable in PowerPoint, Keynote, and Google Slides.


22 slides
Dakota Corporate Strategy Agenda Presentation
Maximize your strategic sessions with this dynamic corporate strategy agenda presentation template. This template is designed to streamline your business discussions, featuring sections for everything from speaker introductions to session overviews and networking breaks. It’s ideal for conferences, workshops, or any corporate gatherings where a clear, structured schedule is essential. Compatible with major platforms like PowerPoint, Google Slides, and Keynote, it ensures you can organize and execute your agenda efficiently, fostering effective communication and collaboration across your team.


5 slides
Harvey Ball Rating System Overview Presentation
Visualize performance ratings or feature comparisons with the Harvey Ball Rating System Overview Presentation. This template uses vertical bar visuals combined with Harvey ball icons to communicate progress, satisfaction, or status across four key areas. Clean, intuitive, and ideal for executive summaries or status dashboards. Fully editable and compatible with PowerPoint, Keynote, and Google Slides.


6 slides
Oceania Regional Coverage Strategy Presentation
Plan and present your regional focus with the Oceania Regional Coverage Strategy Presentation. This slide template features a clear map of Oceania with pinpoint markers and corresponding callout labels, perfect for visualizing expansion zones, logistics hubs, or target markets. Fully customizable in Canva, PowerPoint, and Google Slides.


4 slides
Layered Strategy Circles Presentation
Bring your strategy to life with a sleek circular layout that visually connects goals, actions, and outcomes in a unified flow. Perfect for showcasing layered processes or business frameworks, this design keeps complex ideas simple. Fully editable and compatible with PowerPoint, Keynote, and Google Slides for smooth customization.


26 slides
Beginner's Guide to Investing Presentation
This presentation template is a fantastic starting point for anyone looking to dive into the world of investing. Designed with clarity and accessibility in mind, it caters specifically to beginners eager to understand the fundamentals of investment strategies and options. The template introduces users to the basics of stocks, bonds, and other investment vehicles, using easy-to-understand language and clear, informative visuals. The content is laid out in a logical sequence, beginning with basic concepts and gradually progressing to more complex investment ideas and strategies. Slides are enriched with diagrams, charts, and comparison tables that break down financial data and trends in a digestible format. Key investment terms are explained through engaging infographics that make learning both interactive and effective. To ensure a broad usability range, the template is fully compatible with popular presentation platforms such as PowerPoint, Google Slides, and Keynote. This compatibility allows users to easily adapt and present the information across different devices and settings, making it an invaluable tool for personal education or group training sessions in various learning environments.


43 slides
UX UI Structure Presentation
Dive into UX with this comprehensive, elegant presentation template tailored for detailed case studies and user research. Perfect for mapping user journeys, creating personas, and showcasing design principles, this template ensures your UX insights are clearly communicated. Its sleek design enhances readability and engagement. Compatible with PowerPoint, Keynote, and Google Slides, it's ideal for any platform.


21 slides
Velocity Startup Growth Plan Presentation
Accelerate your startup's growth with this dynamic plan template! Perfect for outlining your mission, vision, business model, and marketing strategy. Ideal for entrepreneurs aiming to secure funding and drive success. Compatible with PowerPoint, Keynote, and Google Slides, this template ensures your growth plan is clear, professional, and compelling. Achieve your startup goals today!


6 slides
Business Calendar and Monthly Overview Presentation
Bring structure to your chaos with a bold and colorful visual planner! This easy-to-use layout helps track tasks, deadlines, or projects across multiple months in one glance. Ideal for team coordination or solo planning. Fully editable and compatible with PowerPoint, Keynote, and Google Slides for seamless calendar-based presentations.


5 slides
Business and Personal Goal Planning Presentation
Align your vision with action using the Business and Personal Goal Planning slide. This clean, professional layout helps break down up to four key objectives using flag-themed visuals, customizable text blocks, and supportive icons. Perfect for comparing business goals with personal development targets in a single view. Fully editable in PowerPoint, Keynote, and Google Slides—ideal for team meetings, coaching sessions, or strategic planning.


8 slides
Effective Leadership Strategy
Visualize leadership pillars with this bold hexagonal layout designed to showcase four key components of effective leadership. Each colored segment allows you to present core strategies like vision, communication, decision-making, and team empowerment. Perfect for business training, organizational development, or executive briefings. Fully customizable in PowerPoint, Keynote, and Google Slides.


24 slides
Minerva UX Design Presentation
Elevate your UX design presentations with this comprehensive template, featuring sections for project overview, user research, wireframes, prototyping, and usability testing. Showcase design systems, branding guidelines, and accessibility considerations with ease. Perfect for demonstrating a user-centered approach. Compatible with PowerPoint, Keynote, and Google Slides for seamless customization.


4 slides
Types of Cloud Services Presentation
Turn technical concepts into clear, engaging visuals with this sleek and modern template. Perfect for showcasing digital platforms, cloud solutions, and service models, it helps you simplify complex data while maintaining a professional tone. Fully editable and compatible with PowerPoint, Keynote, and Google Slides for easy customization.


10 slides
Marketing Wheels Strategy Presentation
Turn your marketing process into a powerful visual story with this dynamic circular design. Each stage connects seamlessly to highlight planning, execution, and performance insights. Perfect for illustrating campaigns, workflows, or business strategies. Fully customizable and compatible with PowerPoint, Keynote, and Google Slides for effortless editing and presentation.


19 slides
Eclipse Detailed Project Execution Plan Presentation
Get ready to wow your audience with this mesmerizing project plan template! With its captivating eclipse design, every slide exudes professionalism and creativity. Perfect for showcasing project objectives, timelines, and deliverables, this template will keep your viewers engaged from start to finish. Compatible with PowerPoint, Keynote, and Google Slides!


26 slides
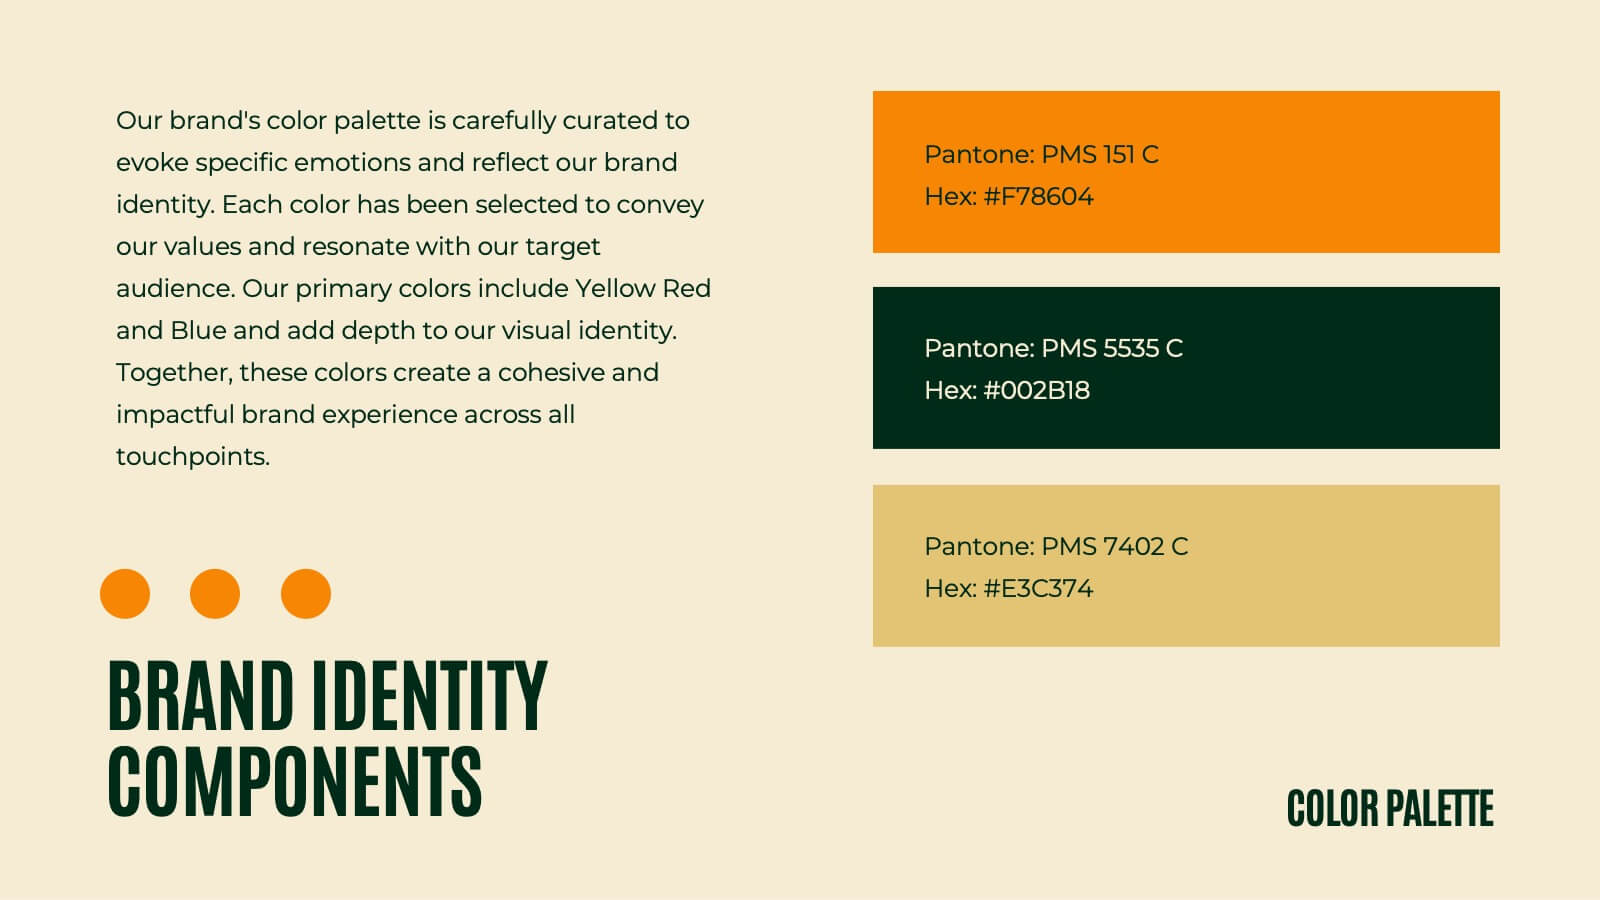
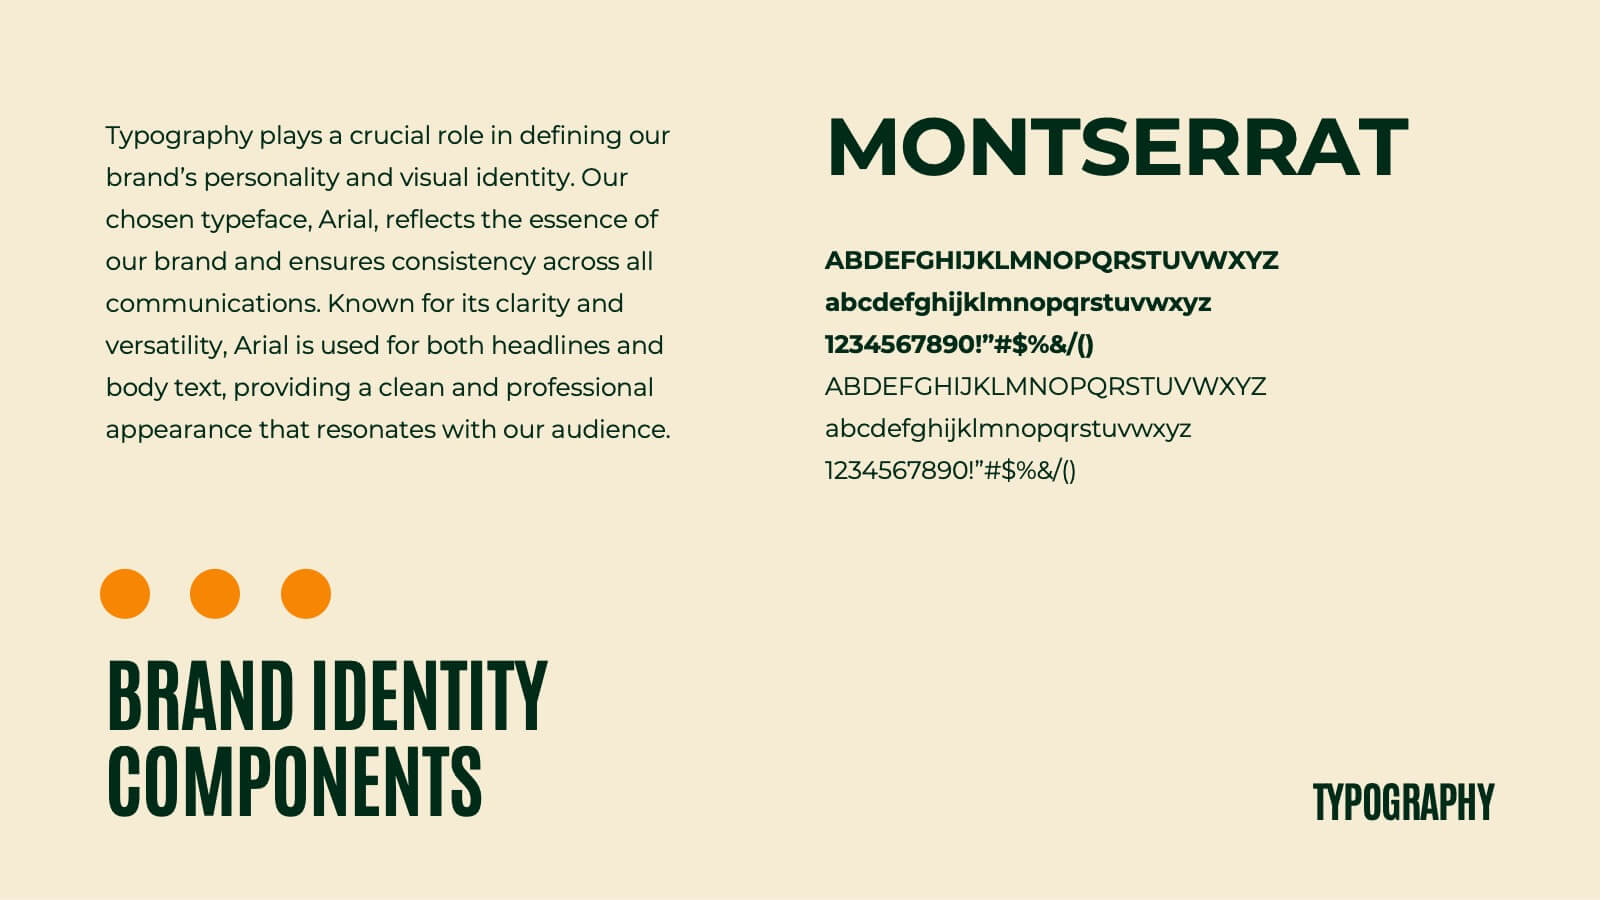
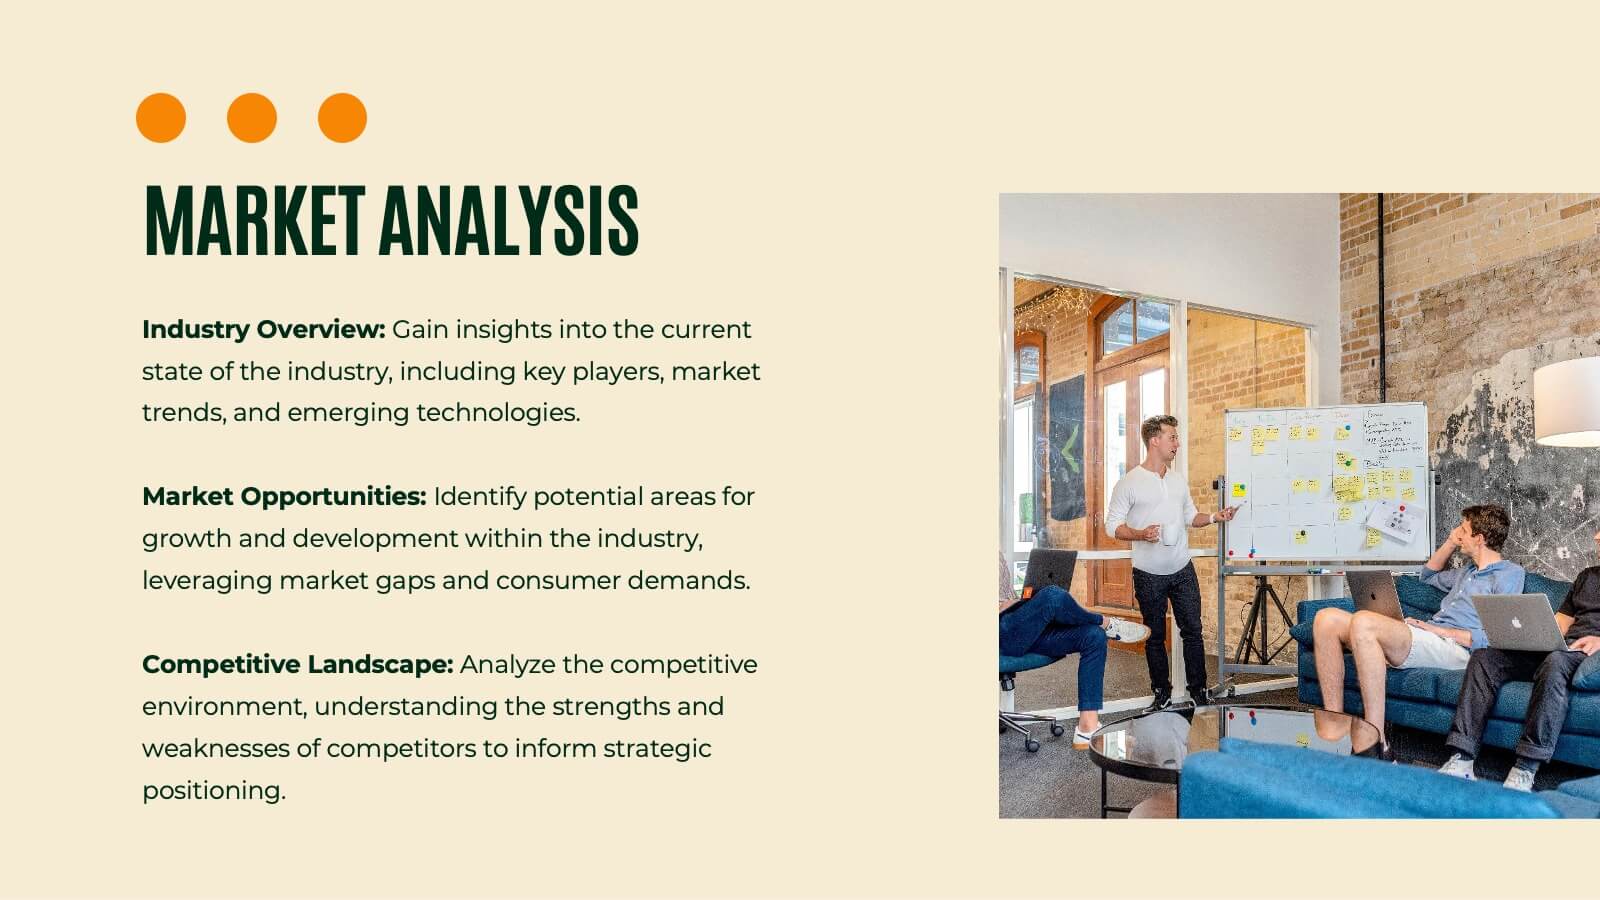
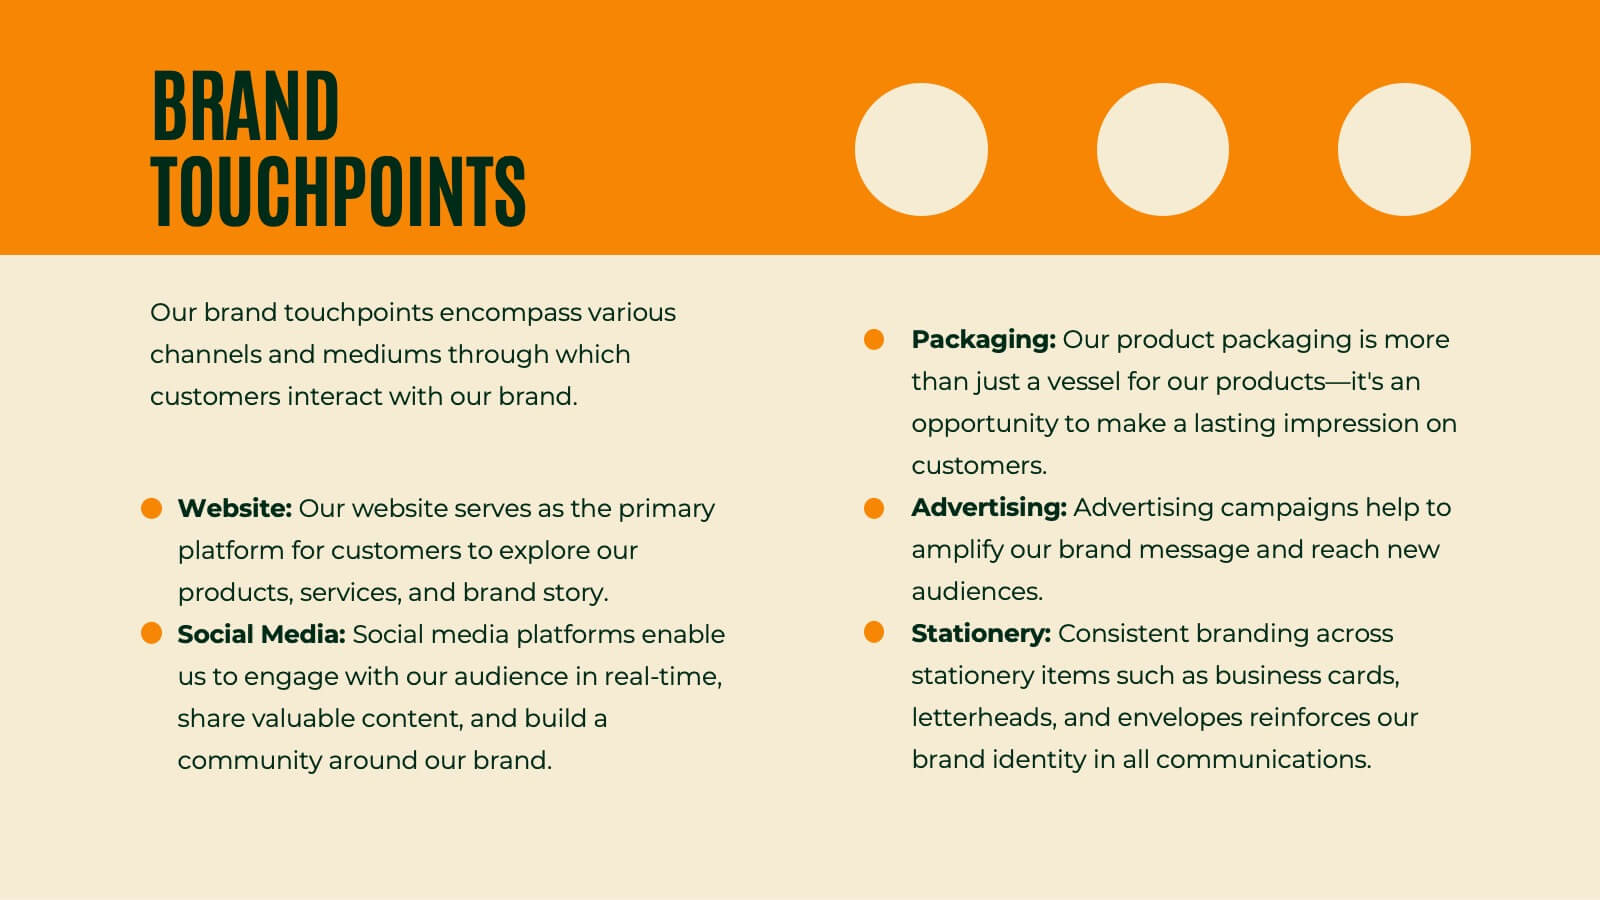
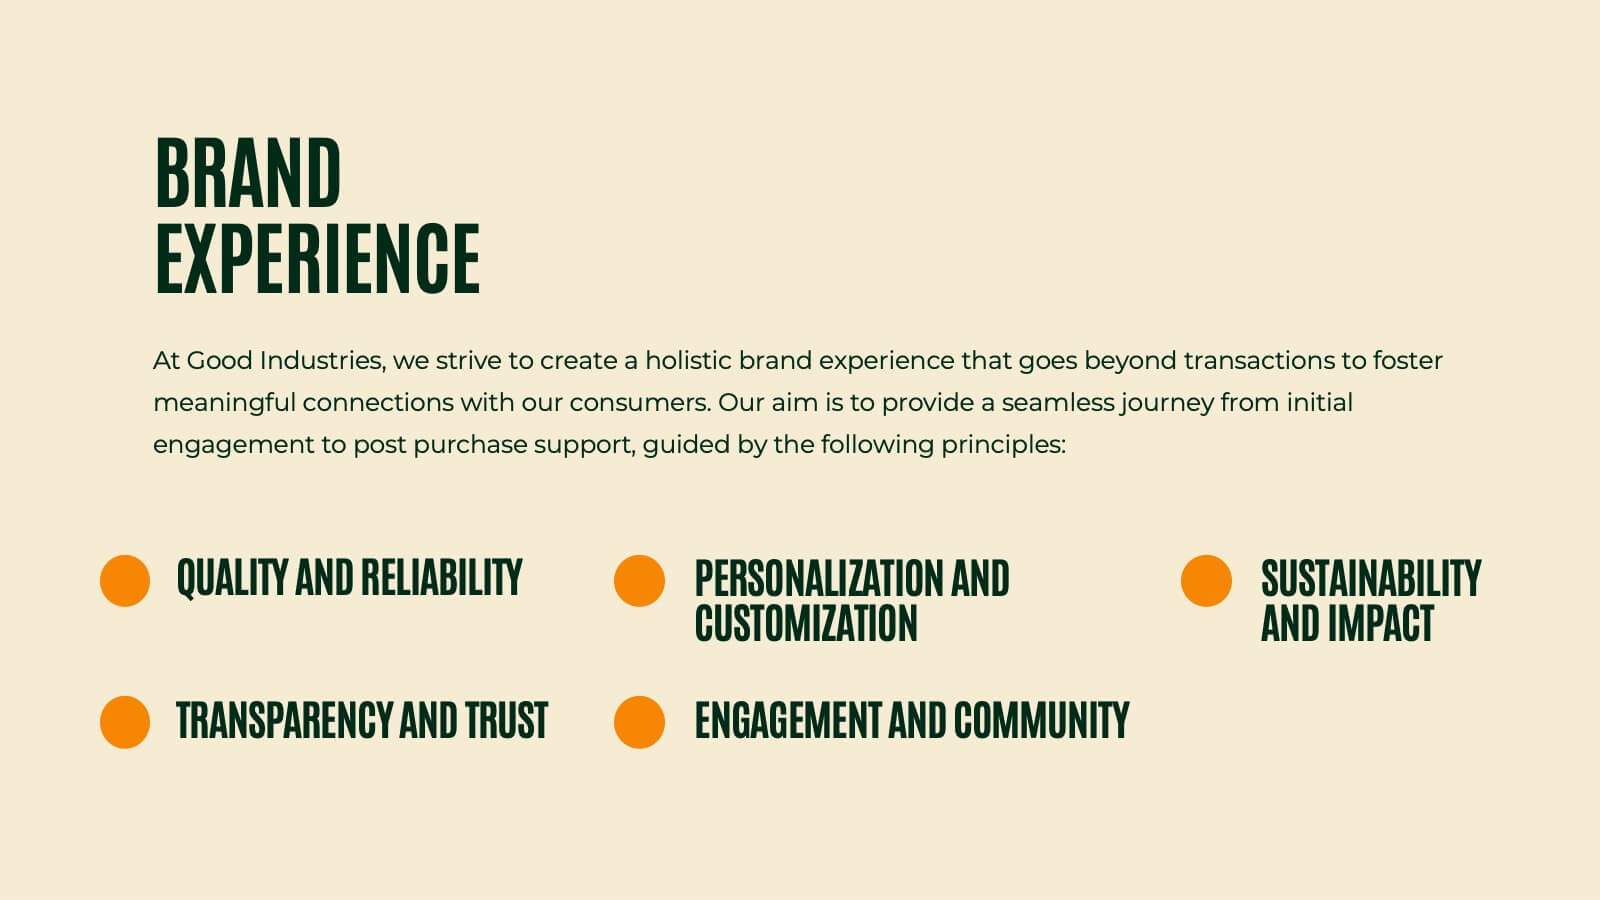
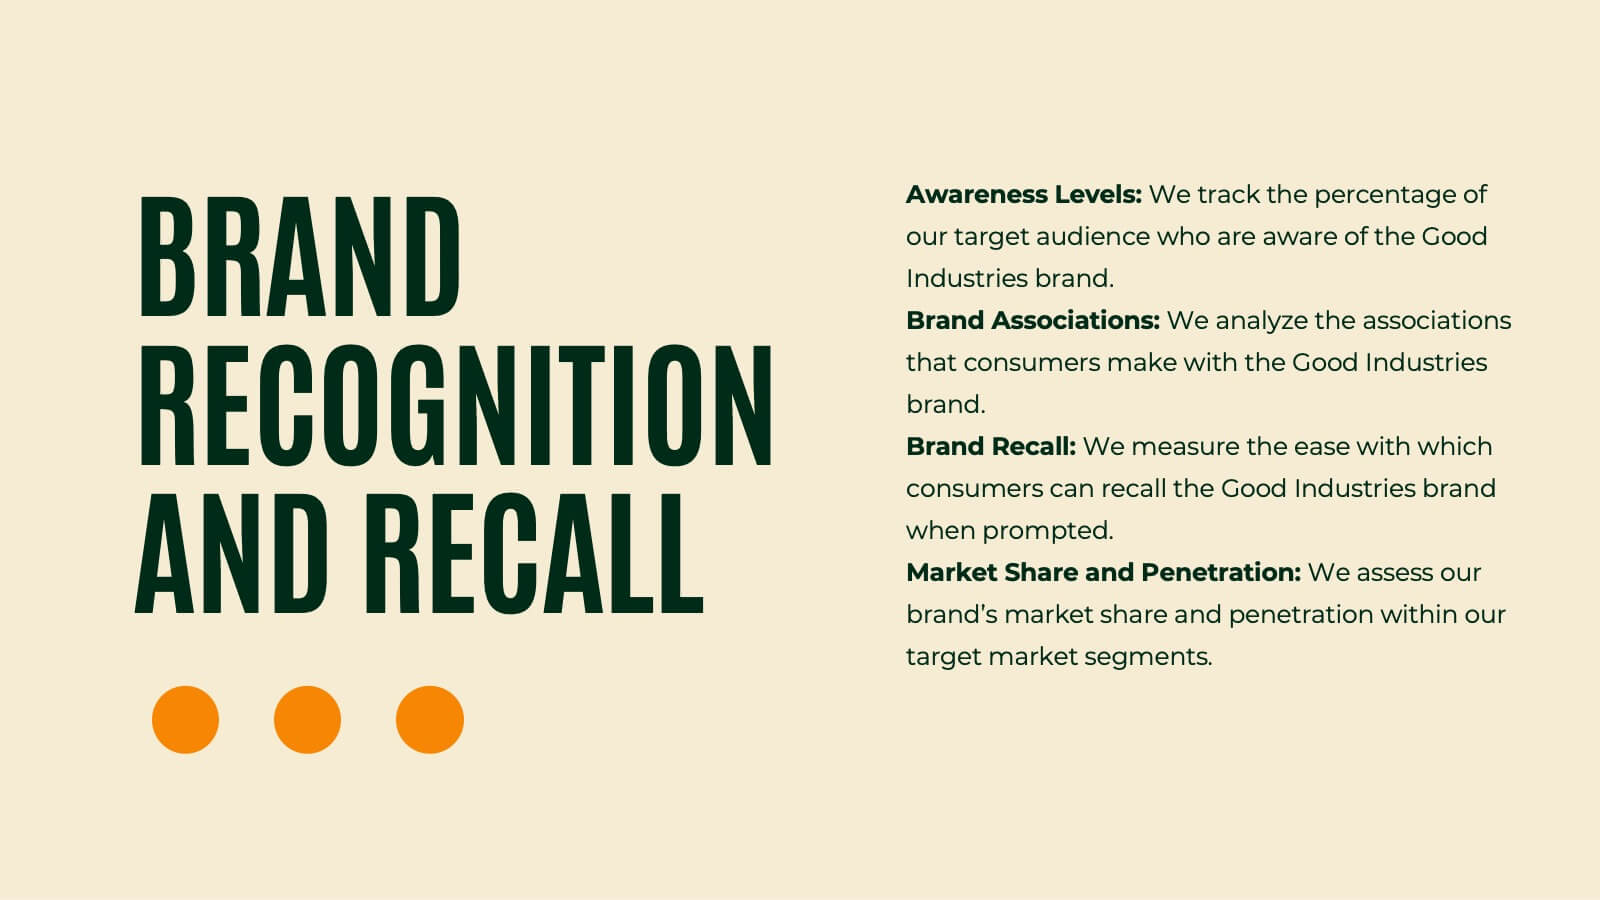
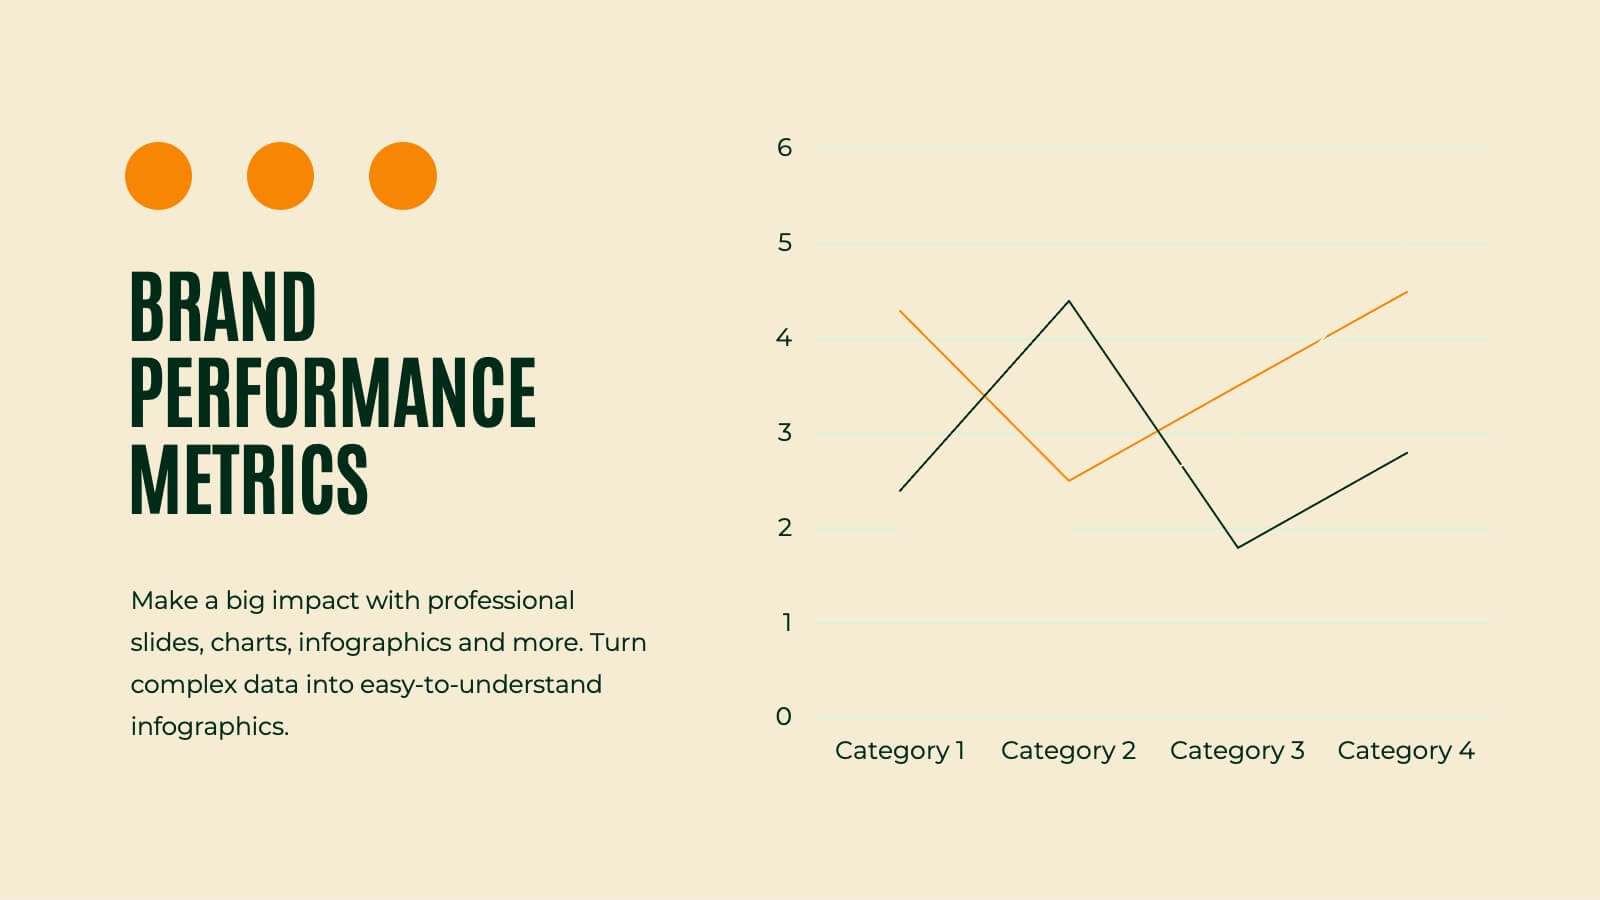
Griffin Rebranding Project Plan Presentation
Unleash the power of branding with this vibrant presentation template! This tool guides you through essential brand elements like identity, voice, and strategy. Perfect for marketers and brand managers aiming to make a memorable impact. Compatible with PowerPoint, Keynote, and Google Slides, it's a must-have for any branding project.