


Features
- 6 Unique slides
- Fully editable and easy to edit in Microsoft Powerpoint, Keynote and Google Slides
- 16:9 widescreen layout
- Clean and professional designs
- Export to JPG, PDF or send by email


Do you have any questions?
Recommend


6 slides
Asia Colonization Map Infographics
Discover the versatility of our Asia Colonization Map infographic template, a powerful tool for visualizing the historical impact of colonization across the diverse continent of Asia. This template is fully compatible with popular presentation software like PowerPoint, Keynote, and Google Slides, enabling effortless customization to suit your specific needs. The Asia Colonization Map infographic template offers a robust foundation for illustrating colonization timelines, colonial powers, and regions affected by colonization throughout Asia's rich history. Whether you're a historian, educator, or simply intrigued by Asia's colonial past, this template provides a user-friendly platform to create engaging presentations and informative materials. Impress your audience with this SEO-optimized Asia Colonization Map infographic template, expertly designed for clarity and ease of use. Tailor it to showcase the historical narratives, impact, and legacies of colonization in Asia, making it a valuable asset for your projects and presentations. Start crafting your personalized infographic today!


7 slides
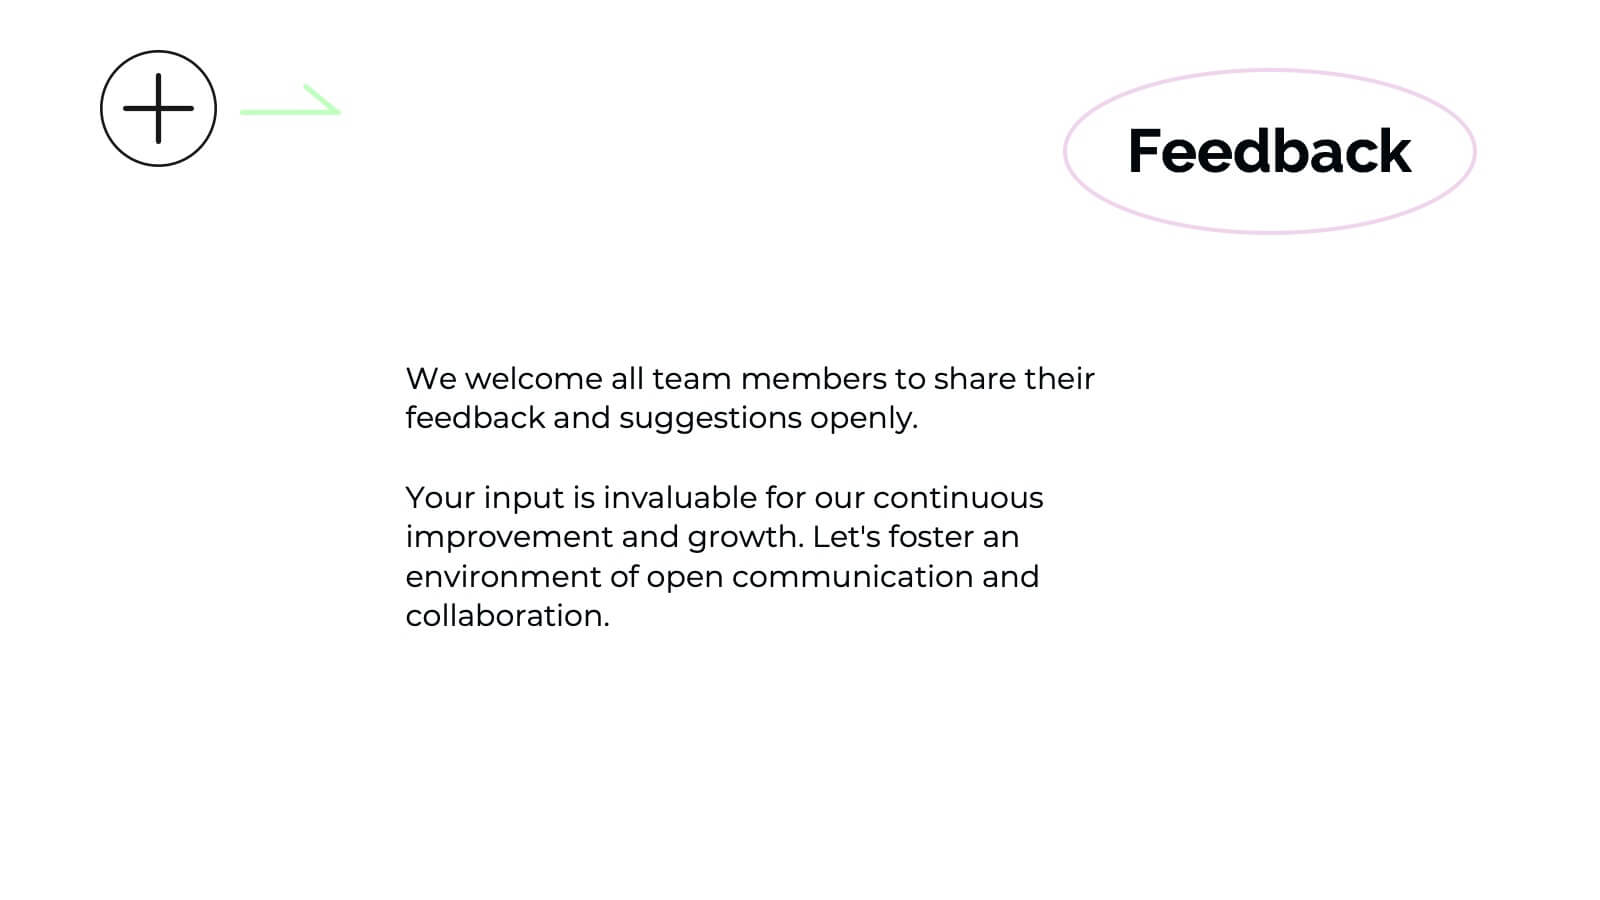
Positive Feedback Infographic Presentation
A Feedback Infographic presents information related to feedback, including what it is, why it is important, and how to provide and receive it effectively. Feedback is important to help understand performance or behavior and make improvements. This template is designed to help you effectively communicate the importance of feedback and provide tips and strategies for giving and receiving it. This template is compatible with Powerpoint, Keynote, and Google Slides, allowing you to easily add your images and data to illustrate your points, and customize content to fit your specific needs.


26 slides
Cassanra Presentation Template
Cassanra is a bold, professional template with a retro look. Its ravishing, modern aesthetic will stand out and grab your attention, while detailed design elements keep it readable. Packed with features like charts, timelines, and easy to edit text blocks, Cassanra is perfect for businesses as well as personal use. A mixture of bold colors are used to help keep the look appealing and easy to read. This template comes with a large amount of features from charts, timelines and an easy to edit text this template is perfect for businesses seeking to make an impression on their audience.


5 slides
Chemistry Lessons Infographics
Dive into the fascinating world of chemistry with our chemistry lessons infographics. Set against a backdrop of bold orange, black, and blue, this template captures the vibrant essence of chemical reactions and laboratory experiments. Tailored for educators, students, and science enthusiasts, this collection is perfect for enhancing lesson plans, study materials, or research presentations. Compatible with Powerpoint, Keynote, and Google Slides. With its creative, lab-themed design, each infographic is enriched with striking graphics and icons, providing a visual feast that simplifies complex concepts and promotes the joy of learning chemistry.


6 slides
Science Project Infographic
Science projects are hands-on activities designed to explore and investigate scientific concepts. This infographic template aims to communicate complex scientific information in a visually appealing and easy-to-understand manner. The infographic provides an overview of the project's key elements, including the question, hypothesis, materials, procedure, results, and conclusion. This serves as a creative and engaging guide to help students choose and plan their science projects for school science fairs or independent research. The infographic uses visuals, illustrations, and icons to enhance understanding and engagement.


7 slides
North America Population Infographic Presentation
North America is a continent located in the northern hemisphere of the Earth, bordered by the Pacific Ocean to the west. It includes countries such as the United States, Canada, Mexico, and several others in the Caribbean and Central America. This template can be a powerful tool to communicate information about the continent in an informative and engaging way. This can help people understand and appreciate the diversity and complexity of North America, and can be used for a variety of purposes, from education to marketing. This template is compatible with Powerpoint, Keynote and Google Slides.


24 slides
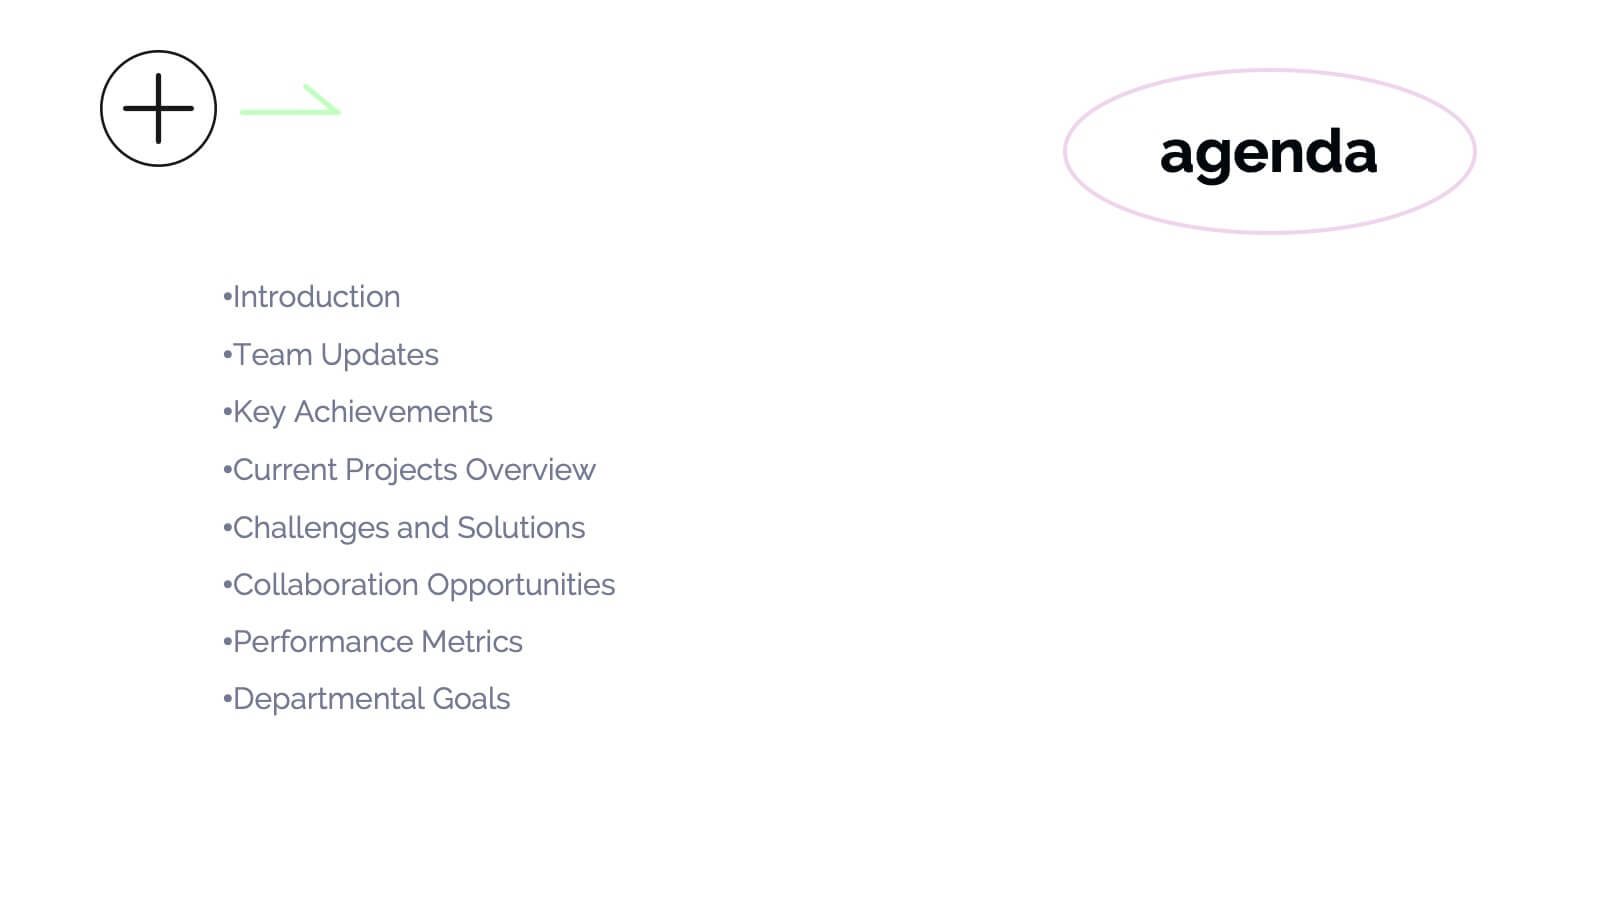
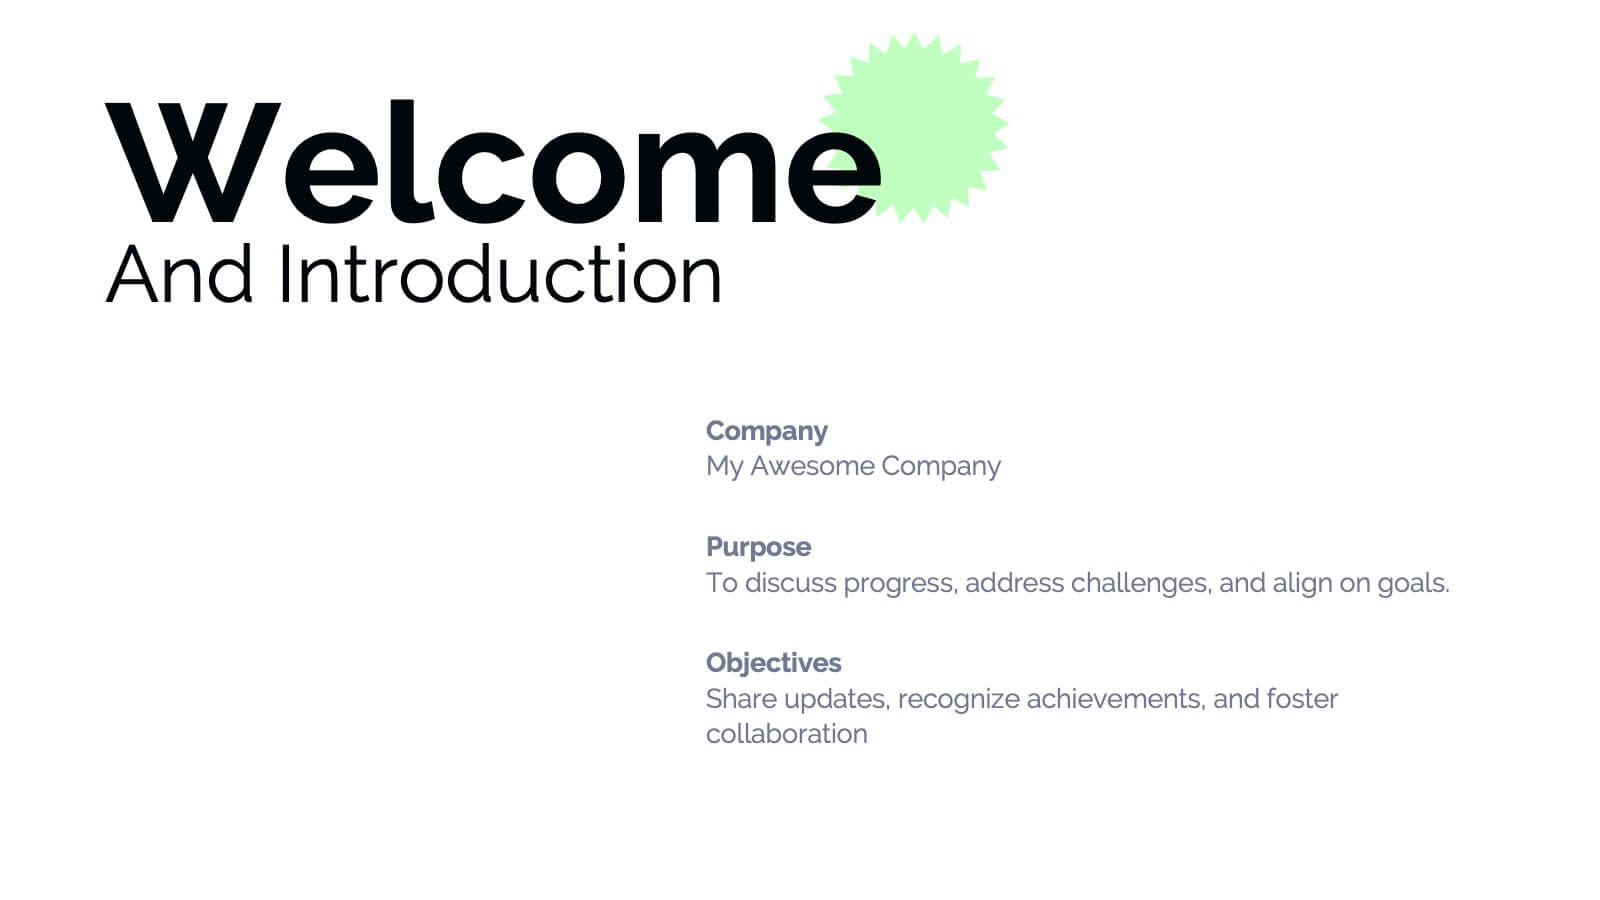
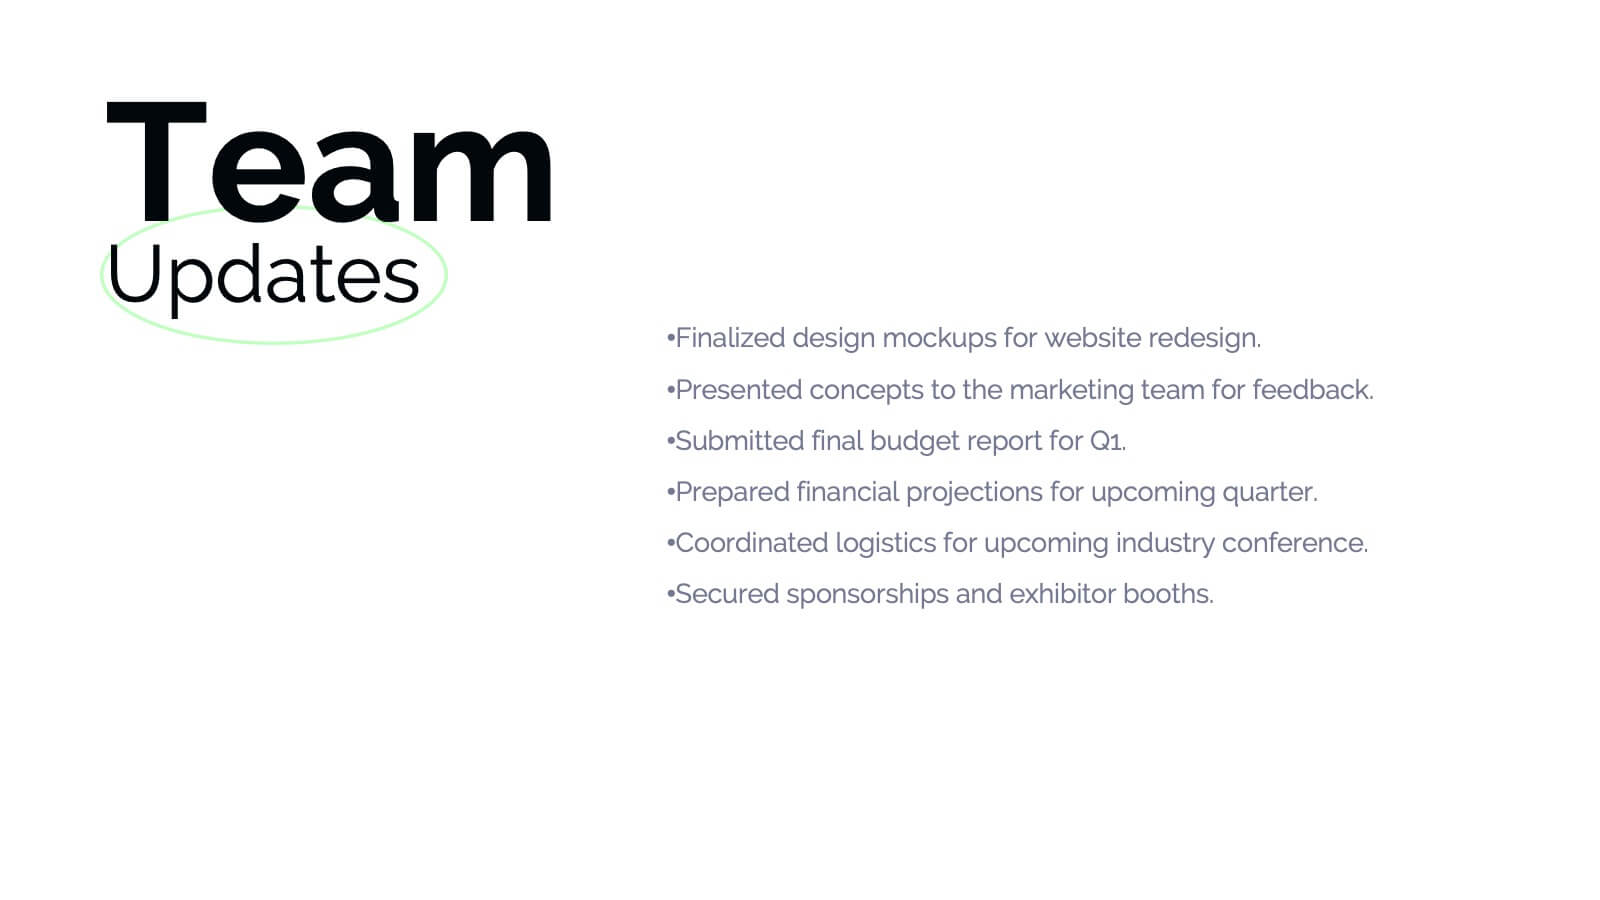
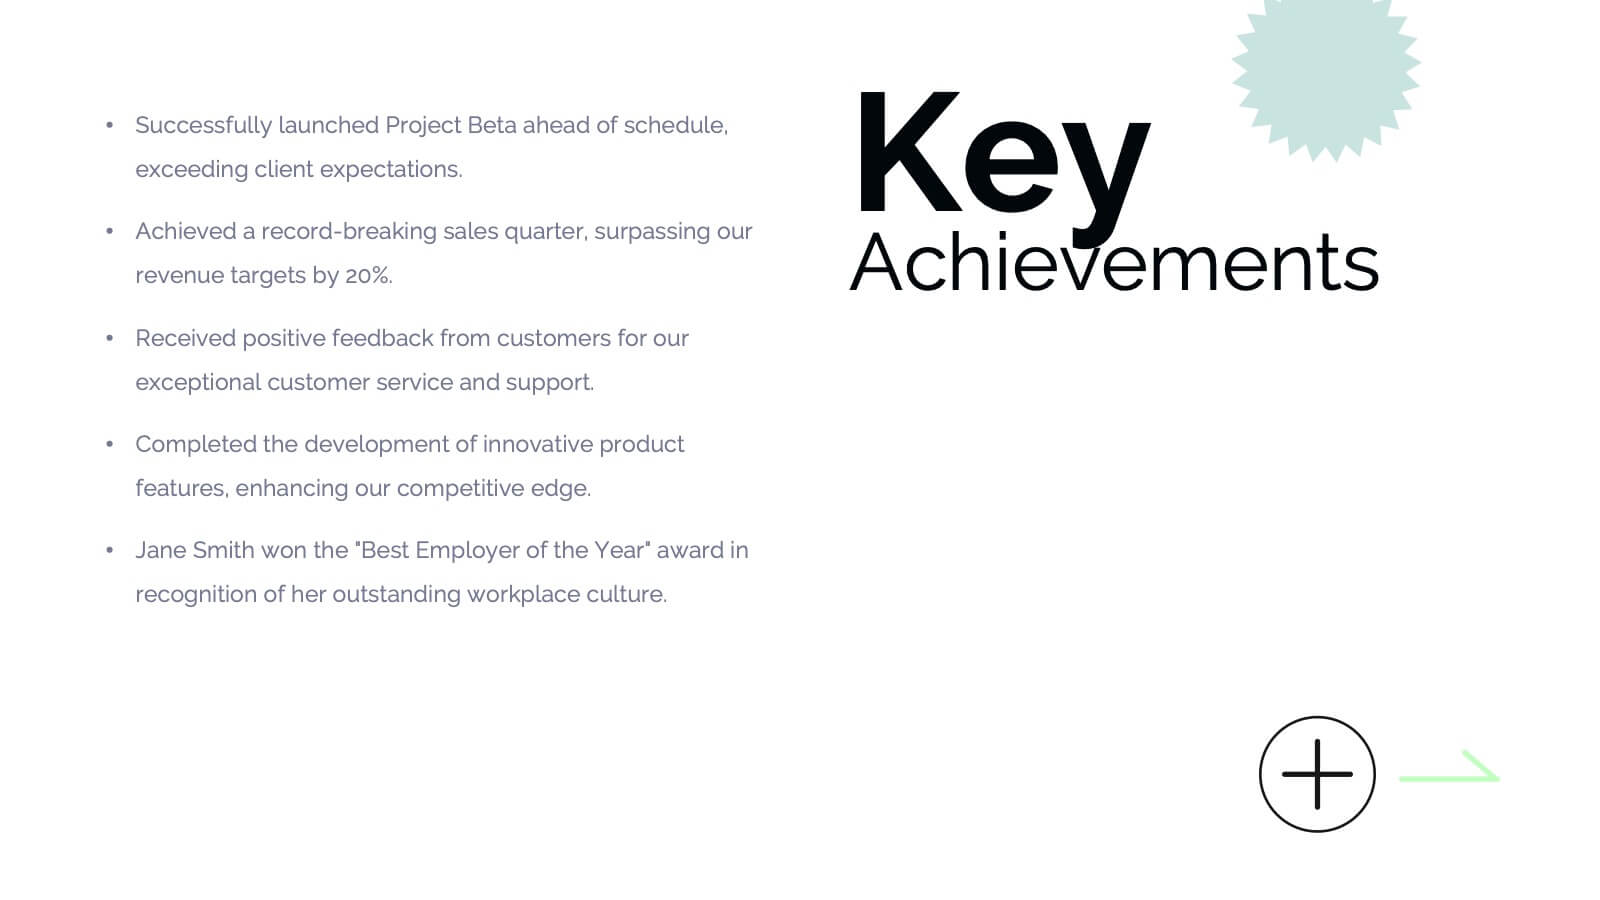
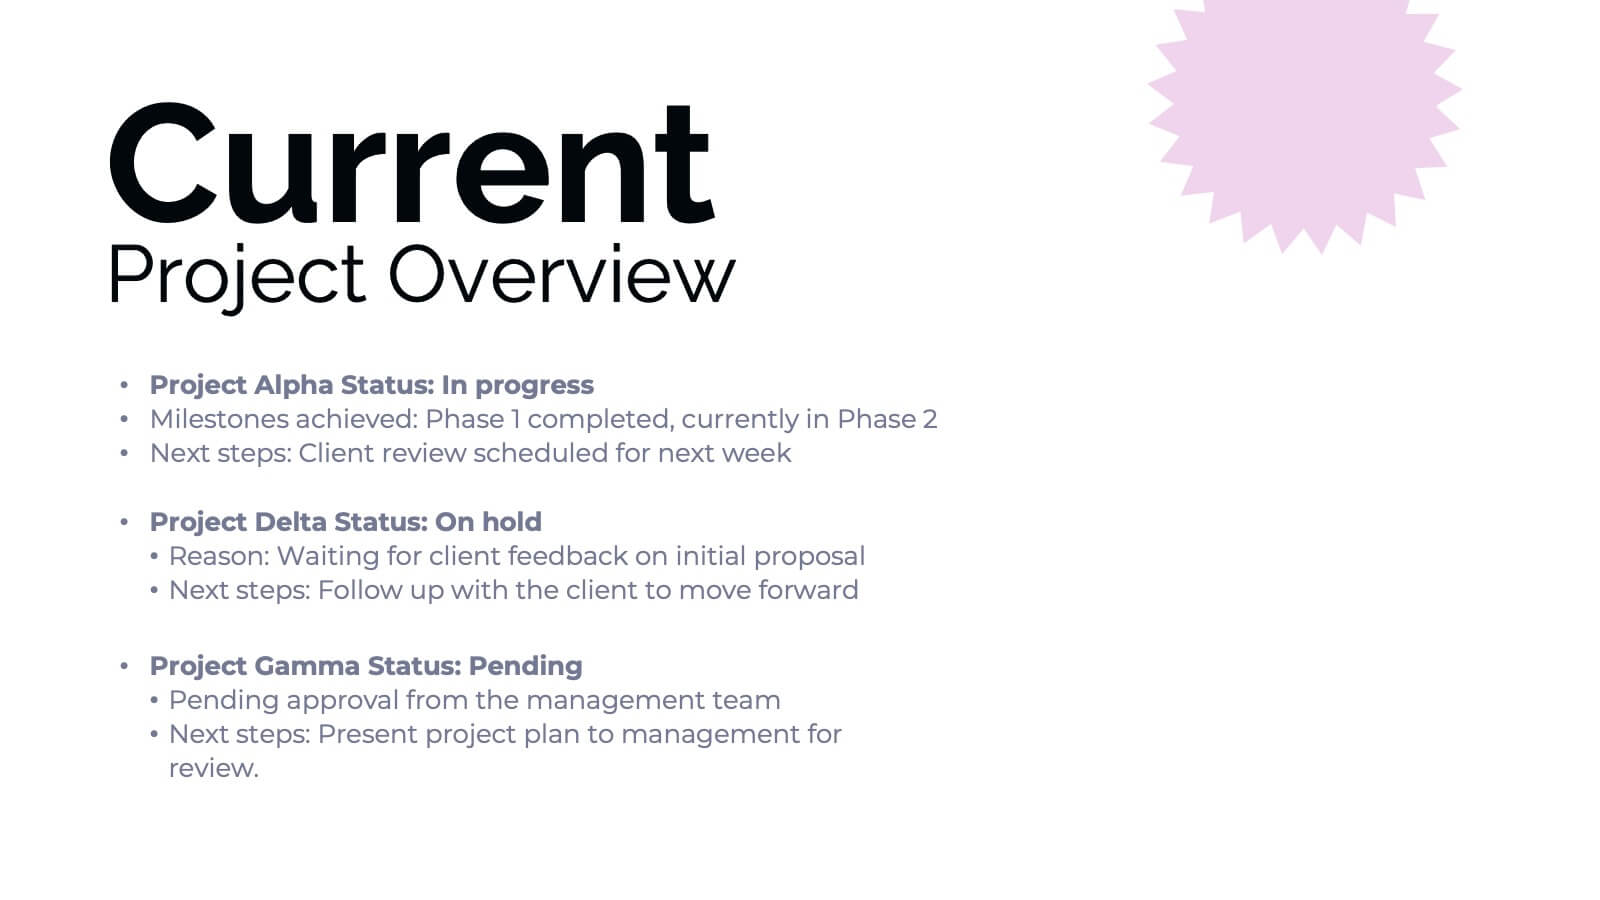
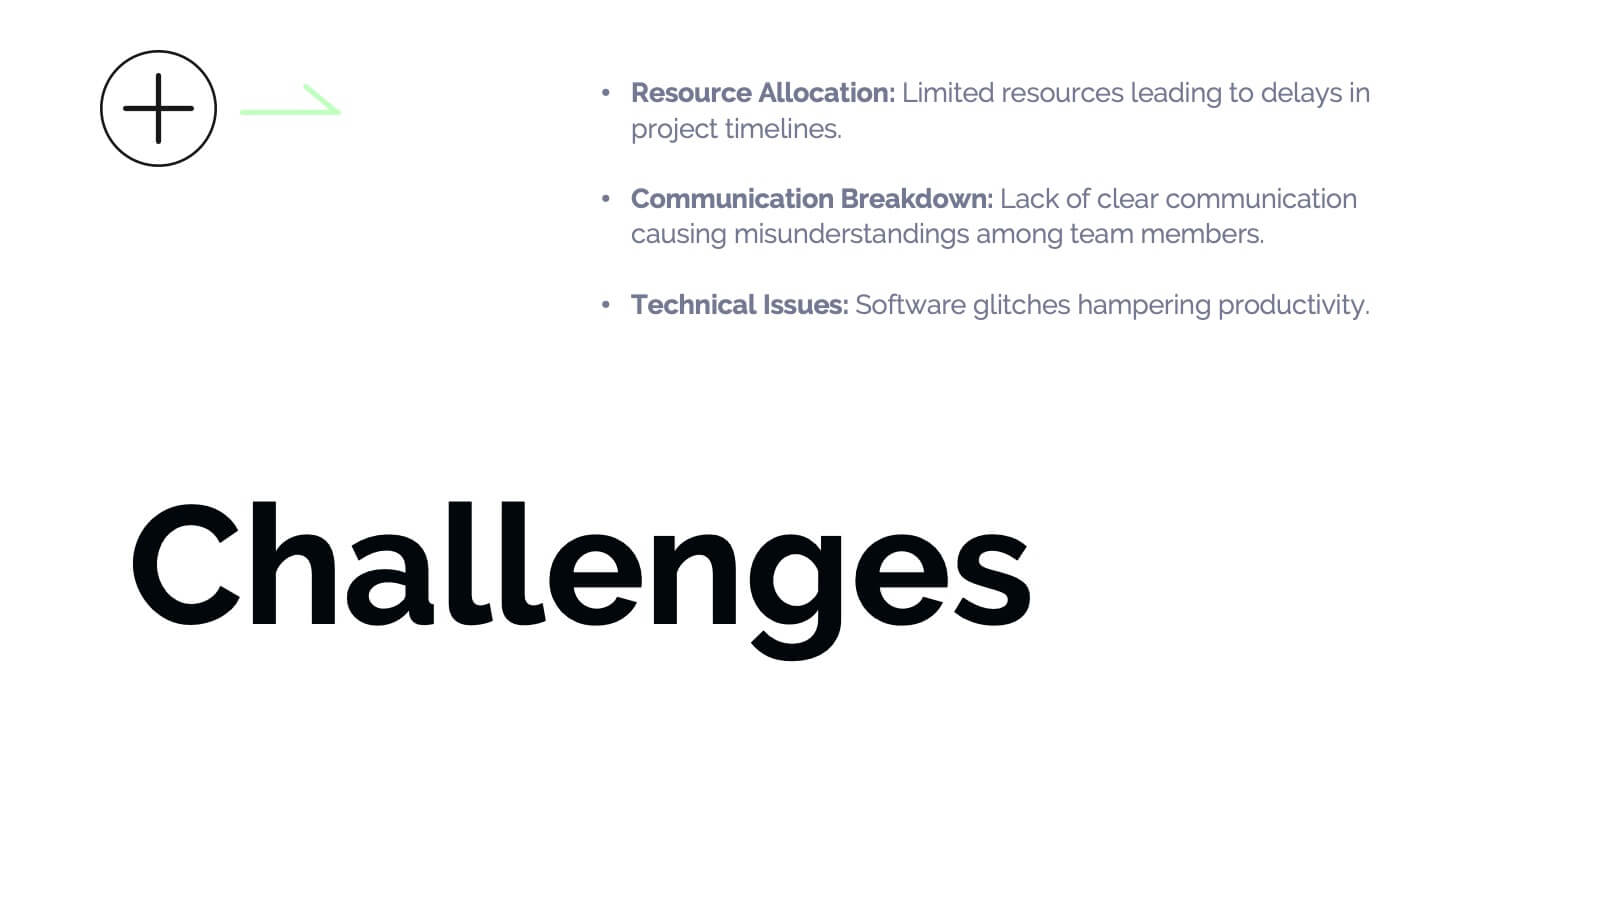
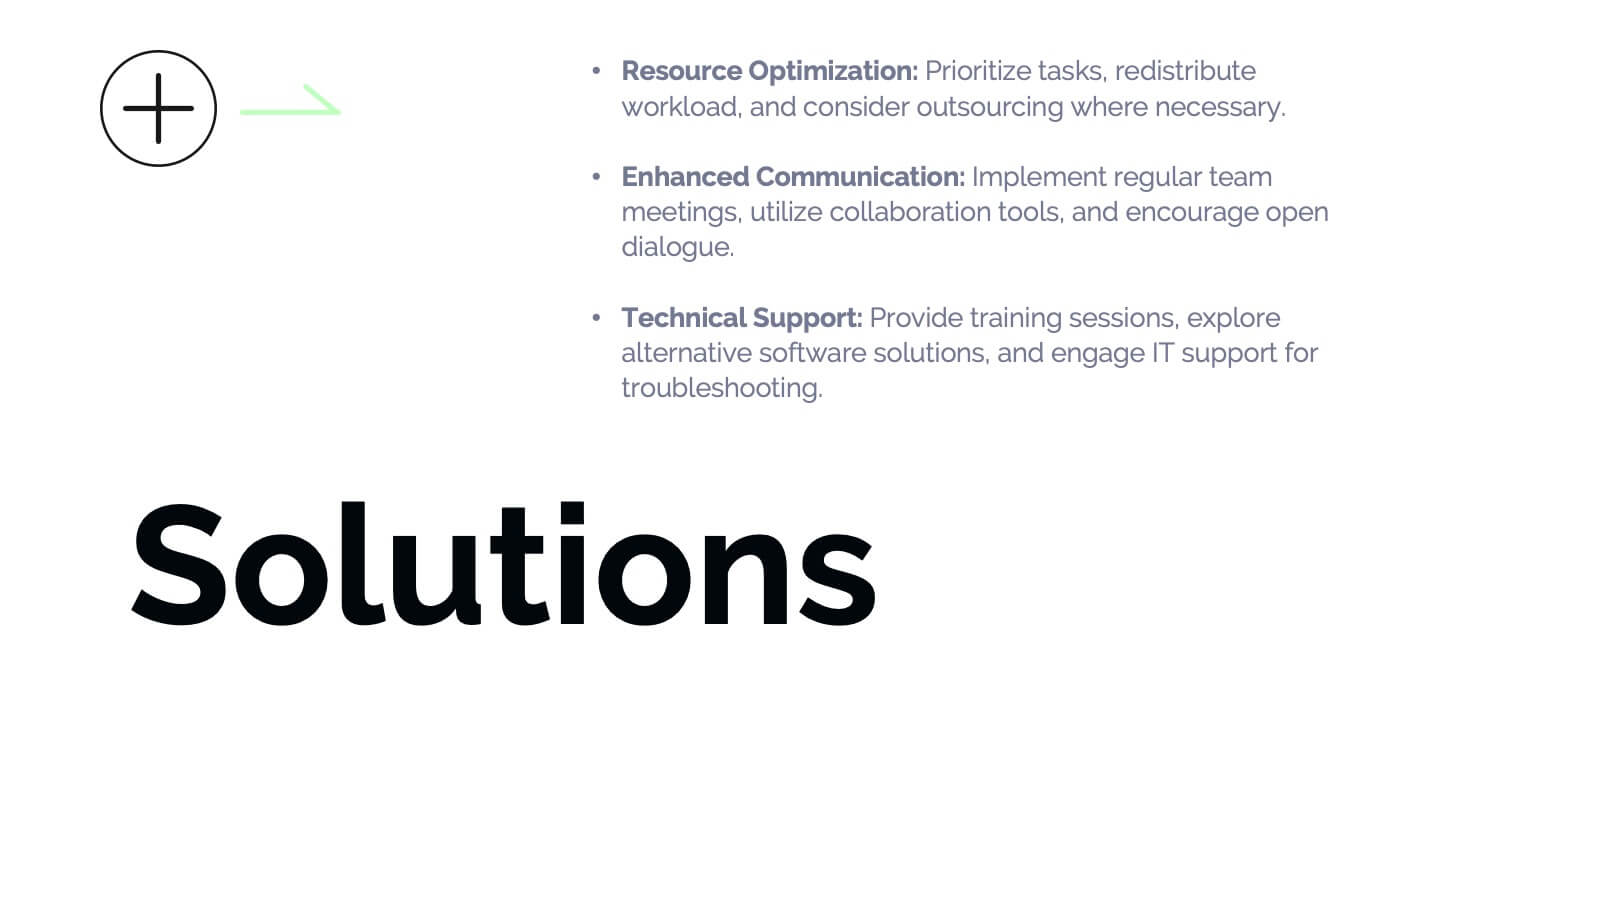
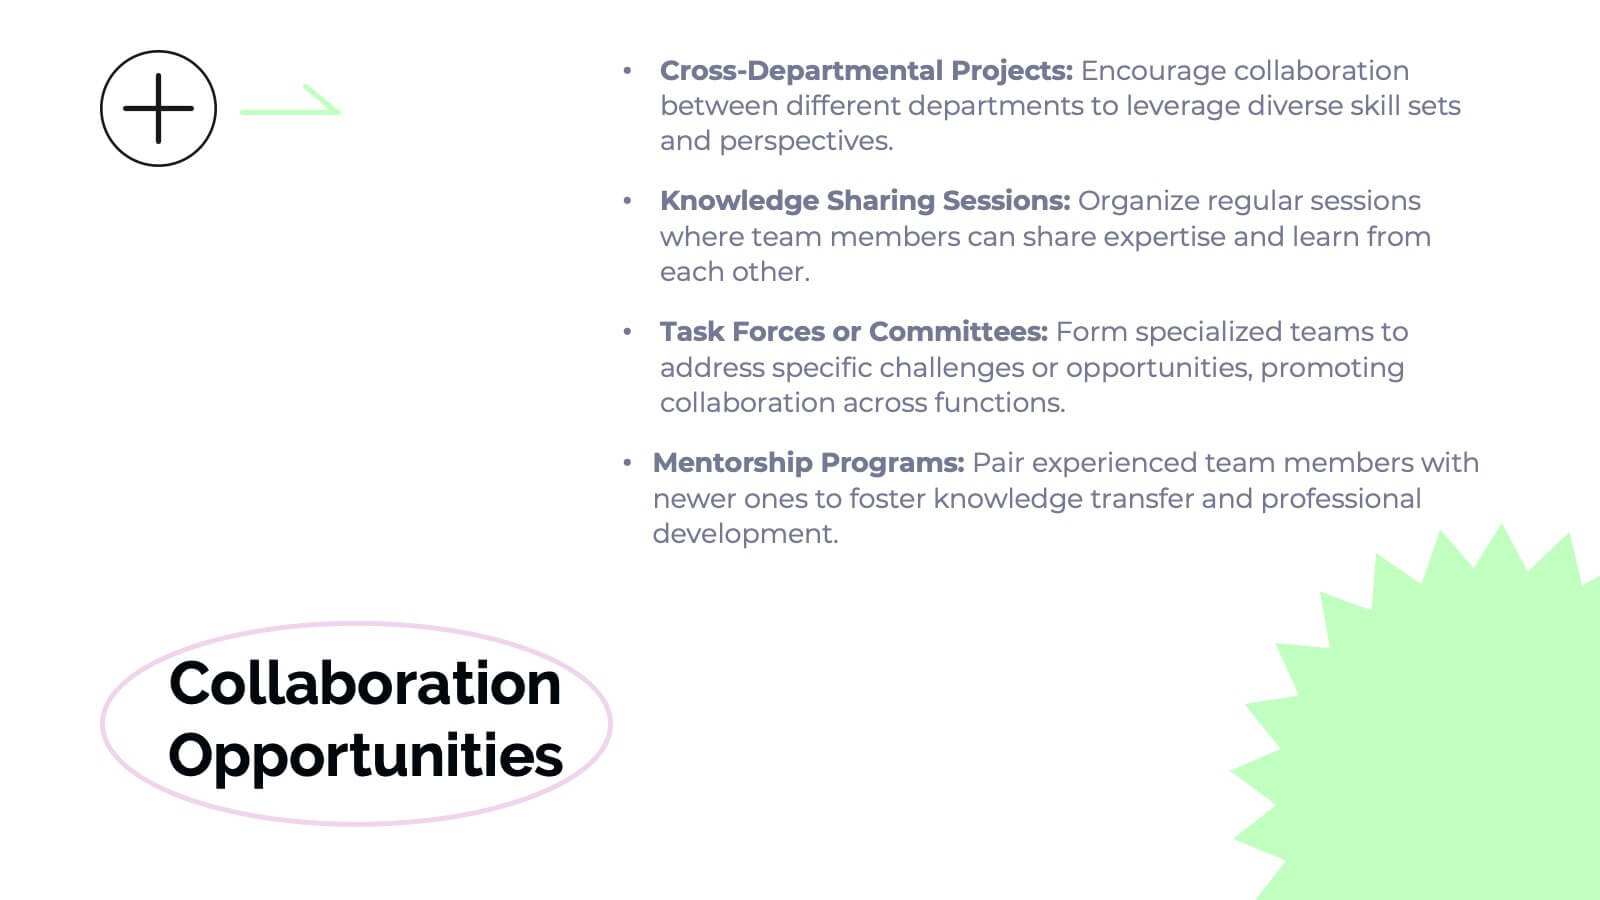
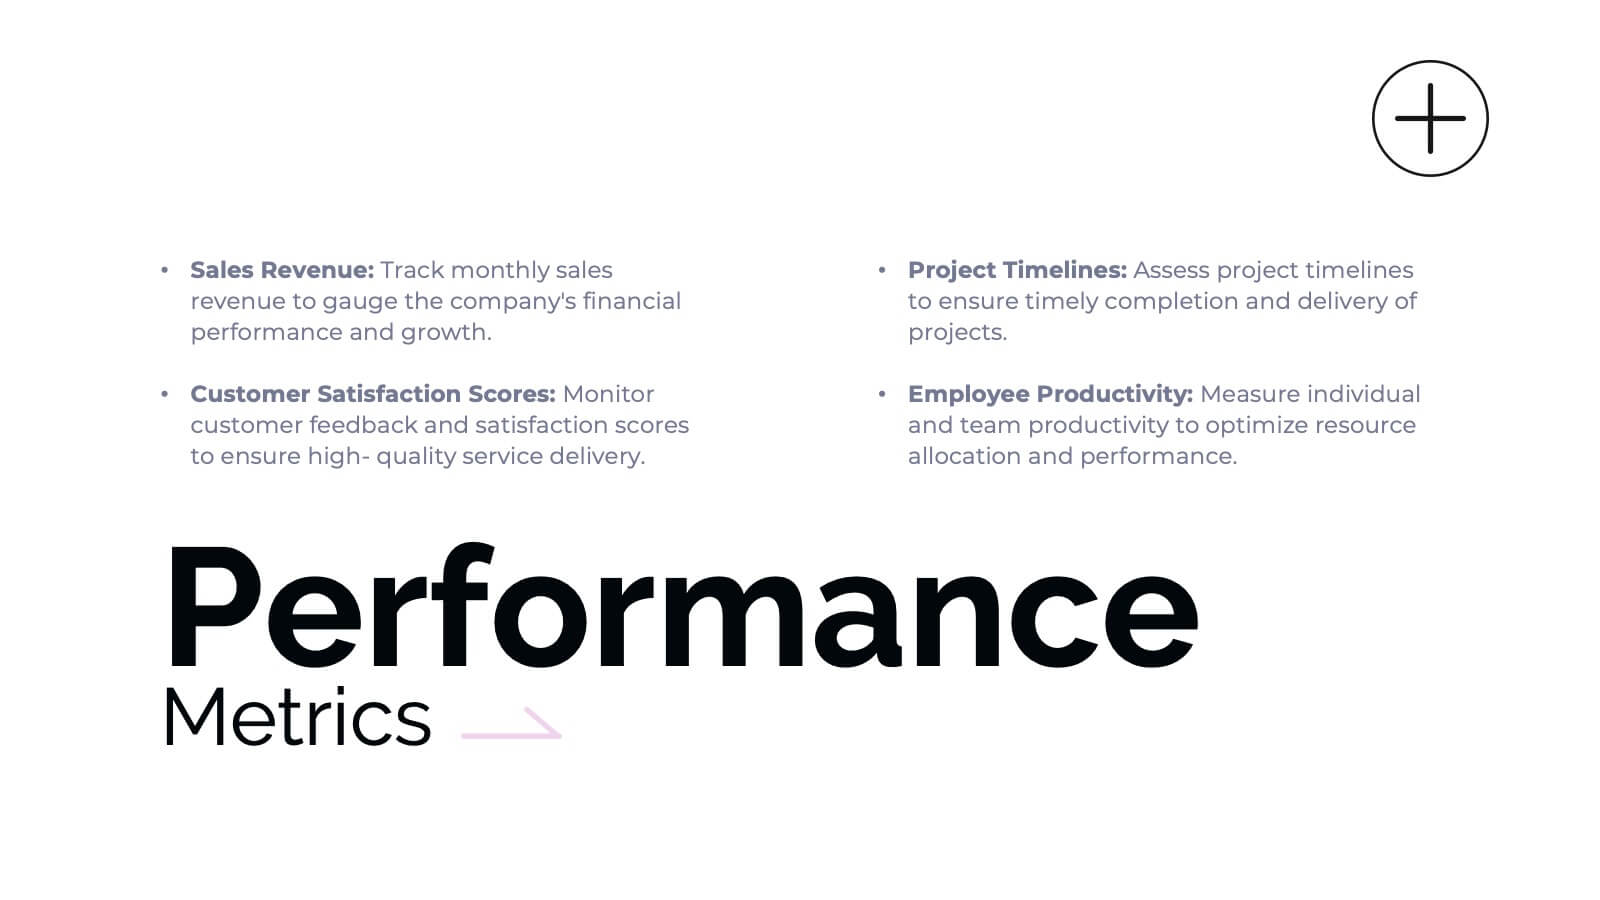
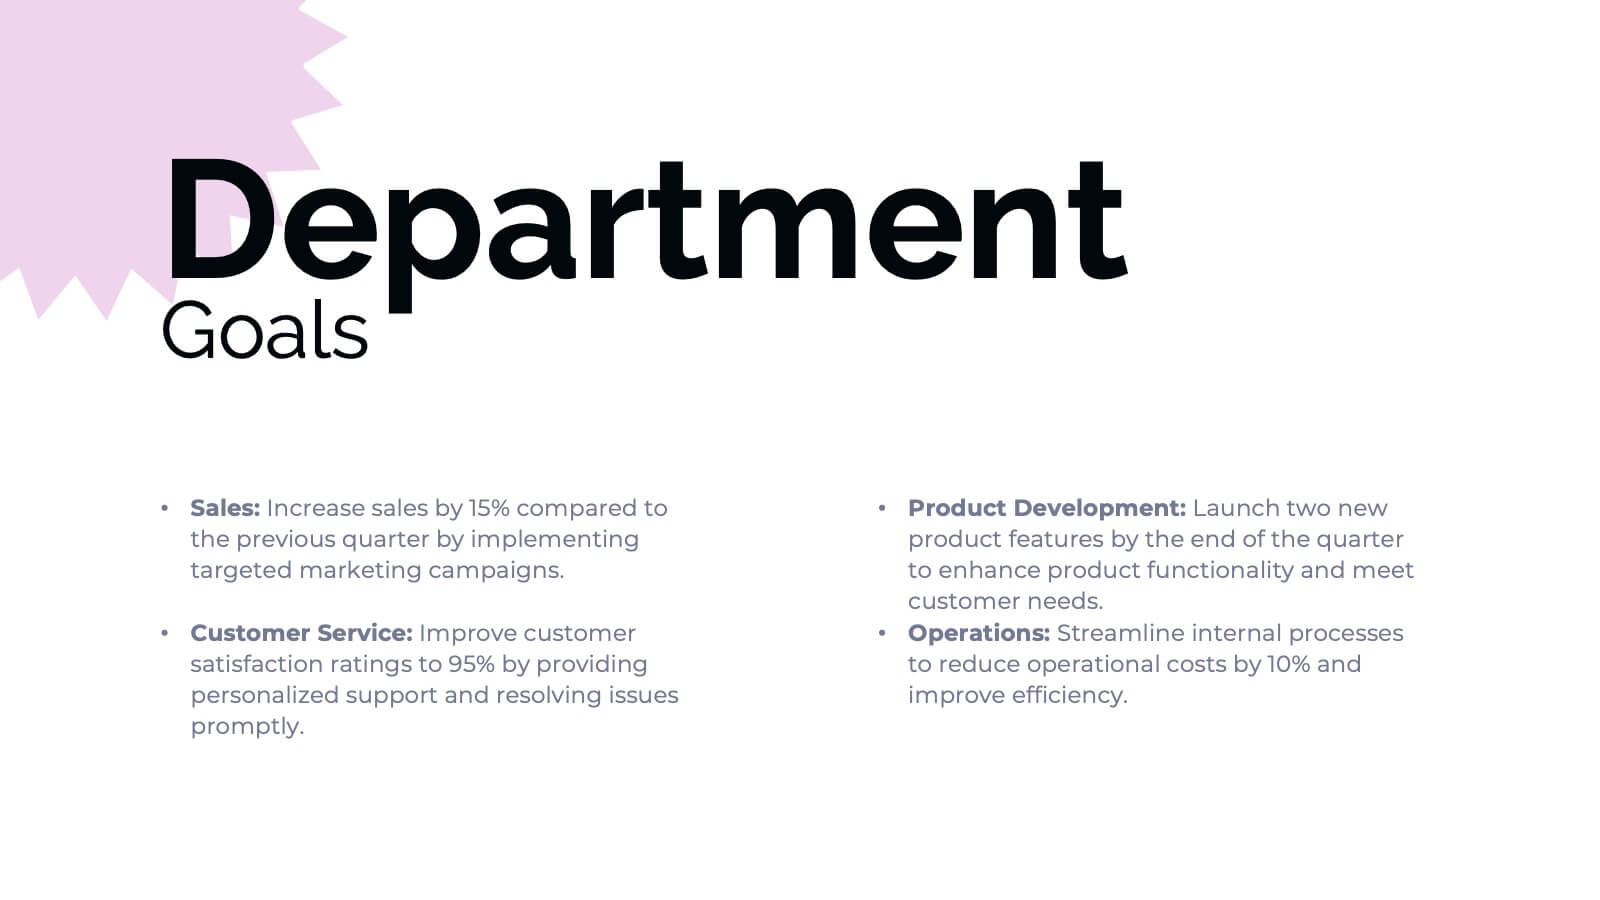
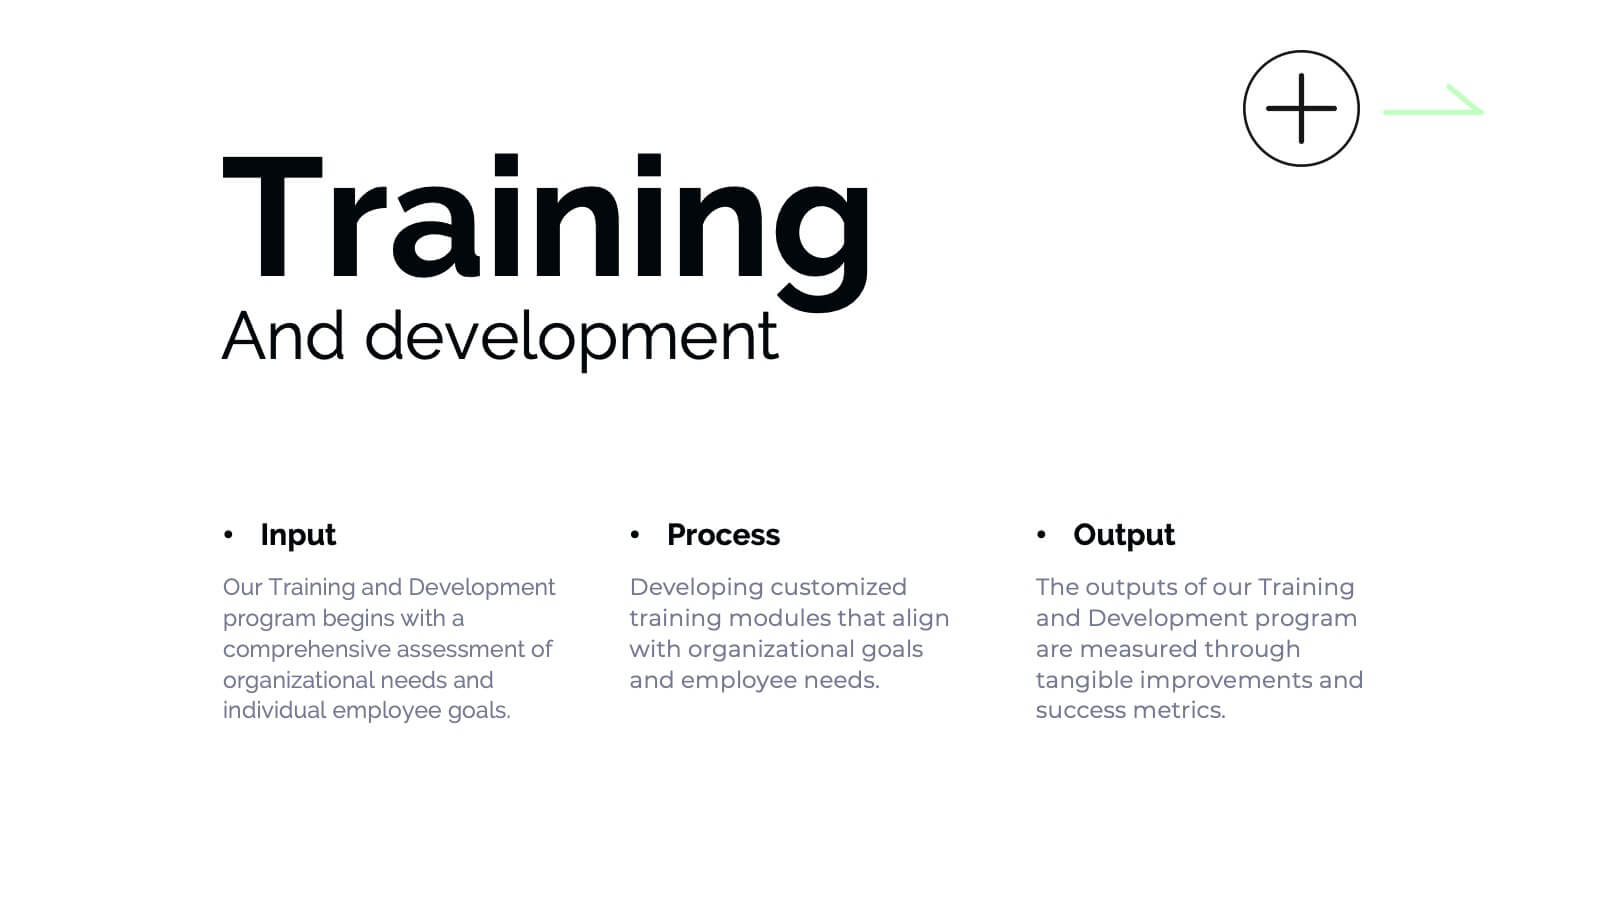
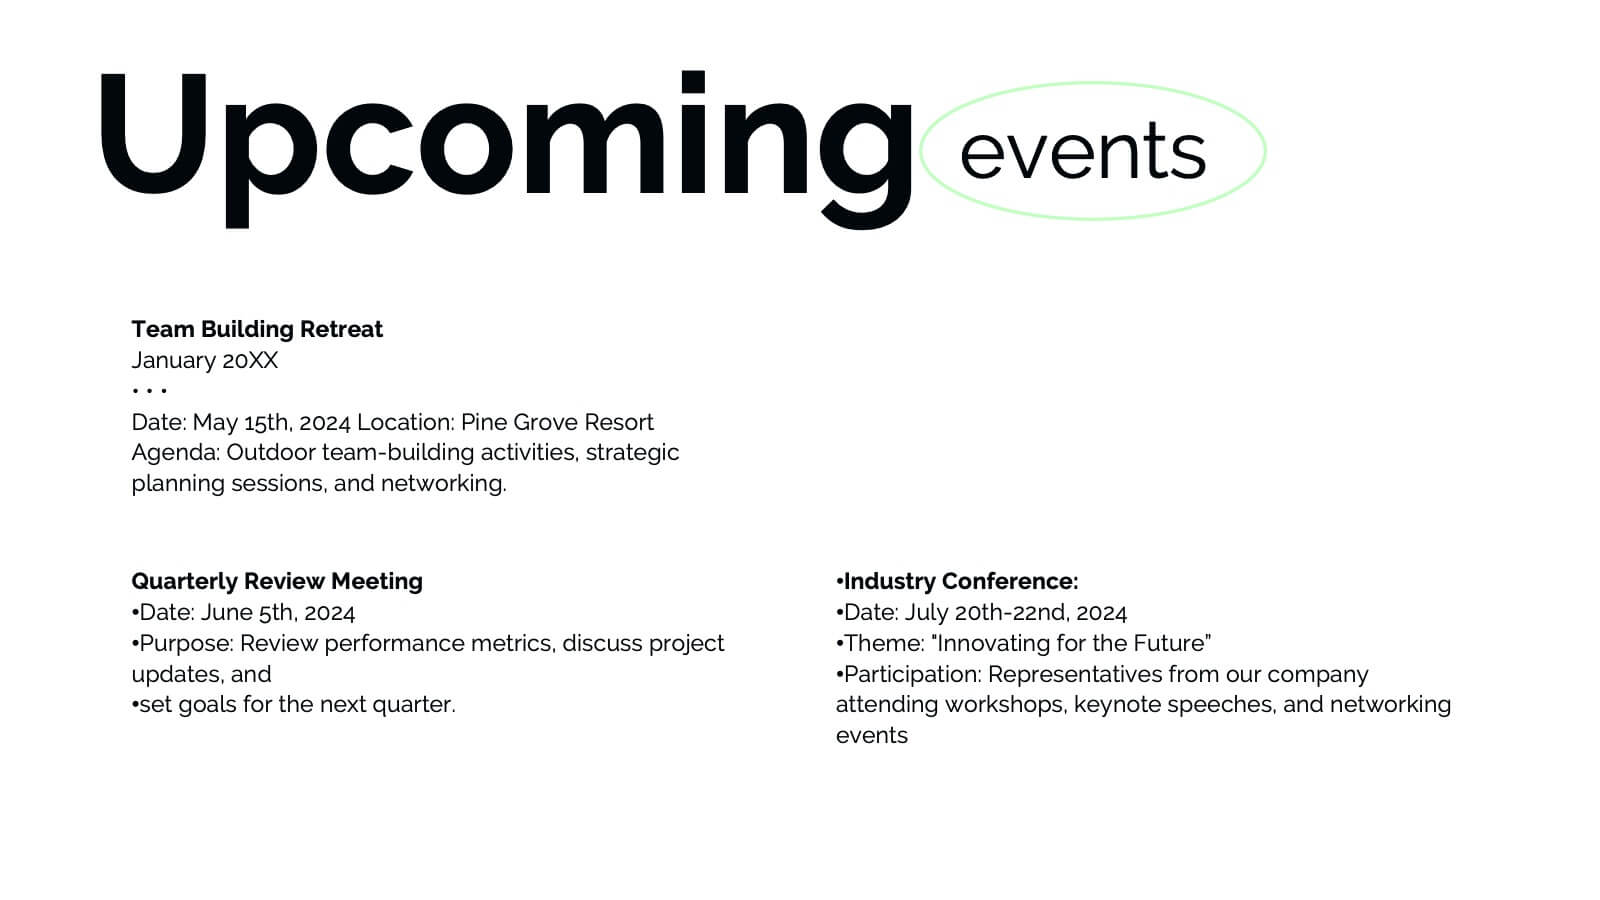
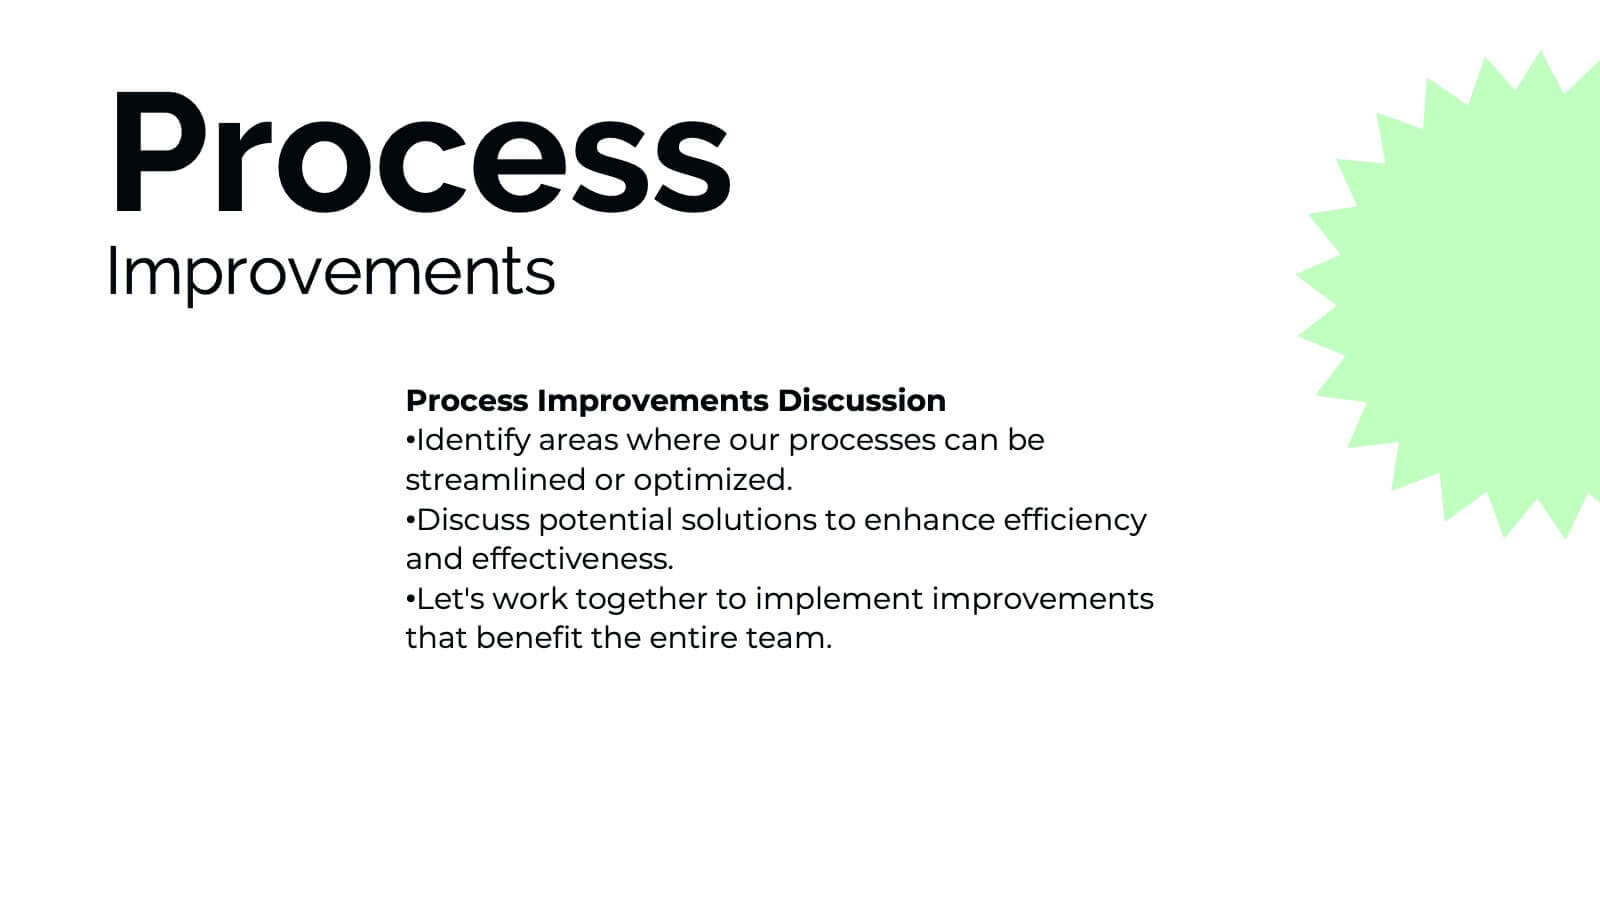
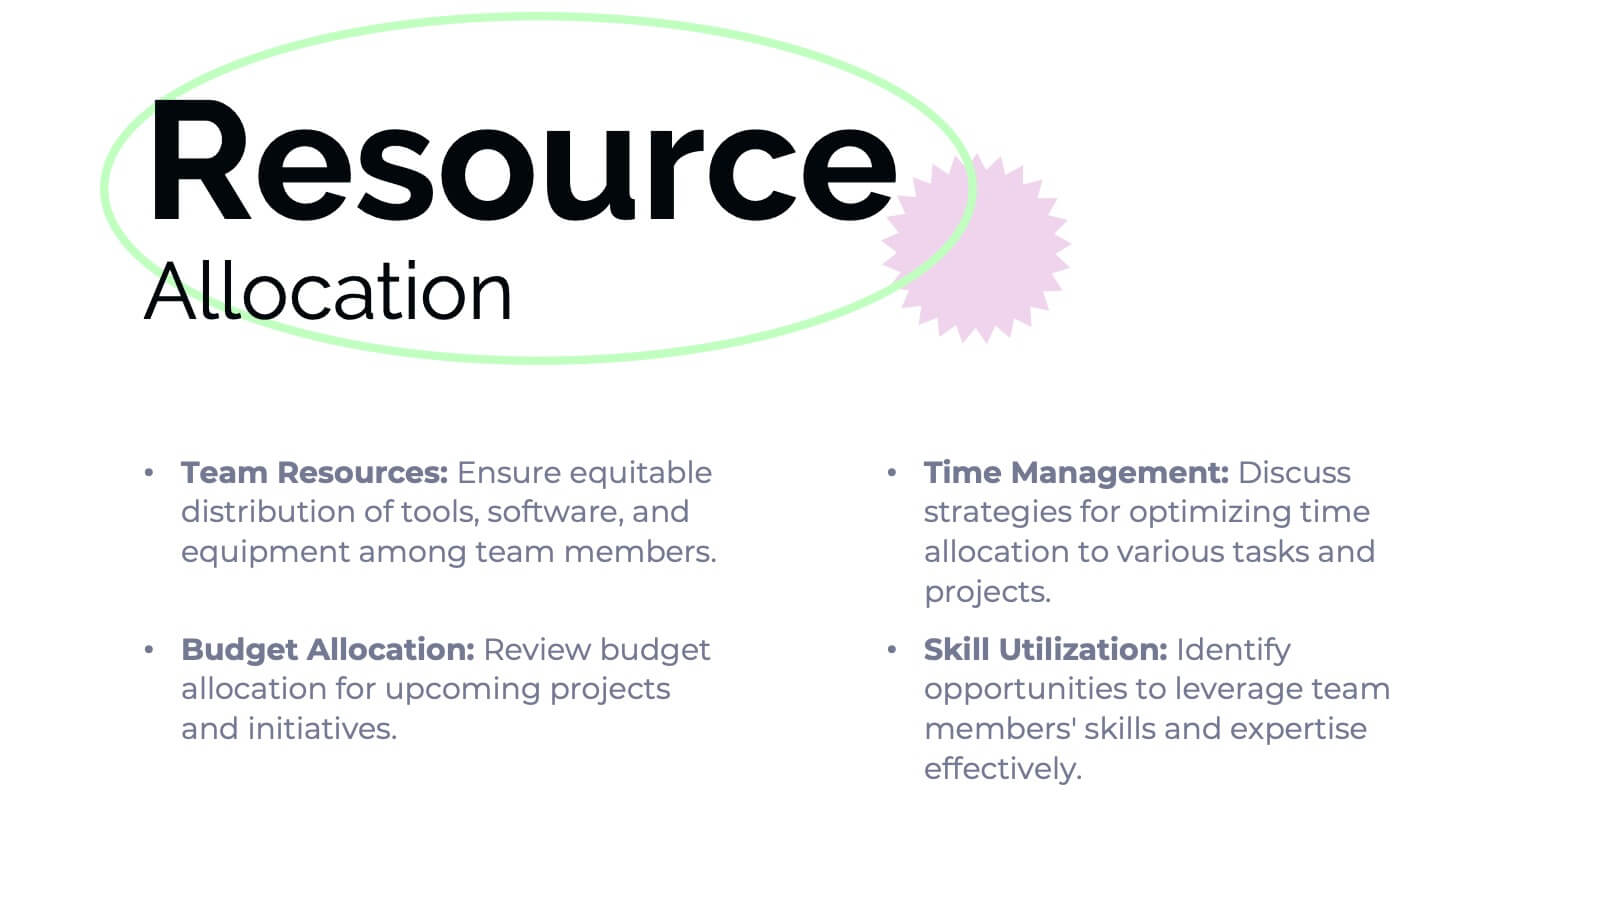
Banshee Business Operations Plan Presentation
Streamline your business operations with this comprehensive presentation template! From team updates and key achievements to challenges and solutions, every aspect of your business plan is covered. Ideal for tracking performance metrics, resource allocation, and upcoming events, this design keeps your operations organized and efficient. Compatible with PowerPoint, Keynote, and Google Slides for seamless integration.


6 slides
Vision Statement Development Guide
Craft a powerful company vision with this eye-catching layout—literally. Centered around a bold visual icon, this slide helps you organize six core ideas or values that shape your future direction. It’s perfect for strategy workshops, leadership meetings, or branding sessions. Fully compatible with PowerPoint, Keynote, and Google Slides.


7 slides
Gap Analysis Infographic Presentation Template
A Gap Analysis is a tool that can significantly help you achieve your goals. It tells you where the gaps are in between two things, and how to fill them. Use our gap analysis template for your next project to understand the strengths and weaknesses of your business in relation to competitors, industry trends and best practices. This template has sections for naming the gap analysis and describing its objectives, identifying gaps between current state performance levels and desired state performance levels, discussing how these gaps could be addressed and identify further actions to be taken.


20 slides
Starbound Sales Proposal Presentation
Close deals with confidence using this polished and professional sales proposal presentation! It covers everything from target market analysis and pricing strategies to sales objectives, performance metrics, and future opportunities, ensuring a complete pitch. Perfect for client meetings and business proposals, this template works seamlessly with PowerPoint, Keynote, and Google Slides.


7 slides
Humanistic Psychology Infographics
Explore the depths of human experience with our Humanistic Psychology Infographic, an essential tool for educators, students, and professionals in the field of psychology. This infographic is designed to visually communicate the principles and applications of humanistic psychology. Our infographic provides a snapshot of the core concepts of humanistic psychology, including self-actualization, the hierarchy of needs, and the importance of personal growth and fulfillment. It features sections on therapeutic techniques, the significance of empathy, and the focus on individual potential. With customizable graphics, you can illustrate the stages of personal development and the humanistic approach to well-being. This SEO-optimized infographic is tailored to convey the humanistic perspective effectively, making it an invaluable resource for presentations, educational materials, and mental health advocacy. Utilize this infographic to foster a deeper understanding of humanistic psychology and its role in promoting holistic mental health and human potential.


5 slides
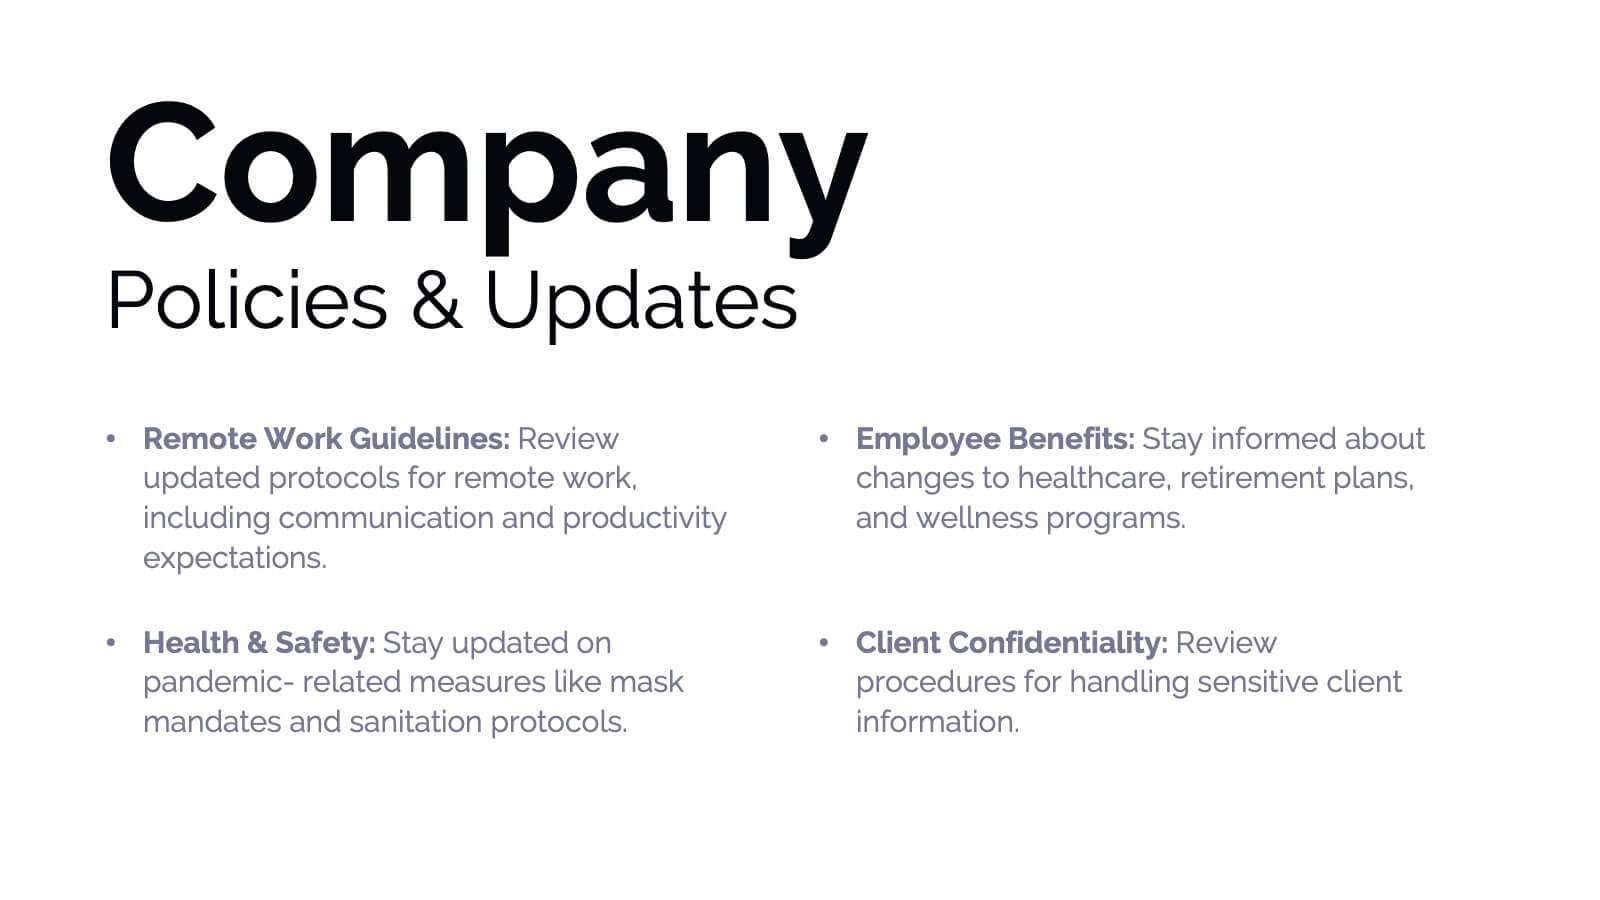
WFH Policy Overview Presentation
Bring clarity and confidence to your remote-work guidelines with a clean, puzzle-style layout that makes every policy easy to follow. This presentation explains key expectations, communication standards, and workflow essentials designed to support productive work-from-home environments. Fully customizable and compatible with PowerPoint, Keynote, and Google Slides.


6 slides
KPI Data Visualization and Metrics Overview Presentation
Get a clear snapshot of your performance with this KPI Data Visualization and Metrics Overview Presentation. Designed with bold triangle charts, percentage rings, and a color-coded value panel, it’s perfect for summarizing five key metrics in a compact, visual format. Easily editable in PowerPoint, Google Slides, Keynote, and Canva.


6 slides
Business RAPID Model Diagram Presentation
Turn decision-making into a visual story with this bold, professional diagram that highlights each stage of responsibility and collaboration. Designed to simplify complex workflows, it’s perfect for outlining business strategies, performance reviews, or team structures. Fully compatible with PowerPoint, Keynote, and Google Slides for easy editing and presentation.


5 slides
Operational Process Logic Map
Visualize how every function interconnects with the Operational Process Logic Map Presentation. This template uses a radial node structure to break down workflows, responsibilities, or systems into logical clusters, showing how different units or steps interact within an operational framework. Each node is color-coded and icon-marked for clarity, ideal for explaining process flows, department roles, or system dependencies. Fully editable in PowerPoint, Keynote, and Google Slides.


2 slides
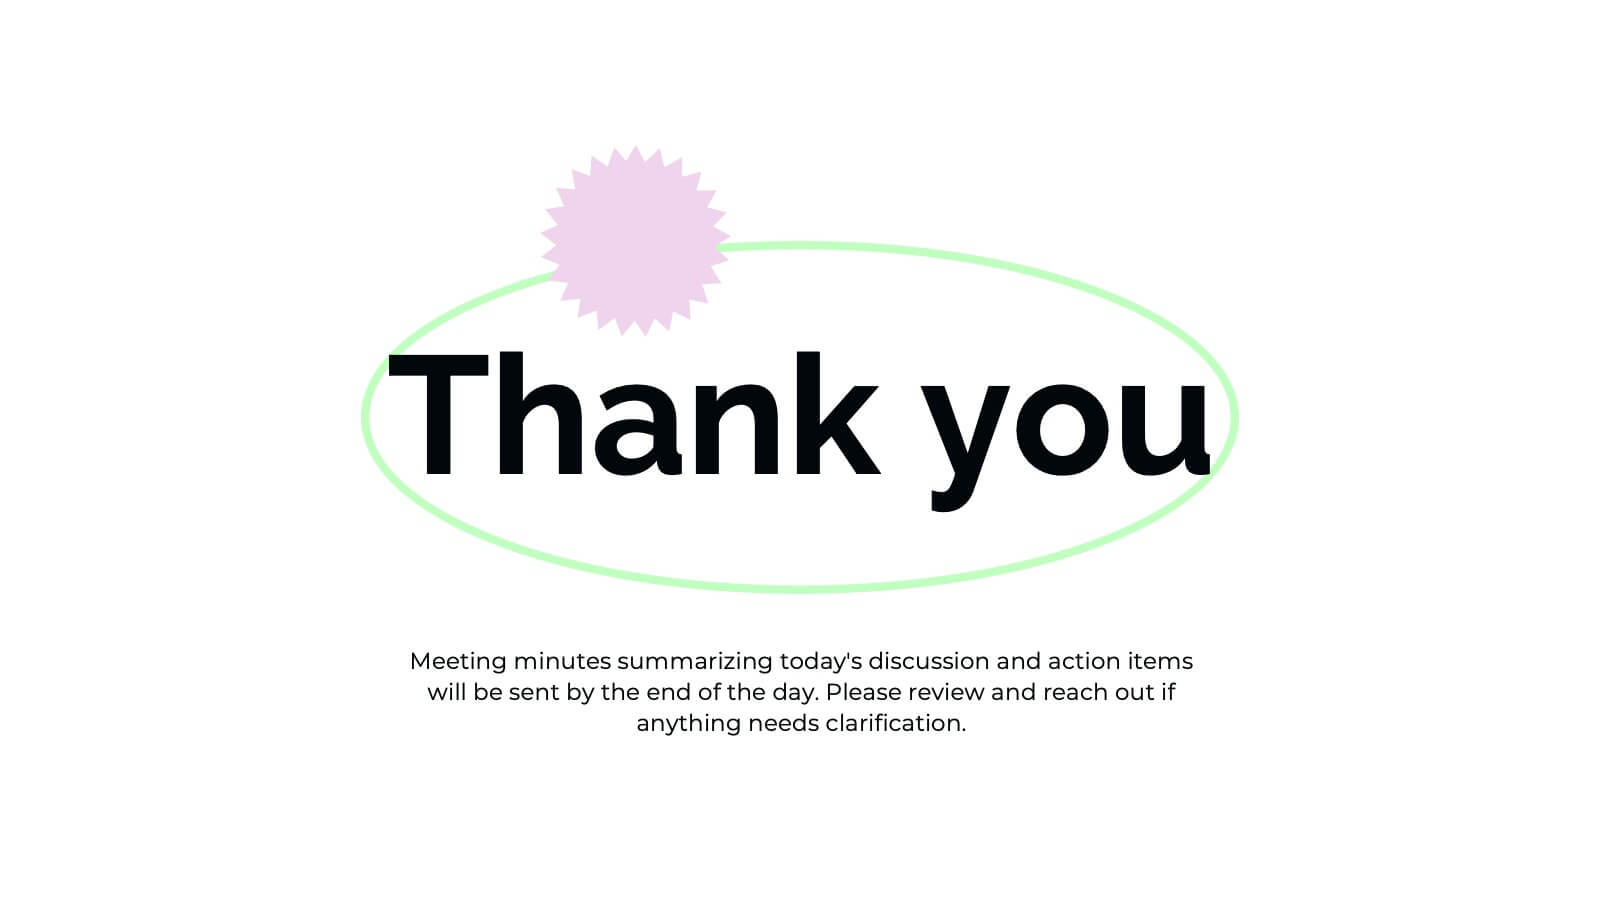
Professional Closing Thank You Presentation
End your presentation on a high note with this professional thank-you slide template! Featuring a clean and modern layout, this design includes space for contact details and a call to action, making it perfect for business meetings, proposals, and networking events. Fully customizable and compatible with PowerPoint, Keynote, and Google Slides.


7 slides
Creative Cloud Infographic
A cloud infographic is a graphical representation or visual aid that presents information, data, or concepts related to cloud computing in a clear, engaging, and easily understandable manner. The goal of our creative cloud infographic is to simplify complex concepts related to cloud computing, making it easier for the audience to grasp the fundamental ideas and advantages associated with utilizing cloud-based services and technologies. This template is a valuable tool for both educating individuals about cloud computing and aiding decision-making processes when considering cloud solutions for businesses or projects.