


Features
- 6 Unique slides
- Fully editable and easy to edit in Microsoft Powerpoint, Keynote and Google Slides
- 16:9 widescreen layout
- Clean and professional designs
- Export to JPG, PDF or send by email


Do you have any questions?
Recommend


5 slides
Data Entry Infographics
Dive into the intricate world of information management with our data entry infographics. Cast in shades of blue, warm orange, and an array of inviting colors, this vertically styled template is a boon for business analysts, administrative assistants, and database managers. The design, punctuated with relevant graphics, icons, and strategic image placeholders, simplifies complex data narratives. It serves as a visual anchor, ensuring information accuracy and efficiency. This essential tool is instrumental for professionals striving to maintain data integrity while elucidating critical entry processes, thereby fostering a streamlined workflow.


7 slides
Industrial Safety Infographic
Industrial safety, also known as occupational safety, pertains to the management of processes and conditions within industrial settings to ensure the safety, health, and well-being of workers and the general public. This impactful infographic template encapsulates the essentials for fostering a secure and hazard-free industrial environment. Compatible with Powerpoint, Keynote, and Google Slides. The customizable set of icons represents emergency response actions, underlining the need for rapid and efficient responses in critical situations. Build a foundation of safety that fosters a secure and thriving work environment.


5 slides
AIDA Digital Marketing Infographics
Immerse yourself in the dynamic world of digital marketing with our AIDA digital marketing infographics. This template, drenched in striking cream, red, and blue hues, adopts a vertical design, perfect for professionals, marketers, and educators looking to elucidate the renowned AIDA model (Attention, Interest, Desire, Action). Each section is enriched with creative graphics, icons, and image placeholders, simplifying complex marketing strategies into digestible visual narratives. It's the quintessential tool for captivating presentations, compelling marketing pitches, or educational materials in digital marketing workshops.


23 slides
Nightspire Strategic Planning Report Presentation
Streamline your strategic planning process with this professionally designed presentation template. Covering key areas such as market analysis, SWOT assessment, milestones, and resource allocation, this template is ideal for businesses and project teams. Fully editable and compatible with PowerPoint, Keynote, and Google Slides.


20 slides
Radiance Sales Forecast Presentation
This vibrant sales presentation template is perfect for showcasing your strategy, objectives, and team. It highlights key areas like pricing, sales process, and performance metrics with a modern and eye-catching design. Compatible with PowerPoint, Keynote, and Google Slides, it ensures you’ll deliver impactful and professional presentations every time. Get ready to wow your audience!


7 slides
Leadership Skills Infographic
Leadership skills encompass a range of abilities and qualities that enable an individual to guide, motivate, and manage a team or group of people effectively. Embark on this joyful adventure through the realm of leadership skills, and let the vibrant colors and engaging design of our leadership skills infographic spark the leader within you. Compatible with Powerpoint, Keynote, and Google Slides. This template is designed to allow you to lead with a commitment to excellence. Roam through the realms of teamwork and collaboration, learning how to unite diverse individuals towards a common goal.


22 slides
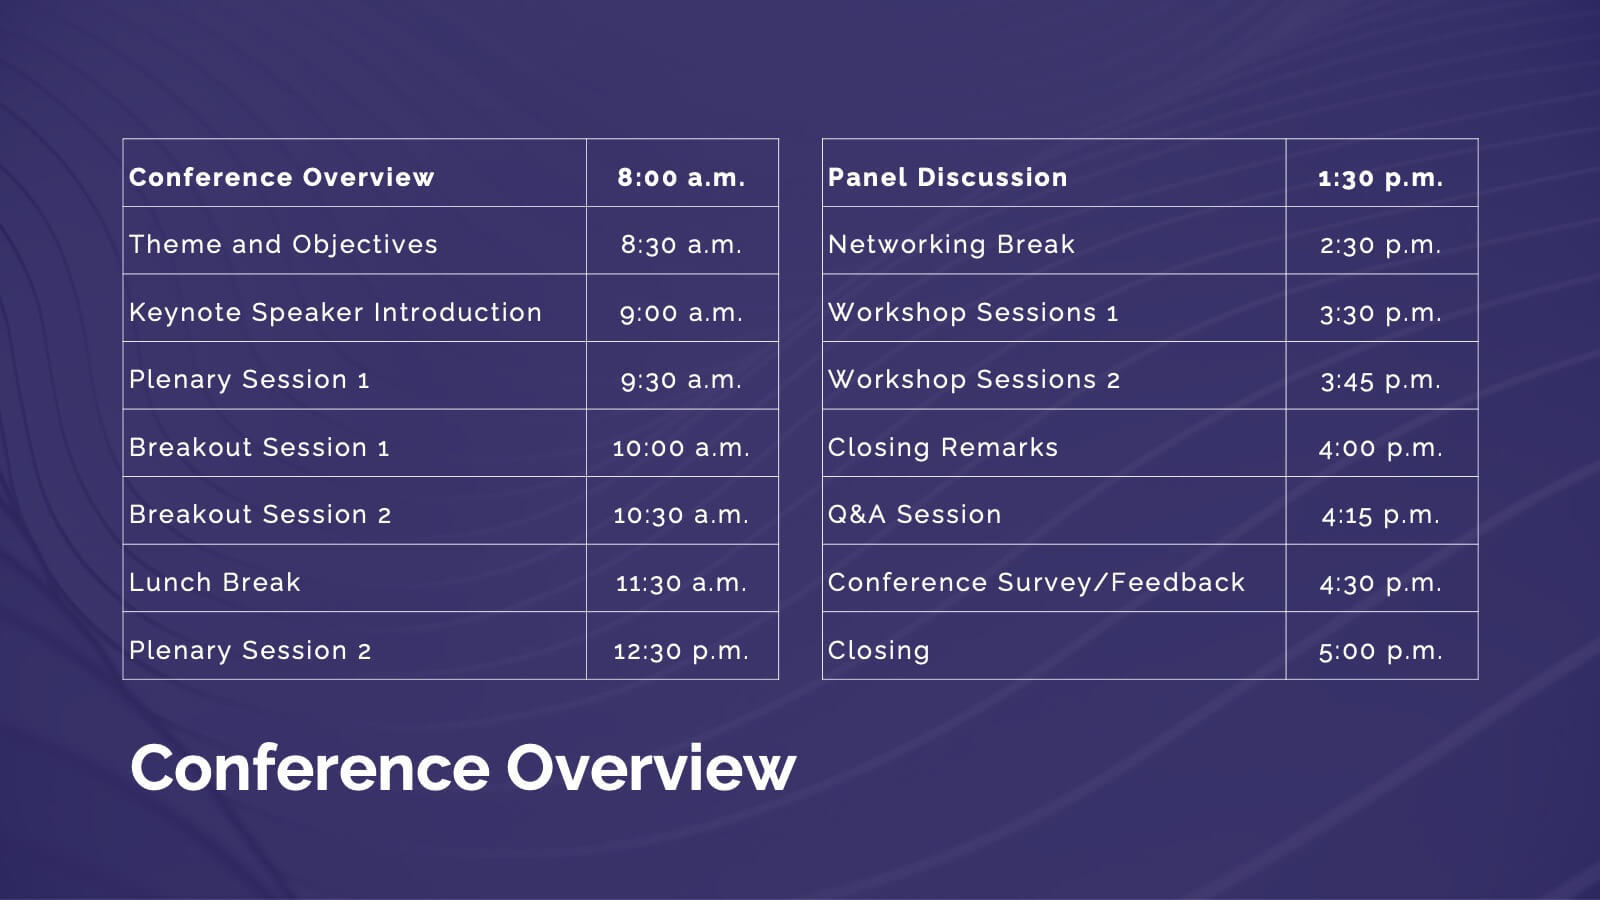
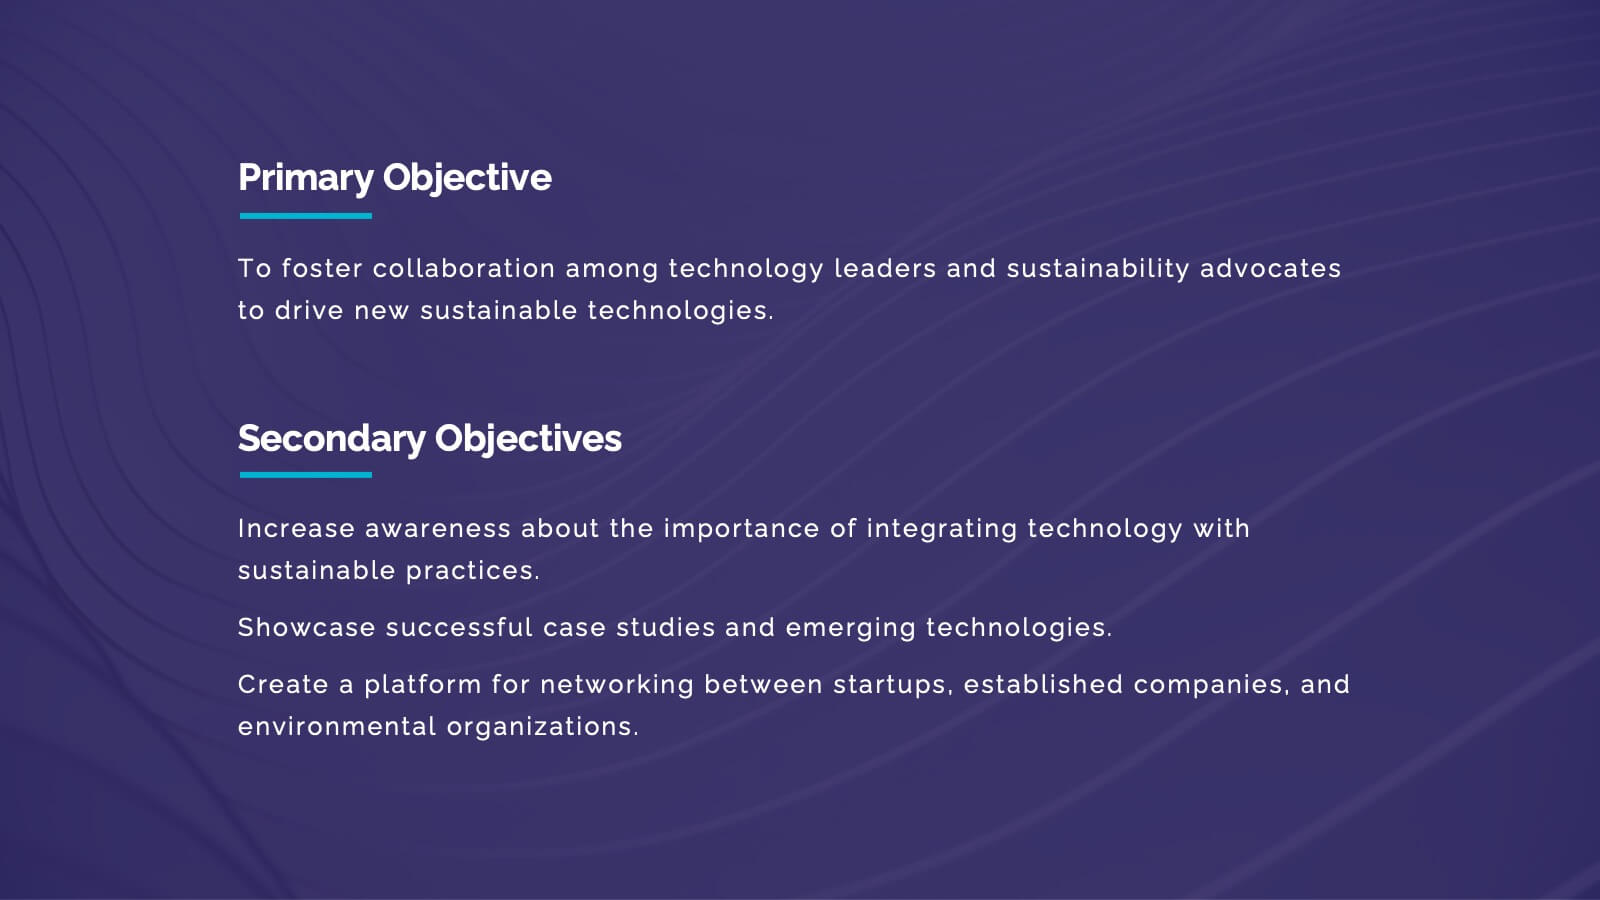
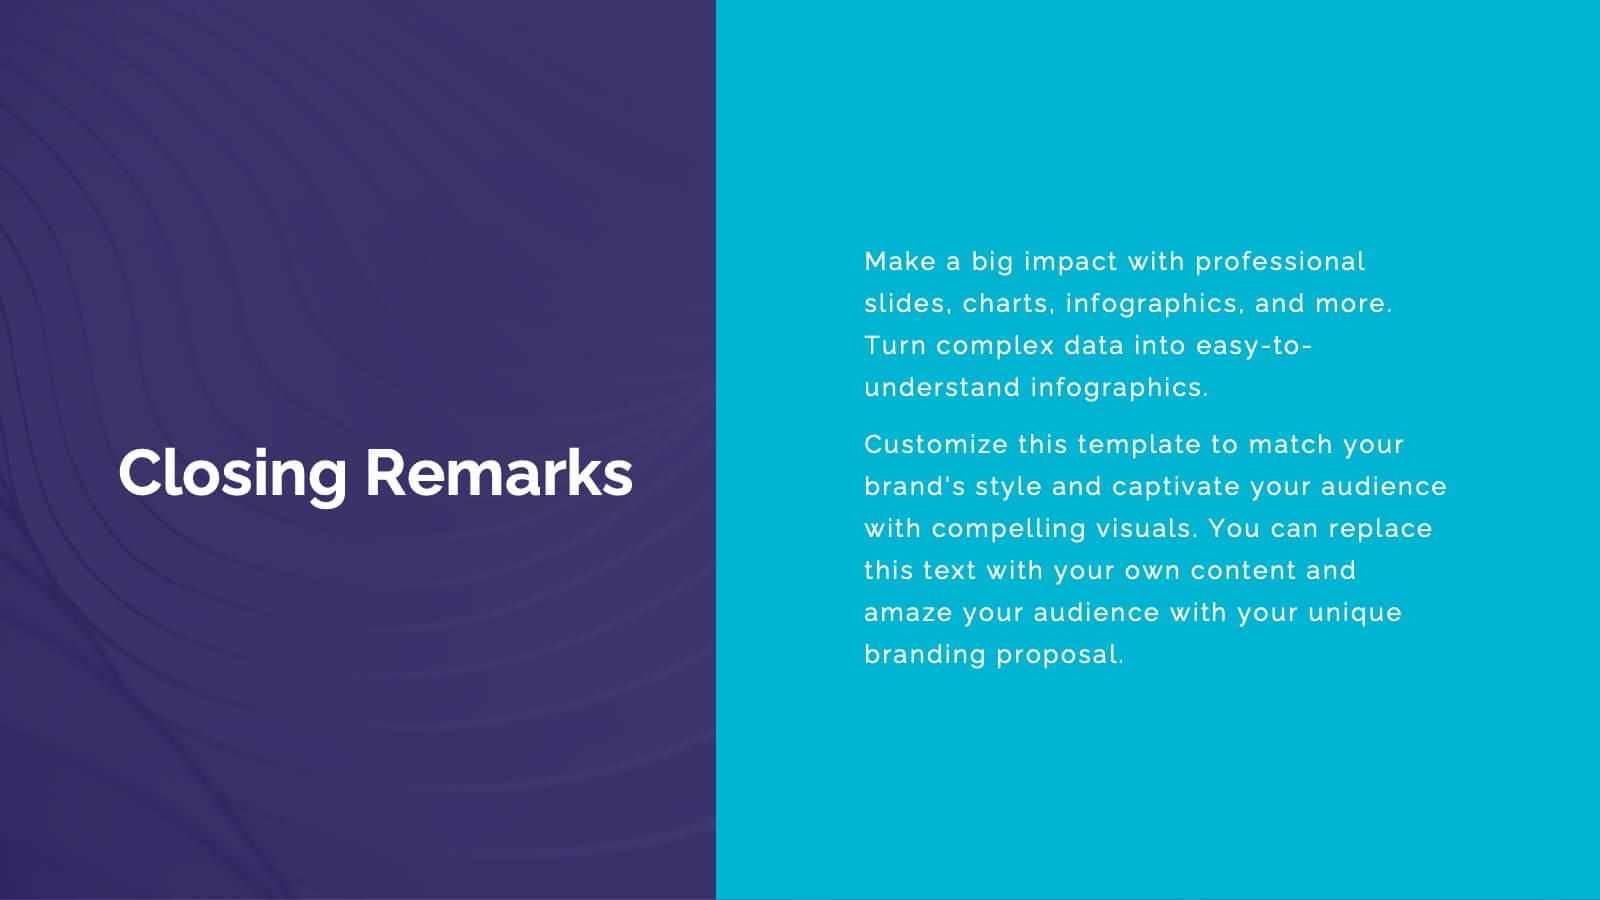
Nimbus Business Development Proposal Presentation
Boost your business presentations with this vibrant, professional template designed for business development proposals. Perfect for detailing conference overviews, themes, objectives, and keynotes, it features a clean and engaging layout. Highlight critical sessions and networking opportunities to captivate your audience. Compatible with PowerPoint, Keynote, and Google Slides, it ensures seamless presentations on any platform.


4 slides
Market Growth Strategy Presentation
Drive business success with this Market Growth Strategy template. Designed for marketers, entrepreneurs, and business analysts, this slide features a step-by-step financial growth visualization using stacked coin icons and peak markers. Showcase key strategies, revenue projections, and scaling tactics in an engaging, easy-to-follow format. Fully customizable and compatible with PowerPoint, Keynote, and Google Slides.


5 slides
Financial and Growth Statistics
Present financial insights and growth metrics with impact using this visually engaging infographic. Ideal for showcasing revenue performance, profit trends, or investment results, this template keeps data clear and actionable. Fully customizable in PowerPoint, Keynote, and Google Slides to match your brand and strategy needs.


6 slides
United States Energy Map Infographics
The "United States Energy Map" infographic template, suitable for PowerPoint, Keynote, and Google Slides, is an essential tool for visualizing the nation's energy landscape. Perfect for energy analysts, educators, and policymakers, this template vividly displays the distribution of various energy sources across the U.S., including renewable installations, fossil fuel production, and power plants. Key statistics and trends in energy consumption, production, and sustainability are highlighted, providing a comprehensive overview of America's energy profile. The color scheme effectively differentiates energy types and regions, making the presentation both visually appealing and informative. Ideal for energy sector presentations, educational lectures, or policy discussions, this template ensures the "United States Energy Map" is communicated clearly and engagingly, offering a snapshot of the country's diverse energy dynamics.


4 slides
Project Responsibility Assignment Matrix Presentation
Visualize team roles and task accountability at a glance with this Project Responsibility Assignment Matrix. This structured layout categorizes assignments using the RACI model—Responsible, Accountable, Consulted, and Informed—organized by team and position. Ideal for project managers, team leads, and operations planners, it helps ensure clarity, reduce overlap, and promote accountability across departments. Easily editable in PowerPoint, Keynote, and Google Slides for seamless customization and cross-platform use.


7 slides
United States Market Map Infographic
Navigate the vastness of the United States with our meticulously designed map infographic. Rendered in a pristine white background, this template is adorned with the patriotic fervor of red, the tranquility of blue, and the charm of purple. Whether it's for market segmentation, regional data visualization, or a travel itinerary, the infographic seamlessly blends informative value with visual appeal. This US map, compatible with Powerpoint, Keynote, and Google Slides, offers custom-made icons and flexible image placeholders to suit varied purposes. Unfold stories from coast to coast, showcasing the diverse tapestry that is the United States.


6 slides
Business Gap Analysis Slide Presentation
Bright and clear from the very first glance, this slide turns complex performance gaps into a simple visual journey your audience can follow instantly. It helps you compare current and ideal outcomes, highlight weaknesses, and guide improvement decisions with clarity. Fully compatible with PowerPoint, Keynote, and Google Slides.


5 slides
Country Highlight Asia Map Presentation
Showcase your regional insights with a clean and modern map that brings focus to key countries across Asia. Ideal for displaying market reach, growth metrics, or strategic locations, this visual layout makes data storytelling simple and effective. Fully compatible with PowerPoint, Keynote, and Google Slides for easy customization.


26 slides
Entrepreneurship 101 Professional Presentation
This template offers a modern, professional framework for presentations about Entrepreneurship 101. It combines a clean, contemporary design with a palette of cool blues and muted reds, setting a tone that's both creative and serious—just right for the innovative spirit of entrepreneurship. Within its slides, you'll find all the tools needed to outline the essentials of starting a new business, from identifying opportunities to understanding market trends. Perfect for aspiring entrepreneurs, business school classes, or startup workshops, the template includes varied slide types: team introductions, big ideas, comparative analyses, and growth charts. The slides also feature infographics for brainstorming sessions, process flows for business operations, and timeline representations for strategic planning. Designed for adaptability, the template works seamlessly with PowerPoint, Keynote, and Google Slides, ensuring your entrepreneurial vision can be shared with clarity and impact.


7 slides
Consulting Business Strategy Infographic Presentation
A company’s business strategy is a plan that helps it achieve its goals and meet long-term objectives. A business strategy should be designed to fulfill the company’s mission, vision, and values. This template is designed to make your business or company plan, easy to understand and present in a professional way with the best design. This template can be used to present your company's strategic vision, long-term goals, and key initiatives. With its colorful and dynamic design, this can attract your audience’s attention, while also providing them with useful information about your strategy.


7 slides
Bowtie Chart for Threat Mitigation Presentation
Visualize and mitigate threats with precision using the Bowtie Chart for Threat Mitigation Presentation. This structured layout highlights risks, controls, and consequences in a mirrored bowtie format—perfect for safety planning, compliance, and risk assessment. Fully customizable in Canva, PowerPoint, Google Slides, and Keynote for seamless integration into your workflow.