


Features
- 10 Unique Slides
- Fully editable and easy to edit in Microsoft Powerpoint, Keynote and Google Slides
- 16:9 widescreen layout
- Clean and professional designs
- Export to JPG, PDF or send by email


Do you have any questions?
Recommend


26 slides
Jenzen Presentation Template
Jenzen is a modern multi-purpose template with warm tones for coaching and investing. Jenzen is suitable for all types of businesses Its slide designs can be used in conjunction with each other, making it perfect for sharing information about the various services available to customers. It's easy to use, resulting in high quality presentations. Its slide designs can be used with each other to create more elaborate presentations complete with charts, images and text boxes. It's simple yet stylish design makes it easy for anyone to use and is for both personal use as well as professional use.

20 slides
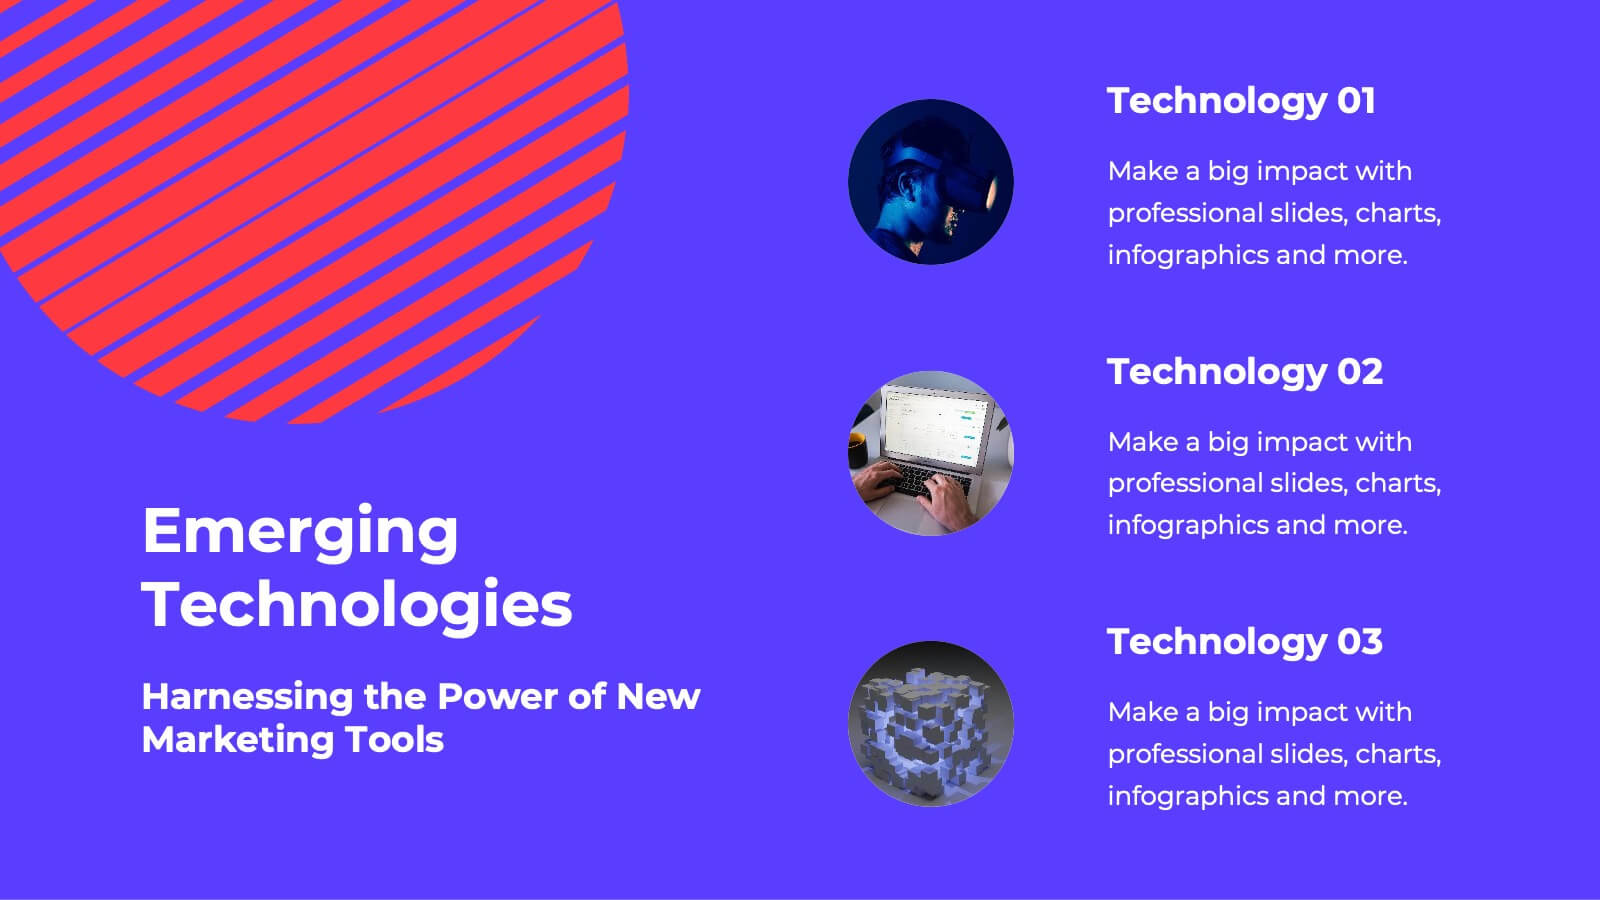
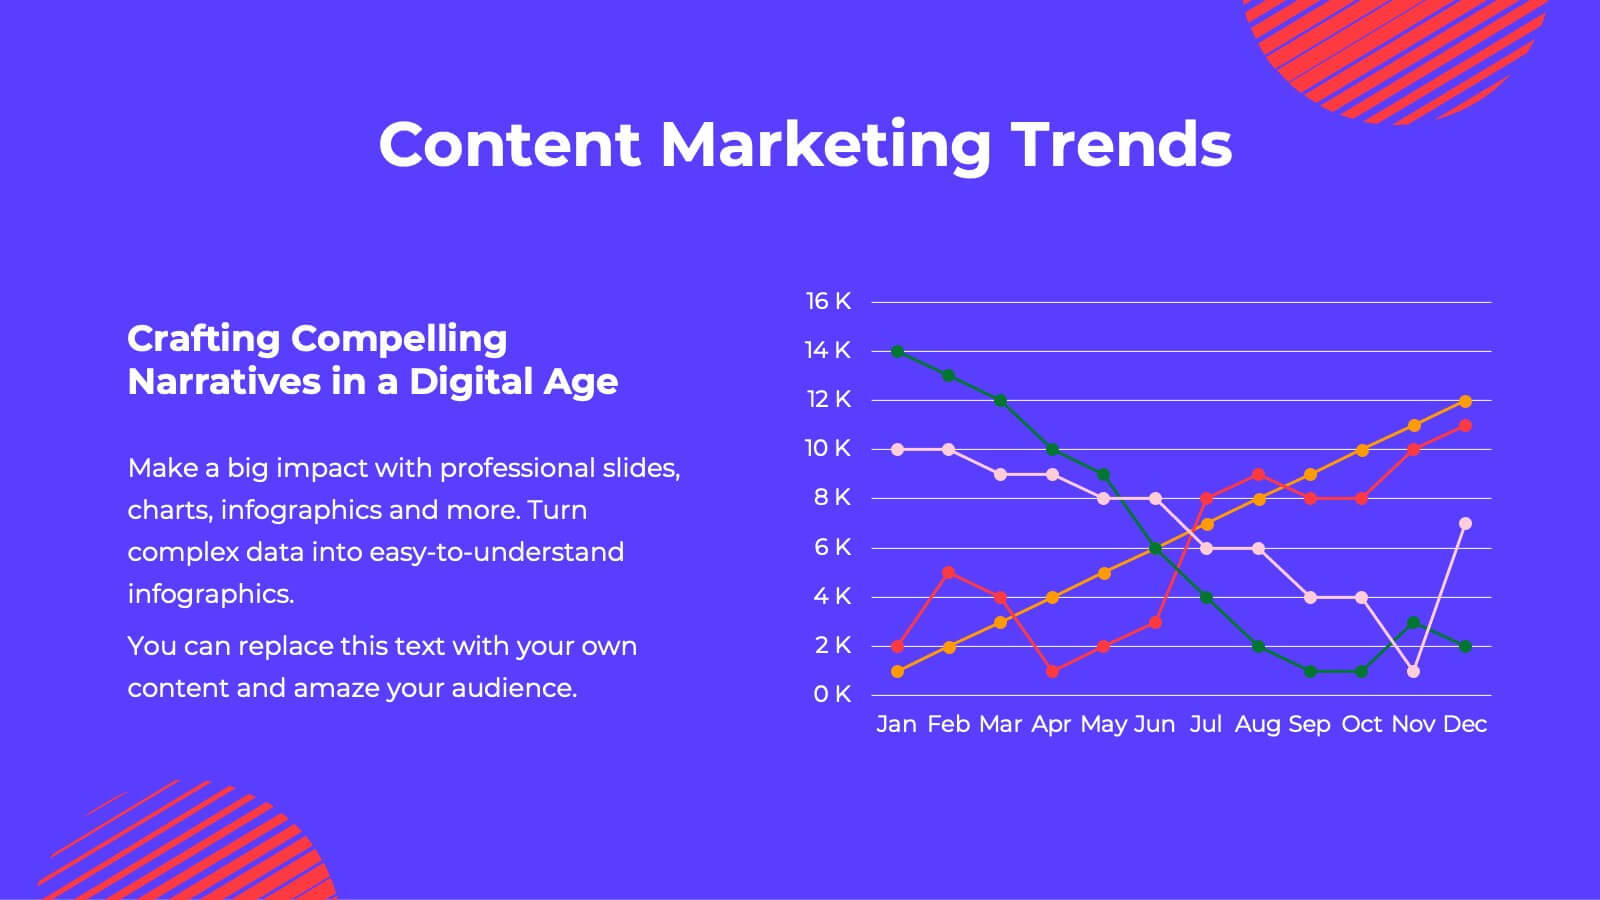
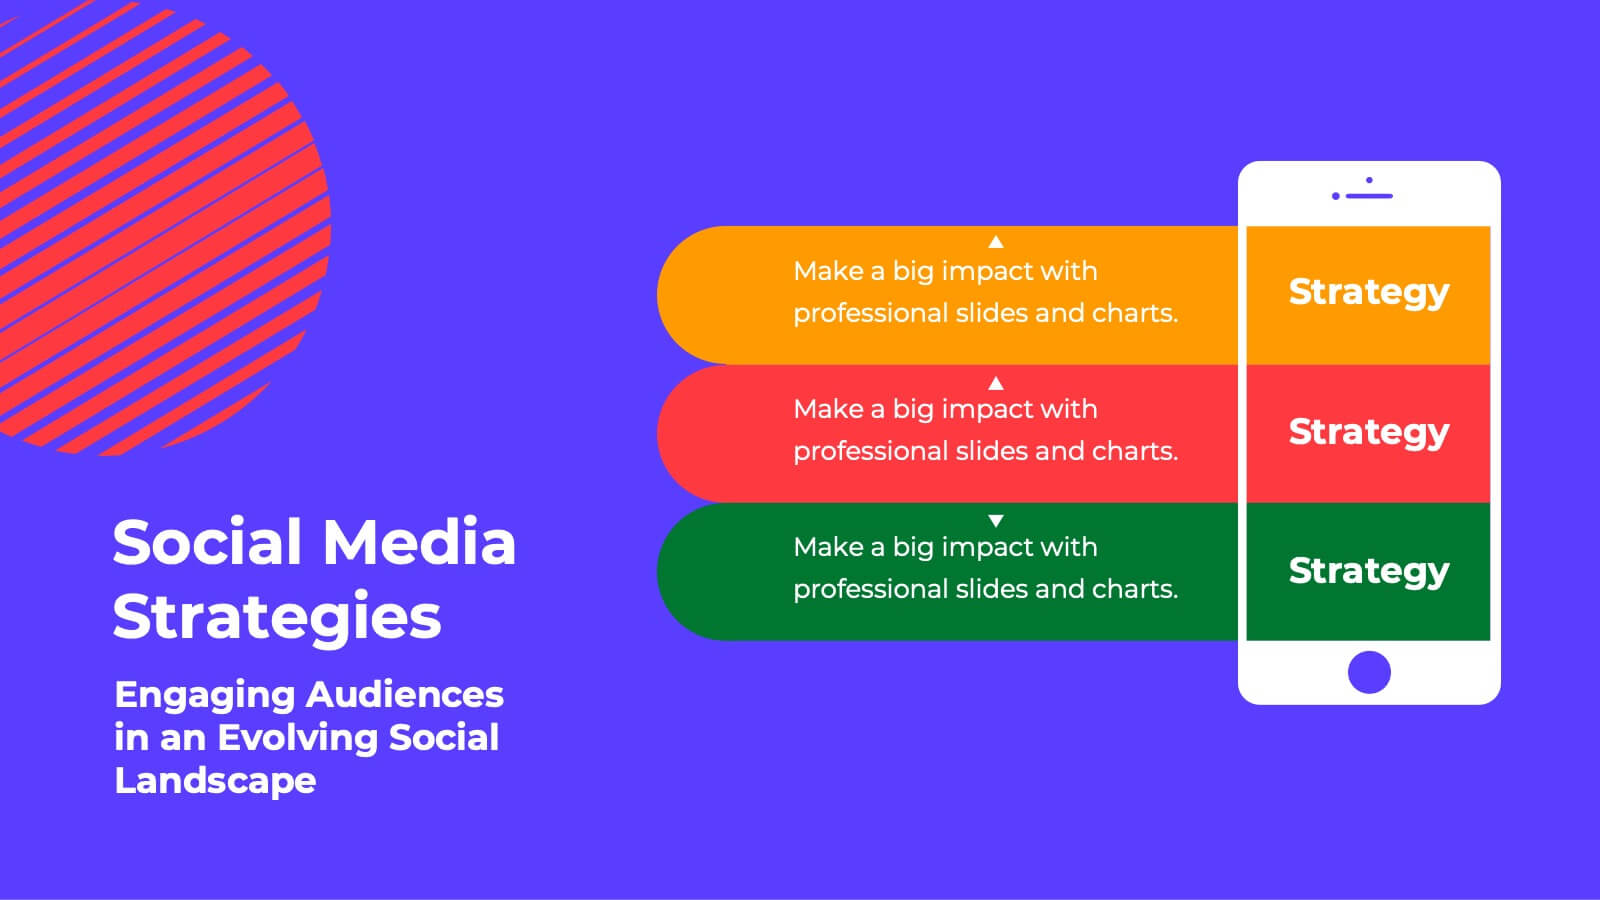
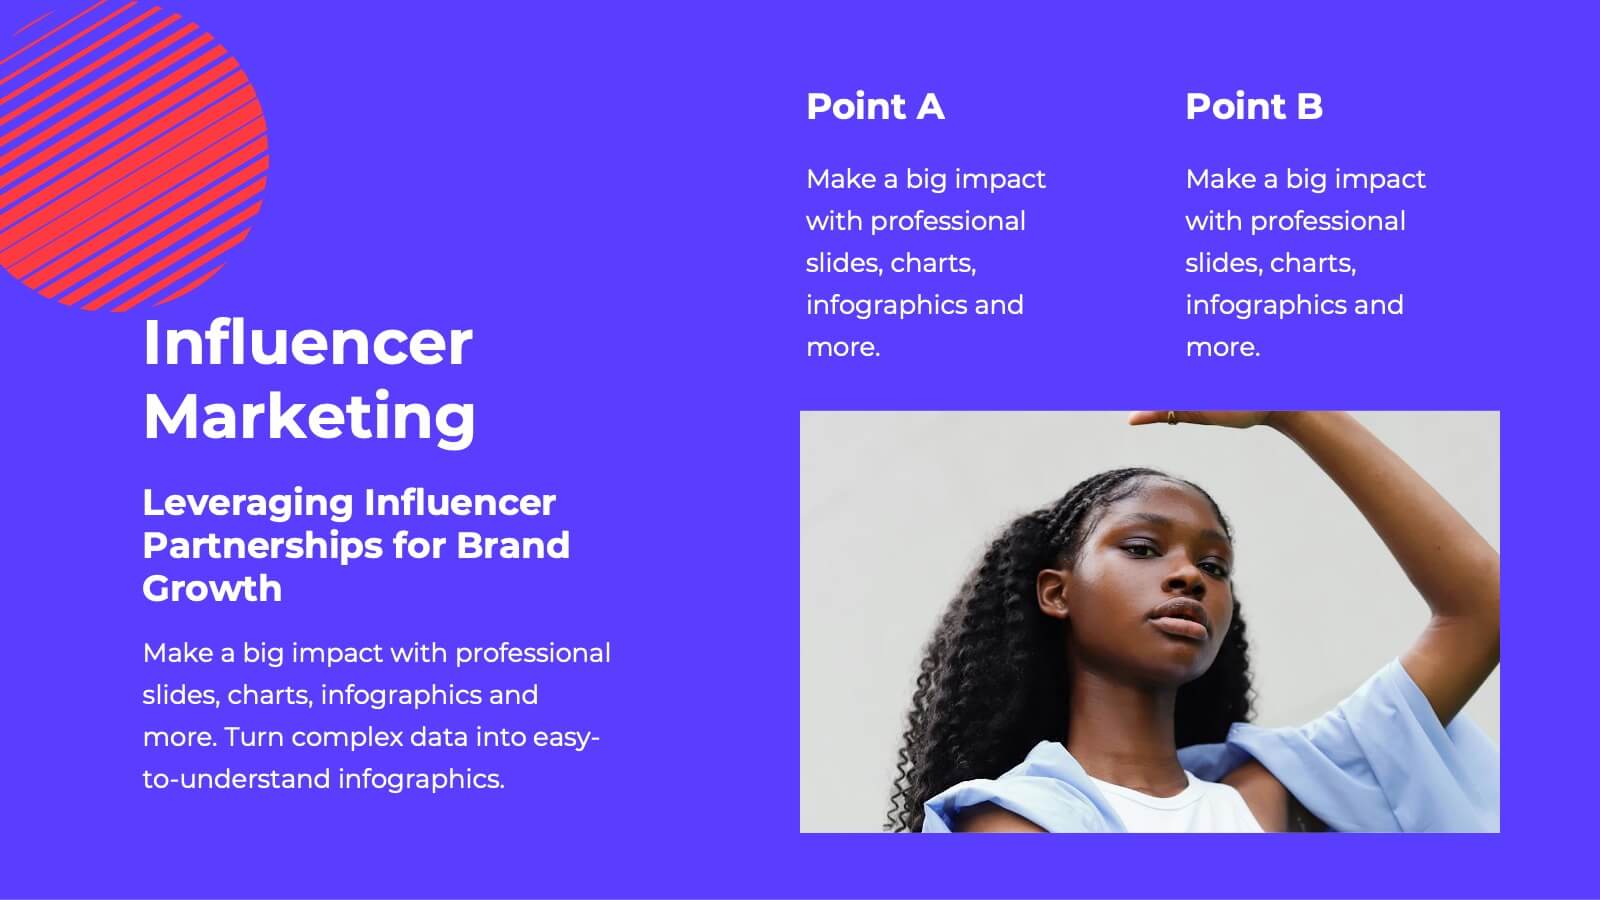
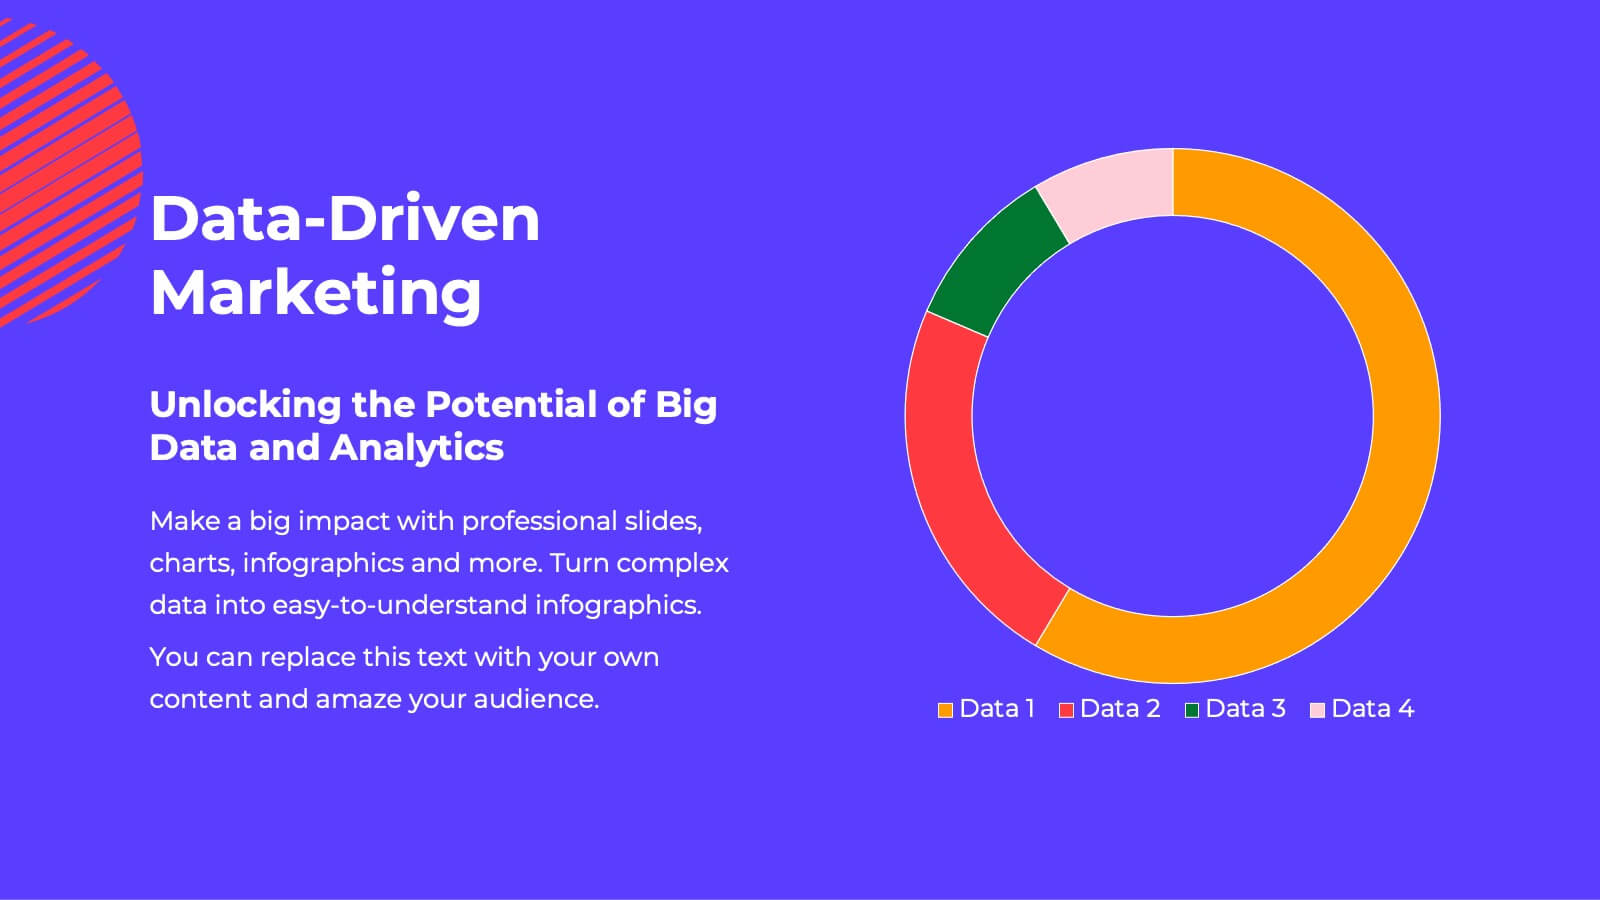
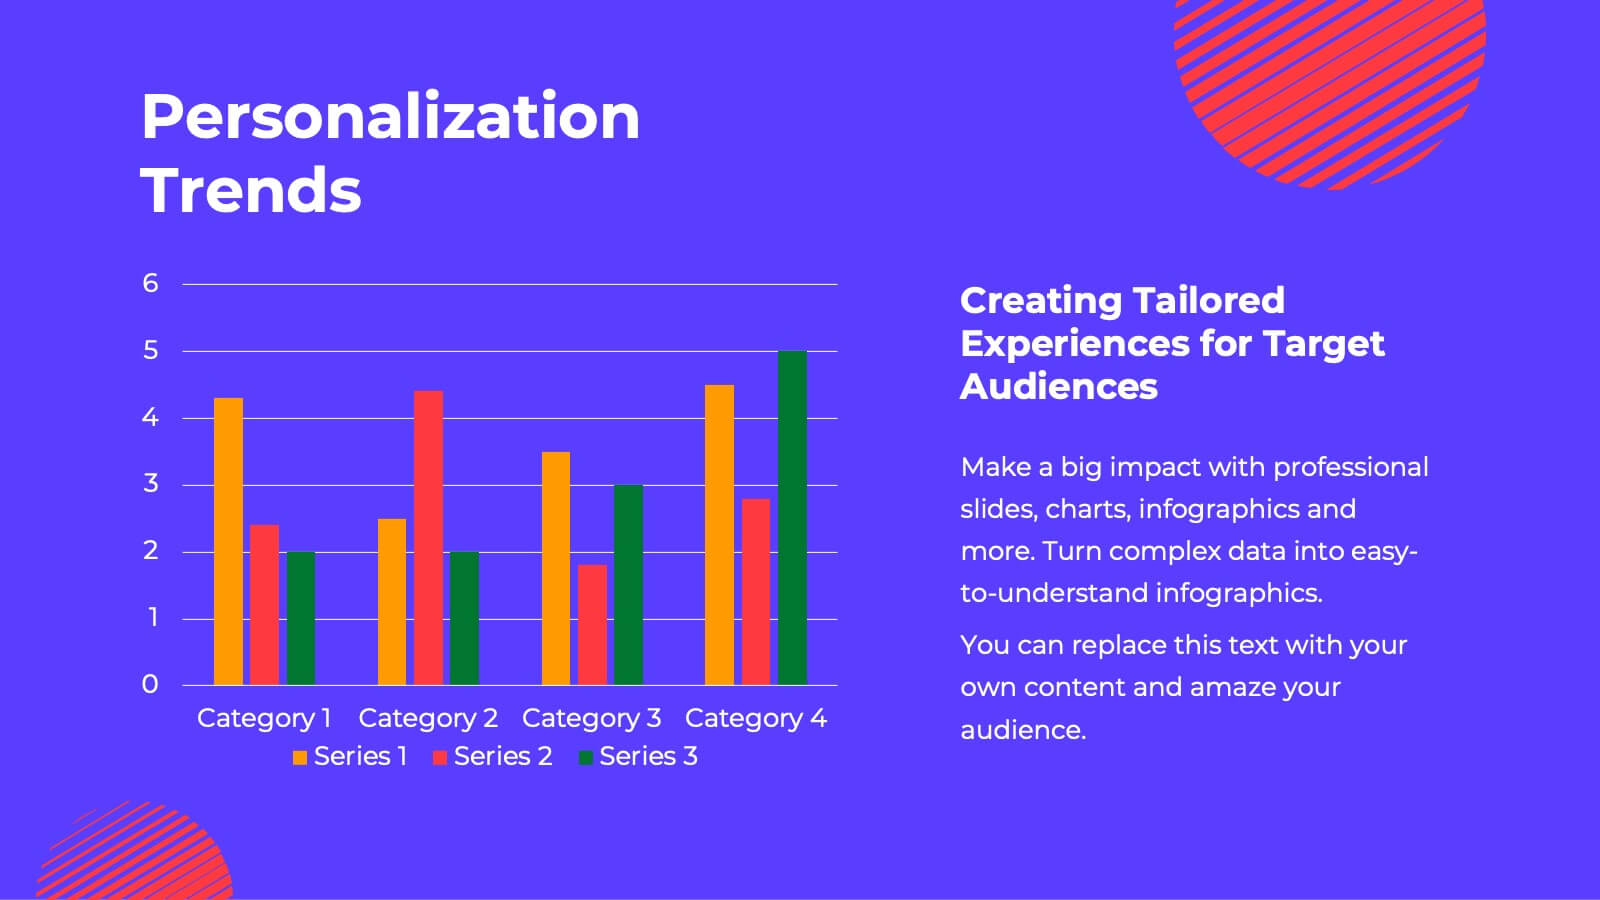
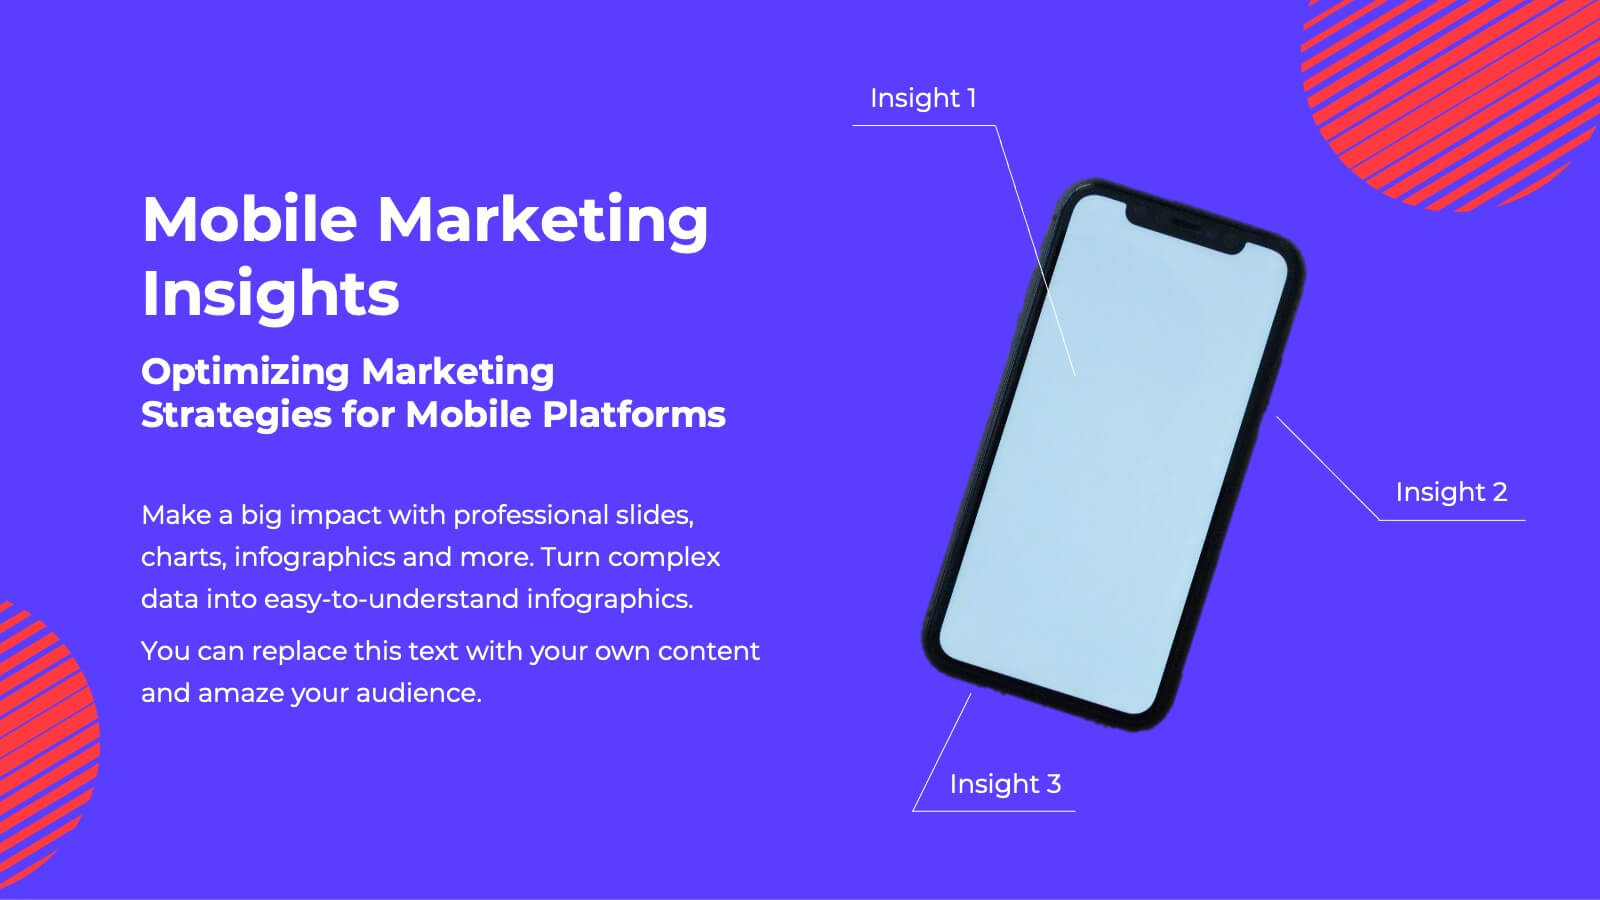
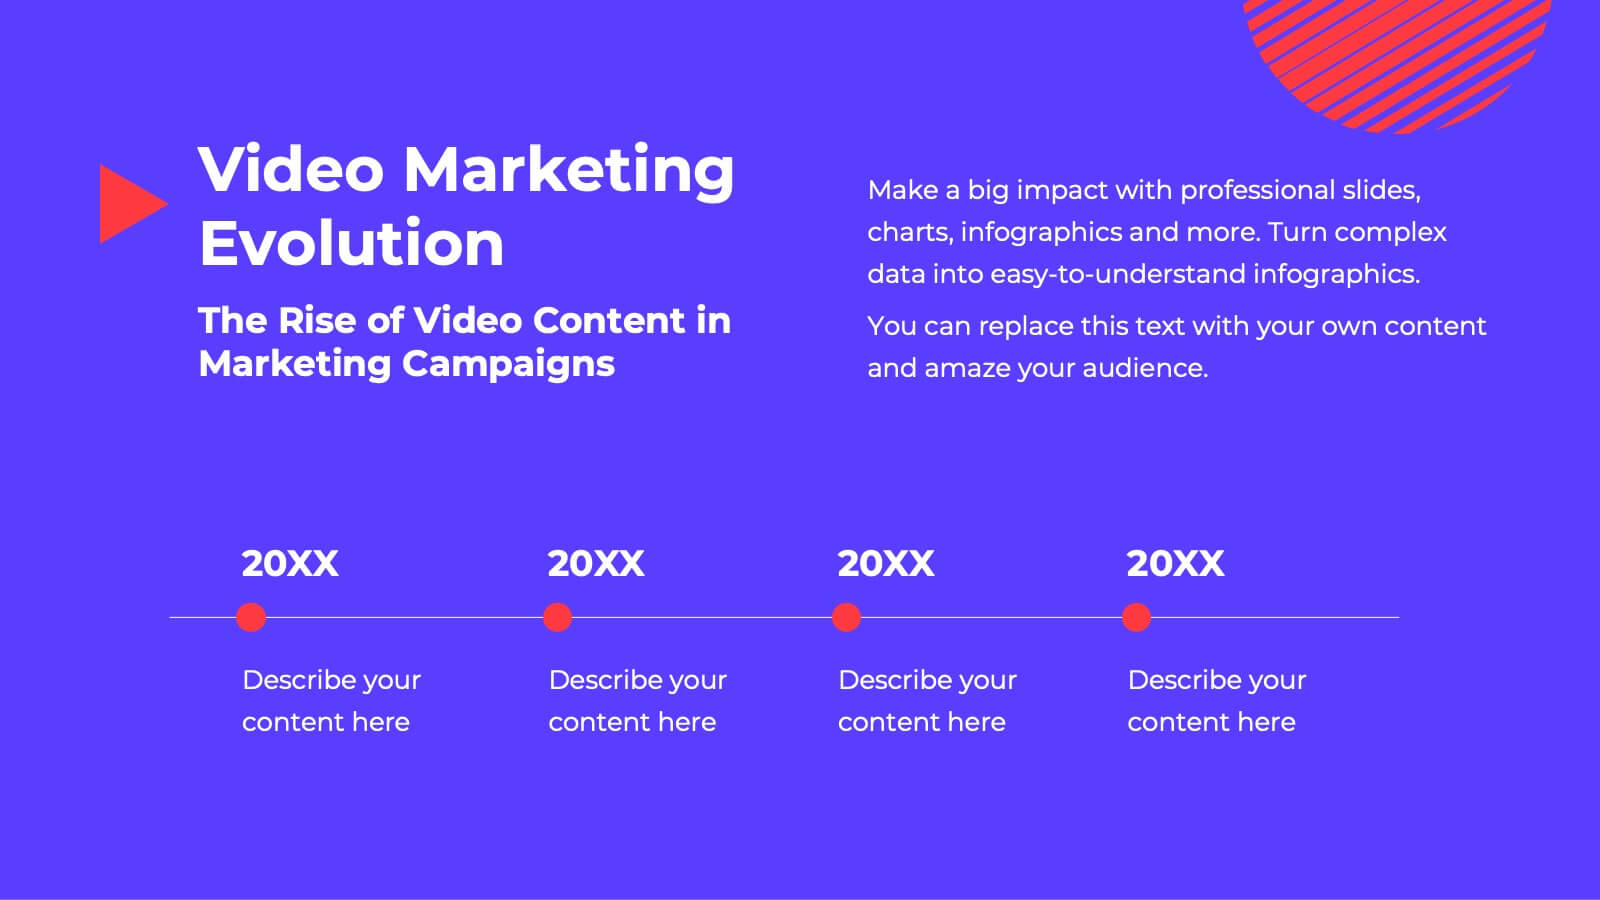
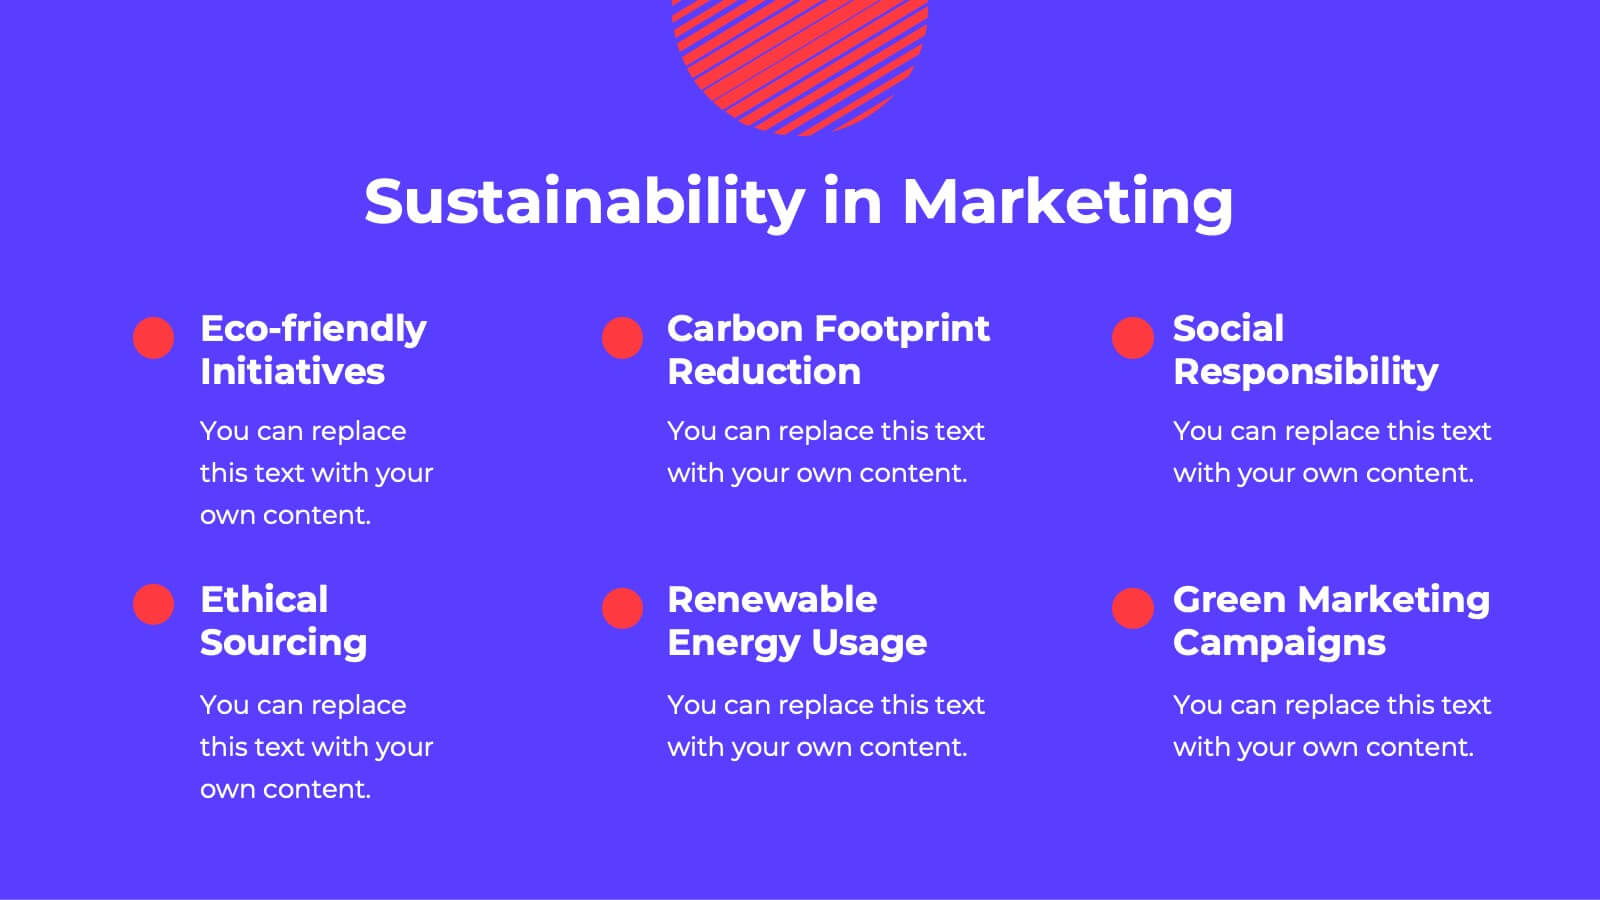
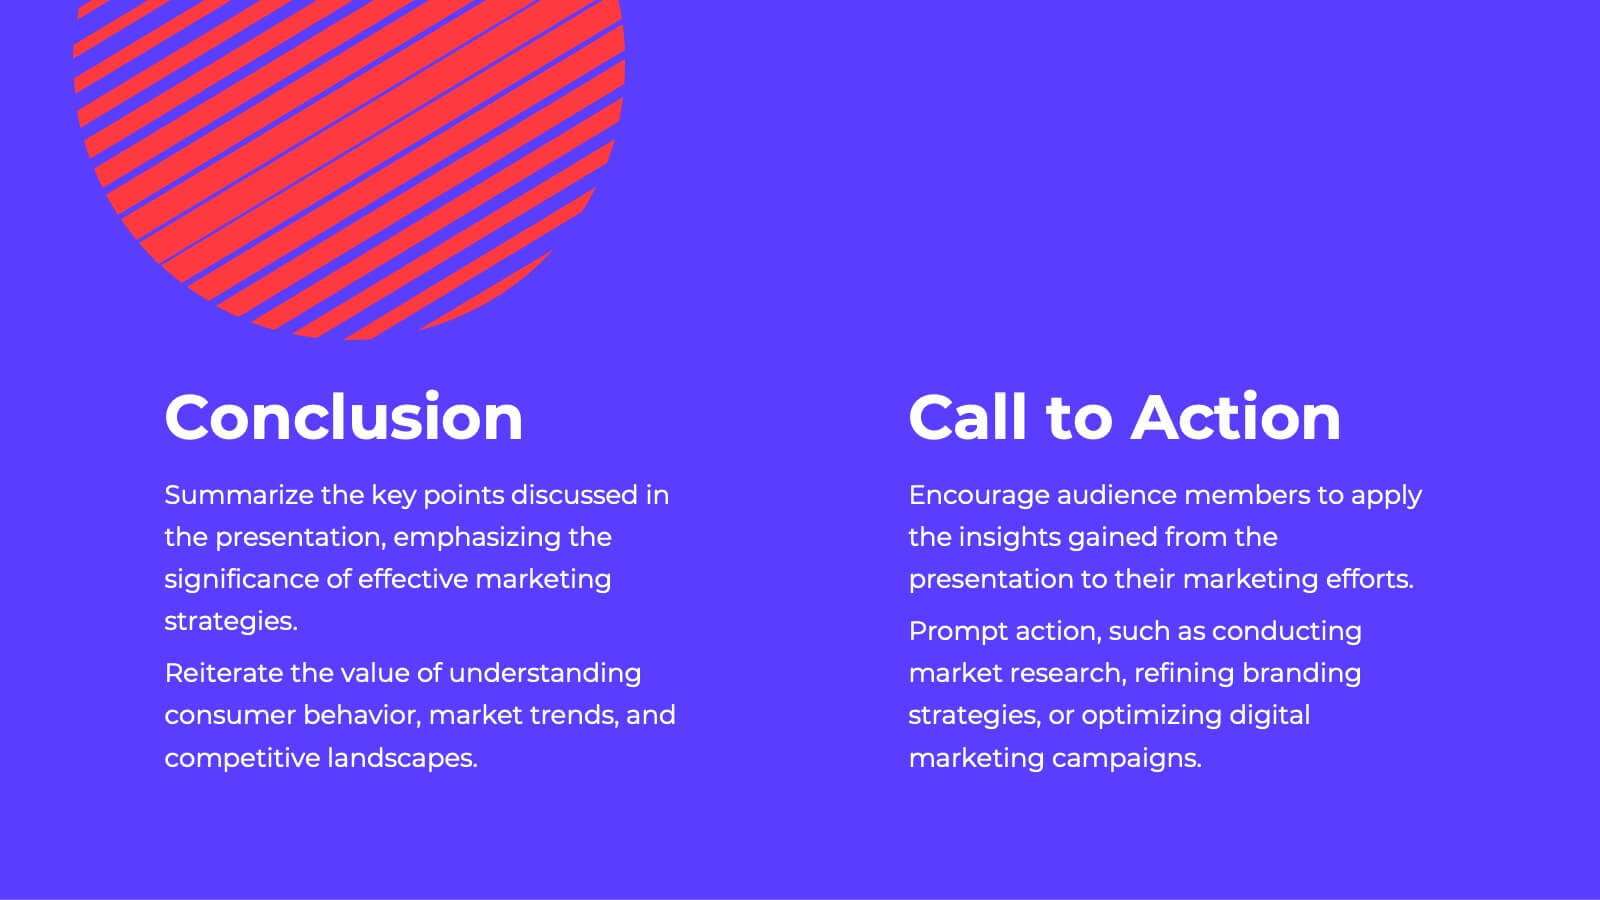
Fusion Marketing Campaign Presentation
Unleash the power of your marketing campaigns with this vibrant marketing campaign template! Dive into social media strategies, influencer marketing, data-driven insights, and more. Perfect for presenting to stakeholders and team members. Fully customizable and compatible with PowerPoint, Keynote, and Google Slides.


21 slides
Project Proposal Presentation
Outline your project's scope and objectives with precision using this Project Proposal presentation template. Designed for clarity and impact, it includes slides for project overview, deliverables, timeline, budget breakdown, and risk management. Ideal for project managers and teams, this template ensures detailed communication and streamlined project planning. Compatible with PowerPoint, Keynote, and Google Slides, it's perfect for driving successful project execution.


7 slides
Social Media Report Infographic
A Social Media Report is a comprehensive document that provides an in-depth analysis and summary of a brand or individual's performance on various social media platforms. This template is designed to transform your digital statistics and strategies into a captivating visual story. Just like a well-crafted social media post, this template blends creativity with analytics, enabling you to present your online endeavors in an engaging and informative manner. Compatible with Powerpoint, Keynote, and Google Slides. This is a testament to your brand's digital journey, illustrating the vibrant and diverse landscape of your online presence.


4 slides
Strategic Planning Gap Assessment
Visualize growth opportunities with this Strategic Planning Gap Assessment template. Perfect for showcasing the gap between actual progression and potential performance over time. Ideal for risk evaluation, diversification, and product development planning. Fully editable for PowerPoint, Keynote, and Google Slides.


6 slides
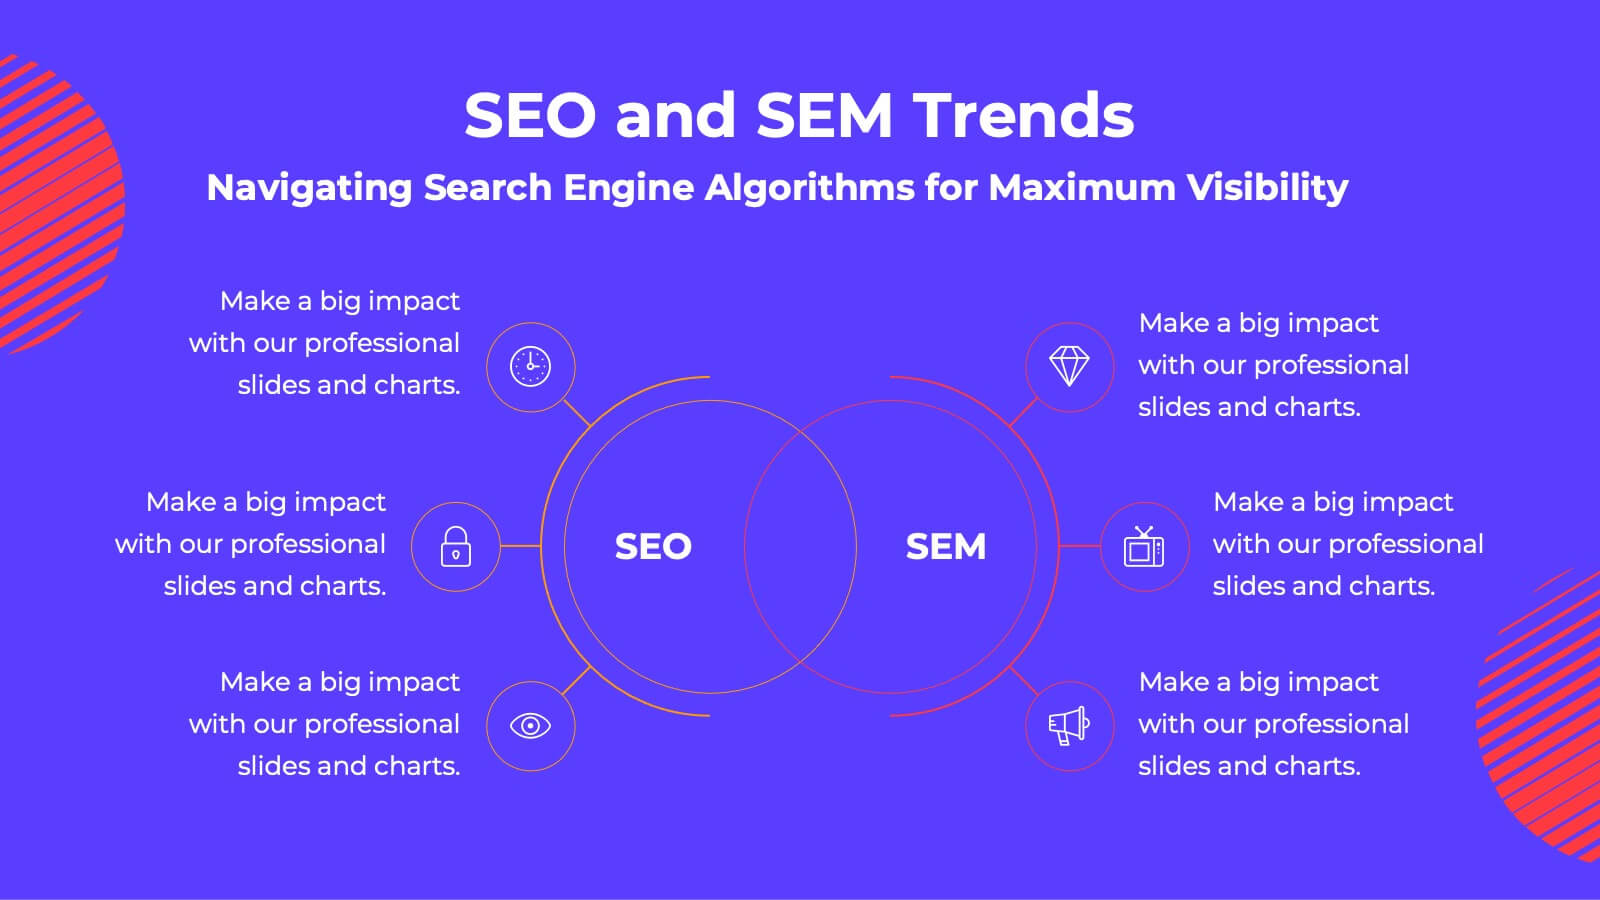
Hexagon Infographic Diagram Presentation
Turn your data into a story worth seeing with a clean, geometric layout that connects six key ideas in one bold visual. This presentation is perfect for showcasing processes, strategies, or relationships in a modern, engaging way. Fully compatible with PowerPoint, Keynote, and Google Slides.


5 slides
Product Life Cycle Stages Presentation
Explore the 'Product Life Cycle Stages' with this concise presentation template. Perfect for marketing professionals and product managers, it outlines the product journey from introduction to decline. Enhance your strategy discussions using this template, compatible with PowerPoint, Keynote, and Google Slides.


5 slides
5-Year Strategic Roadmap Slide Presentation
Take your audience on a dynamic journey with a flowing, milestone-based layout that makes long-term planning feel clear and engaging. This presentation helps you map out goals, priorities, and key initiatives across five years with structure and clarity. Ideal for strategy meetings and planning sessions. Fully compatible with PowerPoint, Keynote, and Google Slides.


6 slides
Project Roadmap with Strategic Phases Presentation
Visually guide your team through every phase with the Project Roadmap with Strategic Phases Presentation. This template features a curved arrow layout to illustrate project milestones, making it perfect for planning, strategy, or progress updates. Fully customizable in PowerPoint, Google Slides, and Canva for seamless integration into any workflow.


6 slides
Event and Meeting Schedule Calendar Presentation
Simplify your weekly planning with this modern and visually intuitive event calendar template. Featuring a clean grid layout, this presentation allows you to organize key meetings, deadlines, or project highlights across six weeks. Each week is color-coded for quick reference, and each event box is fully editable to include titles and custom notes. Ideal for team leaders, educators, corporate planners, and event organizers. Compatible with PowerPoint, Keynote, and Google Slides for effortless use.


7 slides
Six Sigma Methodology Infographic Presentation Template
Our Six Sigma Methodology template is a great way to start any project. This can be used as a guideline to create the foundations of the Six Sigma model and allow you to think about how to approach your project in terms of how it will be analyzed, making it easier for people working on the same projects to analyze their own results and make sure they are all aligned with the core principles of Six Sigma. With our Six Sigma Methodology template, you can easily organize and manage your entire process. Using this template will save you time and allow you to get more work done in less time.


23 slides
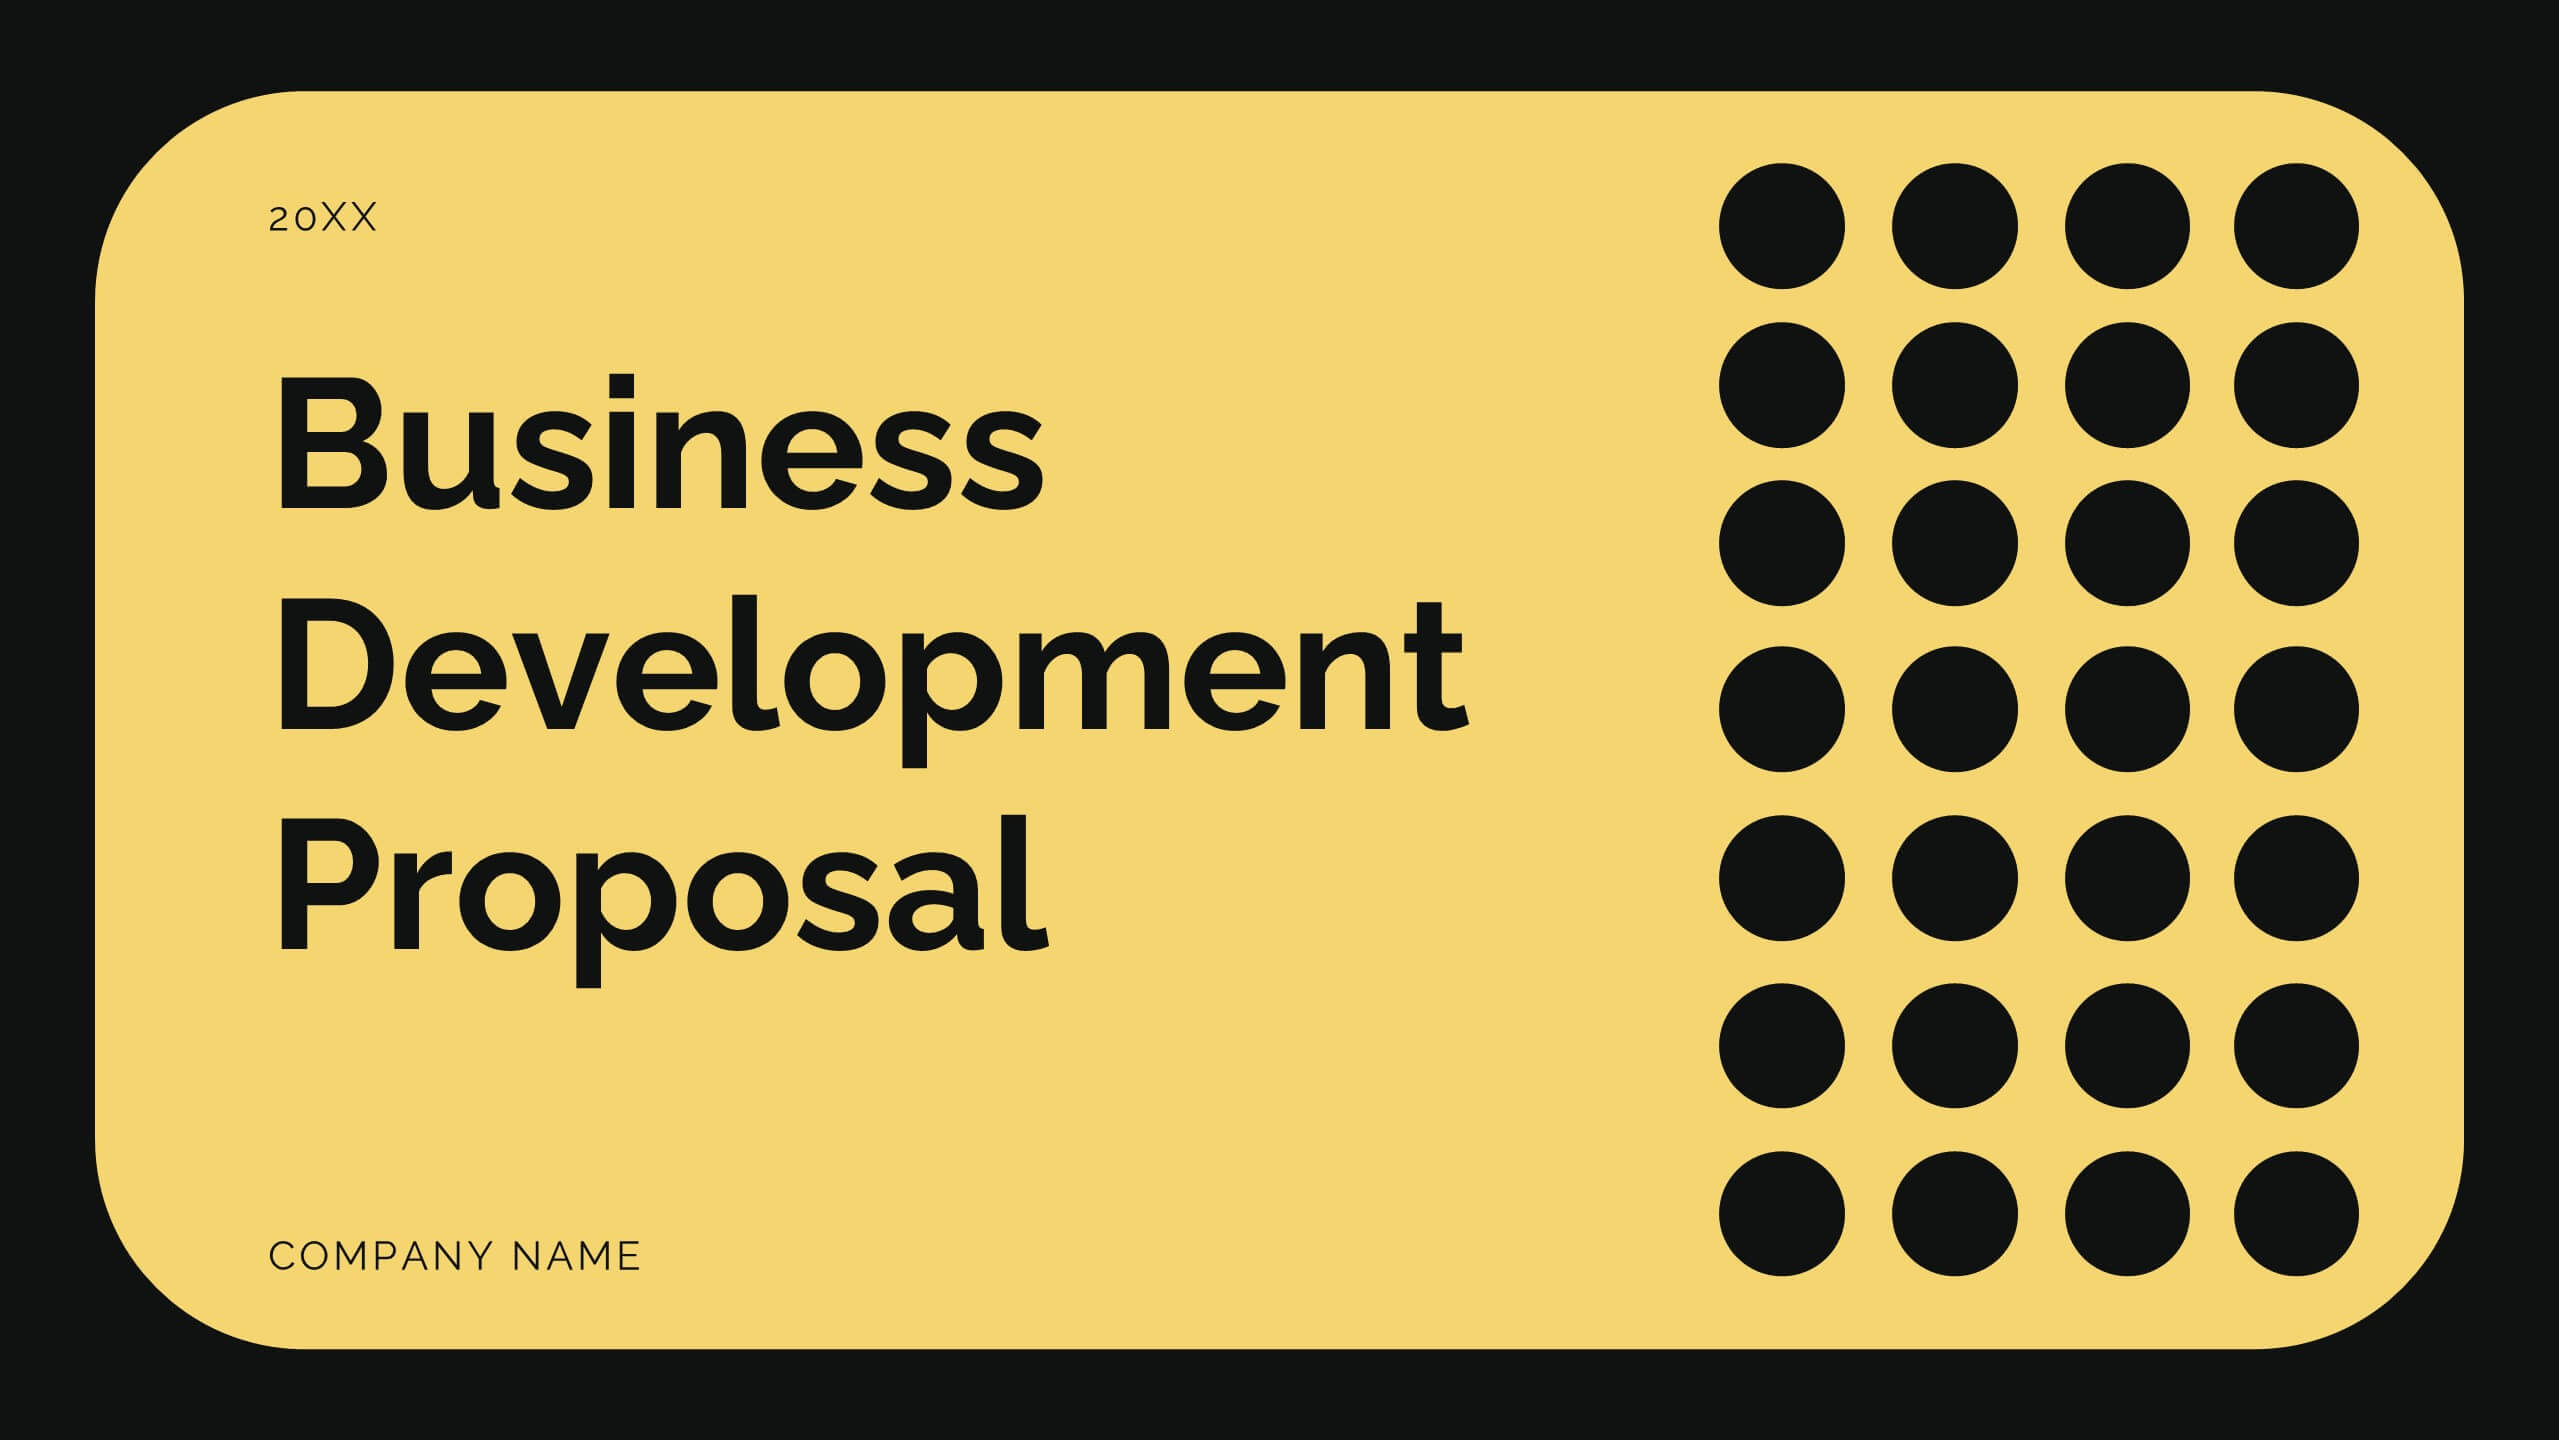
Diamond Business Development Proposal Presentation
Unlock the potential of your business proposals with this bold and engaging presentation template! Perfect for business development pitches, conferences, and workshops, it includes sections for speaker introductions, panel discussions, and session breakdowns. With its clean and professional design, this template ensures clarity and impact. Fully customizable and compatible with PowerPoint, Keynote, and Google Slides.


25 slides
Luminous Qualitative Research Findings Presentation
Elevate your qualitative research findings with this sleek and professional template. It covers research objectives, methodology, data collection, and key findings. Ideal for clear and compelling presentations. Fully compatible with PowerPoint, Keynote, and Google Slides for seamless integration.


4 slides
Project Timeline & Milestone Presentation
Stay on track and visualize your progress with this Project Timeline & Milestone Presentation. Perfect for project managers and team leads, this template features a clean Gantt-style layout that spans multiple months, allowing you to clearly map out tasks, timelines, and key milestones. Use it to enhance stakeholder reporting or internal planning sessions. Fully editable in PowerPoint, Keynote, and Google Slides.


7 slides
Agile Scrum Framework Presentation
Streamline your workflow with this Agile Scrum Framework Presentation Template. Ideal for visualizing iterative processes, sprints, team collaboration, and project planning stages. The circular arrow diagram with editable text placeholders helps communicate each agile step clearly. Fully compatible with PowerPoint, Keynote, and Google Slides.


21 slides
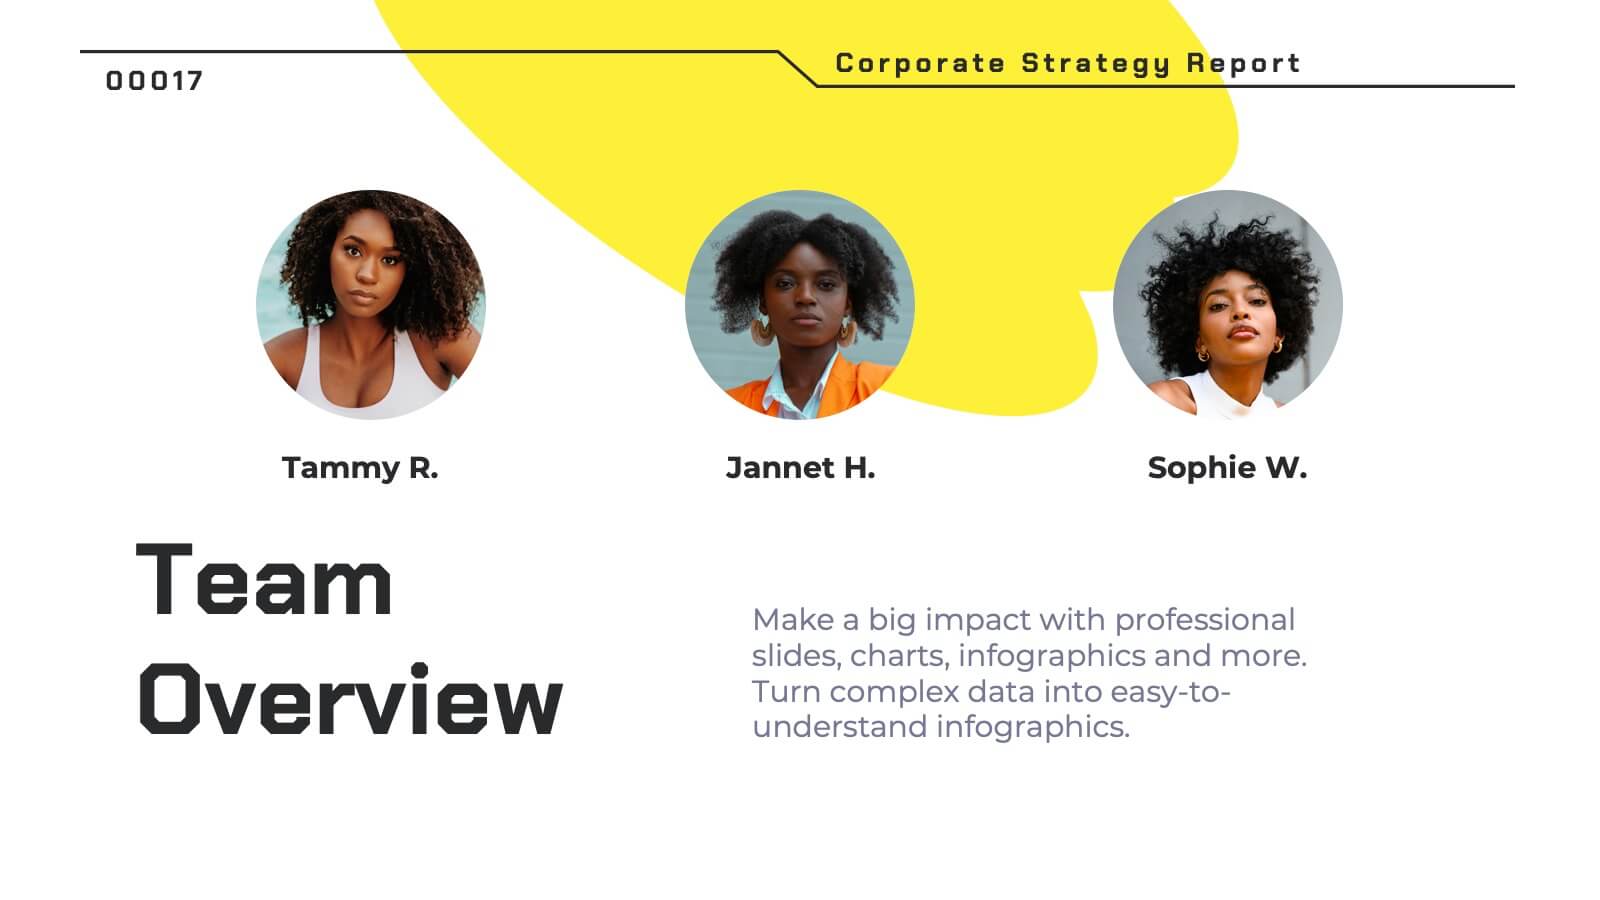
Pyronova Corporate Strategy Report Presentation
This professional corporate strategy template includes slides for market opportunity, SWOT analysis, objectives, marketing plan, revenue model, and competitive analysis. Designed for impactful presentations, it highlights financial performance, investment opportunities, and operational plans. Fully customizable in PowerPoint, Keynote, and Google Slides to suit diverse business needs.


5 slides
Business Activity Rotation Cycle Presentation
Showcase continuous workflows with the Business Activity Rotation Cycle Presentation. Ideal for operations, planning, and strategy meetings, this template visualizes multi-phase cycles with clean, editable layouts. Use it to outline repeated business functions, processes, or initiatives. Compatible with PowerPoint, Keynote, and Google Slides—perfect for consultants, teams, and business professionals.