


Features
- 5 Unique slides
- Fully editable and easy to edit in Microsoft Powerpoint, Keynote and Google Slides
- 16:9 widescreen layout
- Clean and professional designs
- Export to JPG, PDF or send by email


Do you have any questions?
Recommend


5 slides
Big Data Interpretation and Metrics Presentation
Break down complex data into digestible segments with the Big Data Interpretation and Metrics Presentation. Featuring a puzzle-inspired layout, this template is ideal for illustrating interconnected data points, analytics strategies, or metric-based frameworks. Fully customizable in PowerPoint, Keynote, and Google Slides.


6 slides
Hexagonal Grid for Process Mapping Presentation
Visualize your workflow with structure using the Hexagonal Grid for Process Mapping Presentation. This clean, geometric layout guides viewers through each phase of your process with clarity and consistency. Ideal for outlining steps, stages, or interconnected tasks in a modern format. Fully editable in Canva, PowerPoint, Keynote, and Google Slides.


5 slides
Detailed Customer Profile Layout Presentation
Get to know your audience like never before with this sleek, data-driven layout built for precision and insight. Ideal for marketing, research, and strategy teams, it lets you visualize customer behaviors and demographics clearly. Fully editable and compatible with PowerPoint, Keynote, and Google Slides for seamless presentation design.


7 slides
Lifecycle Stages in Customer Experience Presentation
Showcase the full customer journey with this Lifecycle Stages in Customer Experience presentation. Featuring a sleek infinity loop layout, this slide is ideal for visualizing cyclical engagement stages—like acquisition, onboarding, retention, and advocacy. Clean design and labeled touchpoints help convey insights clearly. Fully compatible with PowerPoint, Canva, and Google Slides.


6 slides
Modern 3D Infographic Presentation
Add a fresh, dimensional twist to your data storytelling with this clean and modern pyramid layout. Ideal for showcasing layered structures, hierarchical information, or process stages, it’s designed to make your visuals pop. Fully editable and compatible with PowerPoint, Keynote, and Google Slides for easy customization.


5 slides
USA Resources Map Infographics
A USA resources map is a visual representation of the natural resources found in different regions of the United States. This presentation template showcases the diverse natural resources found across the United States. It provides an overview of different types of resources, including minerals, energy sources, agricultural products, and more, allowing viewers to understand the richness and distribution of resources in the country. This can provide valuable information for industries, researchers, and students to understand the distribution and utilization of natural resources across the country.


7 slides
Agenda Company Infographic
Optimize your corporate meetings with our premium collection of company agenda slide templates. Each slide is precisely designed to streamline and enhance the presentation of meeting agendas within a corporate setting. These templates are perfect for laying out the sequence of discussions, key points, and decision-making processes planned for corporate gatherings. The designs range from minimalistic layouts to more detailed ones, incorporating various graphical elements like charts, icons, and timelines to aid in visualizing the meeting’s structure. This not only helps in keeping the meeting on track but also enhances participant engagement by clearly outlining expectations and topics. These agenda slides are fully customizable, enabling adjustments in color schemes, text placement, and design elements to suit your corporate identity and specific meeting needs. Whether it's weekly team meetings, executive briefings, or annual general meetings, these templates provide the necessary structure to conduct efficient and effective corporate discussions.


6 slides
Modern Business Strategy Presentation
Bring your ideas to life with a sleek, forward-thinking presentation designed to communicate business growth and strategic planning. Ideal for outlining goals, performance steps, and innovation roadmaps, this clean and modern layout ensures every concept stands out. Fully compatible with PowerPoint, Keynote, and Google Slides for easy customization.


6 slides
Project Scope and Deliverables Overview Presentation
Make your project presentations flow effortlessly with a clear, structured layout that highlights goals, milestones, and deliverables. Ideal for tracking progress and aligning teams, this professional design balances clarity and style. Fully compatible with PowerPoint, Keynote, and Google Slides for smooth editing and presentation flexibility.


6 slides
Industry Analysis Porter's 5 Forces Presentation
Analyze industry competition with this Porter's Five Forces template! This structured layout visually breaks down key factors like buyer power, supplier influence, competitive rivalry, new market entrants, and substitution threats, making it ideal for strategic planning and market assessments. Fully customizable and compatible with PowerPoint, Keynote, and Google Slides.


34 slides
Incubator Pitch Deck
An Incubator Pitch Deck is used by startups or entrepreneurs to pitch their business idea to an incubator or accelerator program, which are organizations that provide support, resources, and mentorship to early-stage startups to help them grow and succeed. This incubator pitch deck template is specifically tailored to the needs and requirements of the incubator or accelerator program. This template is designed with a professional and striking blue color palette, that adds a sense of sophistication and professionalism to your presentation. It also features a range of customizable slides that are specifically tailored for pitch presentations.


6 slides
5-Stage Sales Funnel Presentation
Visualize your sales process effortlessly with this 5-Stage Sales Funnel template. Ideal for showcasing lead conversion, customer journey, and sales strategies, this design is fully customizable. Adjust colors, text, and icons to fit your needs. Compatible with PowerPoint, Keynote, and Google Slides for seamless integration into your presentations.


6 slides
Title Hierarchy Infographic
The collection of slides is designed to efficiently convey key themes with a striking visual appeal, ensuring that crucial topics are presented with clarity and emphasis. Each slide utilizes bold typography and a unique color palette to draw attention and maintain viewer engagement. The designs incorporate dynamic shapes and minimalist layouts, enhancing the presentation's readability while emphasizing important content. This set is ideal for professionals aiming to present complex ideas in a clear and memorable way during meetings or in corporate documents. It supports various communicative goals, such as introducing concepts, outlining challenges, or promoting organizational initiatives, making it a versatile tool for enhancing message delivery in any professional setting.


4 slides
Human-Centered Design Thinking Strategy Presentation
Put people at the heart of your process with this Human-Centered Design Thinking Strategy Presentation. Ideal for visualizing empathy-driven innovation, this template allows you to clearly present two key perspectives or user segments using stylized silhouette graphics and percentage breakdowns. Great for product development pitches, UX design reviews, or customer journey storytelling. Compatible with PowerPoint, Keynote, and Google Slides.


21 slides
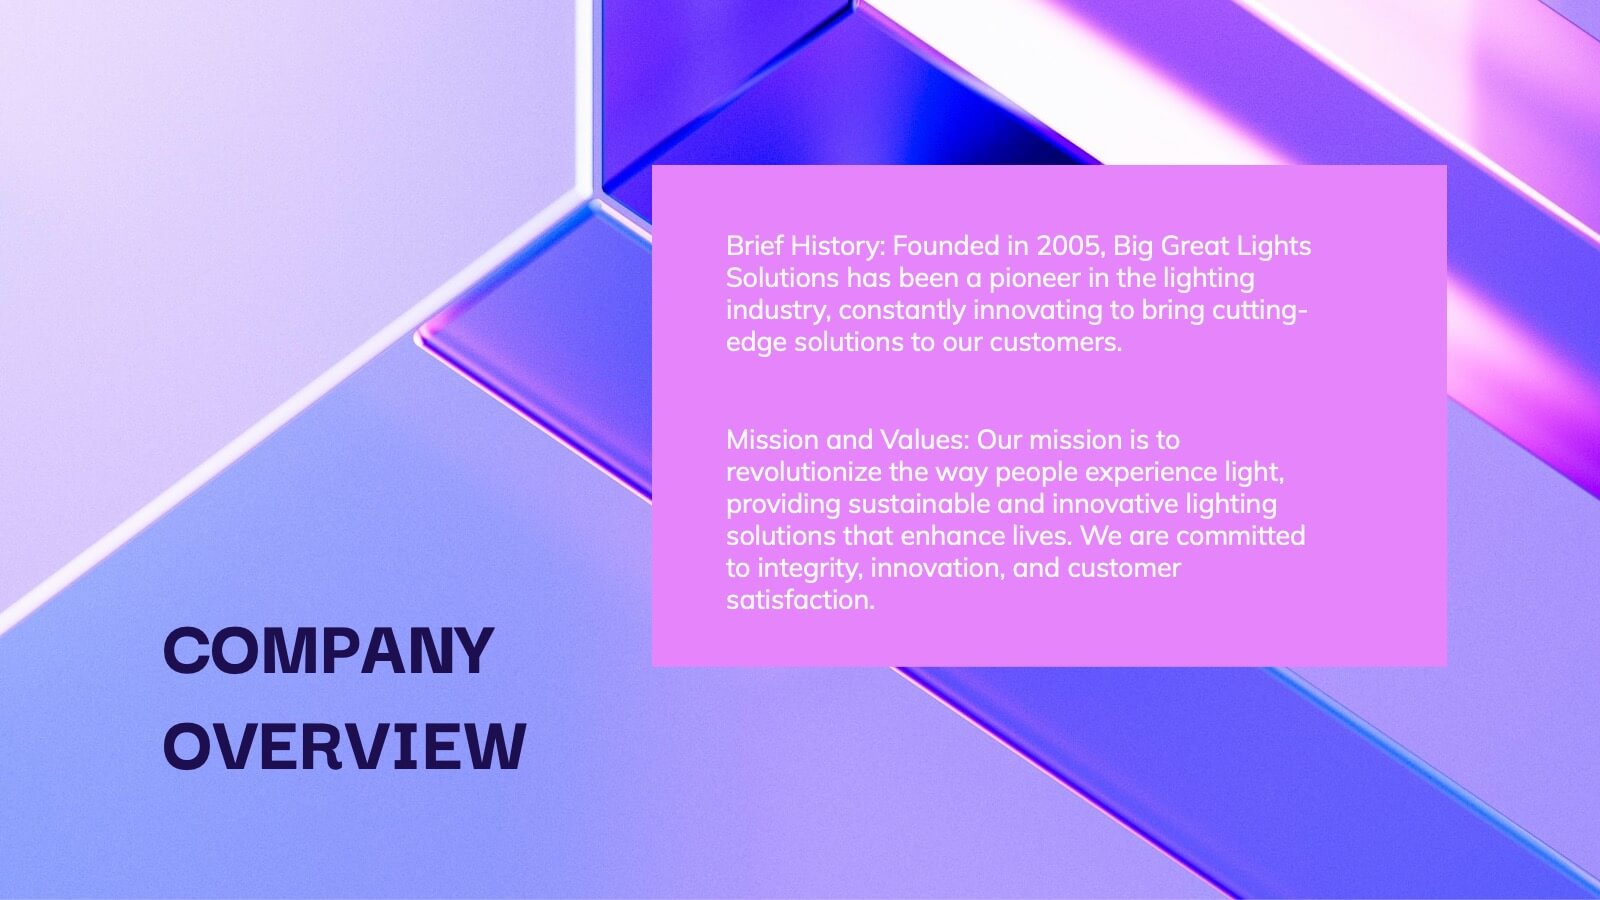
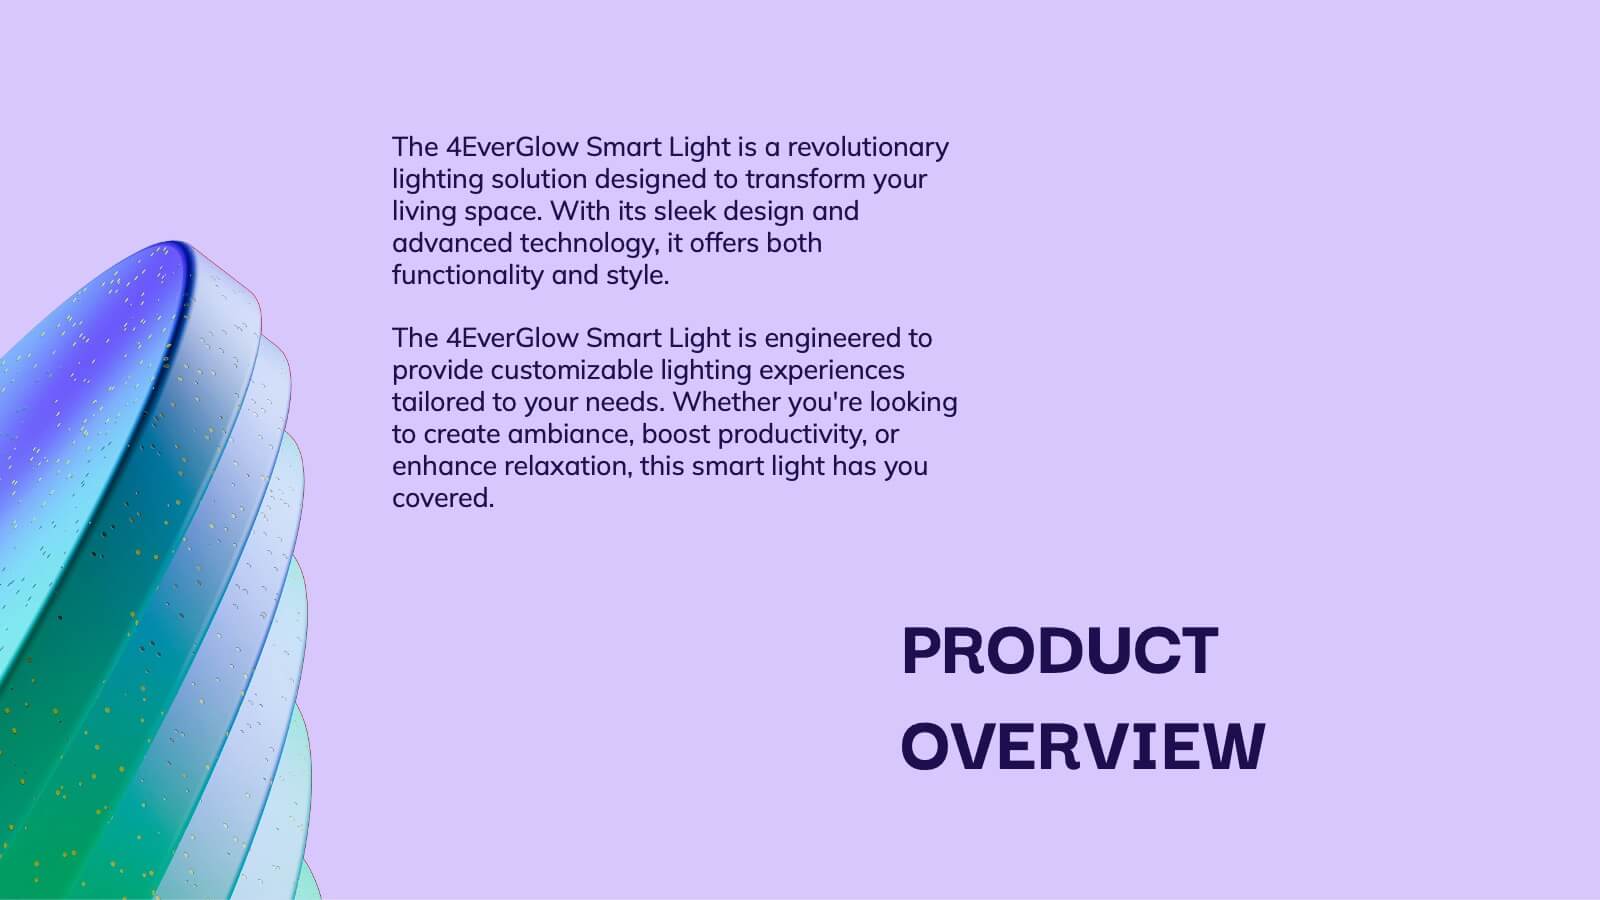
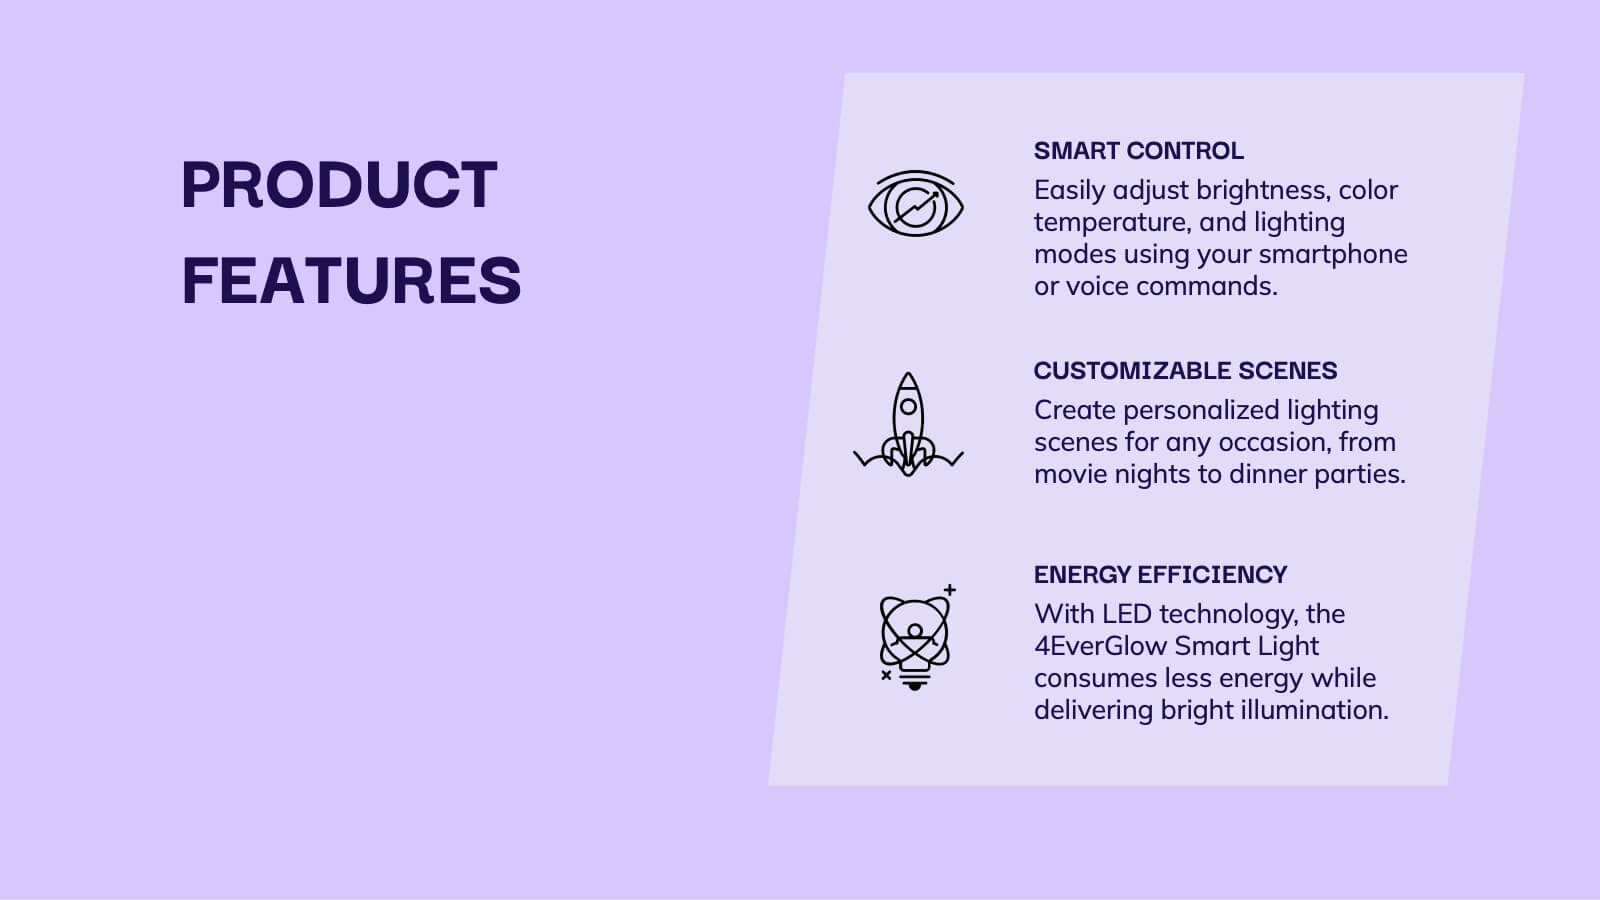
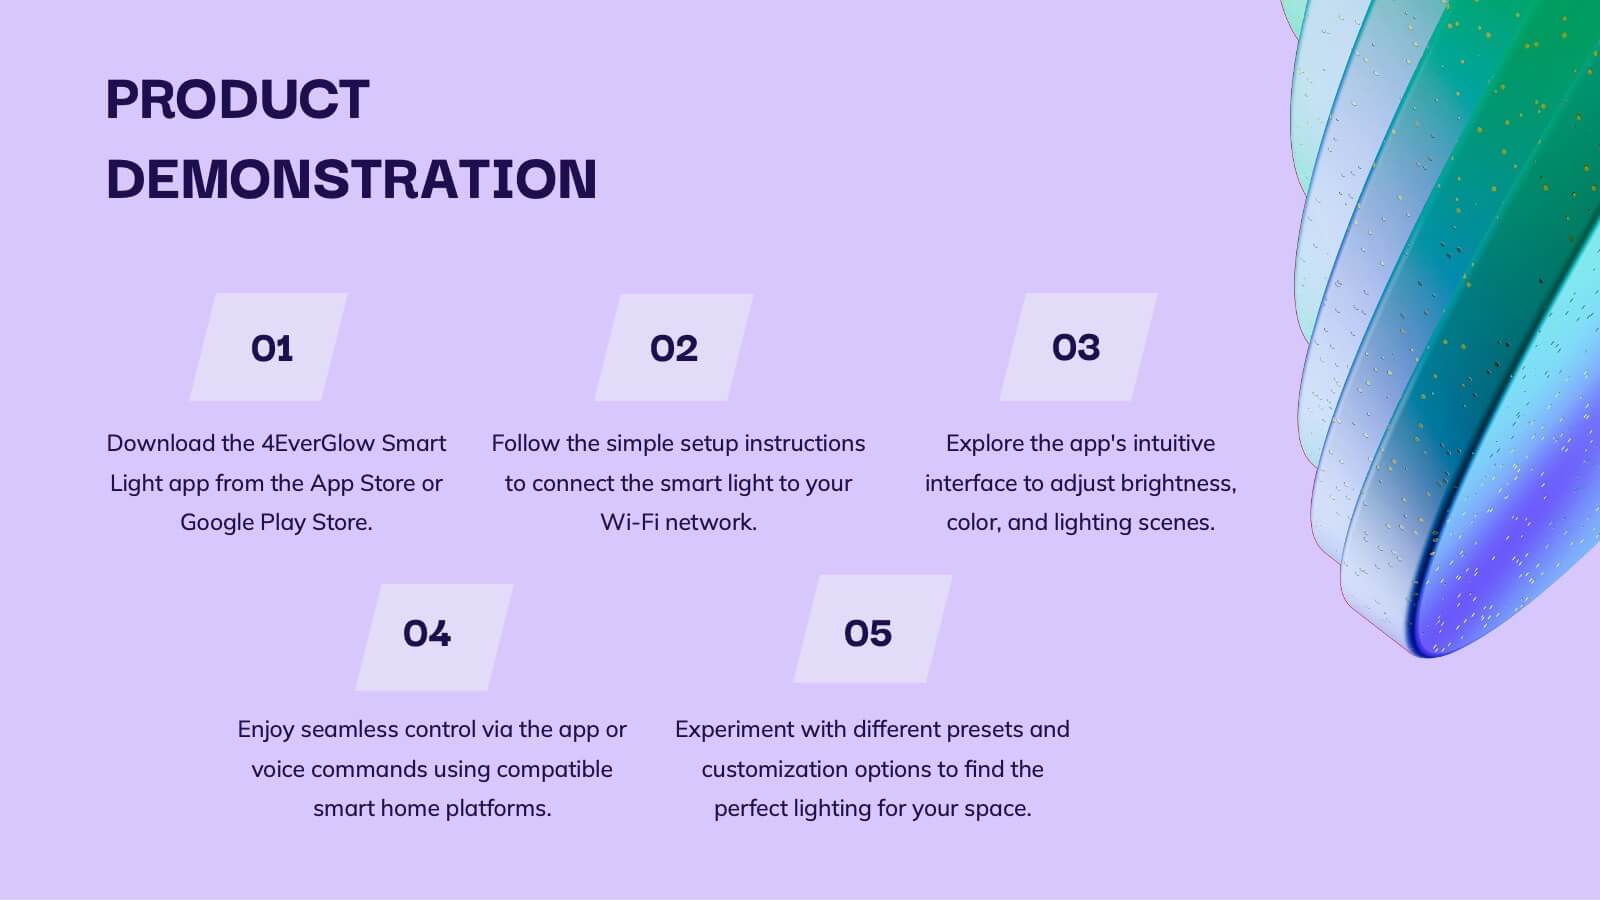
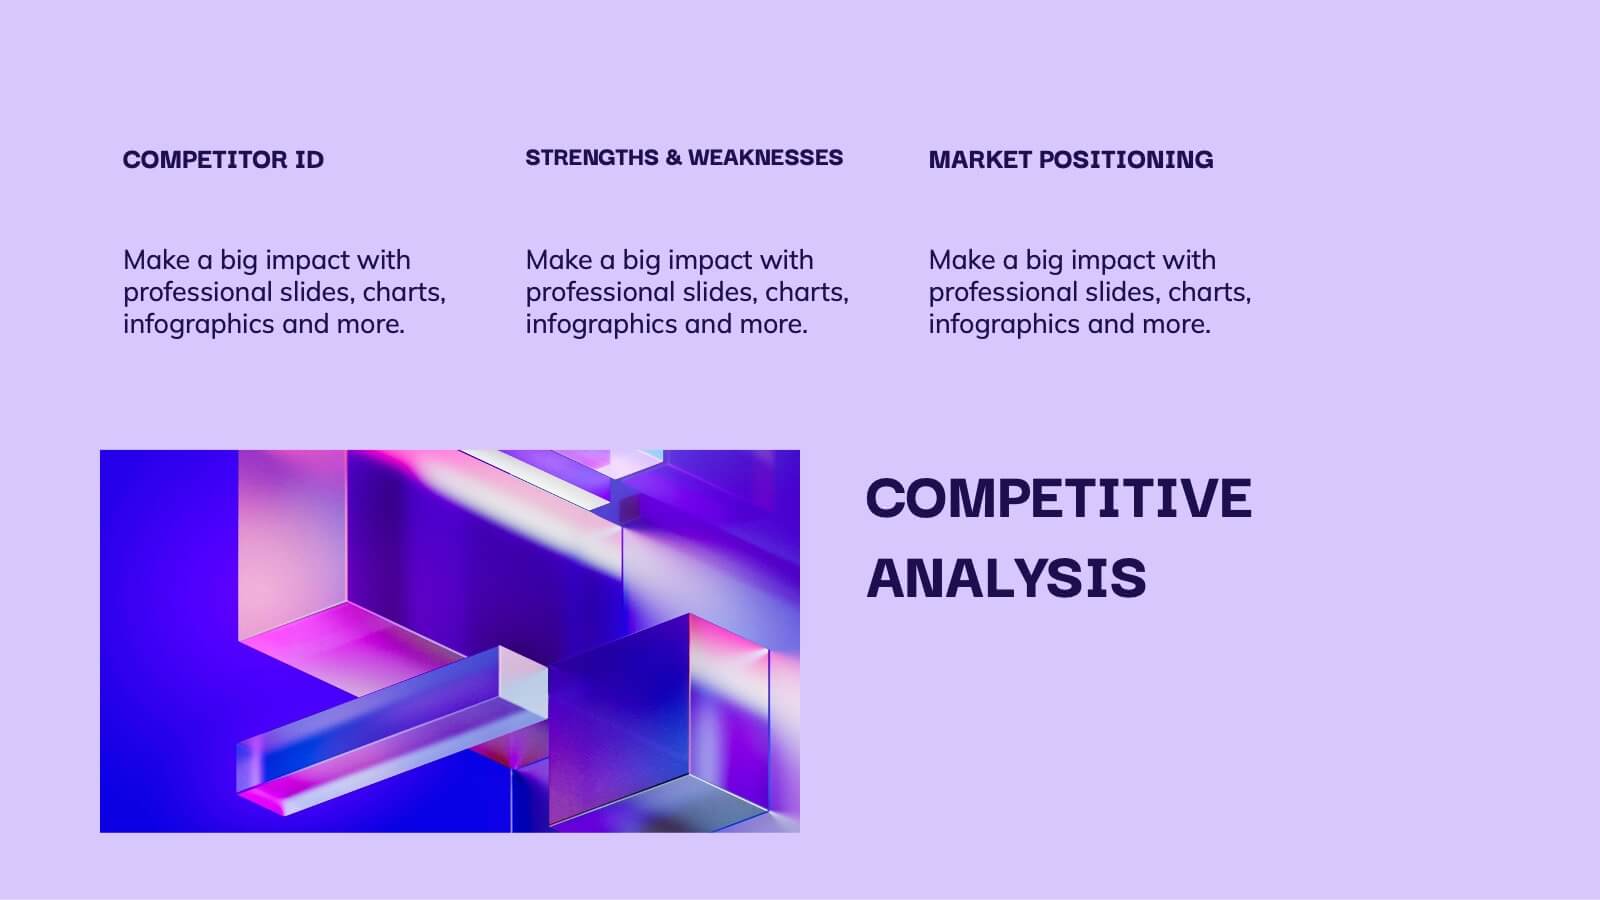
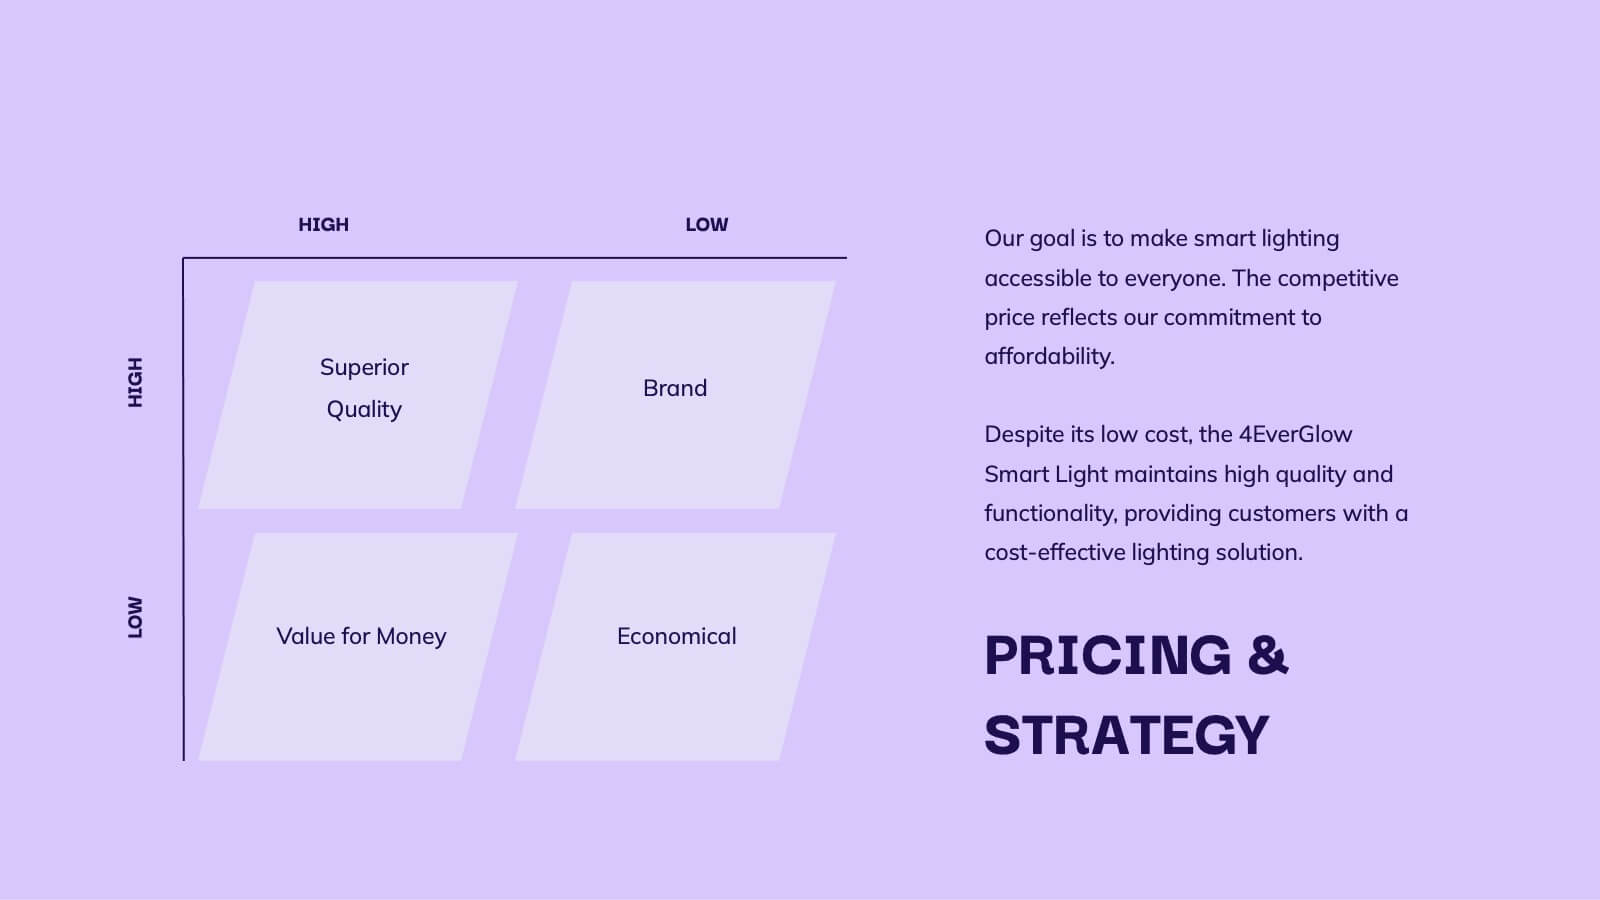
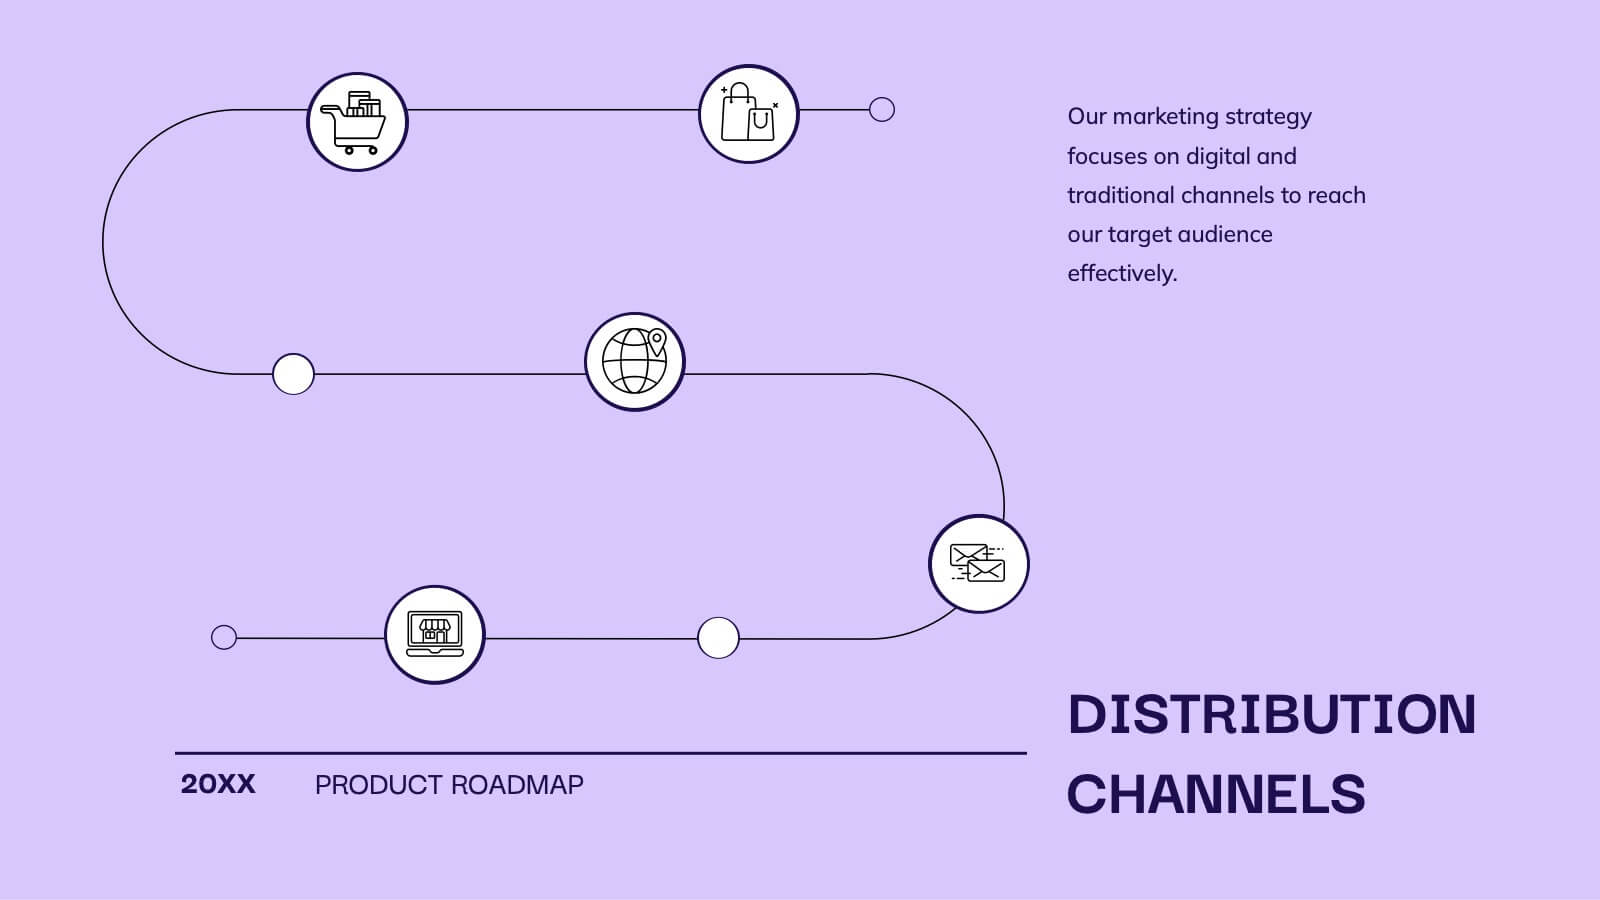
Glimmer Product Roadmap Presentation
Illuminate your product's future with this vibrant glimmer-themed presentation template! Perfect for outlining your product roadmap, it allows you to present key milestones, features, and timelines in a visually engaging way. Captivate your audience and keep them informed about your exciting journey ahead. Compatible with PowerPoint, Keynote, and Google Slides.


22 slides
SEO Report Presentation
Optimize your SEO strategies using our comprehensive SEO Report template. It includes sections for keyword performance, market trends, competitor insights, and client feedback. Tailored for digital marketers and SEO specialists, this template supports presentations in PowerPoint, Keynote, and Google Slides.


6 slides
Insurance Comparison Infographic
Insurance comparison is the process of evaluating and comparing different insurance policies offered by various insurance companies to find the one that best meets your needs and requirements. This infographic template is a visual representation of different types of insurance policies and their key features, designed to help consumers compare and make informed decisions about their insurance needs. This infographic aims to simplify complex insurance information. This can be used on insurance websites, marketing materials, and educational resources to assist consumers in making well-informed insurance choices based on their unique needs and preferences.