


Features
- 20 Unique Slides
- Fully editable and easy to edit in Microsoft Powerpoint, Keynote and Google Slides
- 16:9 widescreen layout
- Clean and professional designs
- Export to JPG, PDF or send by email


Do you have any questions?
Recommend


7 slides
Idea Clustering Mind Map Presentation
Great ideas become clearer when you can see how everything connects, and this presentation makes that process effortless. It helps you organize thoughts, group related concepts, and visually map creative themes for planning or strategy discussions. Clean, modern, and easy to customize. Fully compatible with PowerPoint, Keynote, and Google Slides.


22 slides
Leviathan Sales Pitch Deck Presentation
This sales pitch deck template is designed to captivate your audience with a sleek, modern design. It features key slides like problem statement, solution, business model, and financials, ensuring a comprehensive presentation. Compatible with PowerPoint, Keynote, and Google Slides, it's perfect for showcasing your business's unique value proposition and growth strategy.


21 slides
Trident Product Development Plan Presentation
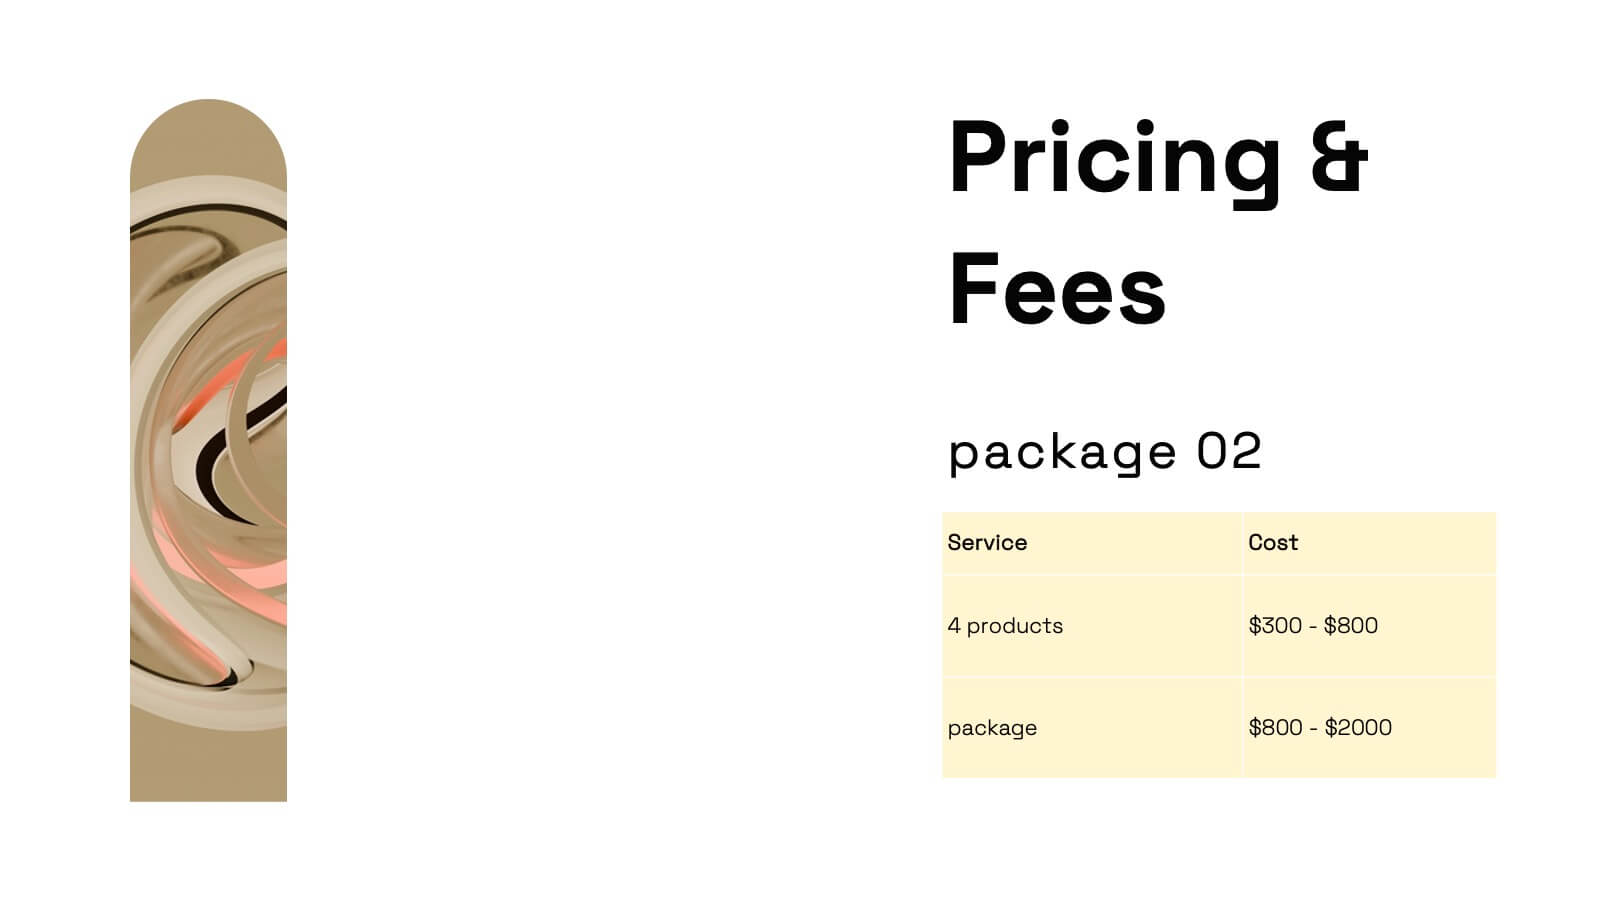
Present your product development strategy with this sleek, professional template! Highlight company overview, product features, and unique selling proposition. Ideal for showcasing market analysis, pricing strategy, and production process. Perfect for developers and project managers. Compatible with PowerPoint, Keynote, and Google Slides.


5 slides
5 Whys Analysis Slide Presentation
Unlock problem-solving clarity with a vibrant, puzzle-style layout that helps teams dig deeper and uncover the true reason behind any challenge. This presentation guides viewers through each “why” step in a simple, structured flow, making root-cause insights easy to communicate. Fully compatible with PowerPoint, Keynote, and Google Slides.


16 slides
SEO Research Analysis Presentation
Designed with meticulous attention to detail, this presentation template offers an extensive overview of SEO Analysis Research, perfect for specialists eager to explore the depths of search engine optimization. The initial slide establishes a solid foundation for comprehensive analysis. Following, the 'About' segment delivers a brief yet informative look at the organization's prowess and experience in the realm of SEO. The 'Our Teamwork' slide introduces the team behind the SEO success, showcasing the individuals and their roles. Moving on to 'Strategy,' the template allows for a detailed exposition of the approach and methodologies applied to enhance online visibility. Key metrics are brought to the forefront in a monthly overview, providing insights into traffic sources, content performance, and keyword rankings. The 'SEO Report' highlights significant analytics, such as searches and sign-up rates, emphasizing the impact of the SEO efforts. Complete the presentation with a cordial 'Thank You' to the audience and a 'Credits' slide for resource attribution, ensuring transparency and professionalism. This template is ideal for delivering powerful insights into SEO practices and outcomes.


4 slides
Timeline of Business Achievements Presentation
Visualize progress with clarity using the Timeline of Business Achievements Presentation. This sleek template features both horizontal and vertical timeline formats to showcase yearly milestones, step-by-step phases, and key tasks. Ideal for project reporting, strategy rollouts, and roadmap updates. Fully editable and compatible with PowerPoint, Keynote, and Google Slides.


20 slides
Fusion Product Roadmap Presentation
Elevate your product roadmap presentations with this sleek and modern template! Perfect for detailing product features, target market, and competitive analysis. Ideal for product managers and teams aiming to align strategy and execution. Compatible with PowerPoint, Keynote, and Google Slides, it’s an essential tool for showcasing your product journey effectively.


20 slides
Wyrmwood Design Proposal Presentation
The Startup Funding Proposal Presentation Template includes 20 sleek and professional slides covering problem statements, solutions, pricing structures, and team expertise. With its modern black-and-white aesthetic, it ensures clarity and impact. Fully editable and compatible with PowerPoint, Keynote, and Google Slides, it's perfect for startups seeking investment opportunities and partnerships.


8 slides
Marketing Plan and Audience Targeting Presentation
Visualize your audience segmentation strategy with the Marketing Plan and Audience Targeting Presentation. This bullseye diagram template highlights three key focus areas, making it ideal for showcasing market research, targeting tactics, or funnel stages. Fully editable in Canva, PowerPoint, Keynote, and Google Slides to match your branding and goals.


5 slides
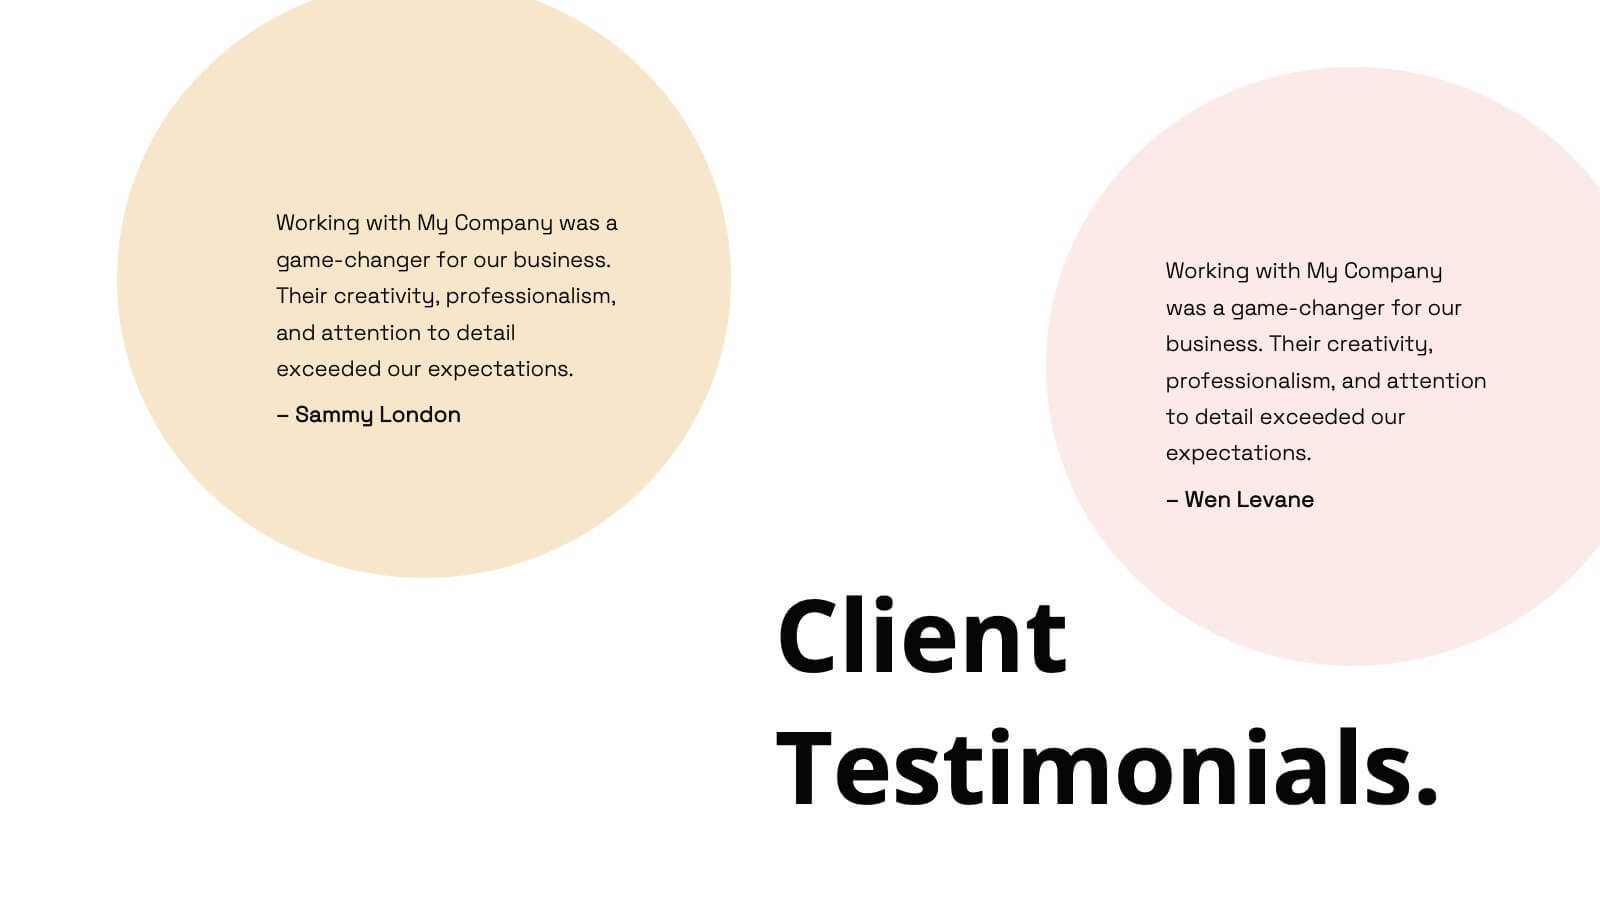
Customer Feedback and Review Presentation
Showcase customer feedback trends with the Customer Feedback and Review infographic. Featuring a dynamic timeline with emotion-based ratings, this template helps visualize satisfaction levels, key insights, and areas for improvement. Fully customizable and compatible with PowerPoint, Keynote, and Google Slides.


5 slides
5-Stage Growth Plan Presentation
Take your audience on a visual journey through each phase of success with this sleek step-by-step presentation. Designed to illustrate progress, milestones, and development stages clearly, it’s ideal for business planning or strategy discussions. Fully editable and compatible with PowerPoint, Keynote, and Google Slides for effortless customization.


5 slides
Employee Onboarding HR Presentation
Start your presentation with energy and clarity using this clean, engaging slide designed to simplify every step of the onboarding journey. It helps explain employee integration, training stages, and team alignment in a way that feels intuitive and visually organized. Fully compatible with PowerPoint, Keynote, and Google Slides.


21 slides
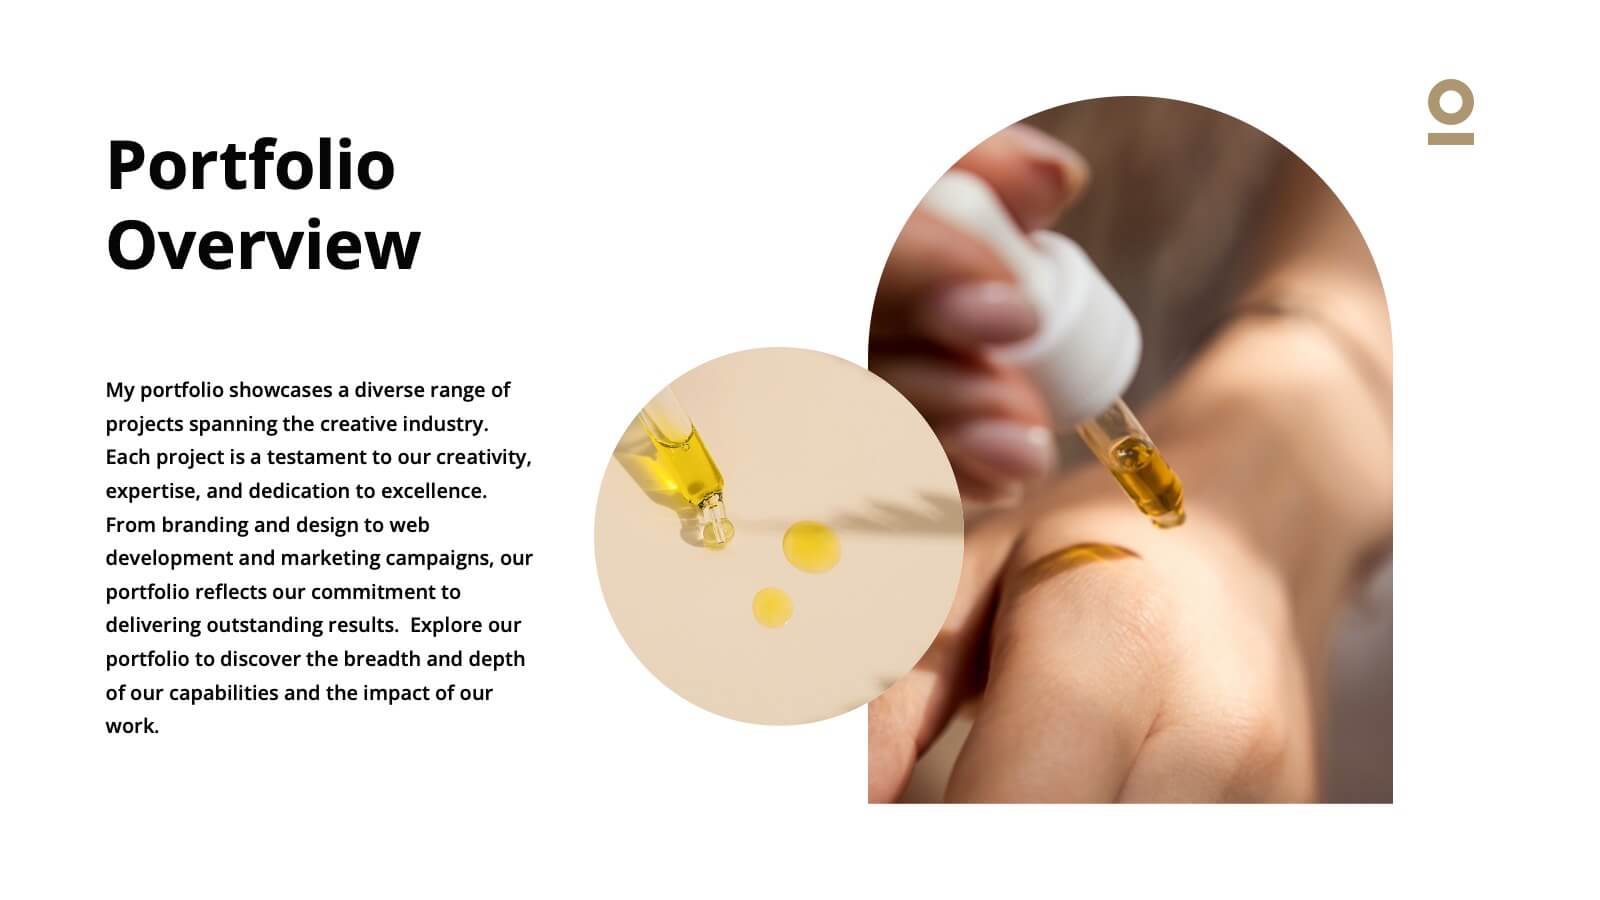
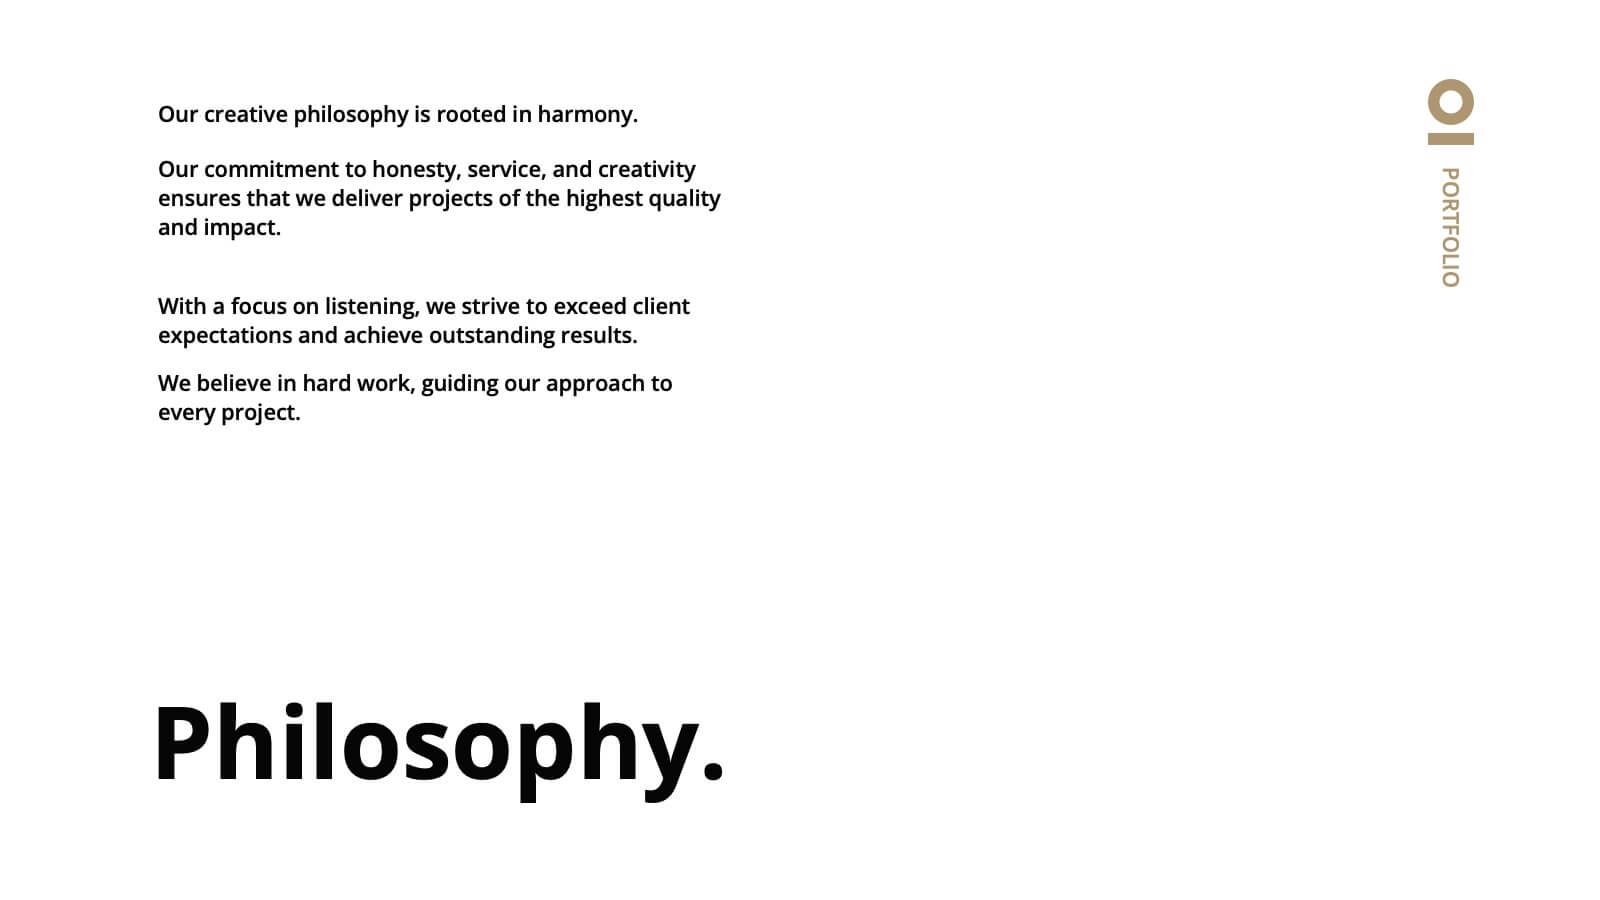
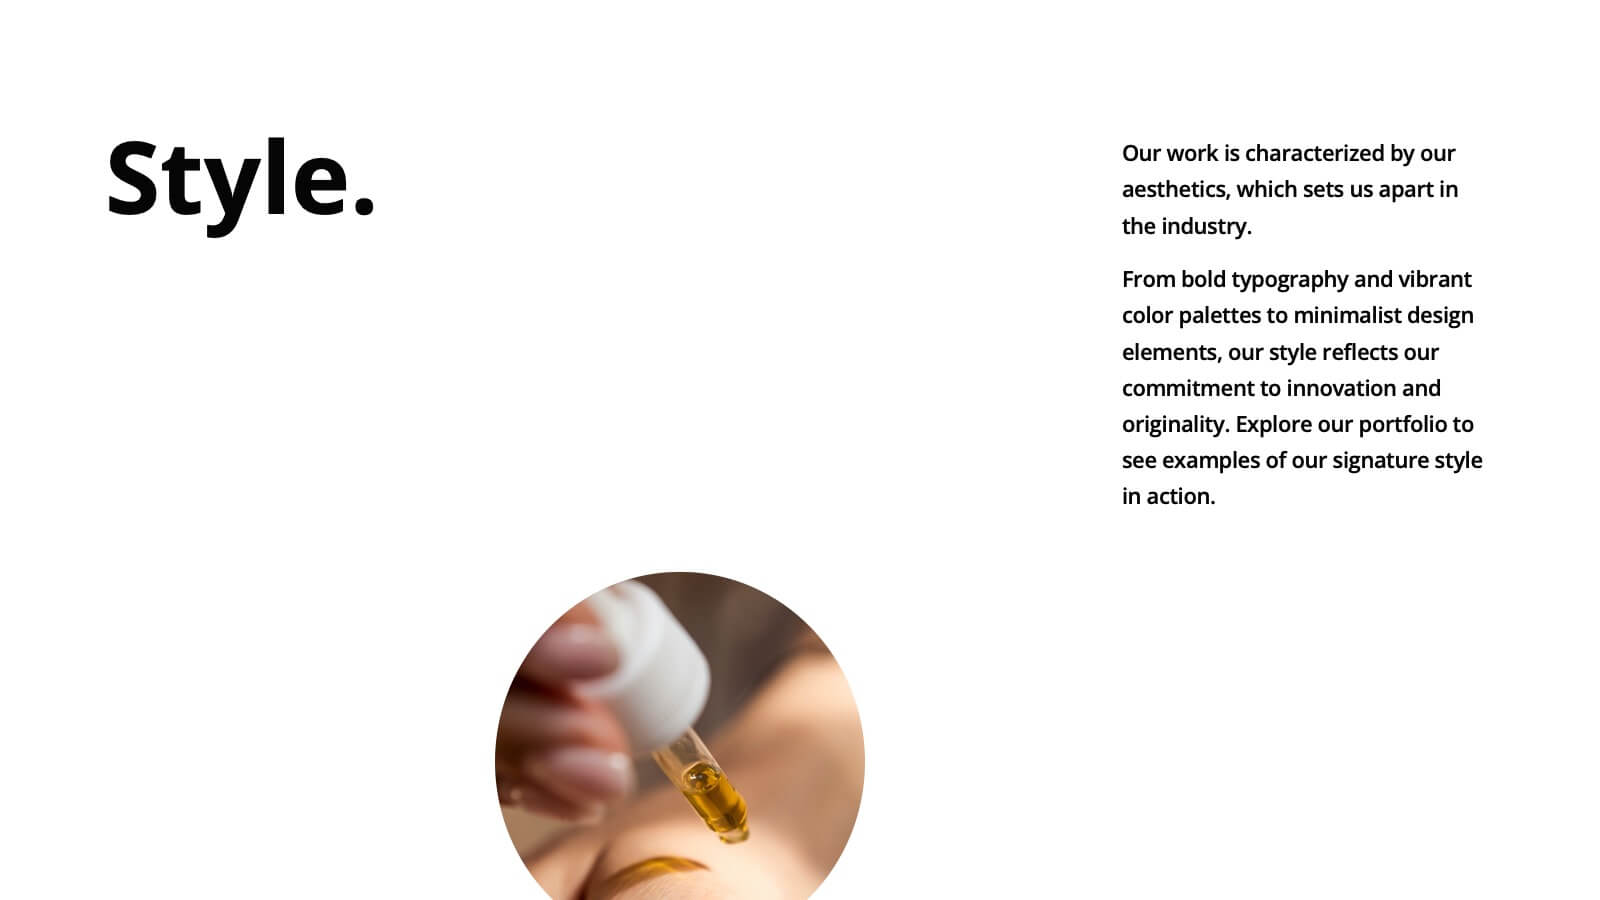
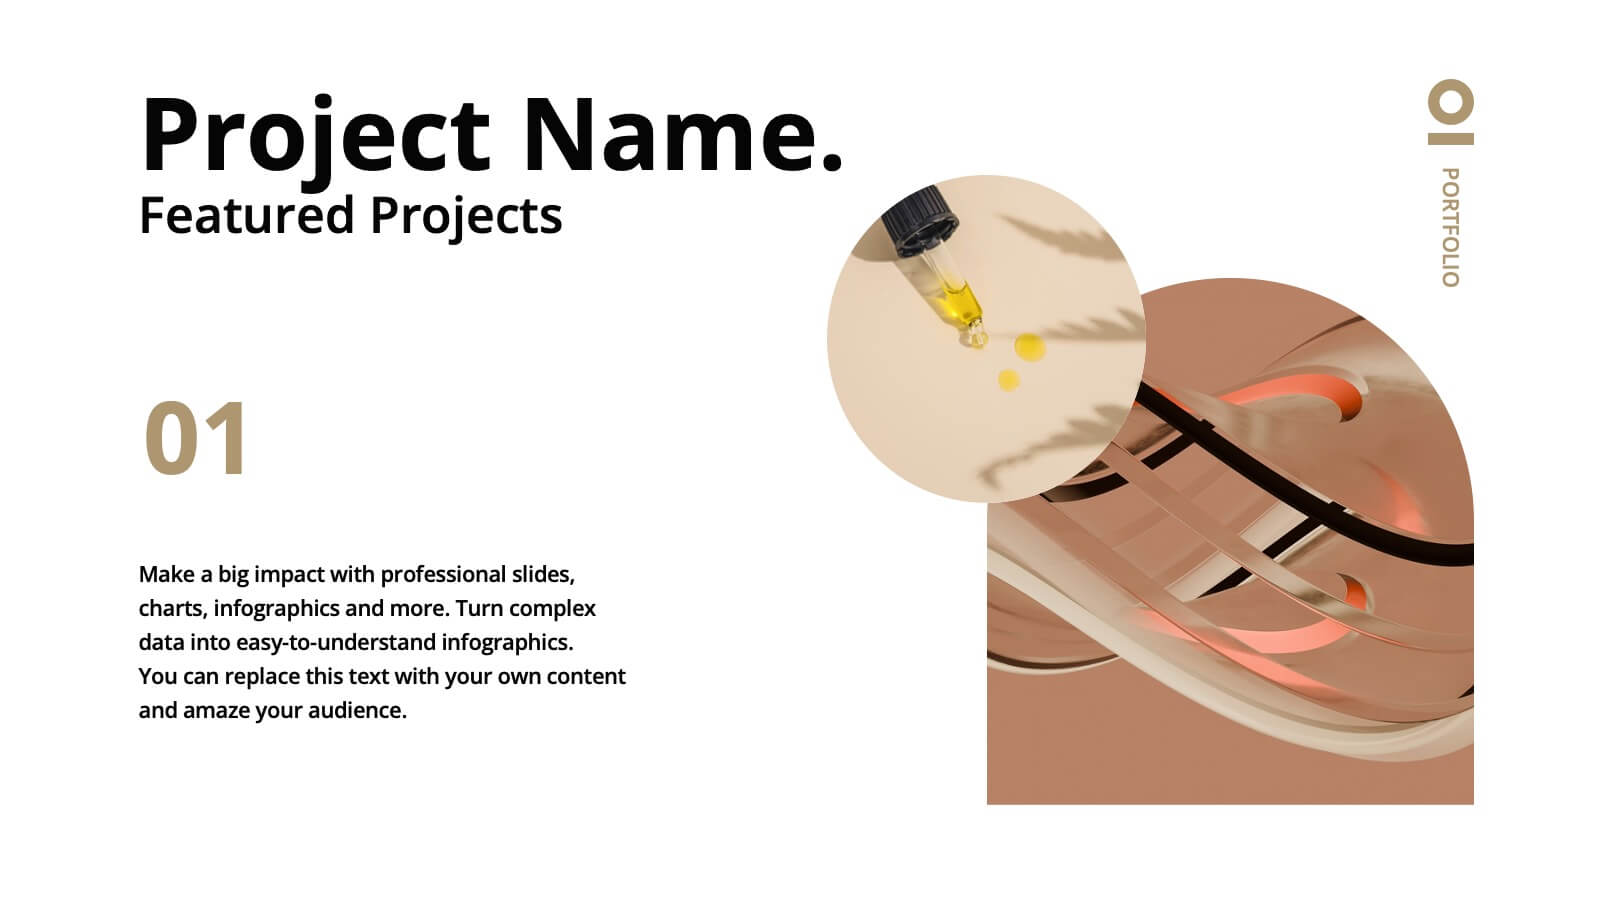
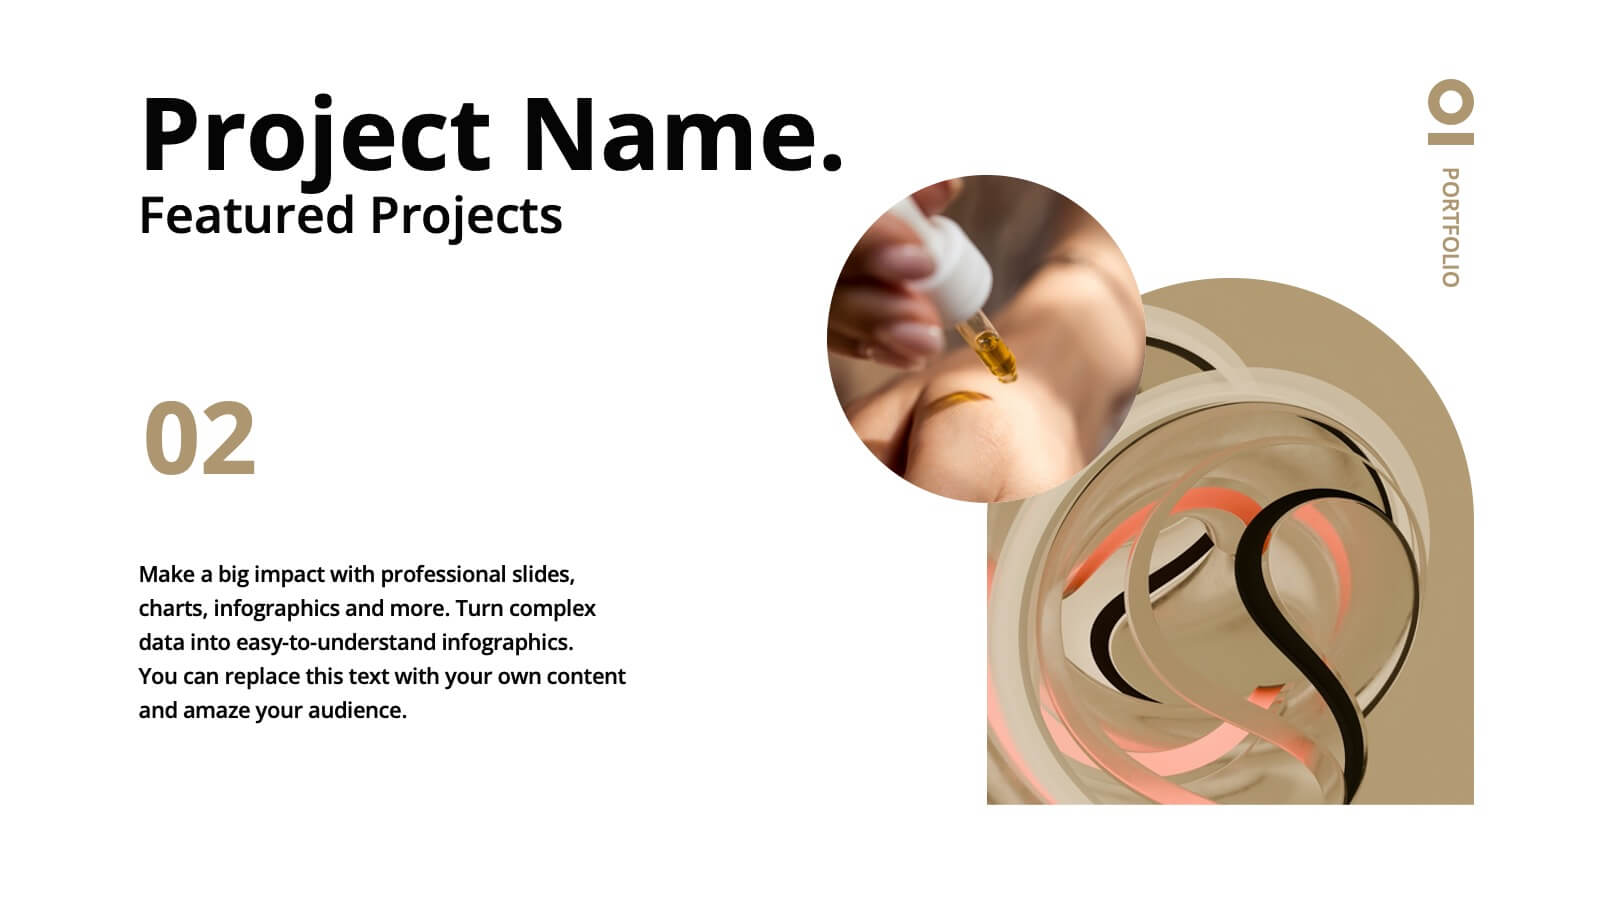
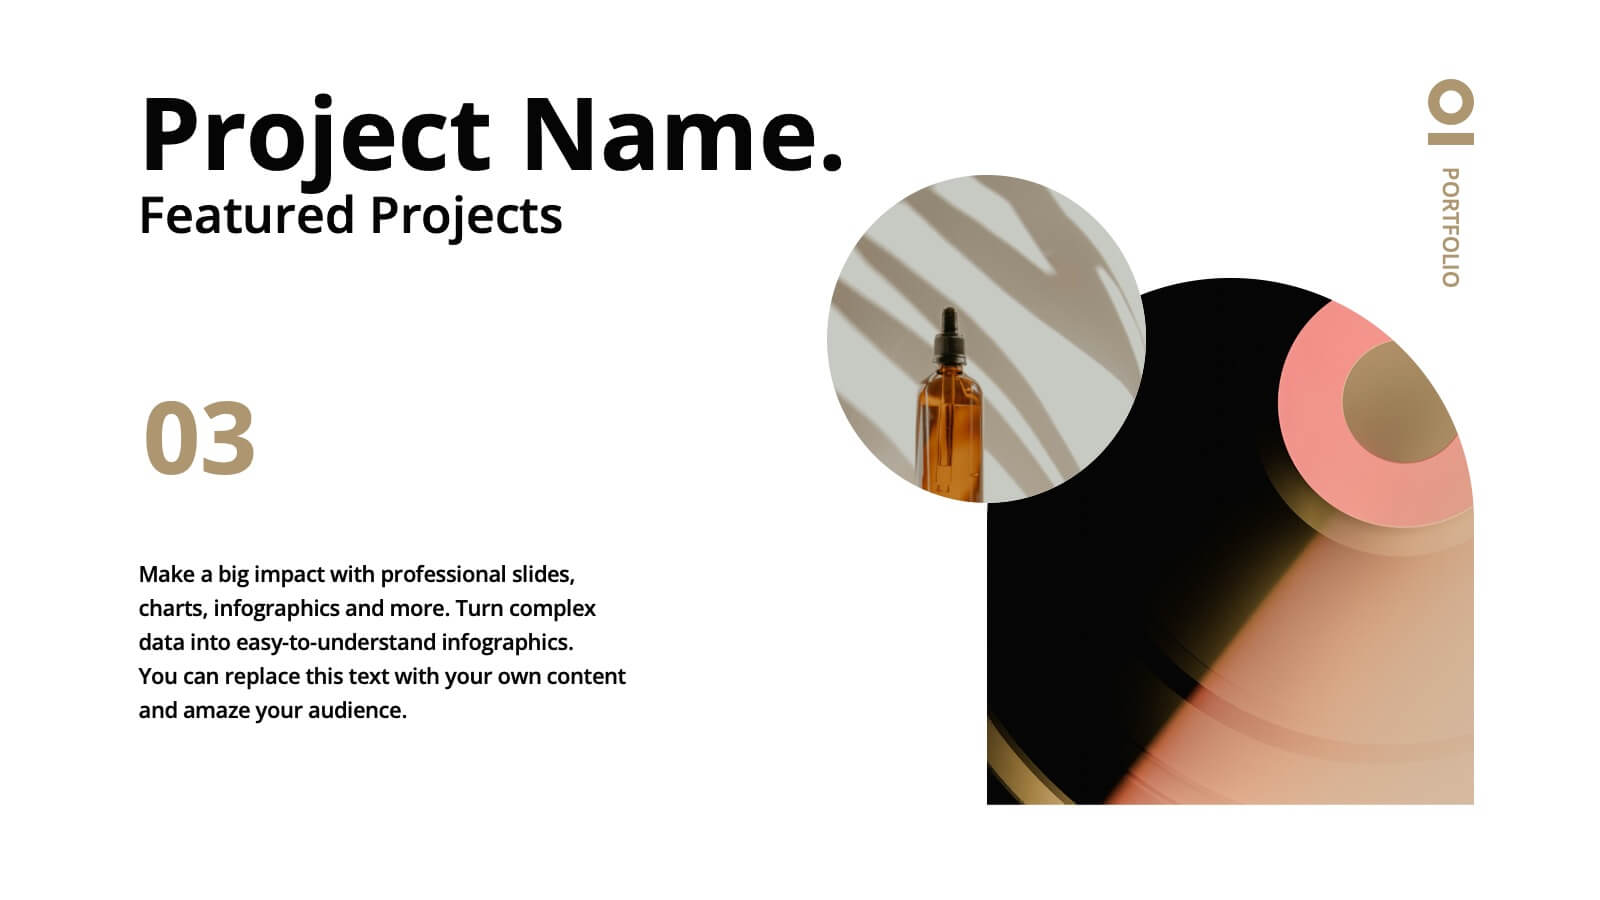
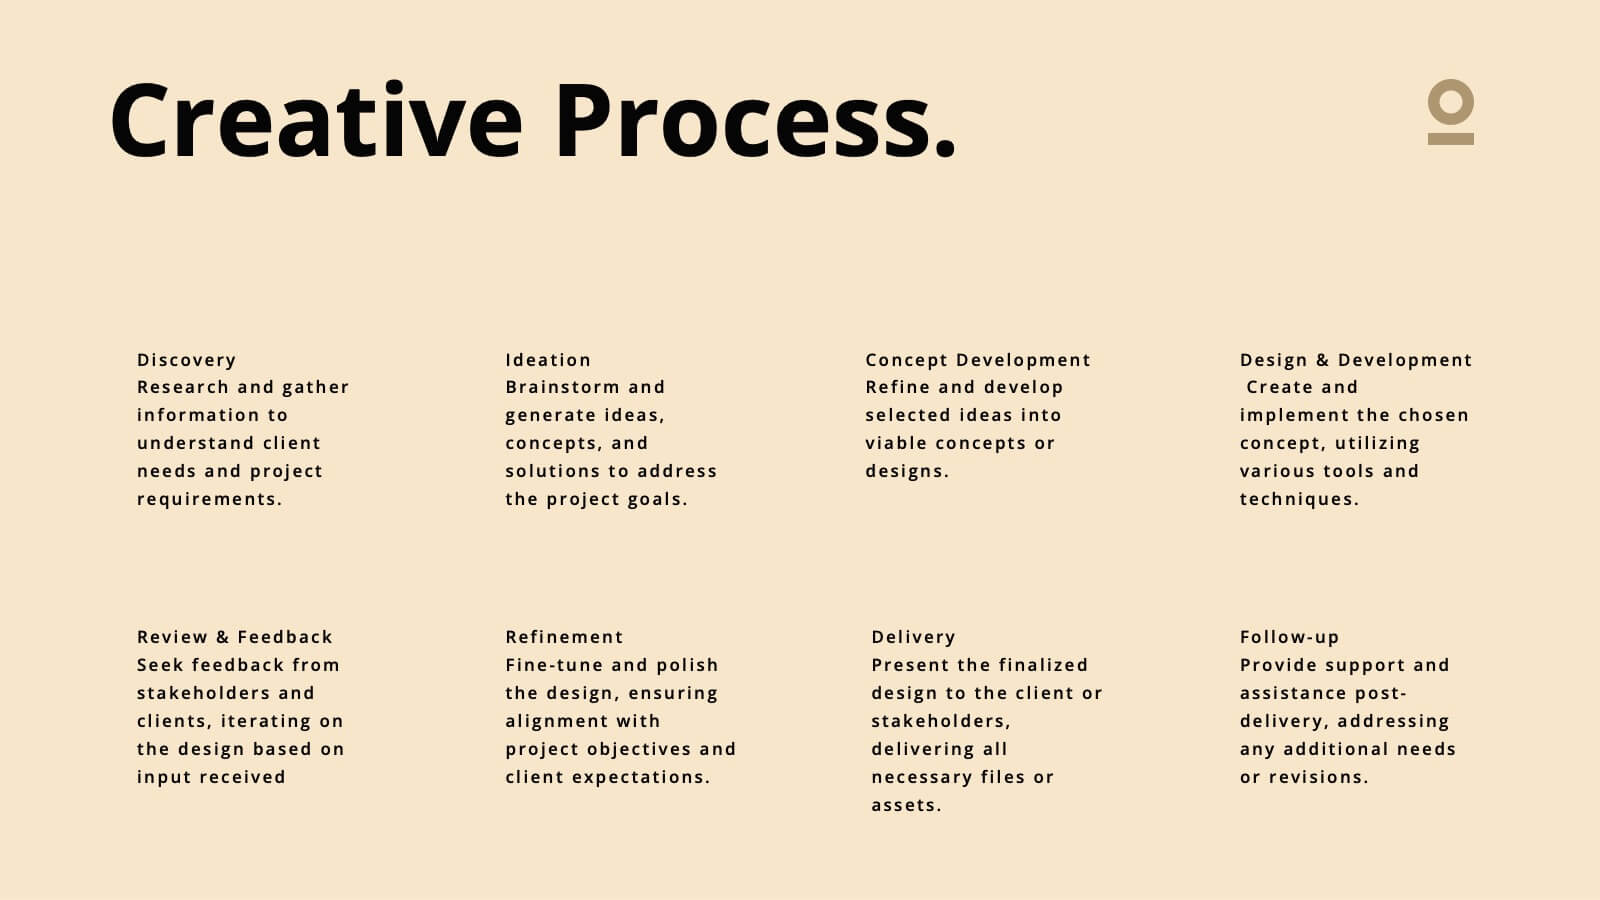
Haze Professional Portfolio Showcase Presentation
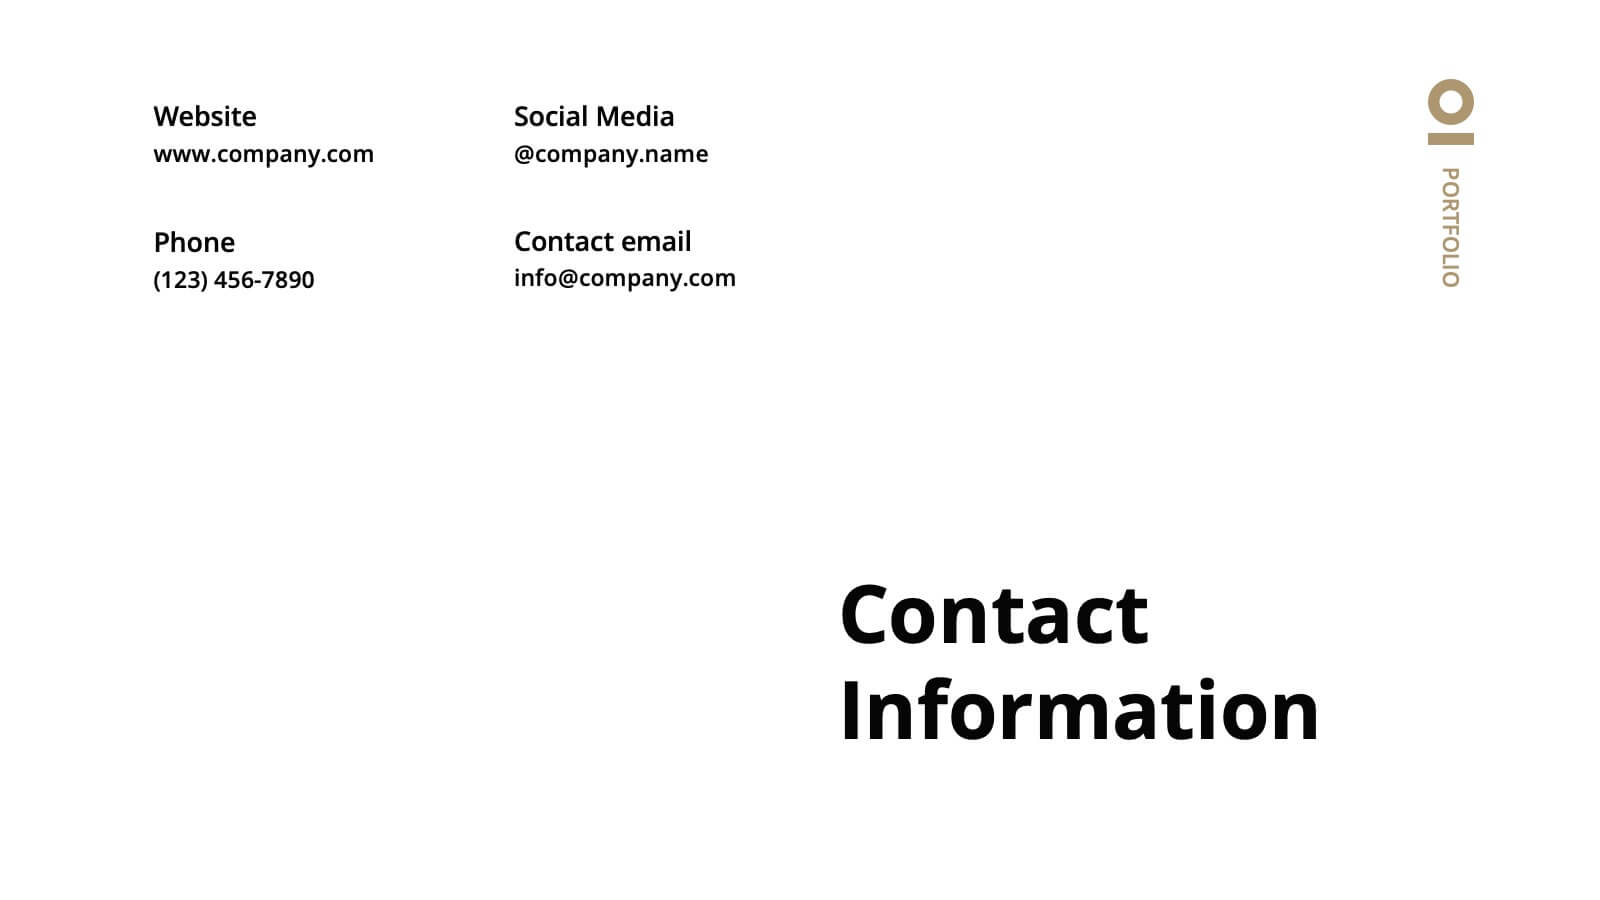
Elevate your professional presence with this stunning haze-inspired presentation template! Ideal for showcasing your portfolio, it beautifully highlights your skills, projects, and achievements with a clean and sophisticated design. This template ensures your work stands out, captivating potential clients and employers. Compatible with PowerPoint, Keynote, and Google Slides.
5 slides
Feedback Rating Smile Icons Presentation
Light up your presentation with a playful visual that turns audience feedback into clear, colorful insights. This slide helps you compare ratings, highlight sentiment patterns, and present review data in a friendly, memorable way. Perfect for surveys, reports, and performance reviews. Fully compatible with PowerPoint, Keynote, and Google Slides.

20 slides
Saturn Business Plan Presentation
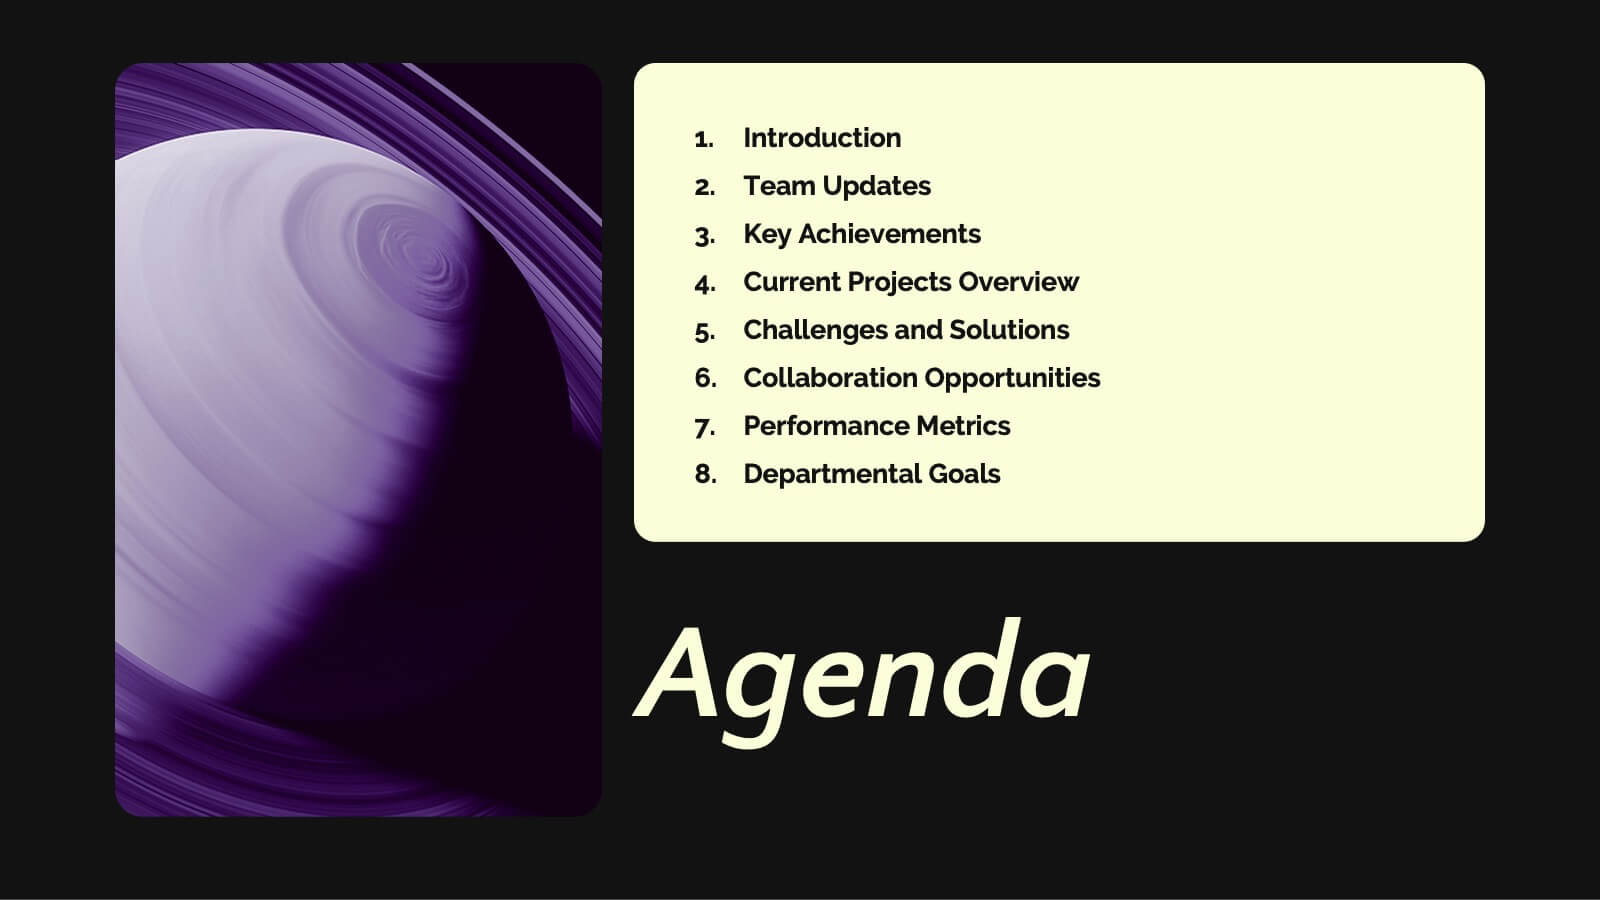
Embark on a journey to present your business plan like never before with this stellar presentation template! Perfect for diving deep into key updates, achievements, collaborations, and future goals, it guides your team through essential business strategies and challenges. Compatible with PowerPoint, Keynote, and Google Slides, it offers seamless flexibility and polished professionalism.


26 slides
Nahla Presentation Template
Brand guidelines are the set of rules that define the overall look and feel of your brand. They allow you to build a brand identity. A brand style guide is the ultimate resource for communicating your brand’s identity to everyone on your team. Use the Nahla template to help define your company's branding the correct way. This is a highly customizable, responsive template. Create a unique ambience that your customers and audience can recognize across all platforms. Nahla provides a platform for the design team to help shape the direction of your brand, while ensuring consistency.


2 slides
Modern Business Cover Slide Presentation
Stand out with this bold and contemporary cover slide. The layout features dynamic geometric shapes and an integrated photo section, perfect for making a memorable first impression. Whether you're presenting to clients or stakeholders, this slide combines style and structure to deliver your brand message clearly. Fully customizable and easy to edit in PowerPoint, Keynote, and Google Slides.