


Features
- 6 Unique slides
- Fully editable and easy to edit in Microsoft Powerpoint, Keynote and Google Slides
- 16:9 widescreen layout
- Clean and professional designs
- Export to JPG, PDF or send by email


Do you have any questions?
Recommend


7 slides
Business Strategy Plan Infographic
A Business Strategy Infographic shows you how to create a business plan that will help you achieve your goals. This infographic is designed to help you understand how your company and competitors are going to win in the marketplace by showing how all of their moves fit together. This template is a beautiful combination of data visualization, charts, and graphics to help you see what's going on in your business. This is the perfect tool for anyone who wants to understand the current state of their operations and make informed decisions about how to move forward. Fully customizable and compatible with Powerpoint, Keynote, and Google Slides.


3 slides
Linear Business Process Flow Presentation
Give your workflow a smooth, streamlined story with a layout that makes every step feel clear and intentional. This presentation outlines processes in a clean, linear format ideal for planning, operations, or strategy mapping. Fully compatible with PowerPoint, Keynote, and Google Slides.


5 slides
Dynamic Pricing Strategies
Make pricing strategy look smart and data-driven with this bold, modern infographic template. Designed to explain how pricing evolves with demand, value, and profit margins, this slide visually guides viewers through key steps in your dynamic pricing model. Fully editable and compatible with PowerPoint, Keynote, and Google Slides for seamless use.


10 slides
Business Scaling Strategy Presentation
Achieve rapid growth with the Business Scaling Strategy Diagram. This professional template helps you visualize key steps, strategic phases, and milestones for scaling a business effectively. Designed for entrepreneurs, executives, and consultants, this slide ensures a clear and structured presentation of your expansion strategy. Fully customizable and compatible with PowerPoint, Keynote, and Google Slides.


7 slides
World Map Weather Infographic
A world weather map is a graphical representation that displays current weather conditions and forecasts across different regions of the world. Unveil the world's atmospheric tapestry with our world map weather infographic template. This visually stunning and informative infographic is your passport to understanding global weather patterns, giving you a clear view of climate diversity and trends across continents. This template is designed to provide an overview of various meteorological parameters, including temperature, precipitation, wind speed and direction, humidity, and atmospheric pressure.


5 slides
Visual Gap Analysis Between Goals and Results Presentation
Hit the bullseye by clearly showing the gap between what was planned and what was achieved. This sleek, target-based presentation design helps visualize discrepancies between goals and results in a way that's easy to grasp and great for decision-making. Fully compatible with PowerPoint, Keynote, and Google Slides.


6 slides
User Satisfaction Scoring System
Showcase user feedback with this vibrant User Satisfaction Scoring System Presentation. Featuring a semi-circle scale with expressive icons, it's perfect for visualizing survey results or customer experience insights. Fully editable in PowerPoint, Keynote, and Google Slides, this slide helps simplify scoring metrics while keeping your presentation clear, engaging, and professional


6 slides
Engaging Opening Introduction
Start strong with this visually engaging slide layout, perfect for setting the tone in professional meetings or pitches. Highlight key themes or concepts alongside image placeholders that bring your message to life. Fully customizable in PowerPoint, Keynote, and Google Slides.


7 slides
Demographic Infographic Presentation Template
Are you looking for a fun way to engage your audience? This PowerPoint presentation is a great tool for educating individuals on demographic status. This data visualization template is perfect for presentations and marketing materials, allowing you to quickly communicate key demographic details with the help of charts and tables. Use this template to create a visual presentation that highlights the demographic characteristics of your target audience. This template features a colorful design, which provides plenty of space for you to include key facts, figures and conclusions.


5 slides
Porter's Five Forces Market Analysis
Visualize competitive dynamics with this clear, easy-to-follow Porter’s Five Forces slide. Each force—Buyer Power, Supplier Power, Competitive Rivalry, Threat of Substitution, and Threat of New Entry—is color-coded and icon-labeled for quick reference. Perfect for strategy meetings, SWOT comparisons, or investment pitches. Editable in PowerPoint, Keynote, and Google Slides.


2 slides
Professional Introduction Slide Presentation
Make a lasting first impression with this Professional Introduction Slide. Designed for business presentations, personal branding, and team introductions, this modern layout features bold shapes, a photo placeholder, and space for key details. Ideal for PowerPoint, Keynote, and Google Slides, this fully editable template lets you customize colors, text, and images to match your brand identity.


5 slides
SEO Strategies Infographics
Immerse yourself in the dynamic world of digital marketing with our SEO strategies infographics. Rendered in bold black, vibrant orange, and various eye-catching colors, this creative and vertical template serves as a beacon for marketing professionals, digital strategists, and entrepreneurs who aim to conquer the digital space. Each element, from engaging graphics to interpretative icons, is specifically tailored to present SEO methodologies with clarity and charisma. This infographic template is not only a visual treat but a reservoir of insights, facilitating users to communicate influential SEO tactics effectively and drive their brand's online visibility forward.


7 slides
Roadmap Guide Infographic
A roadmap guide is a visual representation of the steps you need to take in order to reach your destination. A roadmap infographic is a great way to show your clients what the future will look like. Use this template to create an infographic that's high-energy, enthusiastic, and engaging. This infographic is designed to help guide you by showing where you are now, what direction you're going, and where you need to go next. This template is fully customizable and compatible with Powerpoint, Keynote, and Google Slides. Break down complex plans into easily digestible visual elements.


20 slides
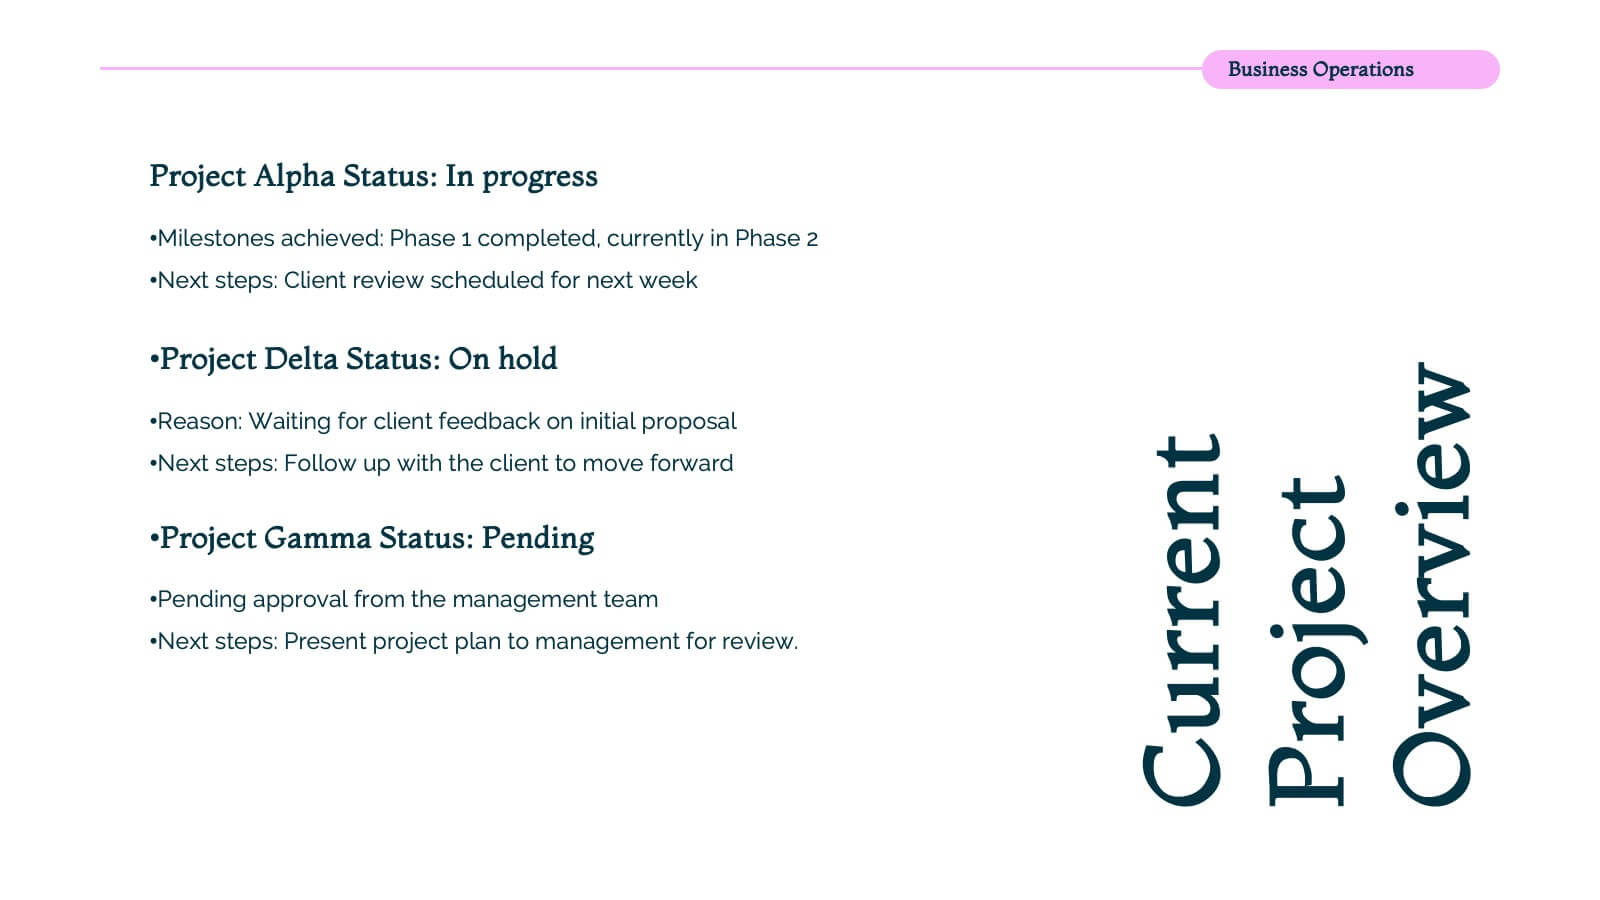
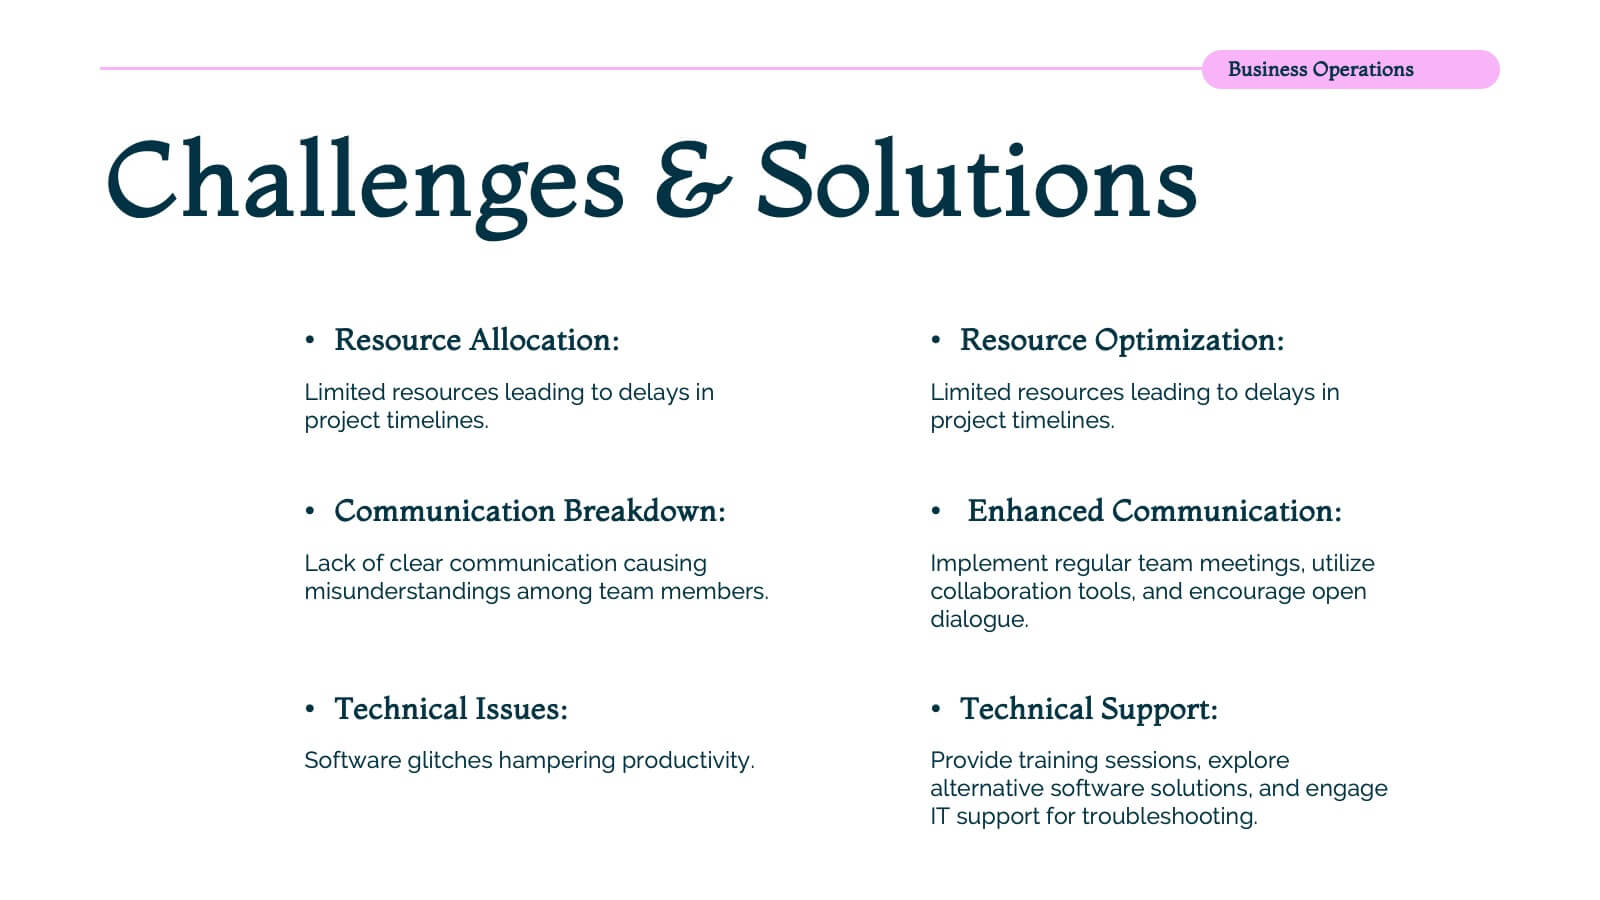
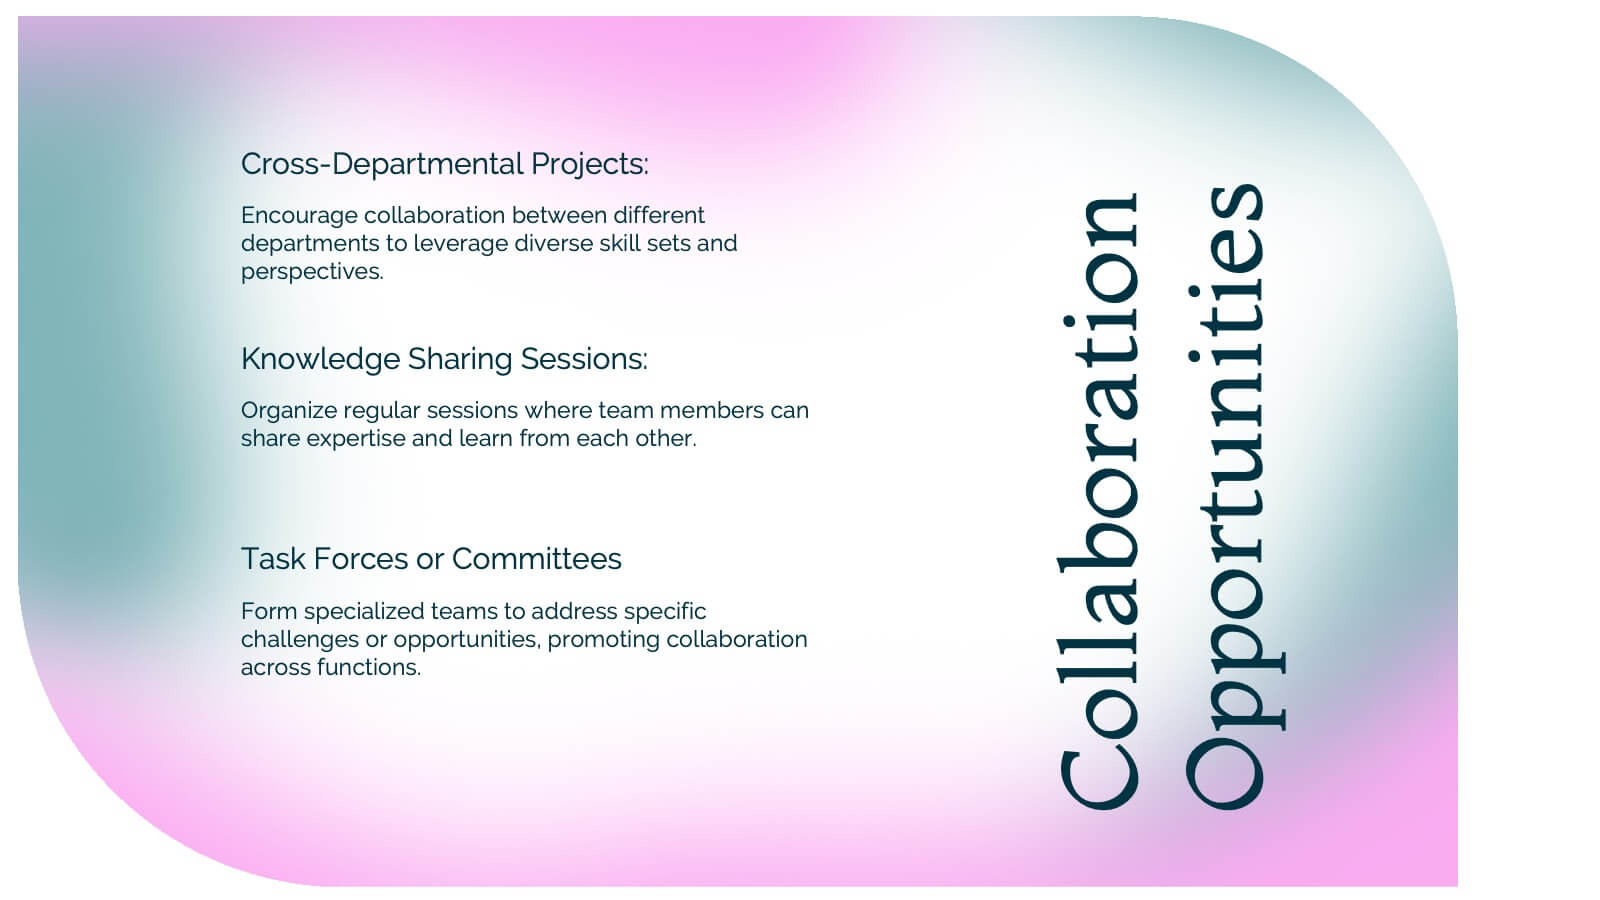
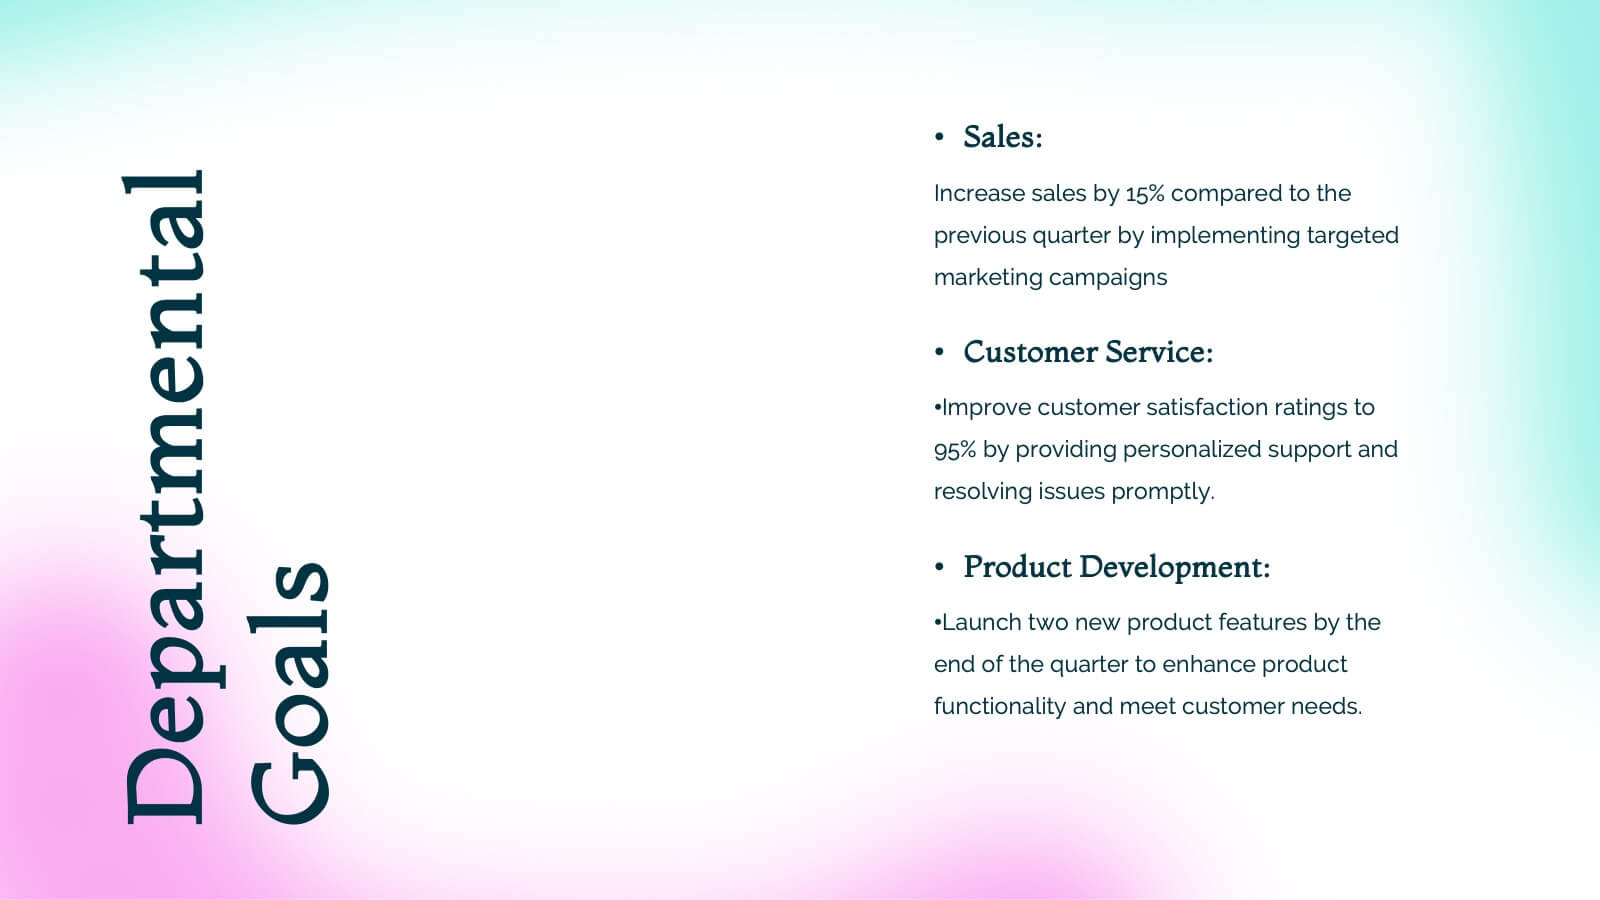
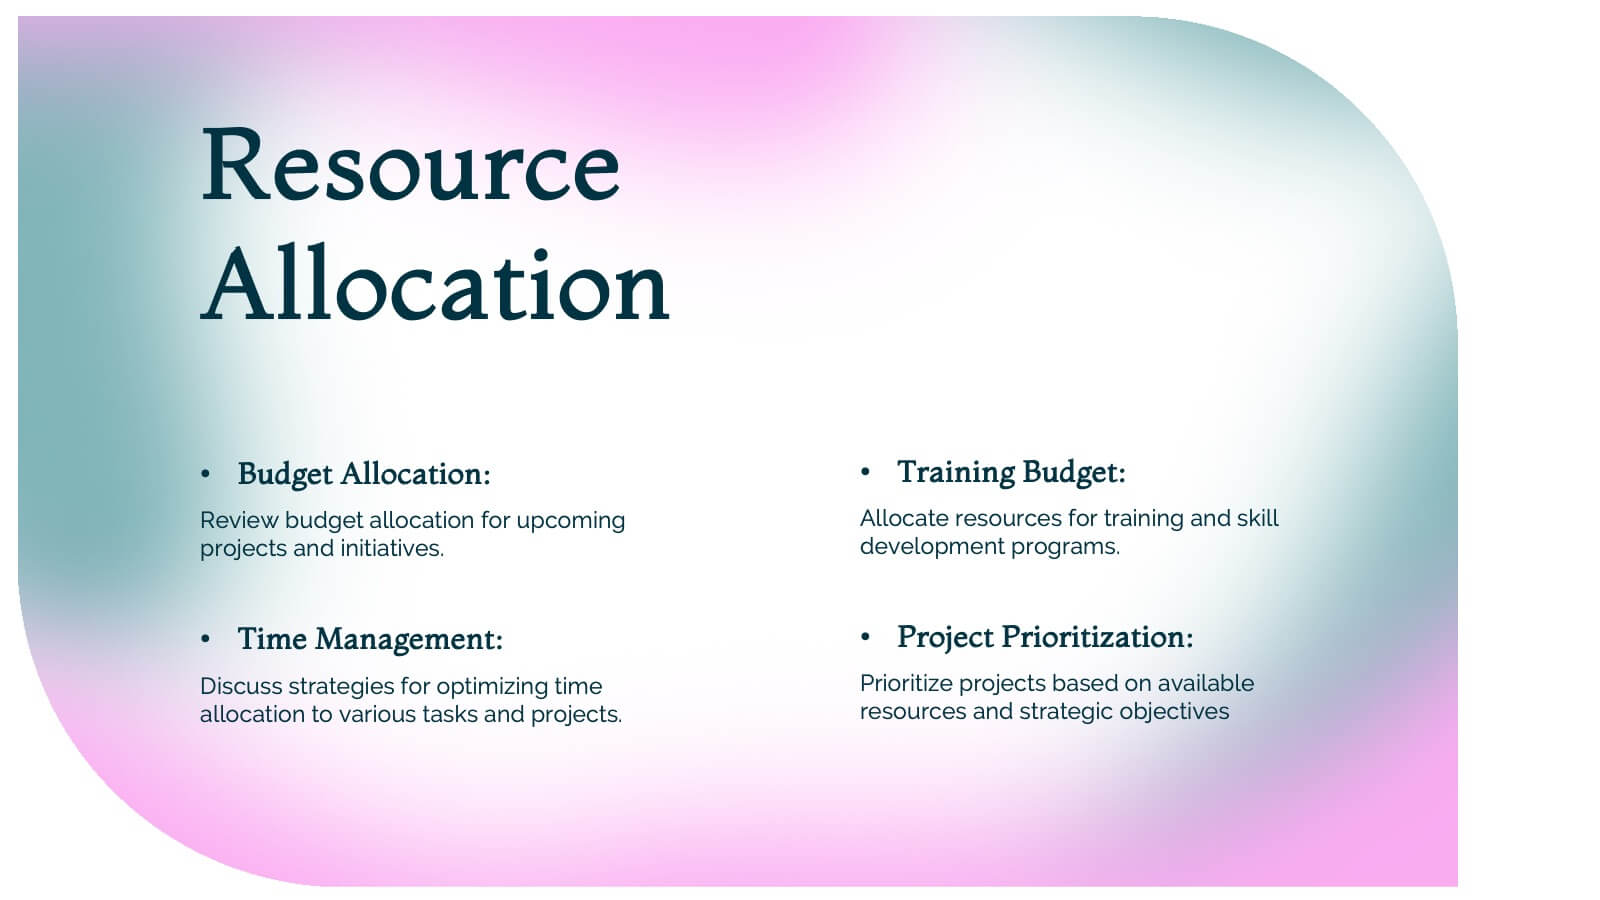
Nova Business Operations Plan Presentation
Create a polished business operations plan with this modern and organized template! It covers everything from team updates and project overviews to resource allocation and collaboration opportunities. Perfect for structuring departmental goals, process improvements, and employee recognition. Compatible with PowerPoint, Keynote, and Google Slides for a seamless, professional presentation.


21 slides
Journey Annual Report Presentation
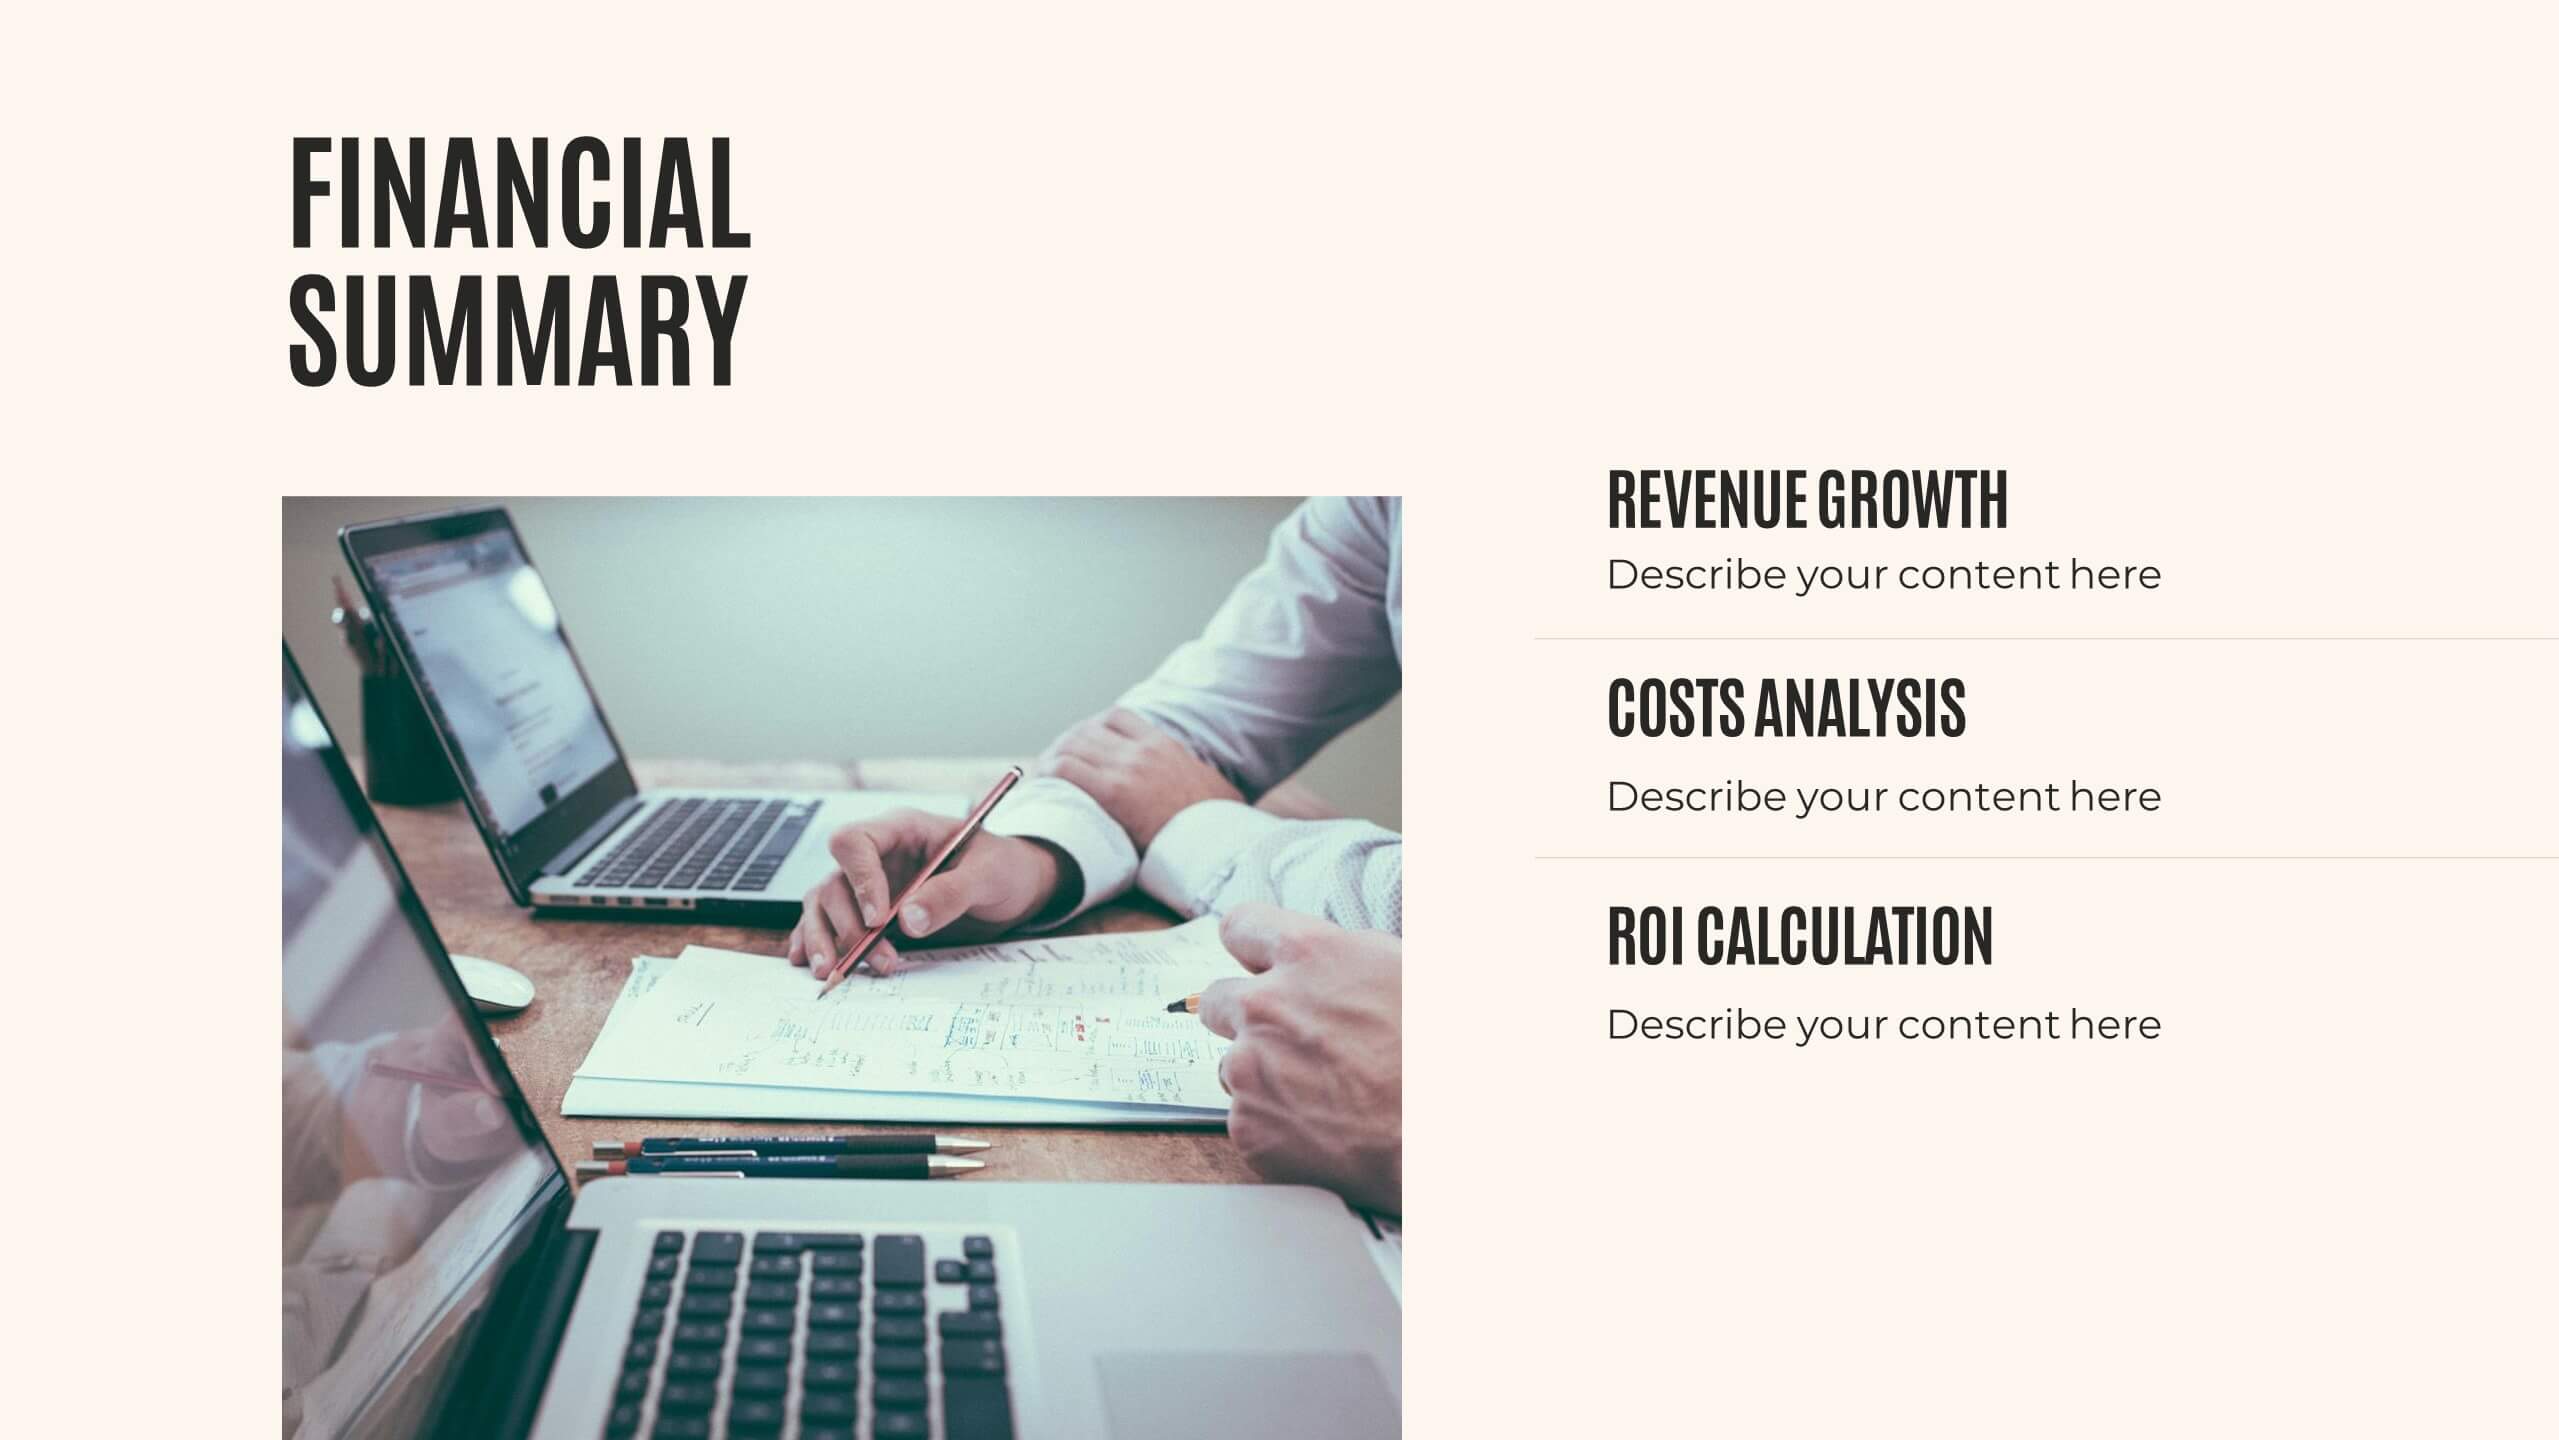
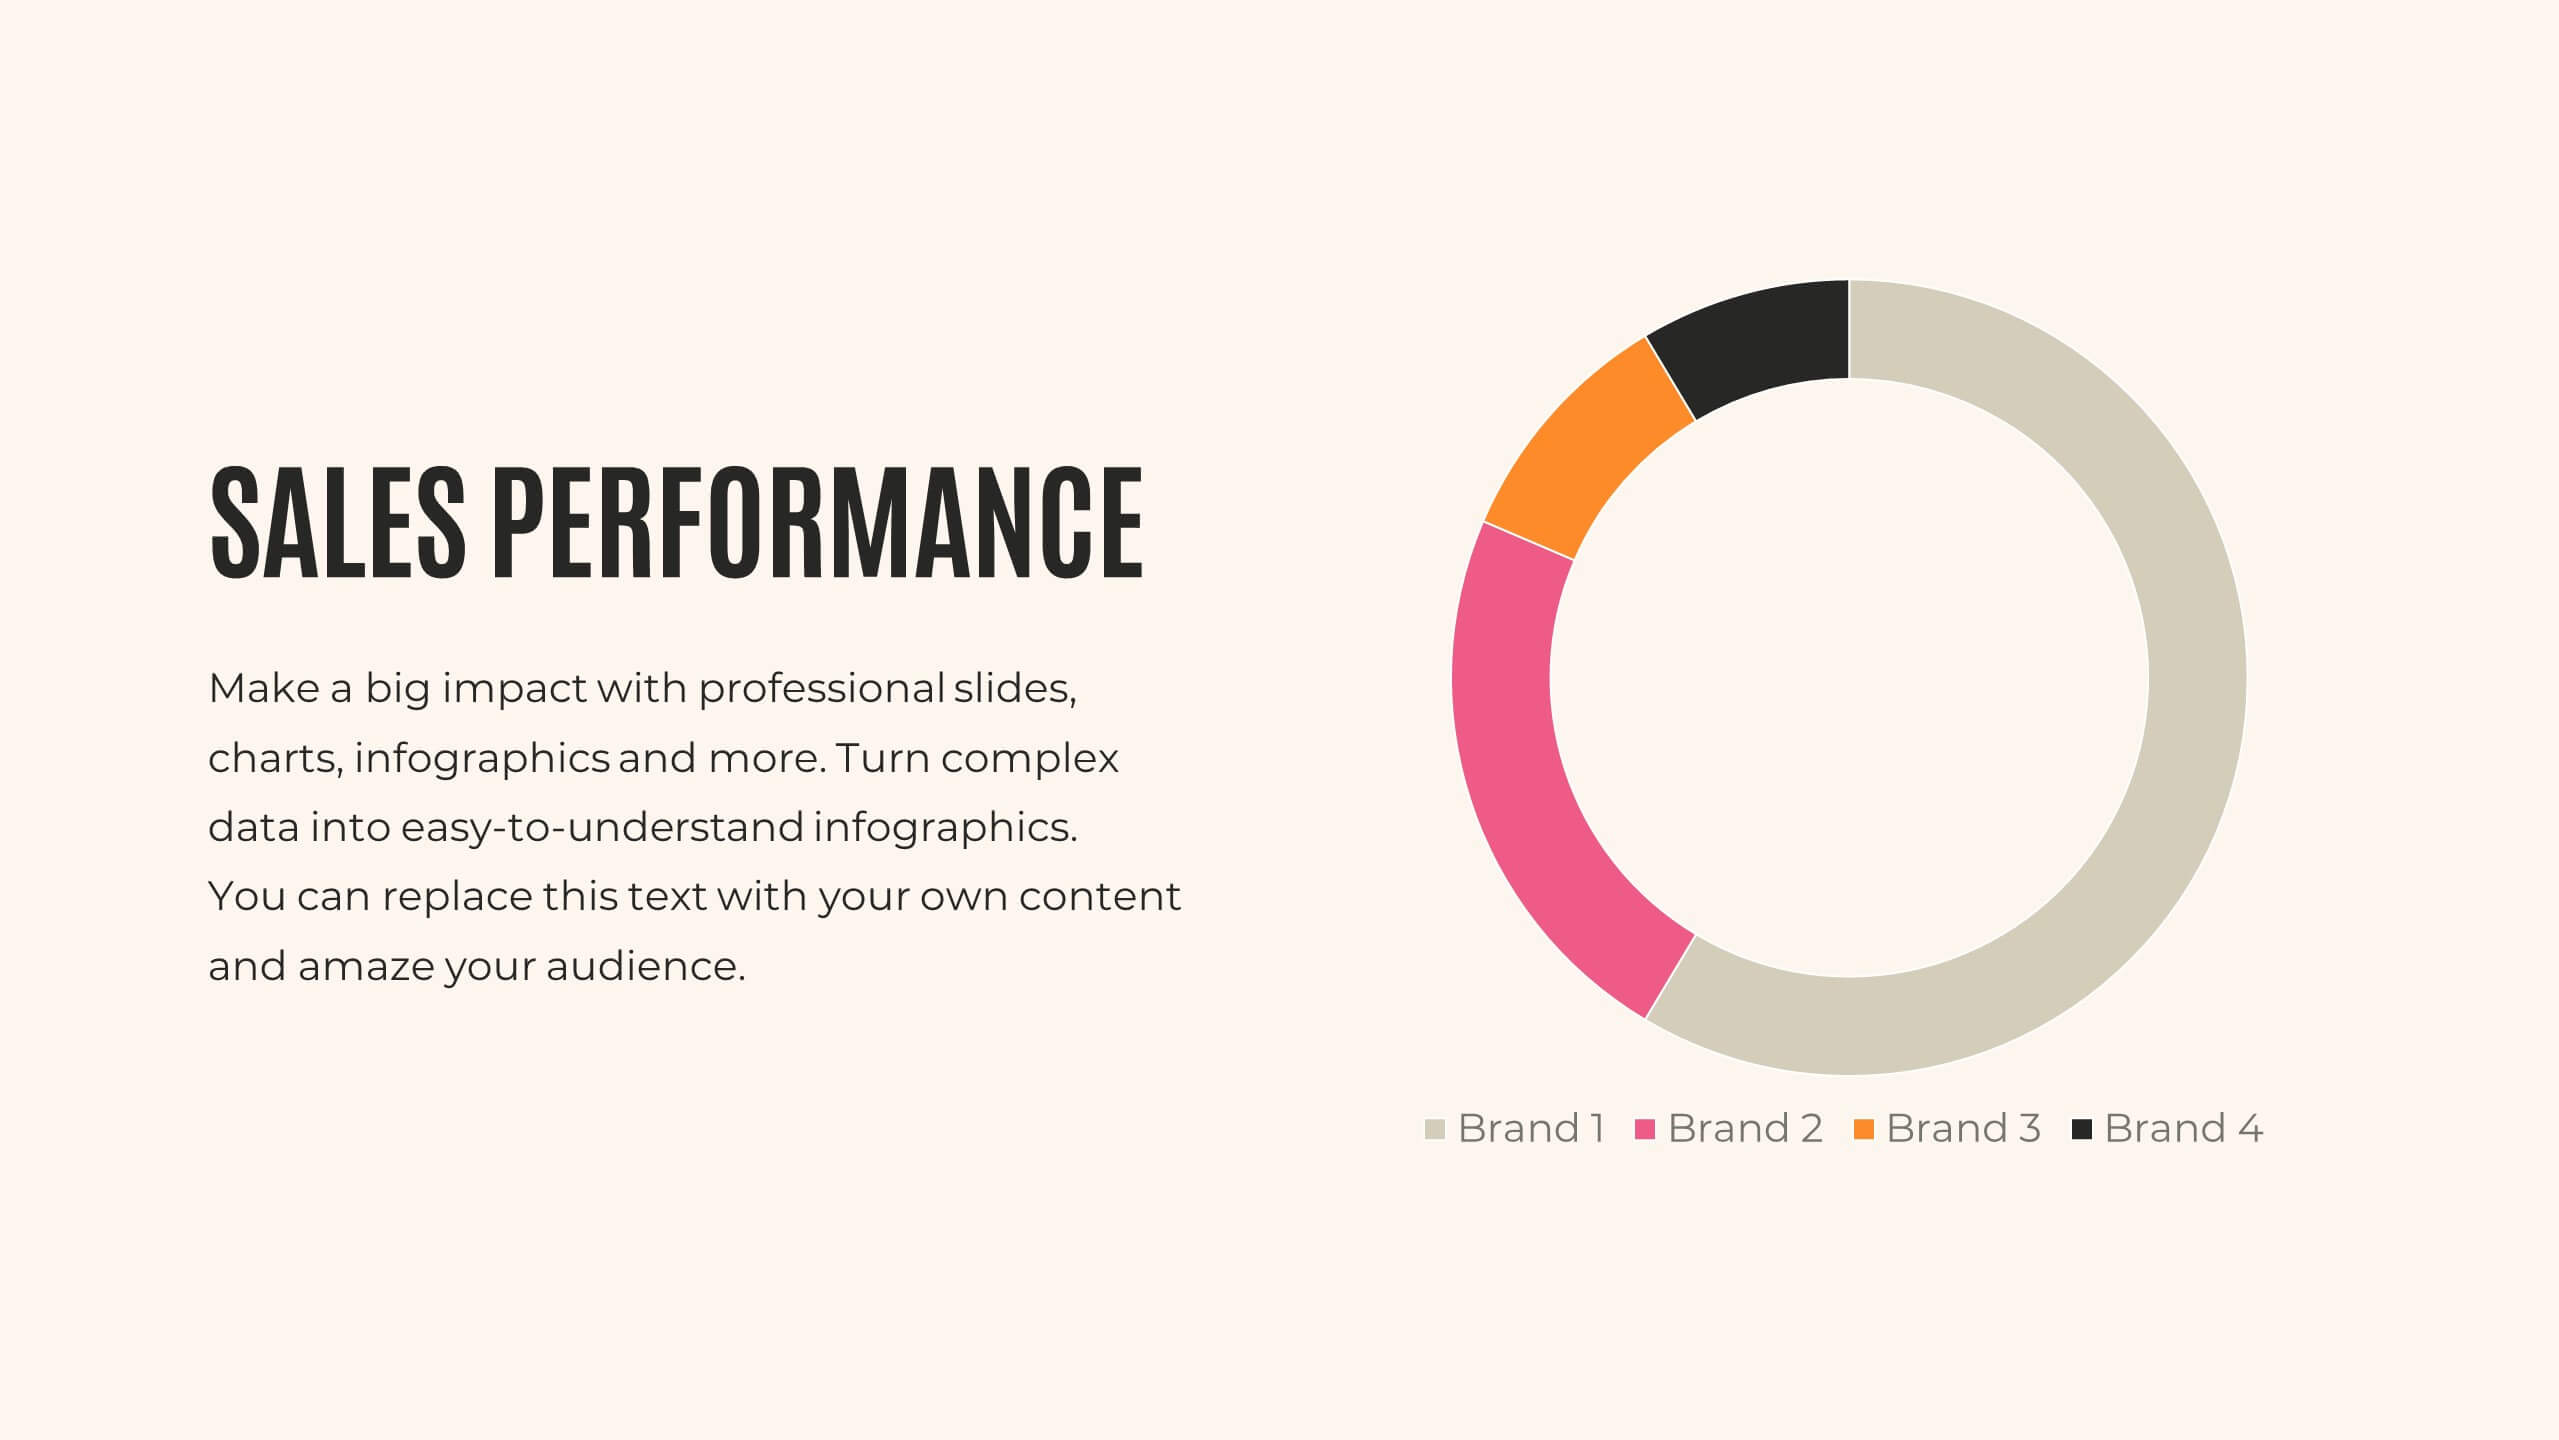
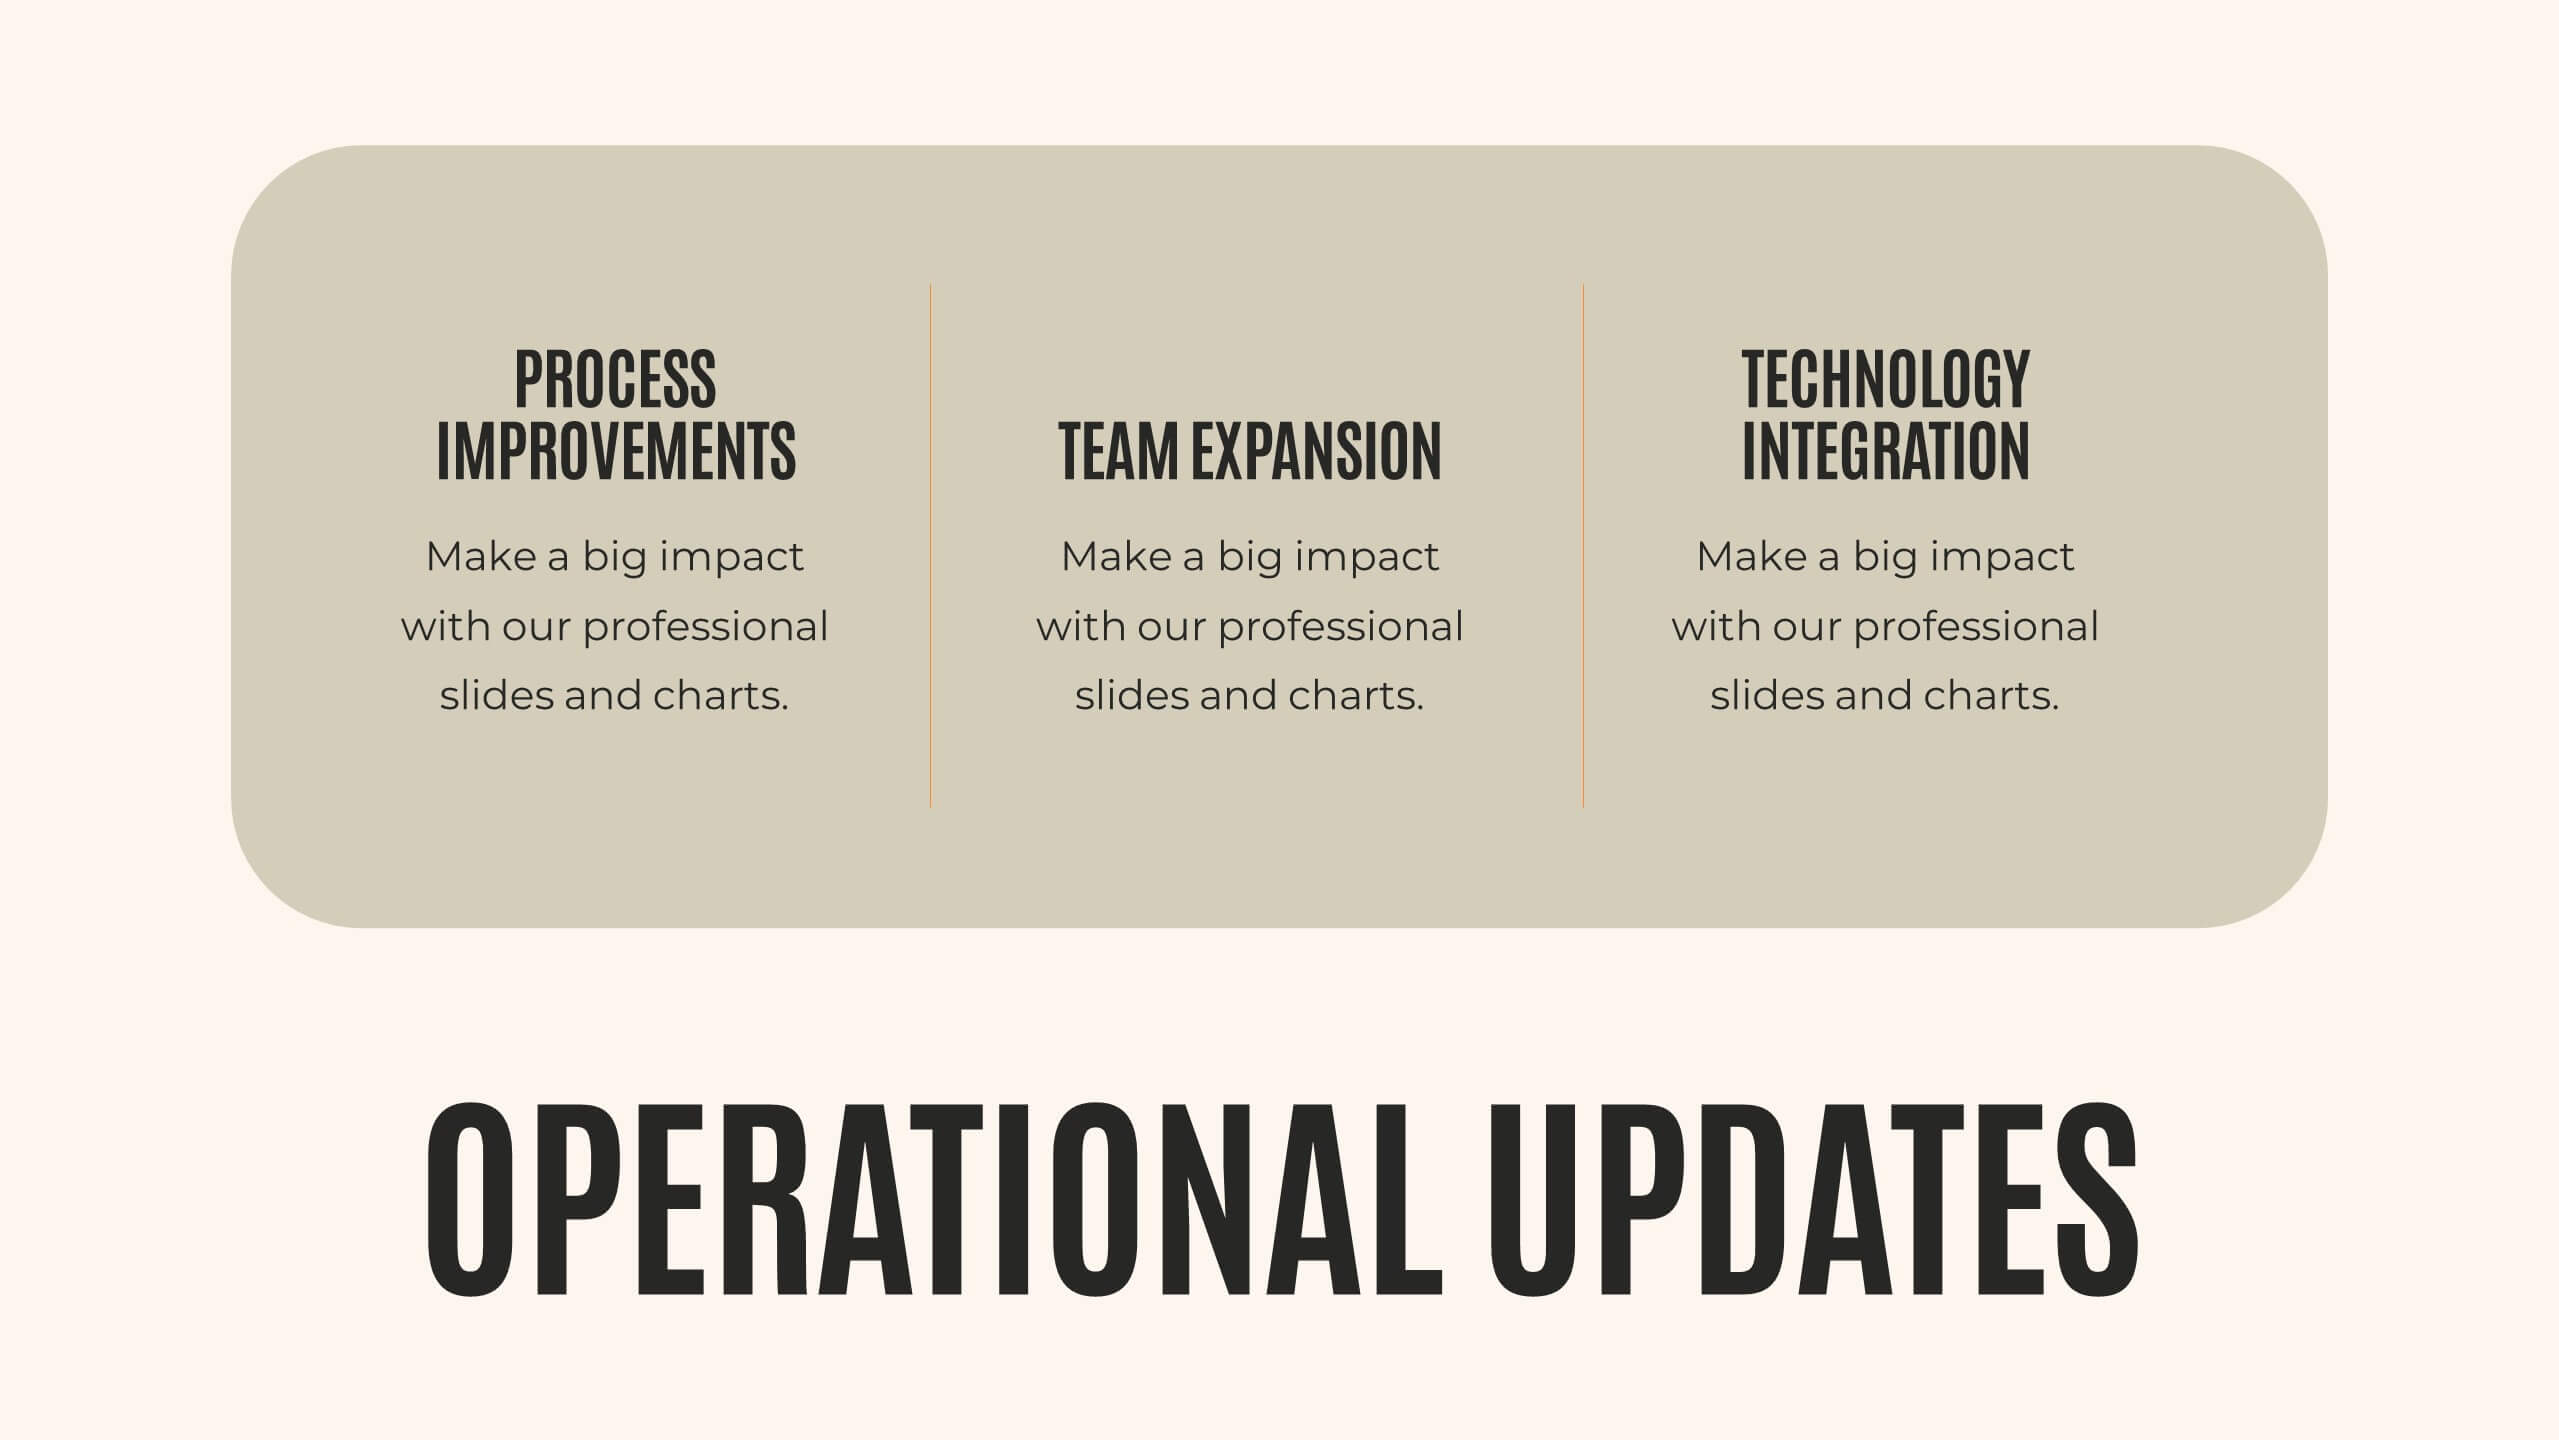
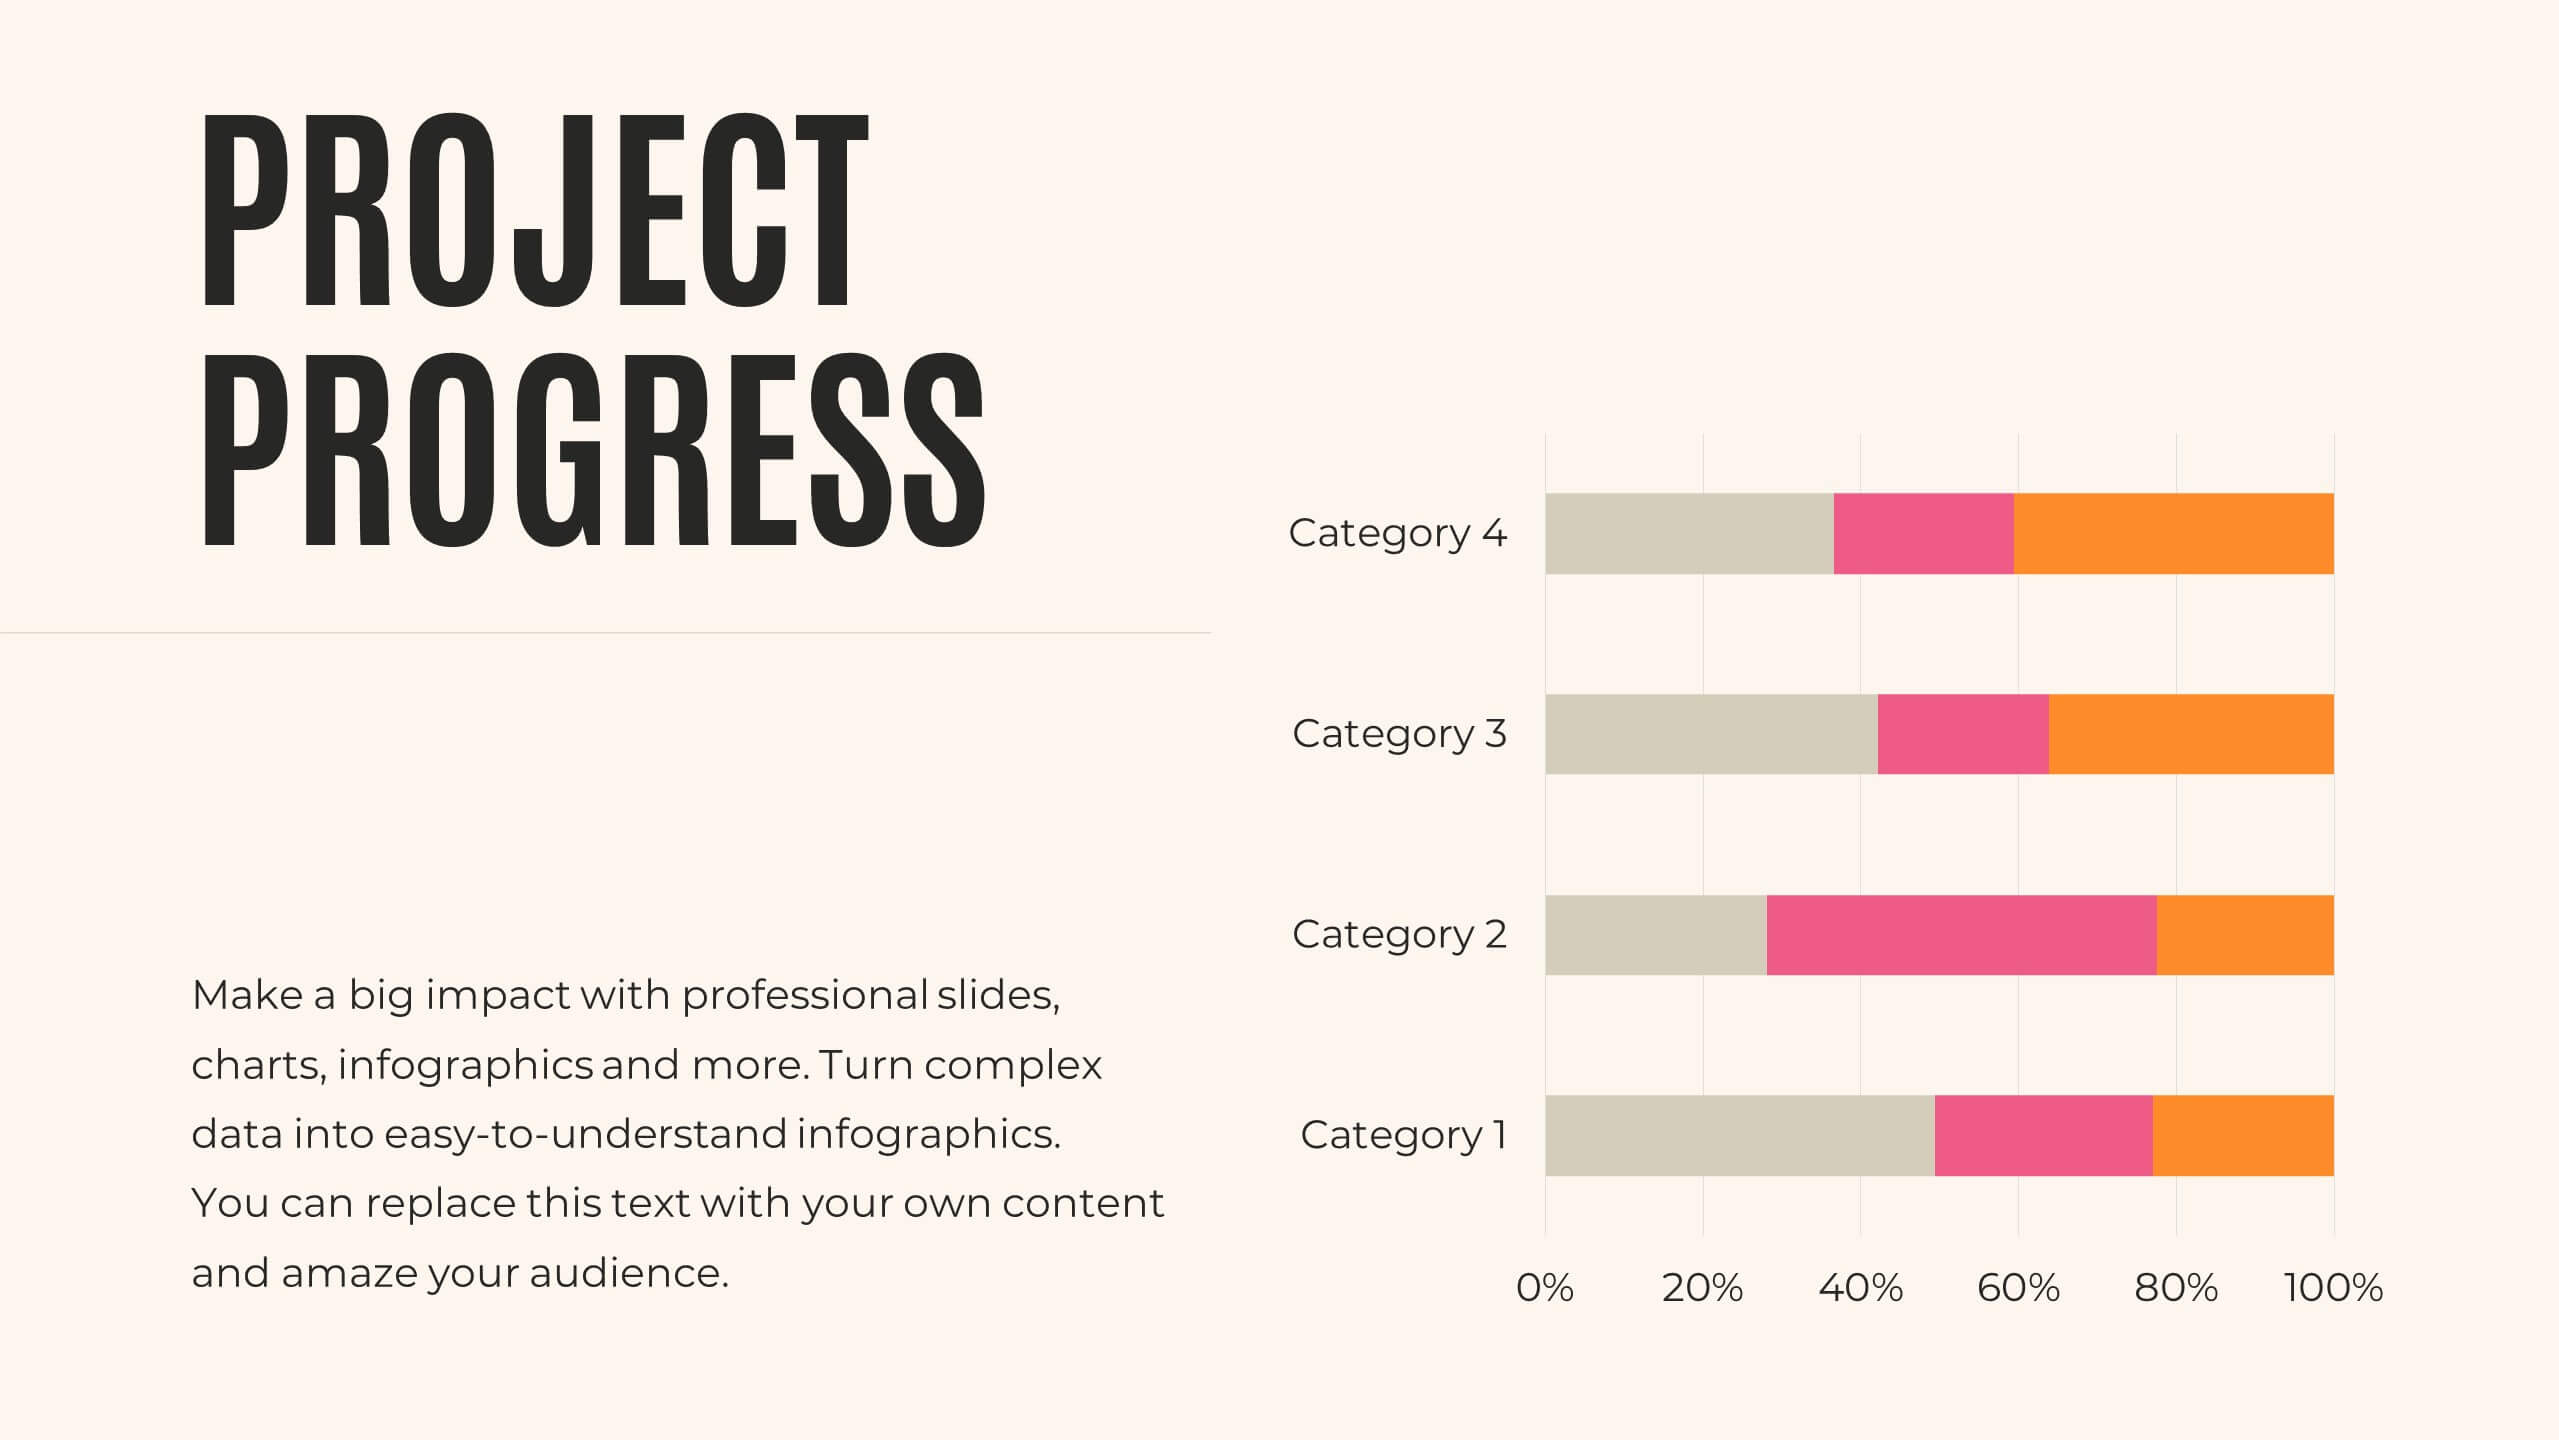
Present your annual report with clarity and impact! This template covers agenda, key highlights, financial summary, sales performance, and project progress. Ideal for detailing achievements, insights, and future priorities. Compatible with PowerPoint, Keynote, and Google Slides, it ensures your data is visually compelling and easy to understand. Showcase your success effortlessly!


4 slides
Patient Care Plan and Metrics Presentation
Turn healthcare data into meaningful stories with this modern and professional presentation. Perfect for highlighting patient progress, clinical outcomes, and care efficiency, it balances visuals and data for clarity and impact. Easy to edit and fully compatible with PowerPoint, Keynote, and Google Slides for smooth customization.


12 slides
Business Environmental Factors PESTEL Analysis Presentation
Visualize critical external influences on your business strategy with this Business Environmental Factors PESTEL Analysis slide. Designed for consultants, business analysts, and executive teams, this template uses a circular layout to highlight the six core PESTEL categories—Political, Economic, Sociocultural, Technological, Environmental, and Legal. Each segment is clearly marked with icons and labels, offering space to insert key insights or impact notes. Perfect for competitive analysis, board presentations, and long-term planning. Fully editable in PowerPoint, Keynote, and Google Slides.