


Features
- 5 Unique slides
- Fully editable and easy to edit in Microsoft Powerpoint, Keynote and Google Slides
- 16:9 widescreen layout
- Clean and professional designs
- Export to JPG, PDF or send by email


Do you have any questions?
Recommend


6 slides
Travel Itinerary and Budget Planning Presentation
Plan trips with precision using this visually organized circle-based infographic. With six labeled sections and travel-themed icons, this layout helps you outline schedules, expenses, and key milestones clearly. Perfect for tour operators, travel bloggers, or itinerary services, this slide ensures information is both engaging and easy to follow. Fully editable in PowerPoint, Keynote, and Google Slides.


2 slides
Long-Term Vision Strategy Presentation
Spark forward momentum with a clean, modern slide that turns long-range planning into a story your audience can instantly follow. This presentation helps teams outline future goals, strategic priorities, and the actions needed to stay aligned over time. Fully compatible with PowerPoint, Keynote, and Google Slides.


5 slides
5G Wireless Technology Infographics
5G technology refers to the fifth generation of wireless communication technology. These infographic templates are designed to showcase the key features, benefits, and impact of 5G technology. These are perfect for technology enthusiasts, professionals, educators, or anyone looking to explain the concept and advancements of 5G. Educate and inform your audiences about the concept, benefits, and applications of 5G technology with these infographics. It is fully customizable and has attention-grabbing design elements making it easy to create a compelling presentation about the advancements and potential of 5G technology.


10 slides
Hospital Services Overview Presentation
Bring your healthcare message to life with a clean, modern layout that makes complex hospital services easy to understand. This presentation helps you outline key departments, care processes, and essential service details with clarity and confidence. Designed for smooth communication in medical settings, it works seamlessly in PowerPoint, Keynote, and Google Slides.


6 slides
Regional Finance Infographic
Regional finance plays a vital role in fostering economic growth, attracting investments, and improving the overall well-being of communities within a specific region. This infographic template focuses on financial trends, insights, and data related to specific regions or countries. It is designed to help businesses, organizations, or financial professionals analyze and understand the financial landscape of a particular region. The data-driven content in this template is suitable for businesses or individuals seeking insights to make informed decisions regarding investments, market entry, or financial planning in a specific region.


21 slides
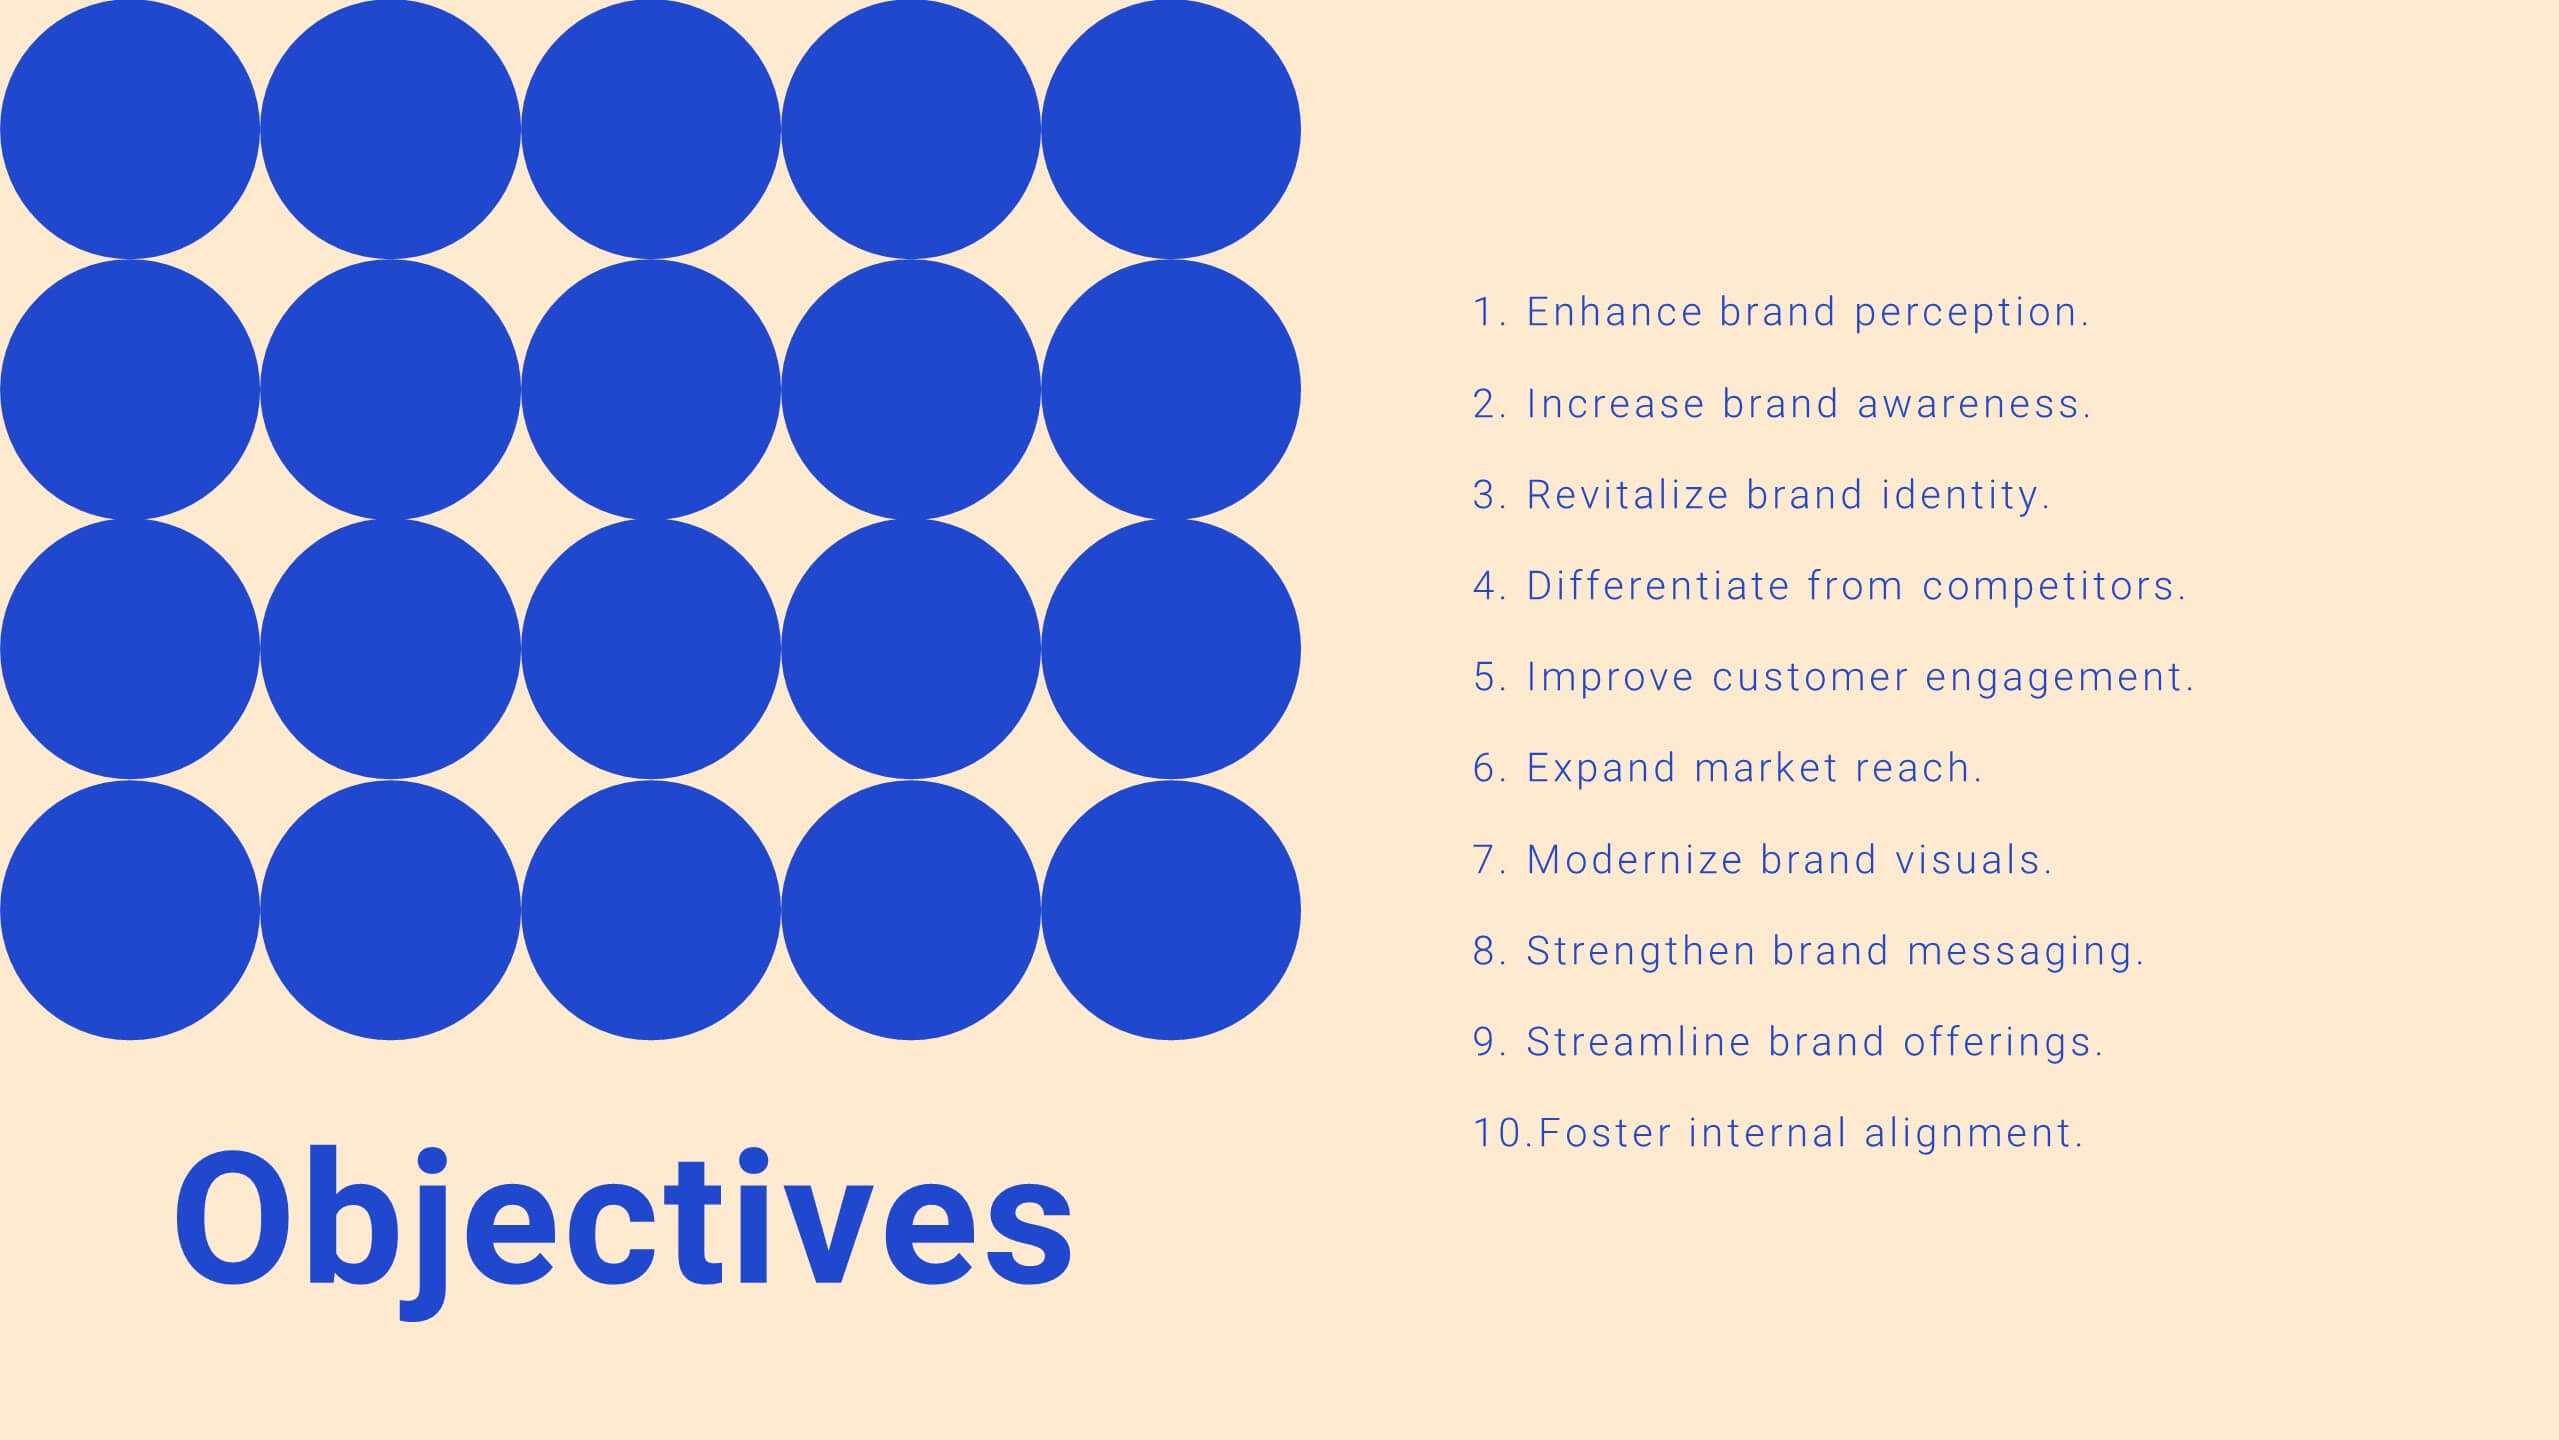
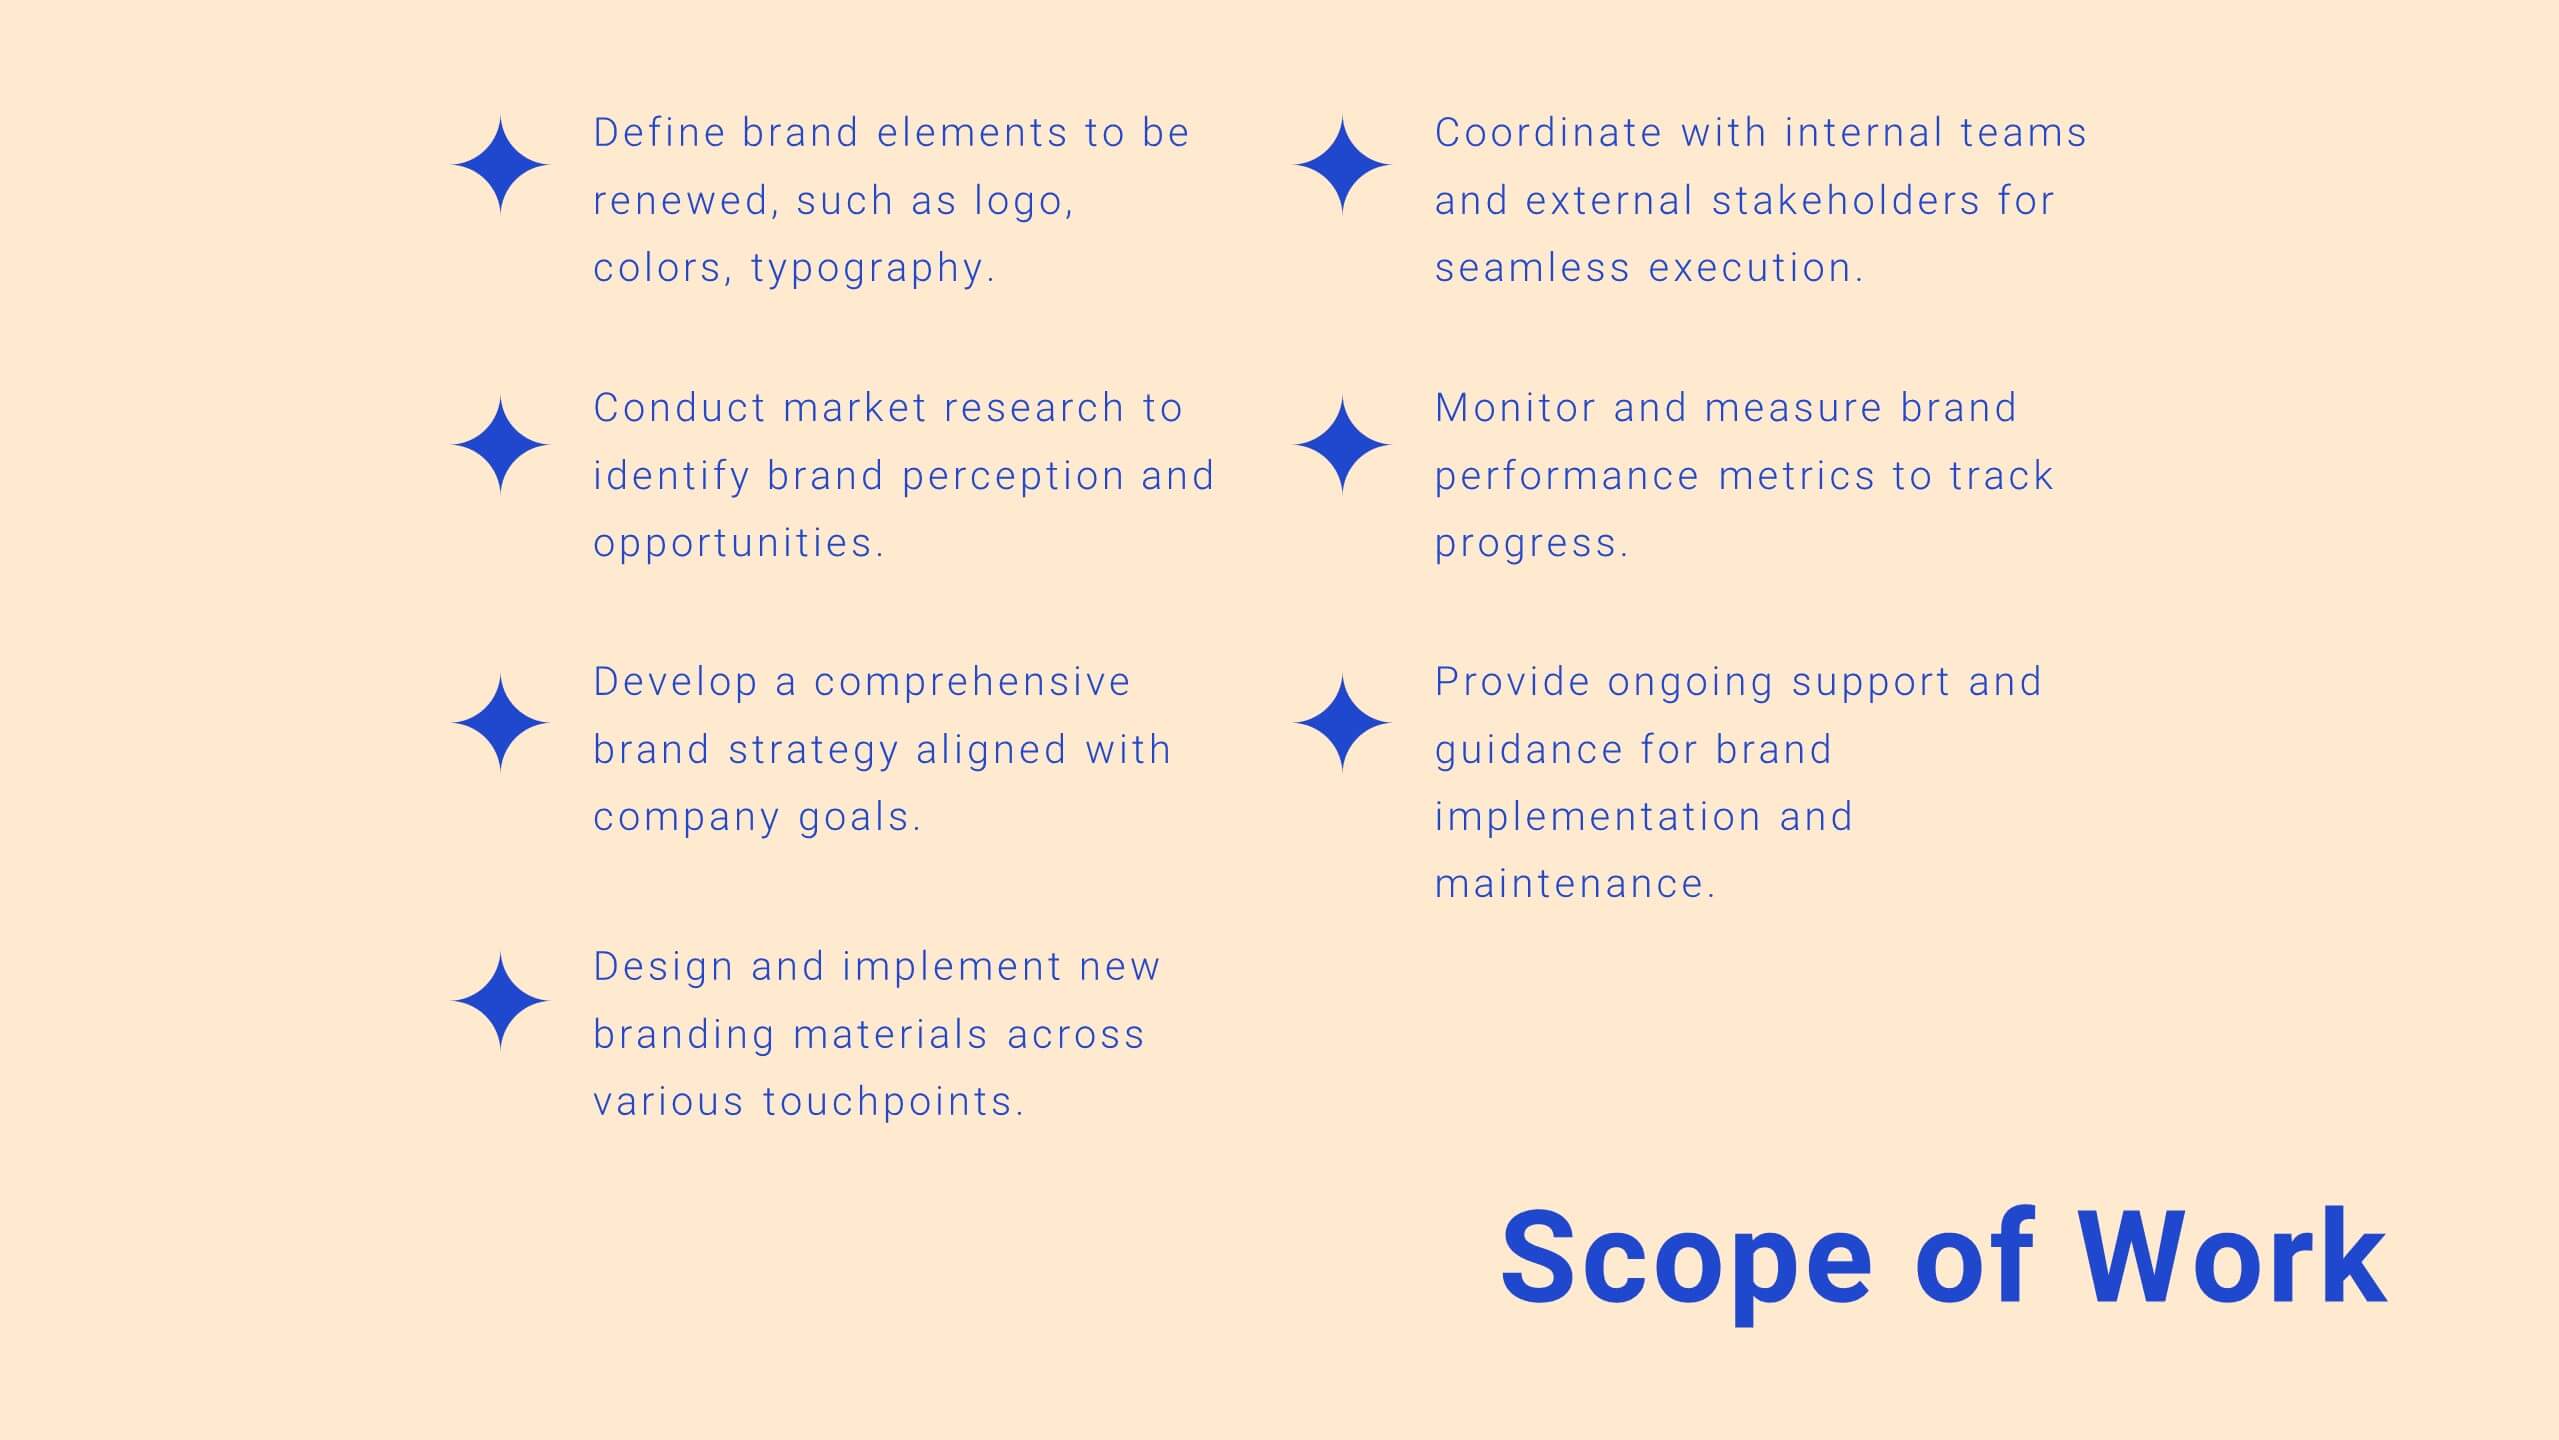
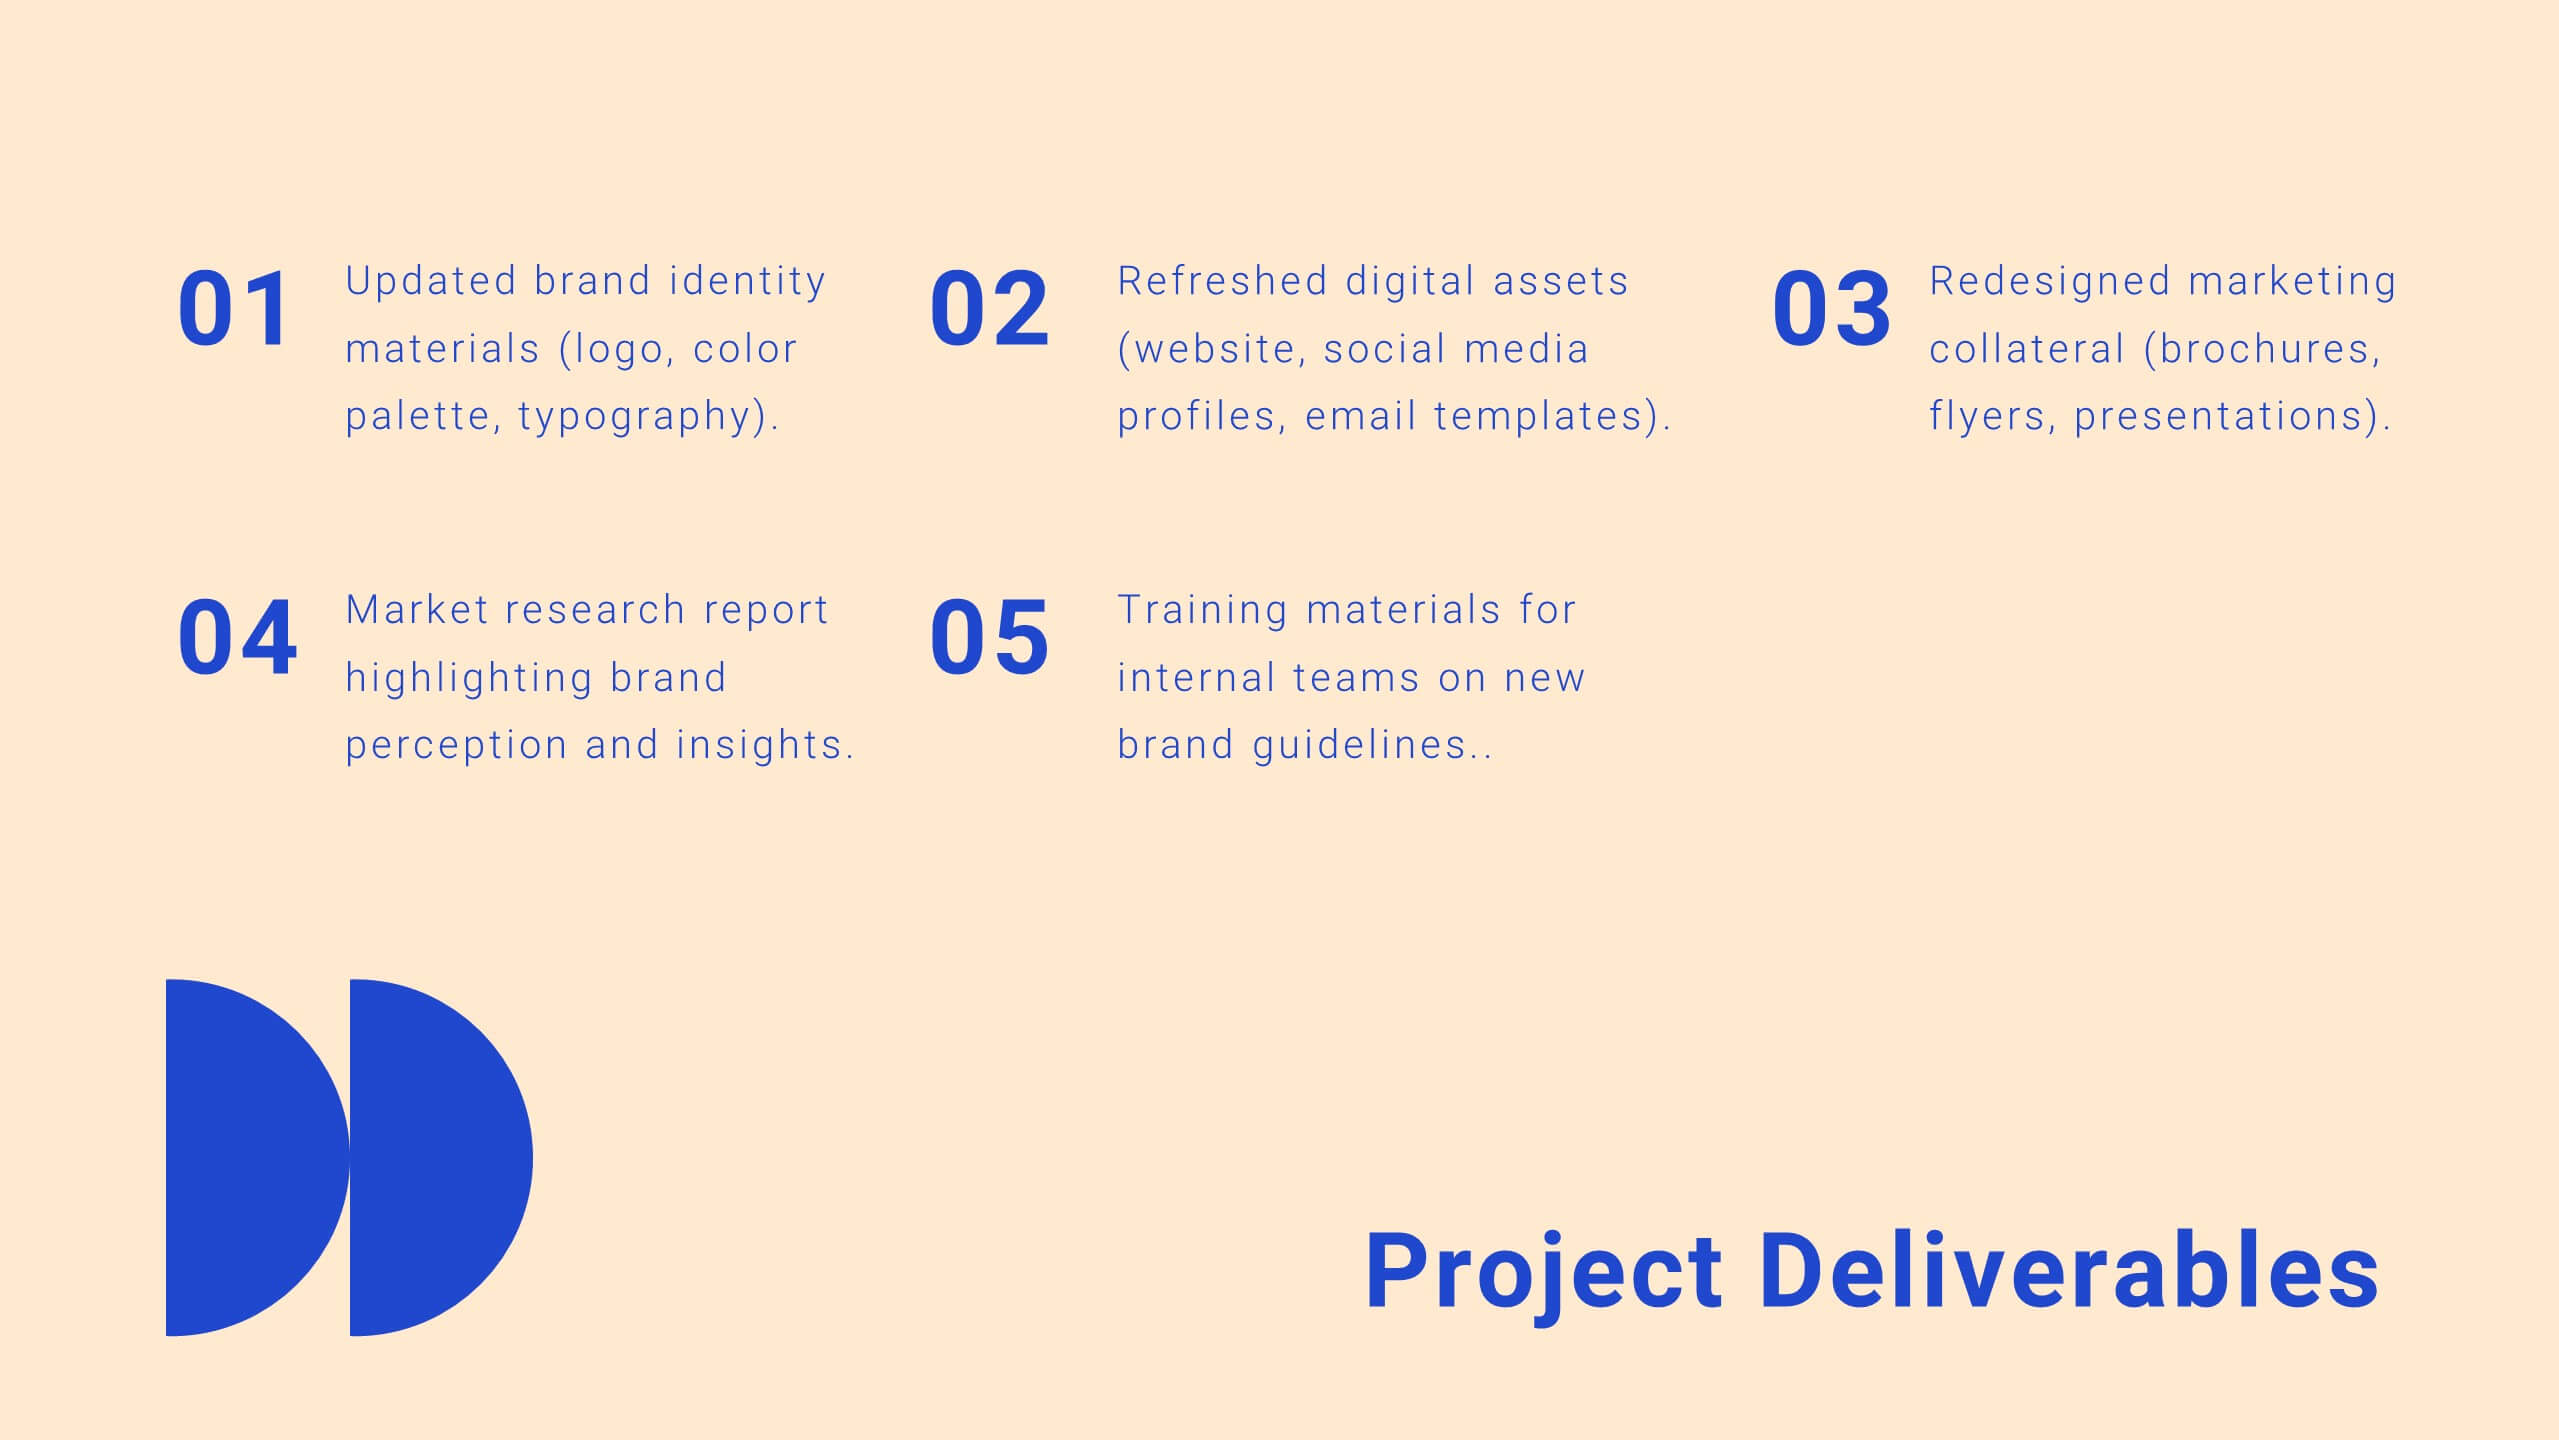
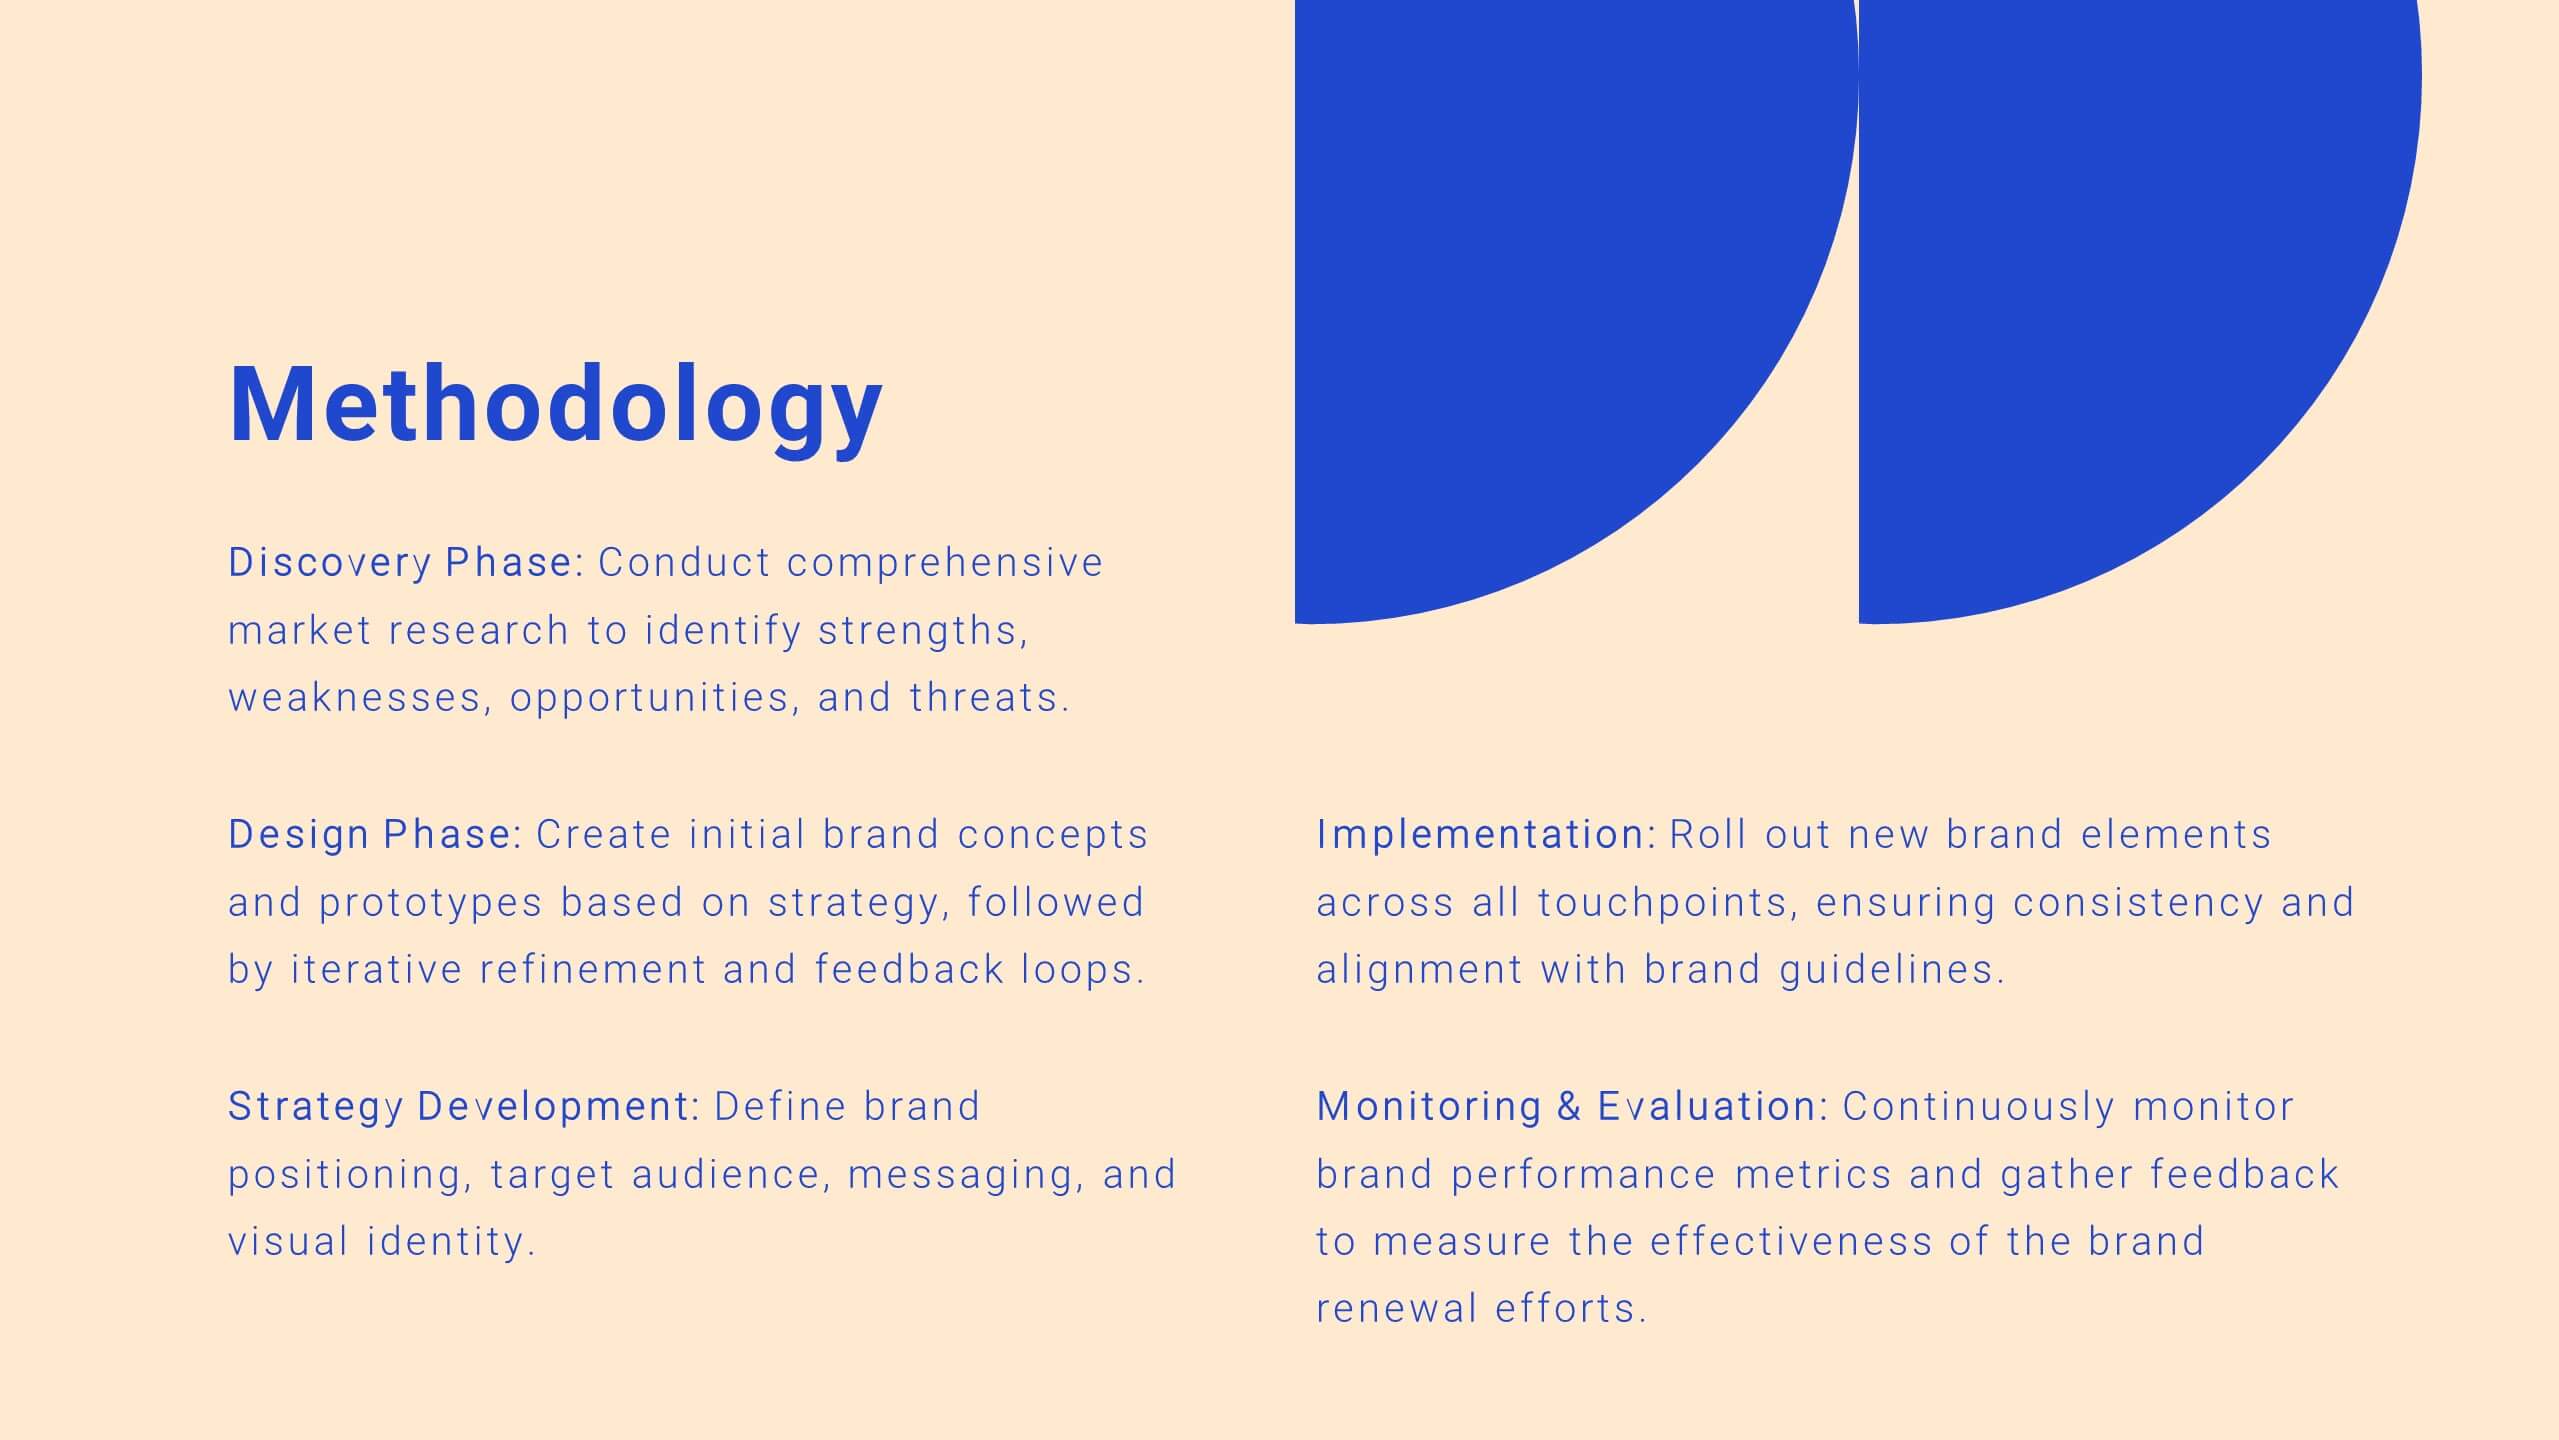
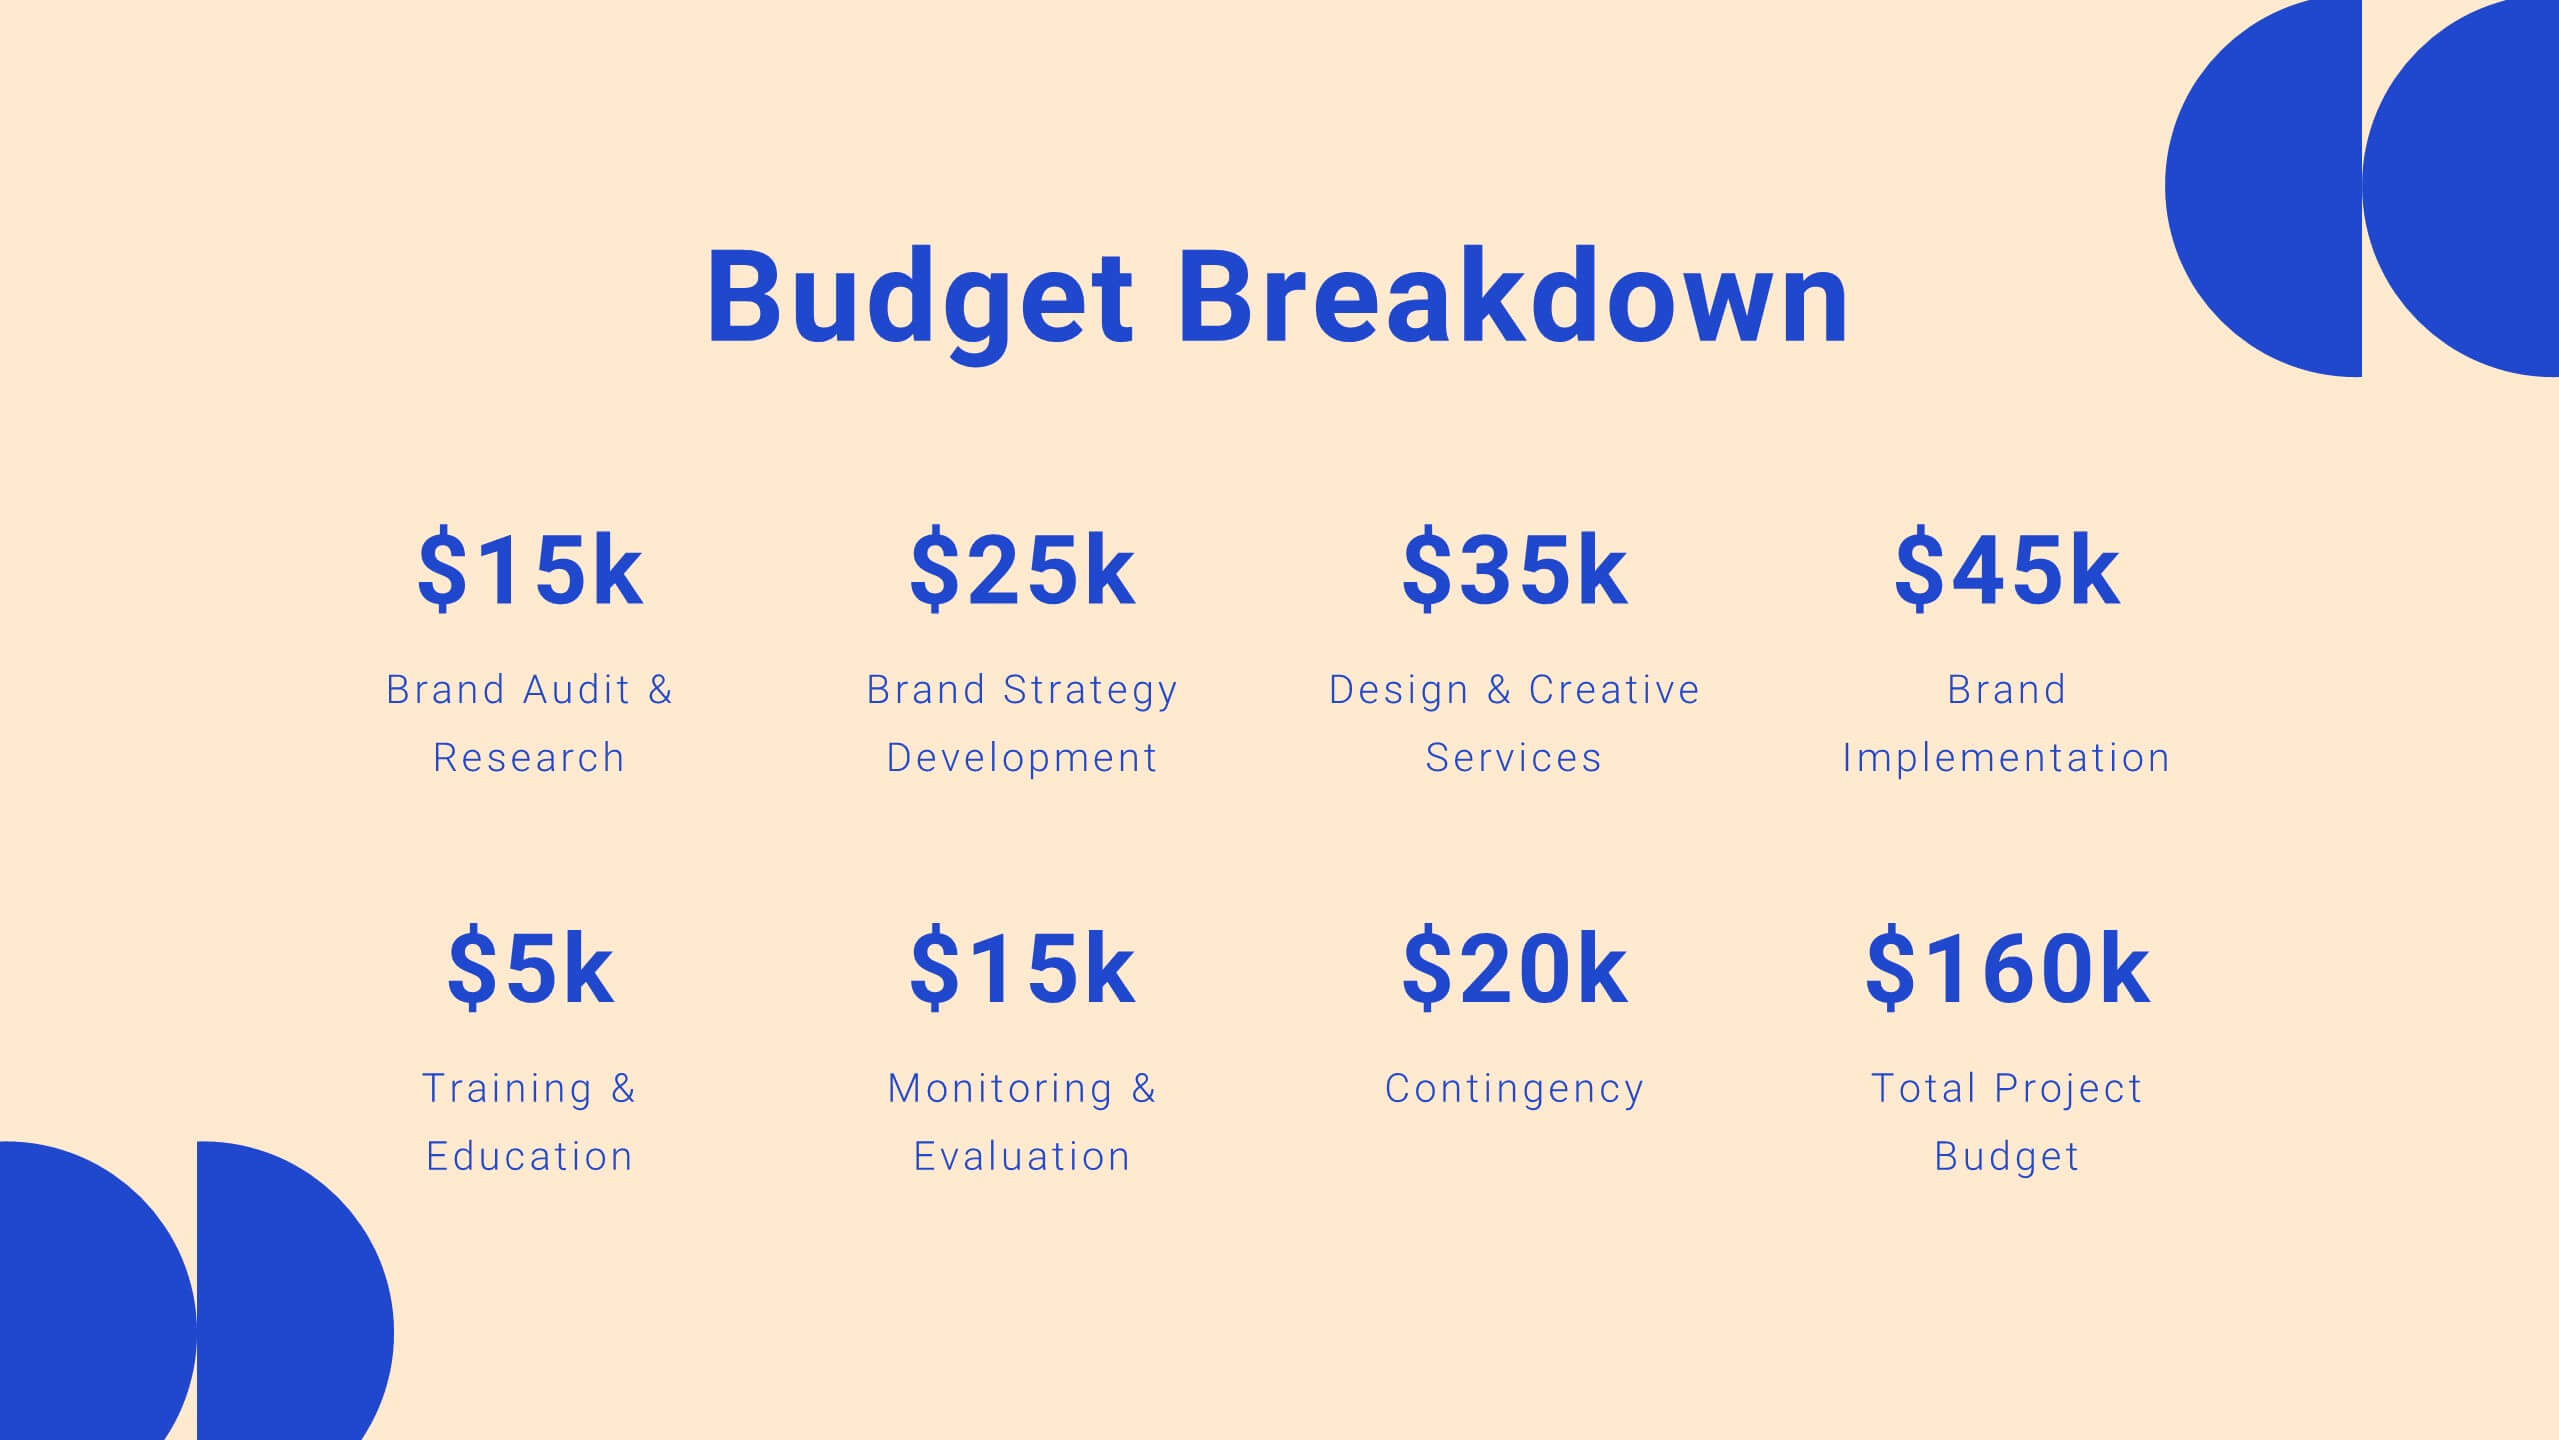
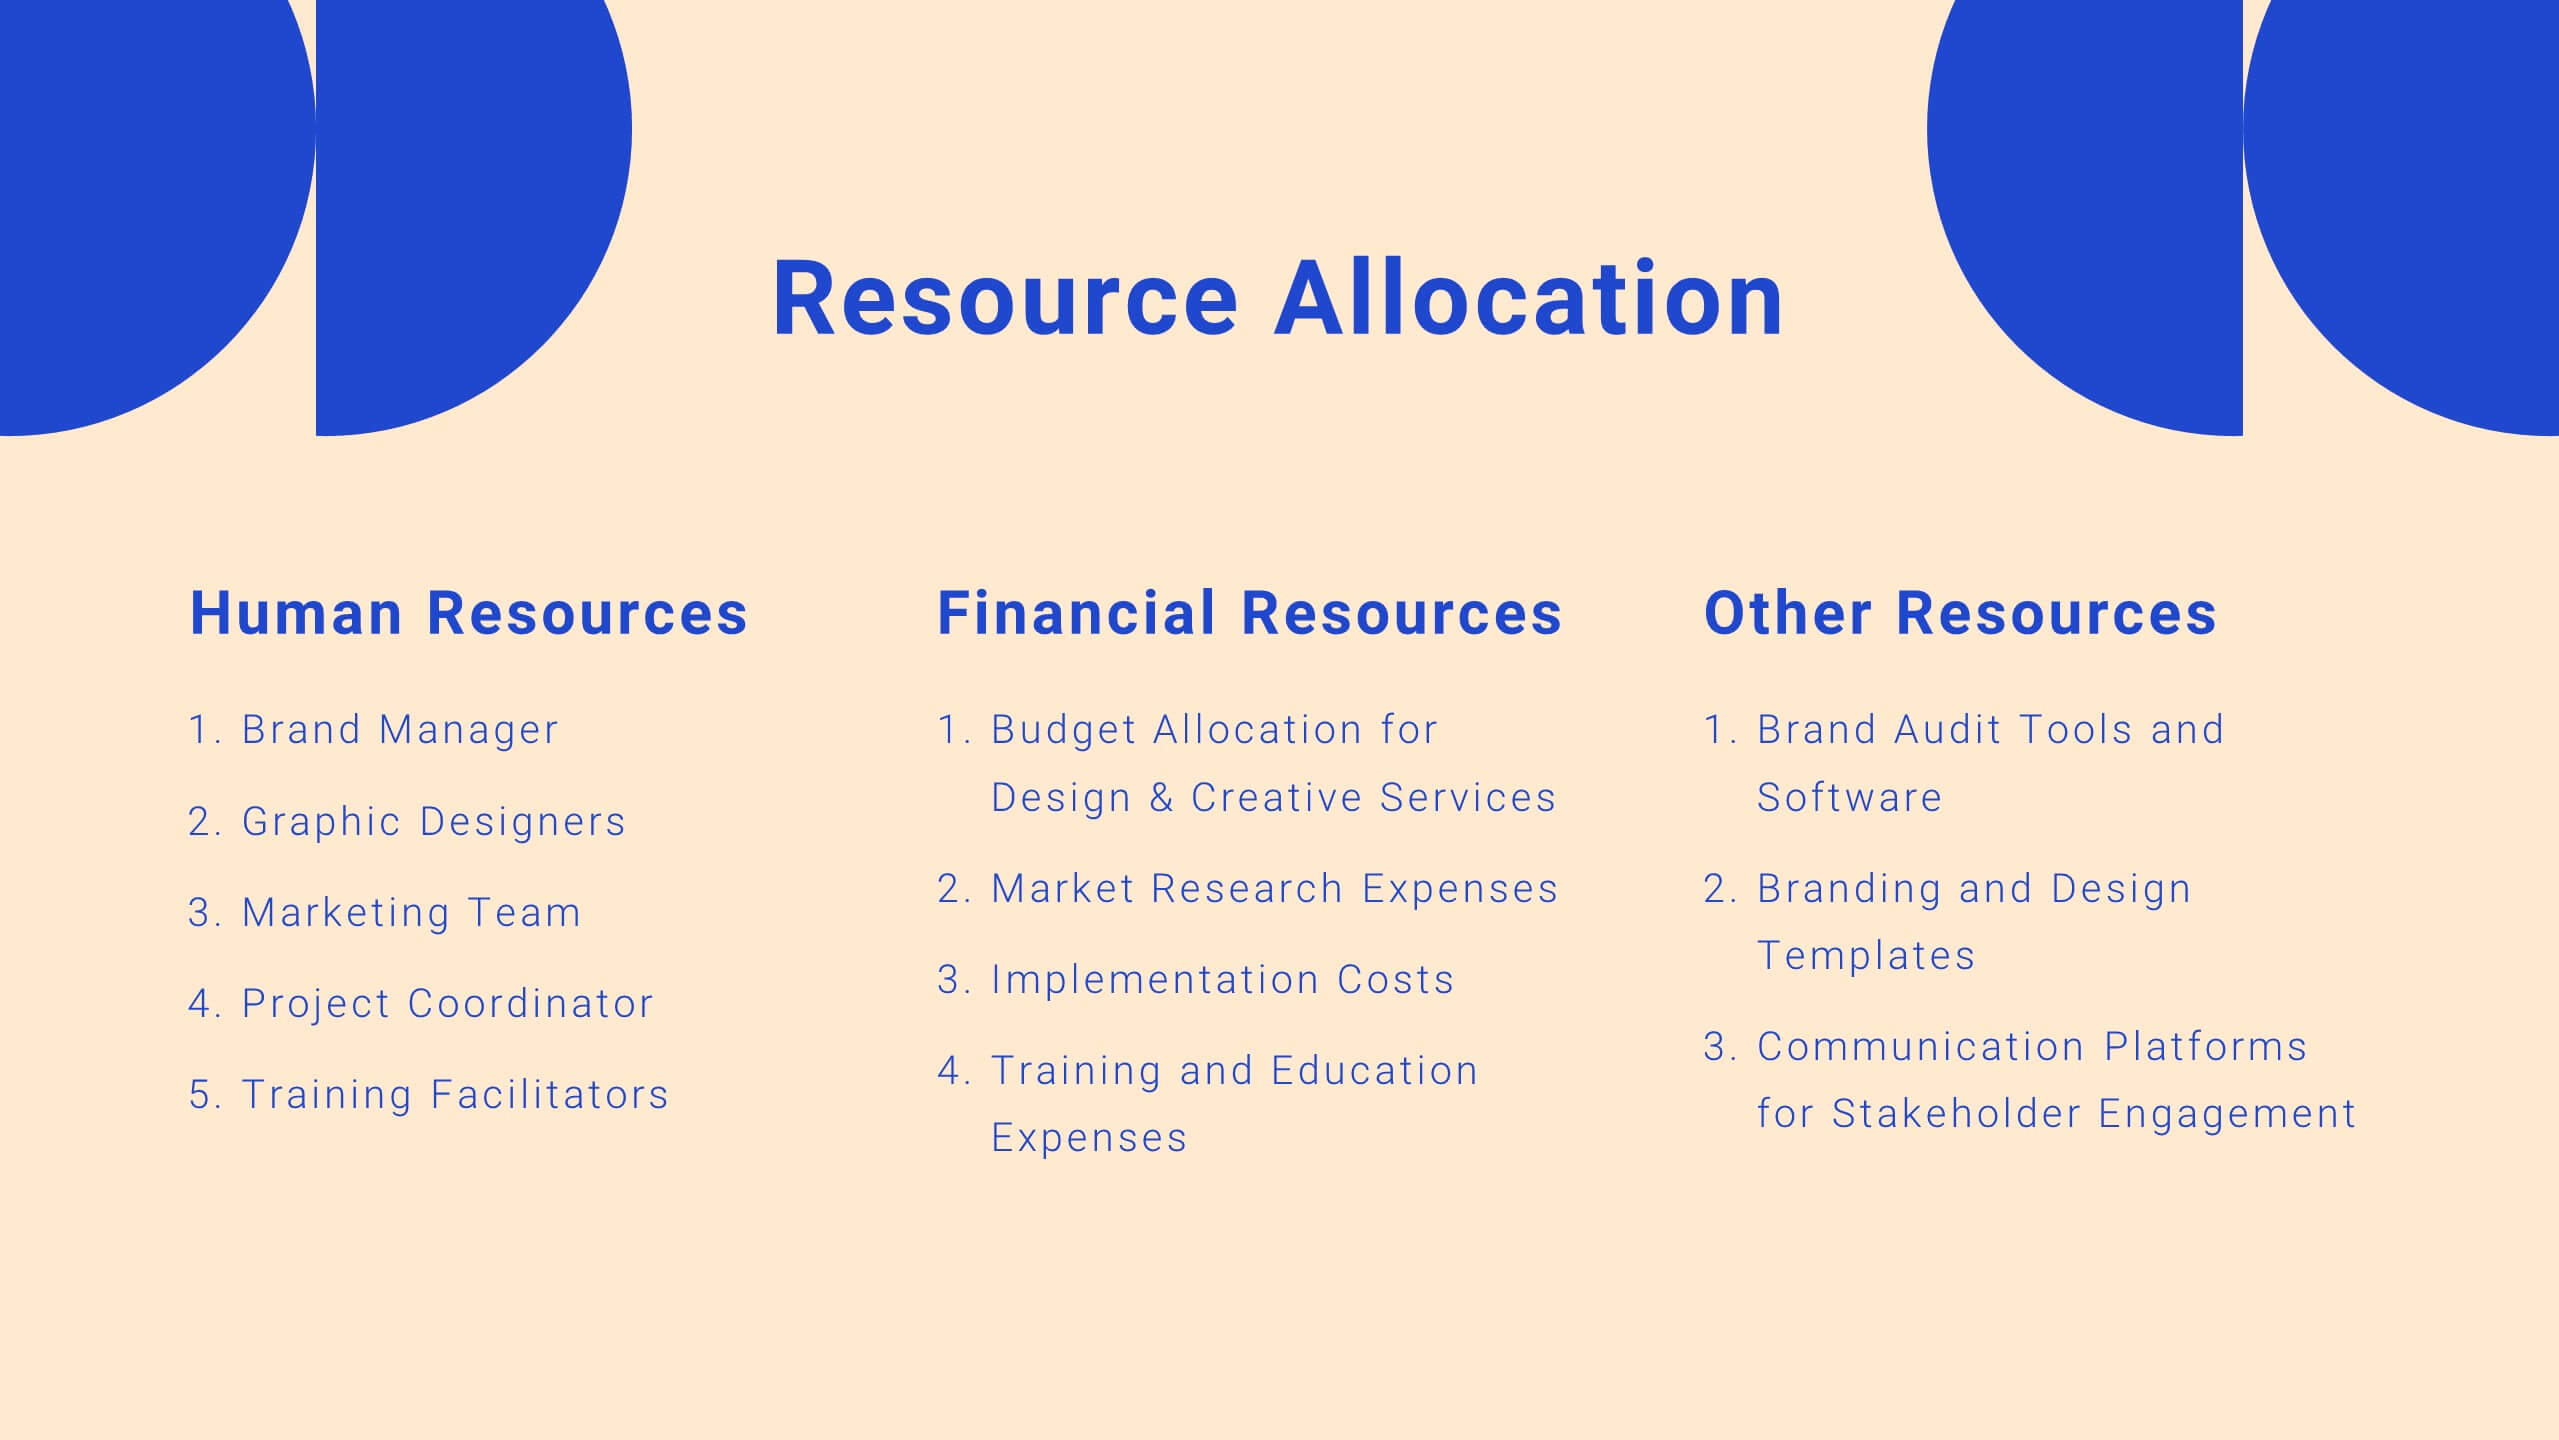
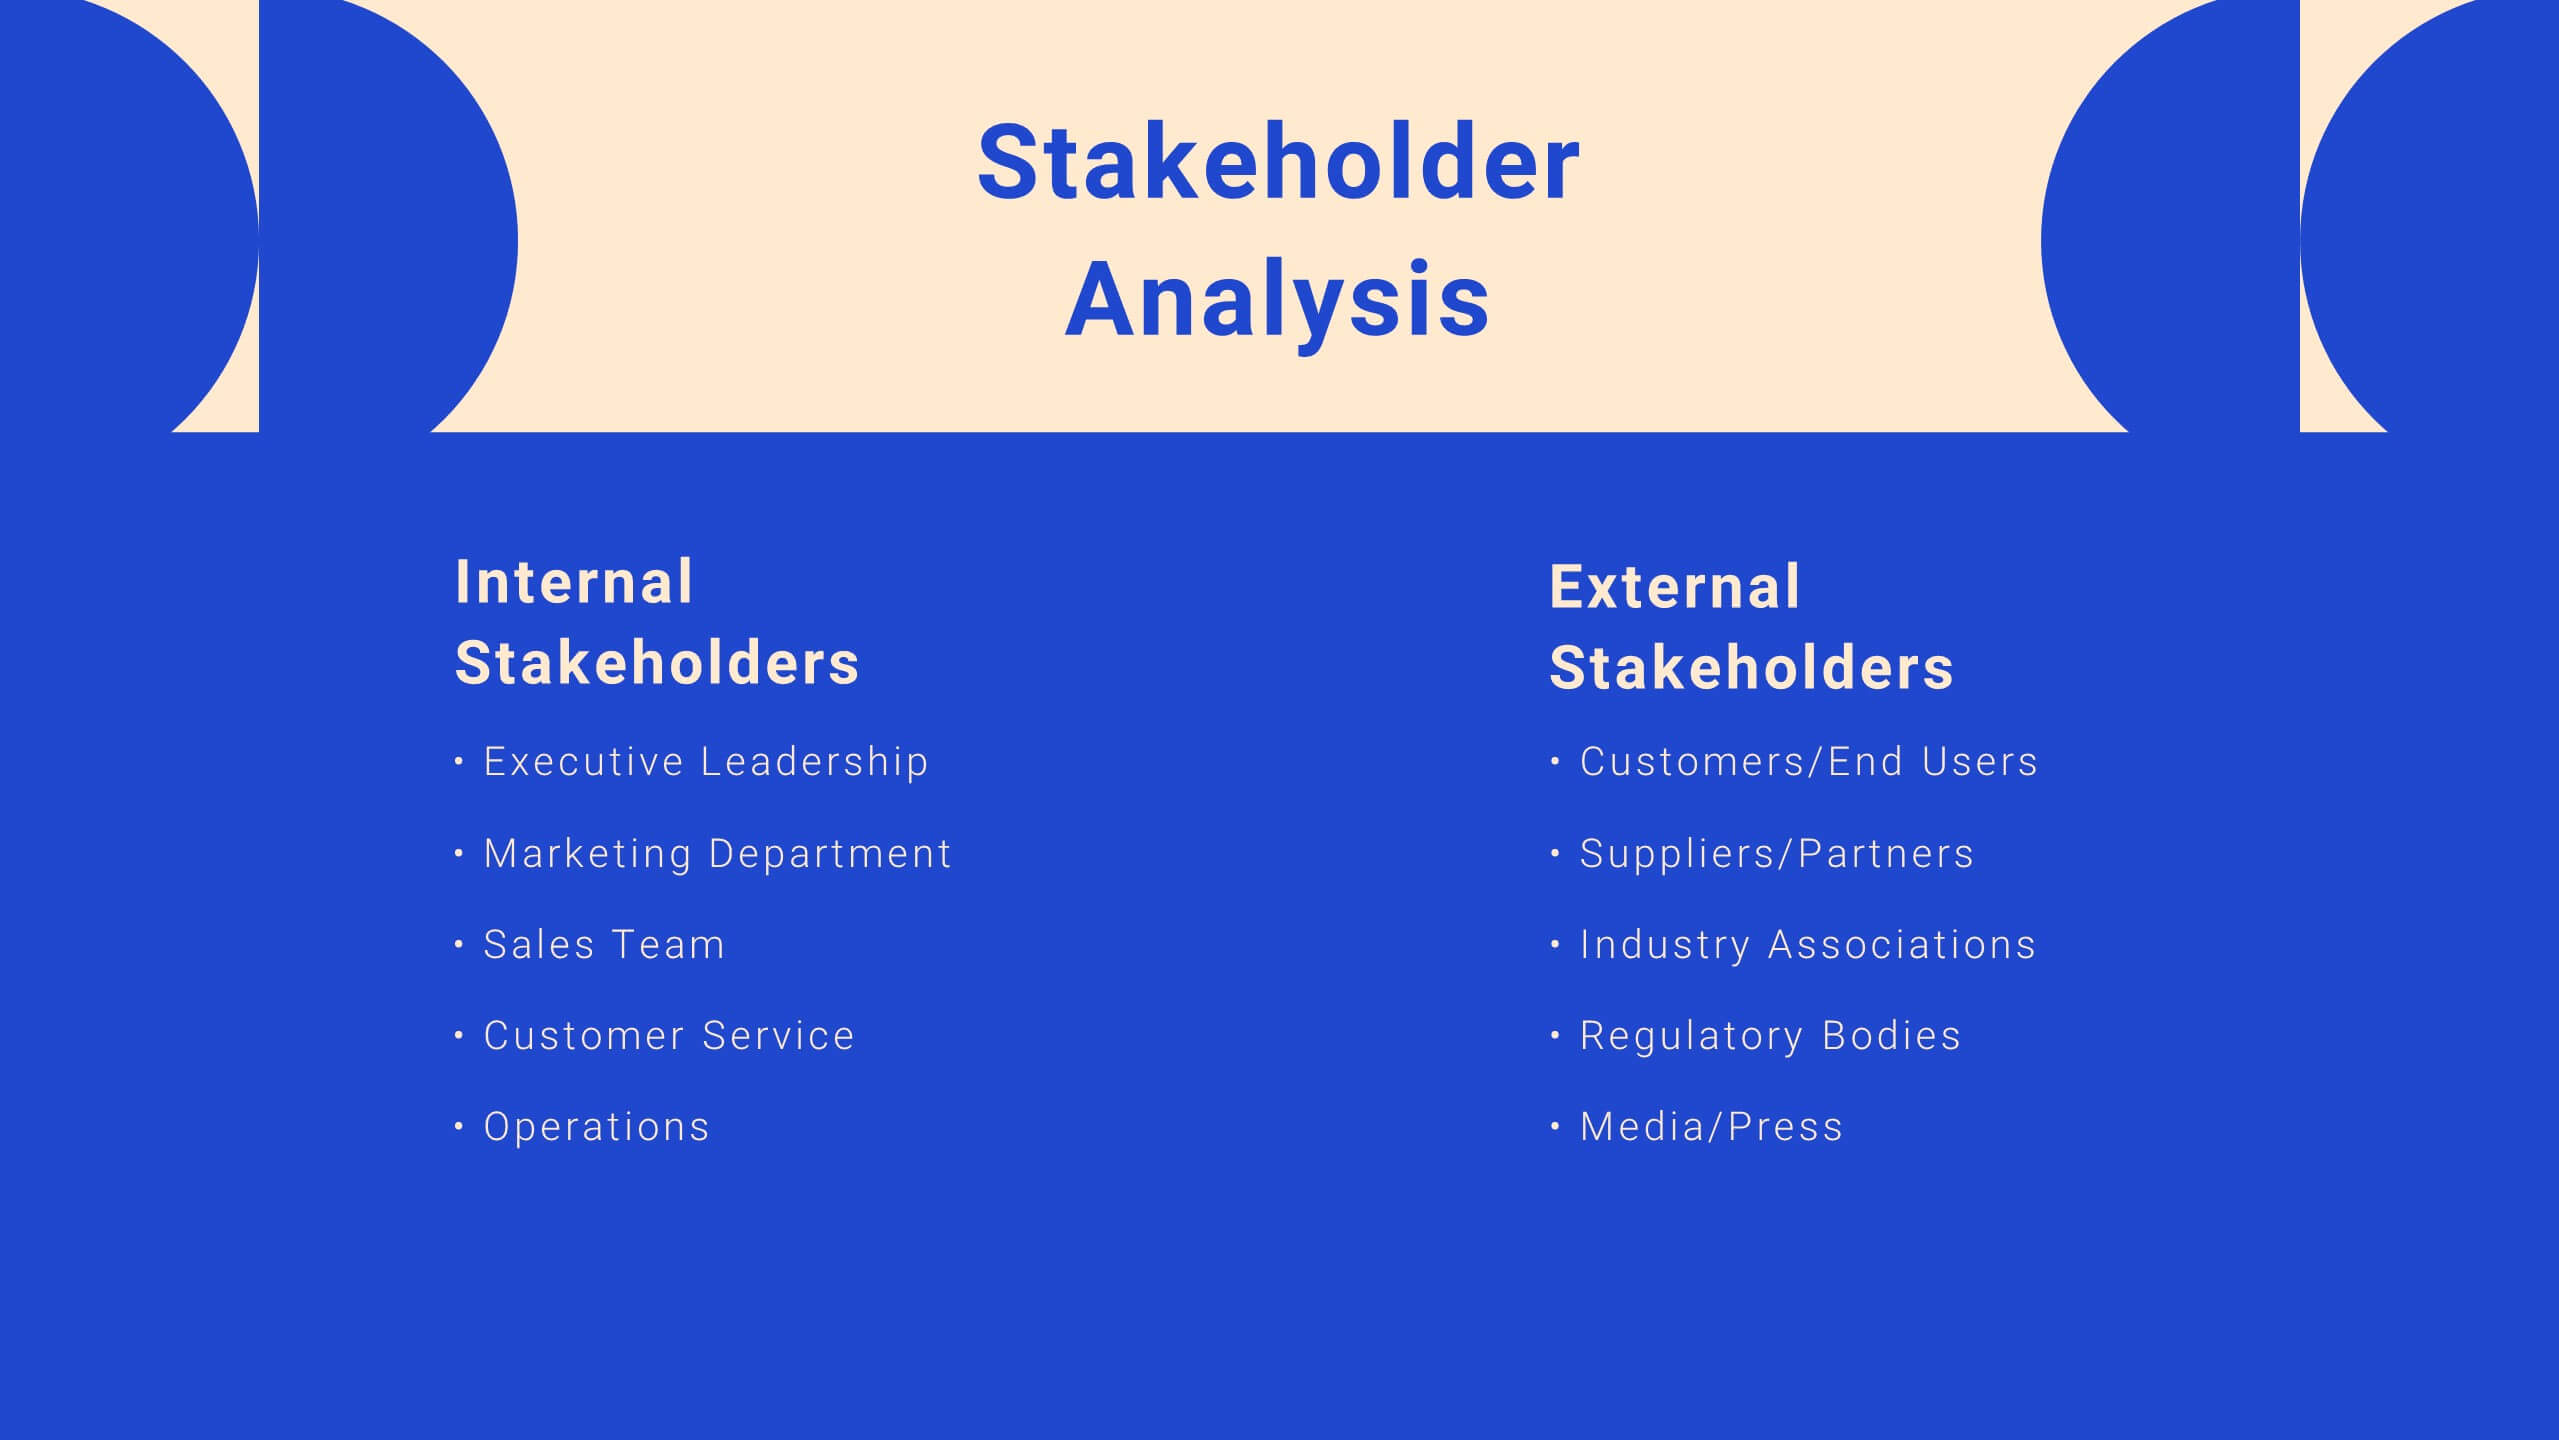
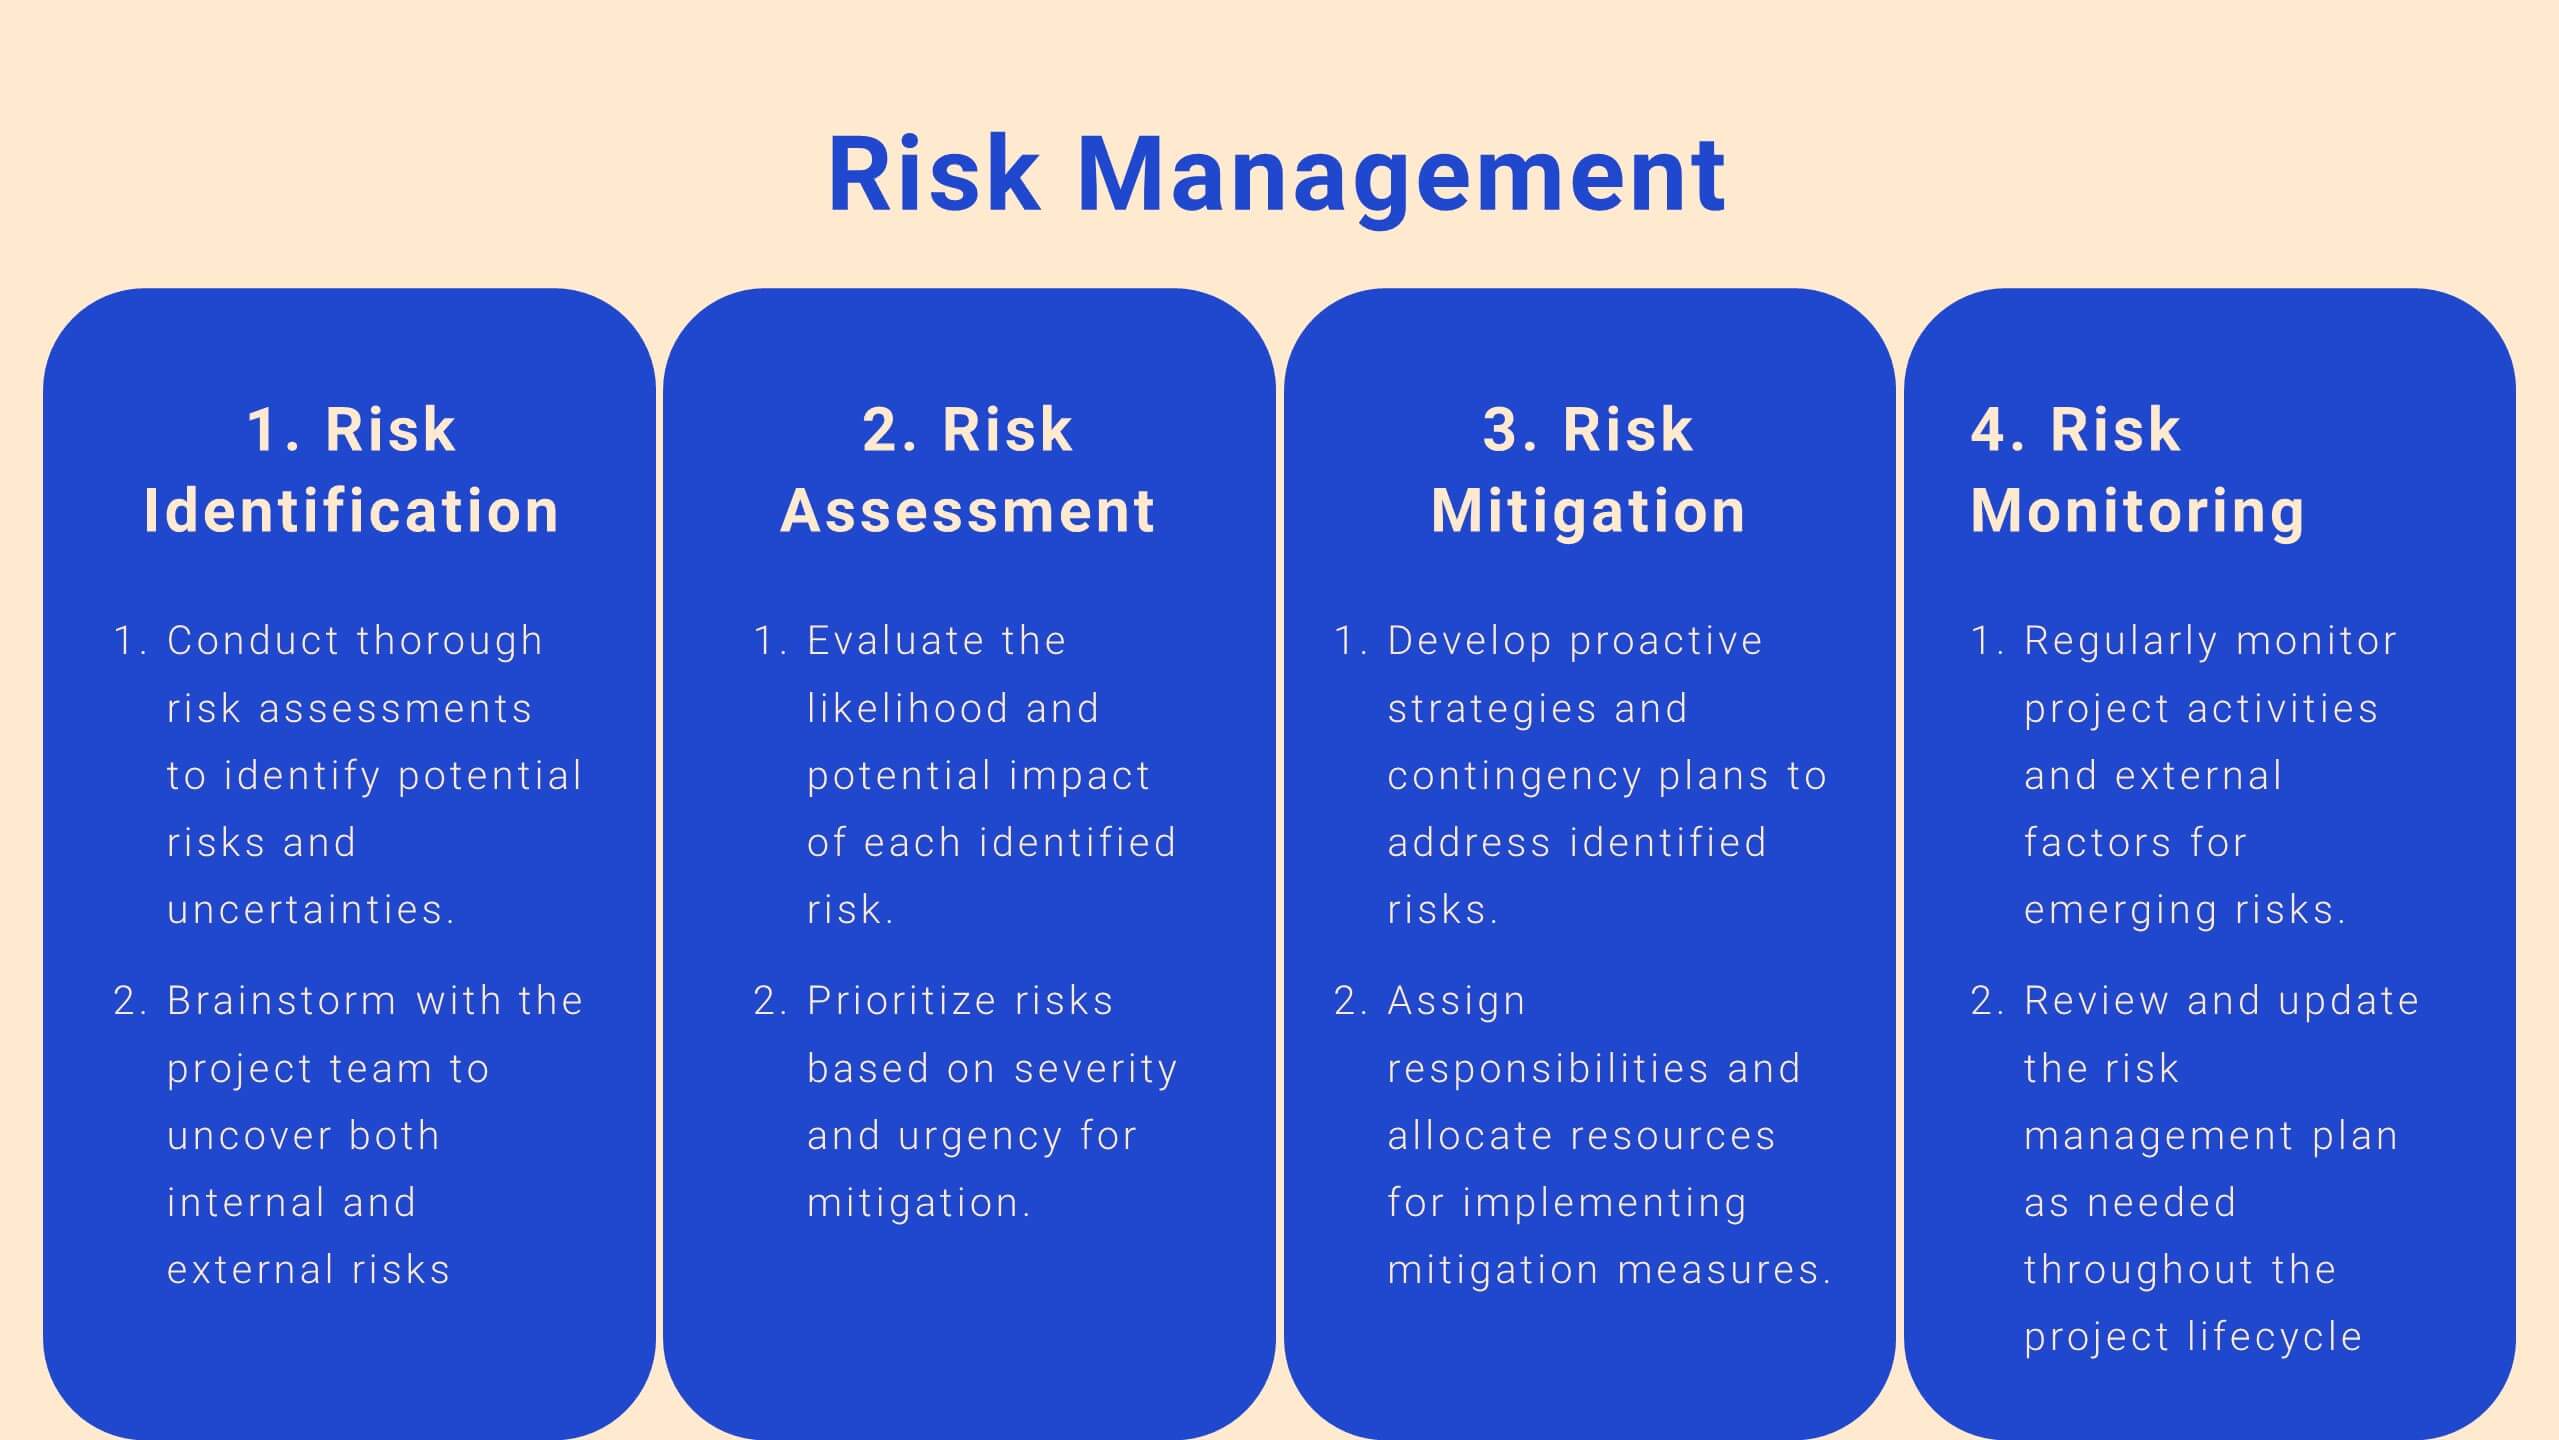
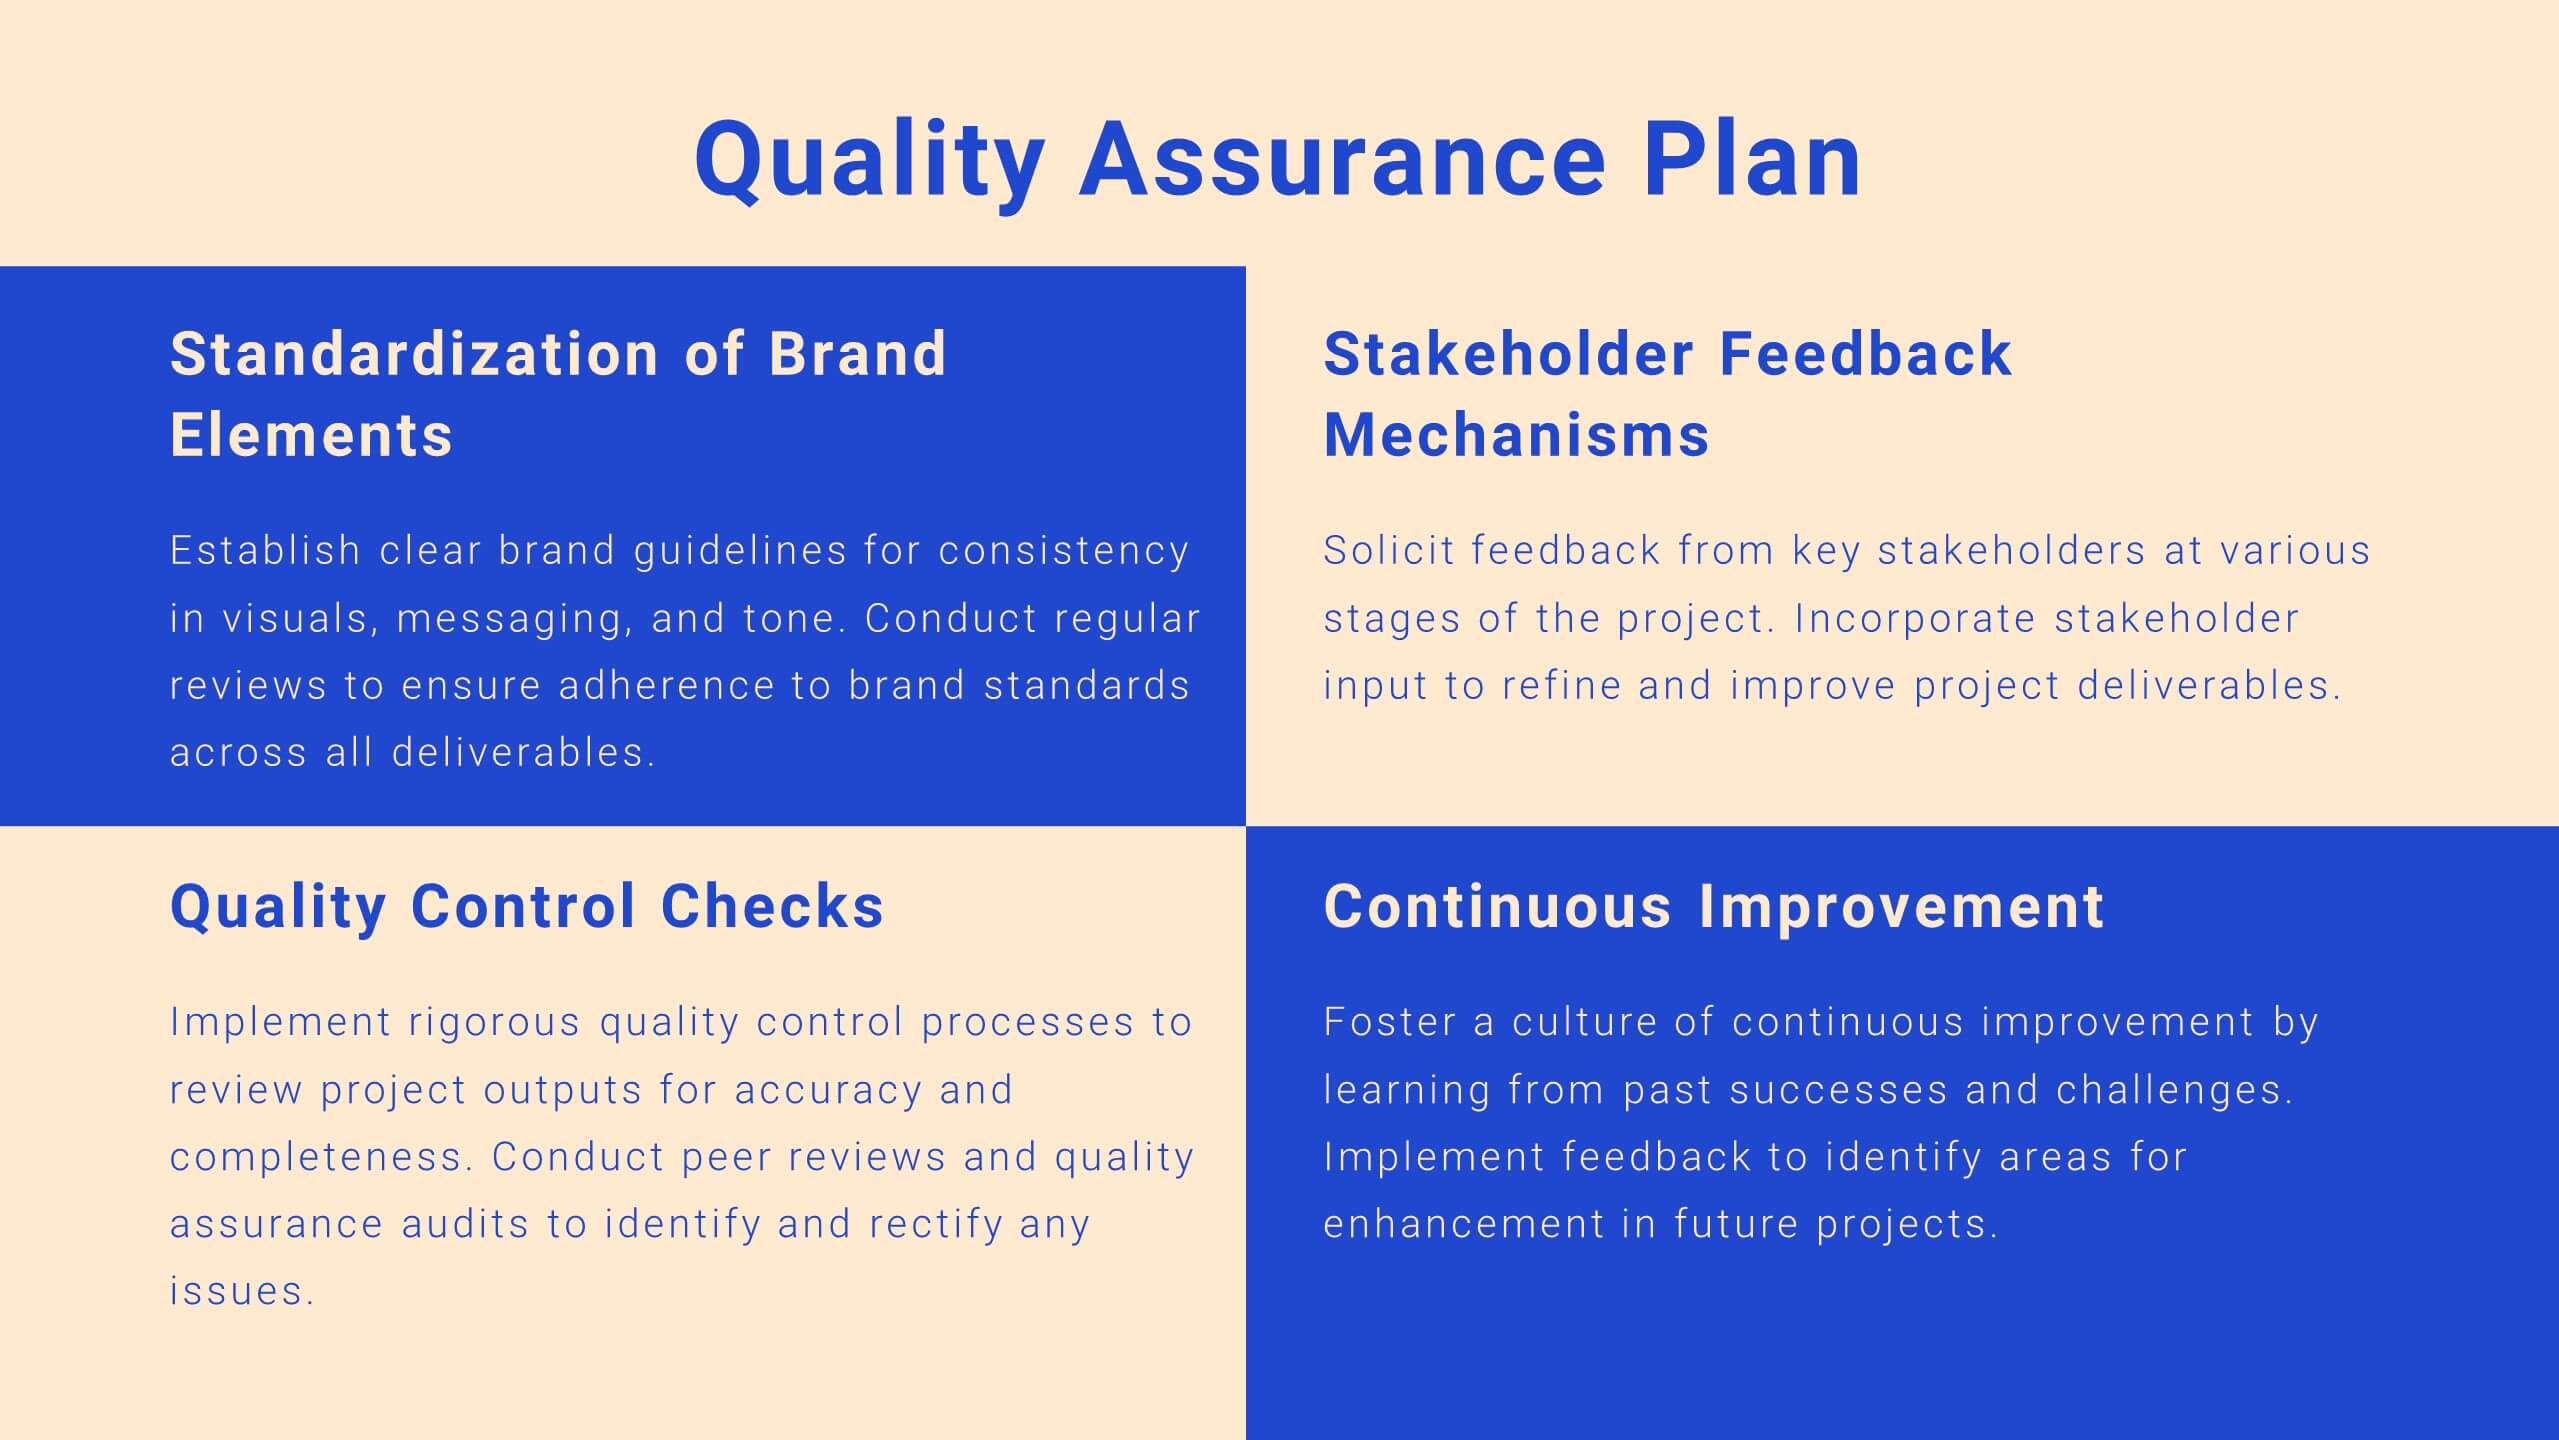
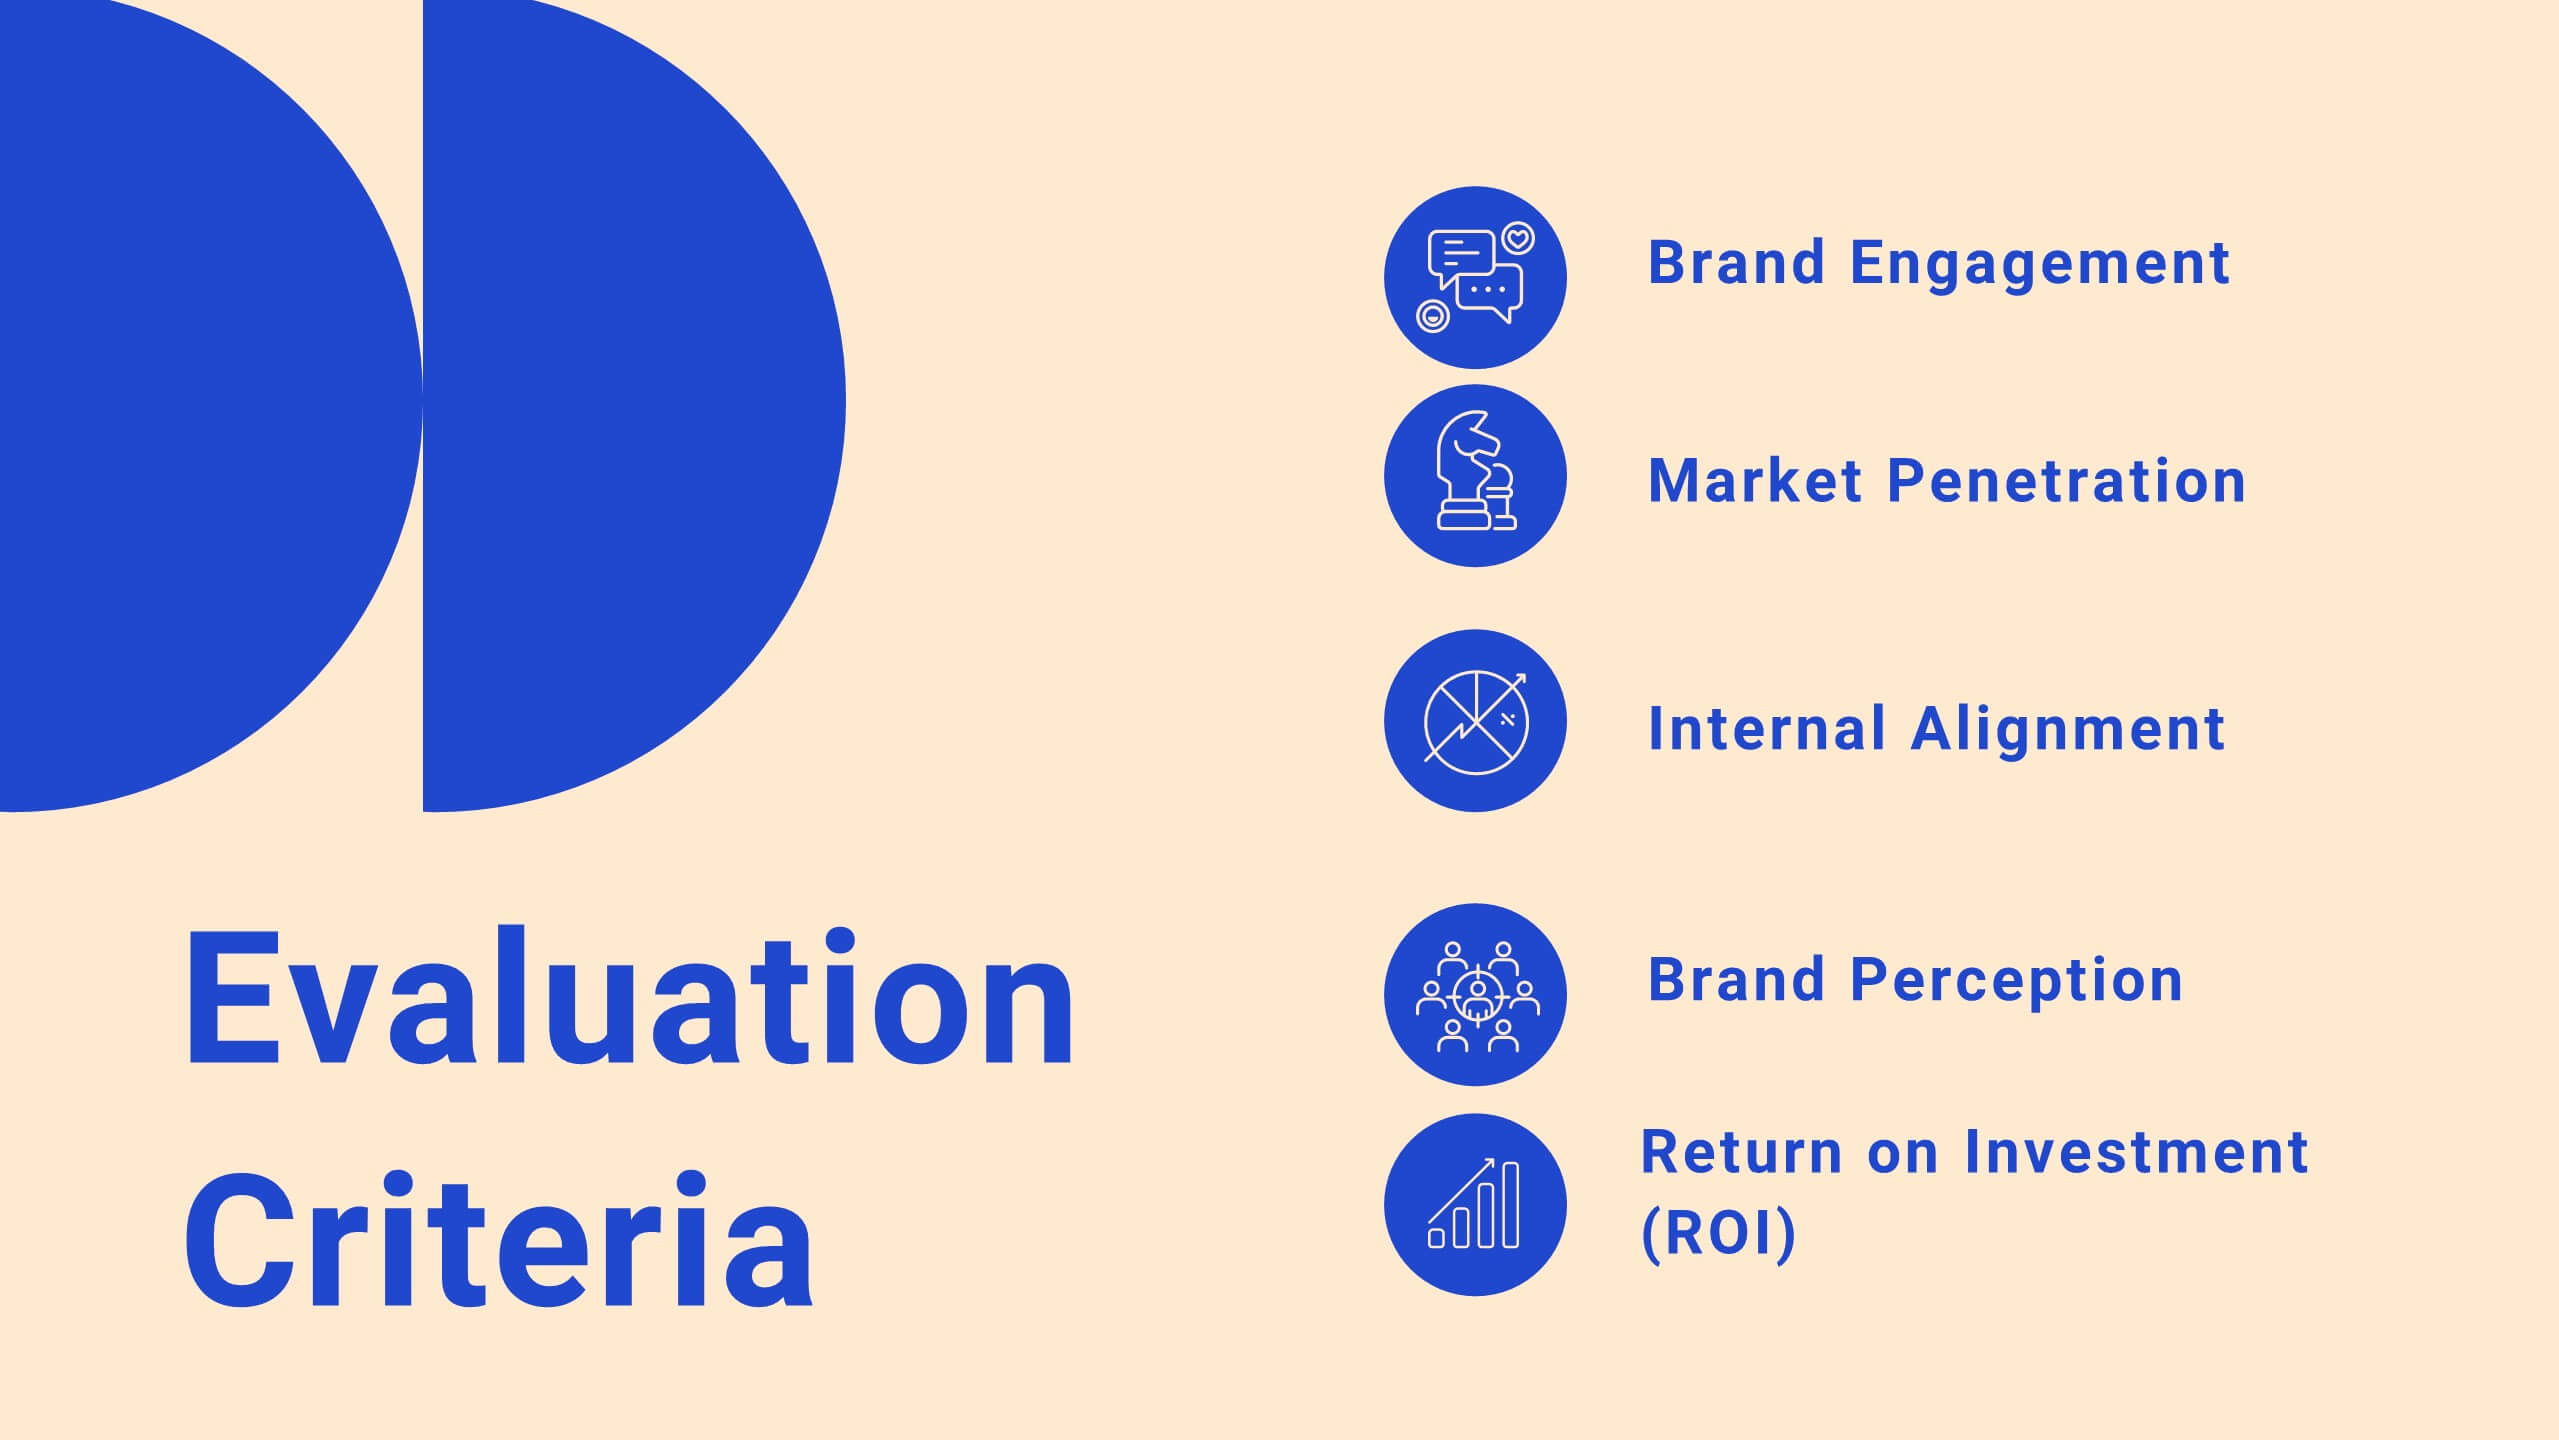
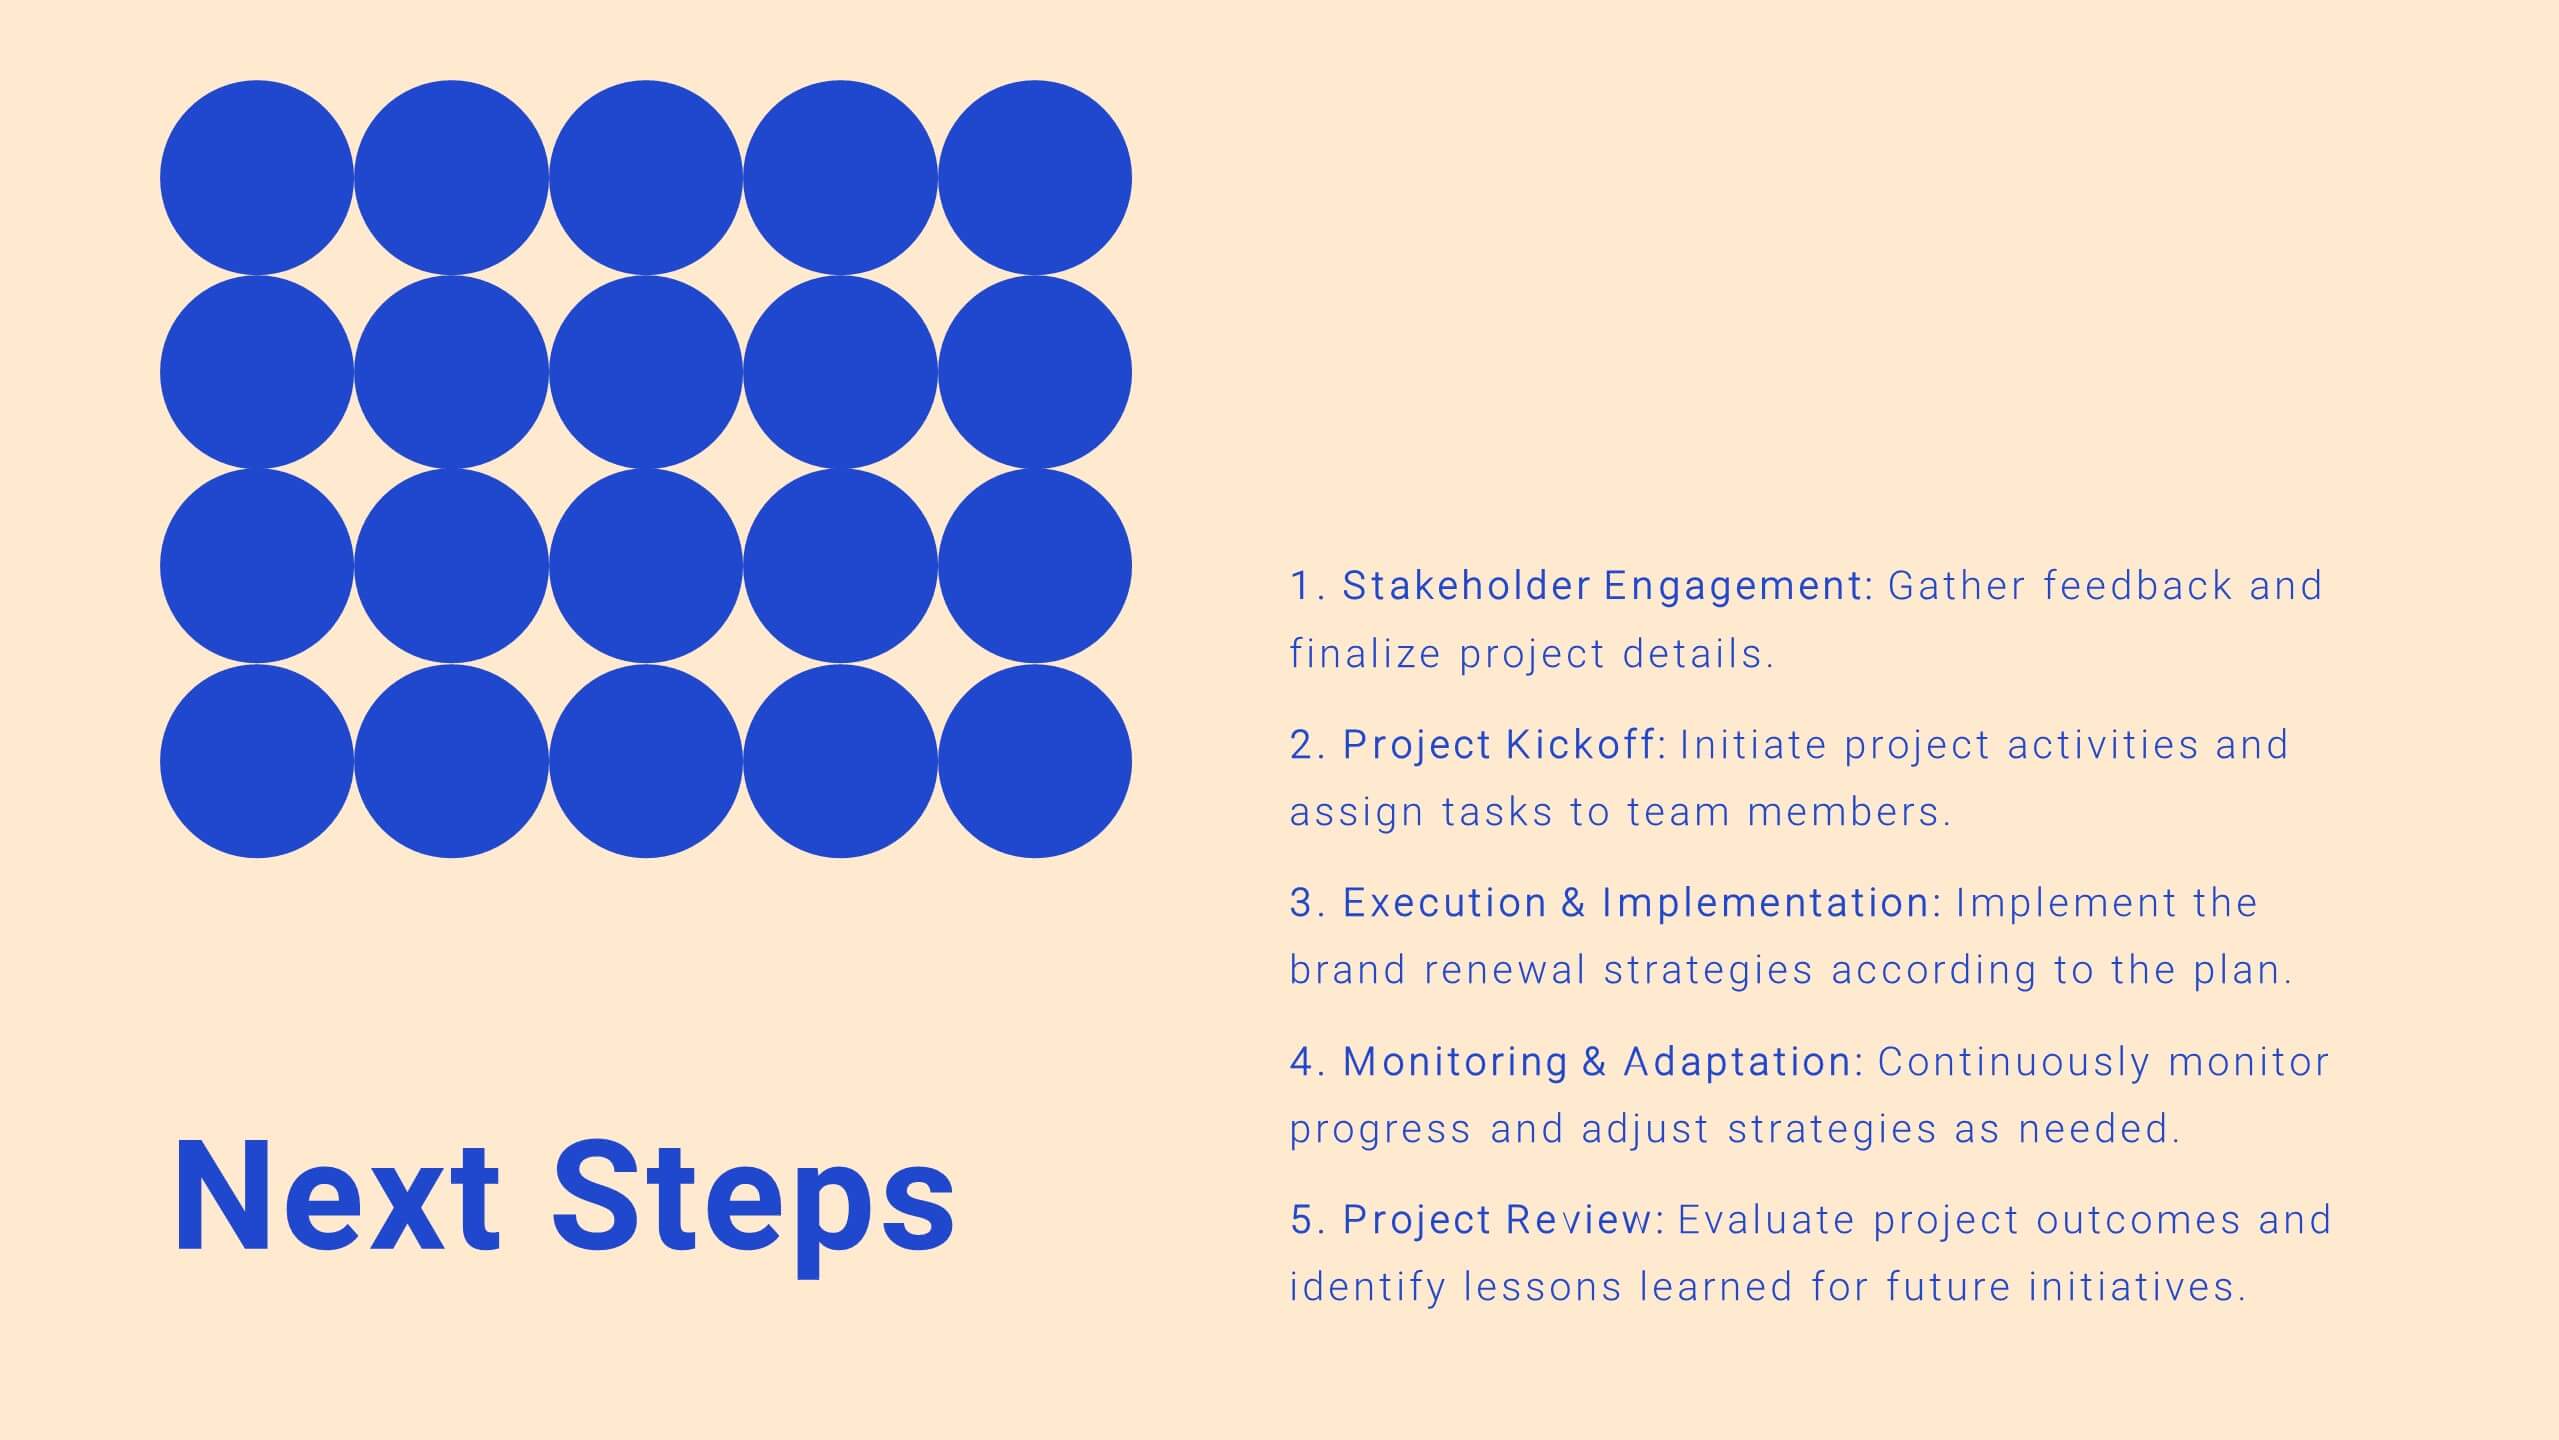
Drift Agile Project Plan Presentation
Take control of your projects with this comprehensive project plan template! From introductions to detailed objectives, this template covers scope of work, methodology, timelines, budget breakdowns, and risk management. Ideal for ensuring your project stays on track, it also includes stakeholder analysis and quality assurance plans. Compatible with PowerPoint, Keynote, and Google Slides.


6 slides
McKinsey 7S Advantage Infographic
The McKinsey 7S model is a strategic management framework developed by consulting firm McKinsey & Company in the 1980s. This infographic template helps explain and understand the McKinsey 7S framework, a widely used management model for organizational effectiveness. This template provides an informative overview of the seven key elements of the framework, their interrelationships, and their impact on organizational performance. This template is designed for professionals, consultants, or anyone interested in understanding and applying the McKinsey 7S framework. Fully customizable and compatible with Powerpoint, Keynote, and Google Slides.


5 slides
Business Gap Identification Presentation
Identify key performance gaps from point A to B with this step-based visualization. Each arch-shaped column represents a stage in the improvement process. Use it to highlight capability gaps, missed opportunities, or strategy breakdowns. Fully editable and compatible with PowerPoint, Keynote, and Google Slides—ideal for consulting, planning, and reporting.


5 slides
Artificial Intelligence Insights Infographics
Embark on an explorative journey into the future with artificial intelligence insights infographics. Set against a visually stimulating backdrop of purple, blue, and white. It's designed for innovators, educators, and students who strive to understand and communicate the multifaceted impacts of AI in various sectors. By encapsulating trends, innovations, and challenges, these infographics are perfect for presentations, educational materials, or online content. The creative use of graphics and icons, ensures each segment of information is not only informative but also engaging, bringing clarity to the future shaped by artificial intelligence.


5 slides
Investment Portfolio & Stock Forecast Presentation
Present key investment insights with clarity using the Investment Portfolio & Stock Forecast presentation template. Featuring a central briefcase visual and surrounding data points, this layout is perfect for showcasing portfolio allocation, stock predictions, market movements, or financial planning elements. Designed for finance professionals, analysts, and advisors, it simplifies complex data into digestible visuals. Fully editable and compatible with PowerPoint, Keynote, and Google Slides.


5 slides
Customer Relationship Strategy Presentation
Refine your approach to customer interactions with the "Customer Relationship Strategy" presentation templates. Perfect for delineating clear, actionable strategies to enhance client engagement and satisfaction, these templates are a must-have for businesses focused on building lasting customer relationships. Compatible with PowerPoint, Keynote, and Google Slides, they provide the tools to effectively communicate your customer relationship policies and goals.


7 slides
Company Profile Structure Infographic
This series of templates is meticulously crafted to represent a company’s structure in a detailed and organized manner. Each template varies in design and layout, ensuring that there is a style to suit different business needs and preferences. From straightforward, clean layouts to more dynamic, visually engaging designs, these templates provide an excellent basis for companies to present their organizational structure, core team members, departmental divisions, and key business areas effectively. Key information such as company values, mission statements, and strategic objectives can be clearly highlighted, allowing companies to communicate their business essence and operational ethos to stakeholders. Each template also accommodates data visualization through charts, graphs, and infographics, which are instrumental in depicting growth trajectories, performance metrics, or demographic breakdowns. With customization options, these templates can be tailored to reflect a company's unique brand identity, including color schemes, typography, and corporate logos, making each presentation not only informative but also reflective of the company's image. This collection is ideal for corporate introductions, stakeholder meetings, and internal presentations aimed at fostering a clear understanding of the company’s operational framework and strategic direction.


6 slides
Strategic Next Steps Planning Presentation
Bring your strategy to life with a clear, visual roadmap that guides audiences through each phase of your plan. Ideal for outlining goals, milestones, and next steps, this layout makes progress easy to follow and professional to present. Compatible with PowerPoint, Keynote, and Google Slides for effortless customization.


21 slides
Dreamwood Sales Pitch Deck Presentation
Deliver powerful sales presentations with this vibrant and engaging sales pitch deck template! It provides all essential sections, including sales objectives, customer testimonials, pricing strategy, and performance metrics, to help you leave a lasting impact. Perfect for business teams and client pitches, it’s compatible with PowerPoint, Keynote, and Google Slides for seamless customization.


14 slides
Agenda Institutional Infographic
Our institutional agenda slide templates are meticulously designed to cater to educational institutions, government bodies, and other large organizations. These templates help in organizing and presenting meeting agendas to ensure clear communication and systematic discussion of points in large-scale meetings. These templates feature a range of designs from sleek, modern minimalist styles to more structured and detailed layouts that incorporate elements like timelines, photo placeholders, and detailed text areas. They are perfect for outlining the sequence of topics, discussion points, key speakers, and timelines, enhancing both preparation and participation during institutional meetings. Fully editable and adaptable, these templates can be tailored to match the specific branding and communication styles of your institution. The varied designs ensure that there is a template to fit the unique needs of different types of meetings, whether it's a board meeting, a faculty gathering, or an inter-departmental committee.


4 slides
Regional Analytics for North America Map Presentation
Visualize key performance metrics by region with the Regional Analytics for North America Map Presentation. This slide layout combines stacked bar visuals with a detailed map, allowing you to compare data points across multiple regions. Ideal for reporting trends, KPIs, or market analysis. Fully editable in Canva, PowerPoint, and Google Slides.


5 slides
Digital Marketing Plan Presentation
Build momentum for your online strategy with a clean, structured layout that turns complex ideas into clear, stackable steps. This presentation helps outline goals, channels, and campaign actions in a visual flow that’s easy to follow and adapt. Fully customizable for PowerPoint, Keynote, and Google Slides.