


Features
- 3 Unique slides
- Fully editable and easy to edit in Microsoft Powerpoint, Keynote and Google Slides
- 16:9 widescreen layout
- Clean and professional designs
- Export to JPG, PDF or send by email


Do you have any questions?
Recommend


23 slides
Cosmira Digital Strategy Presentation
This Digital Strategy Presentation provides a comprehensive framework for outlining business objectives, competitive analysis, and growth opportunities. It includes key sections such as SWOT analysis, performance metrics, and implementation plans. Ideal for businesses and marketers, the slides are fully editable and compatible with PowerPoint, Keynote, and Google Slides.


21 slides
Aetherion New Product Proposal Presentation
This Product Presentation Template is designed to effectively showcase your product's features, target market, and competitive advantages. It includes sections for customer pain points, pricing strategy, technical specifications, and marketing plans. Fully customizable for PowerPoint, Keynote, and Google Slides, it's perfect for product launches and investor pitches.
22 slides
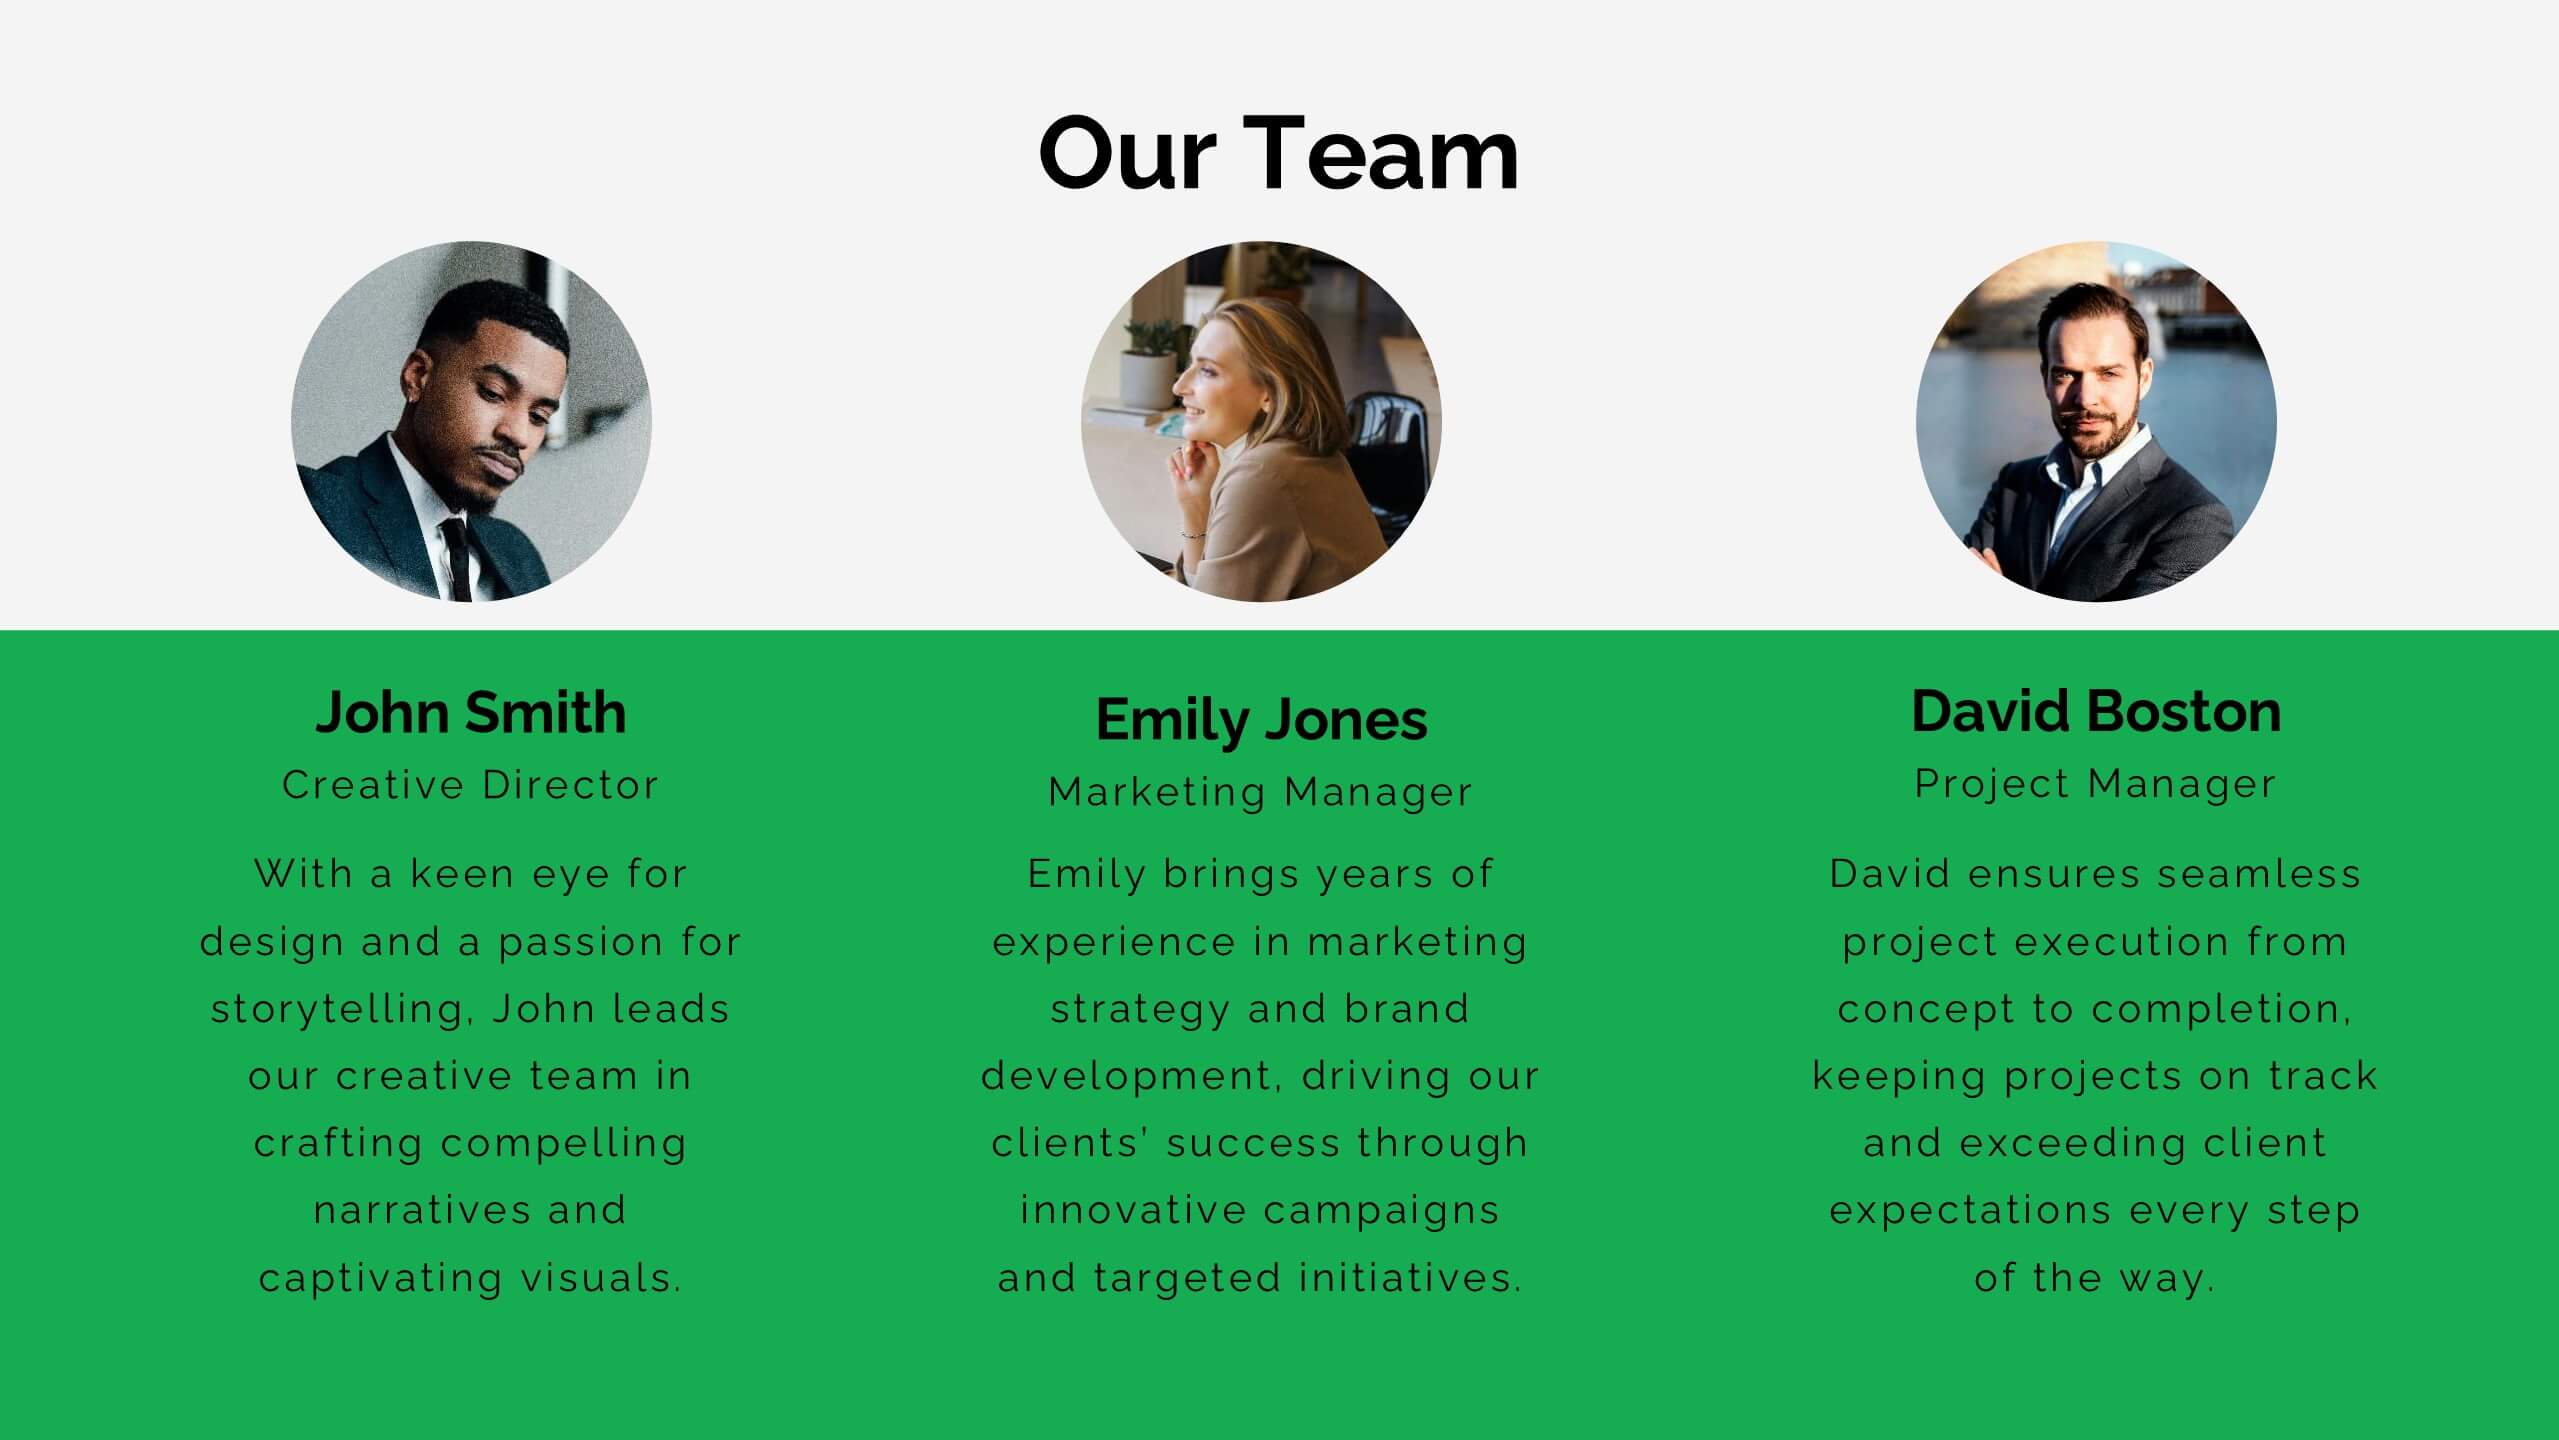
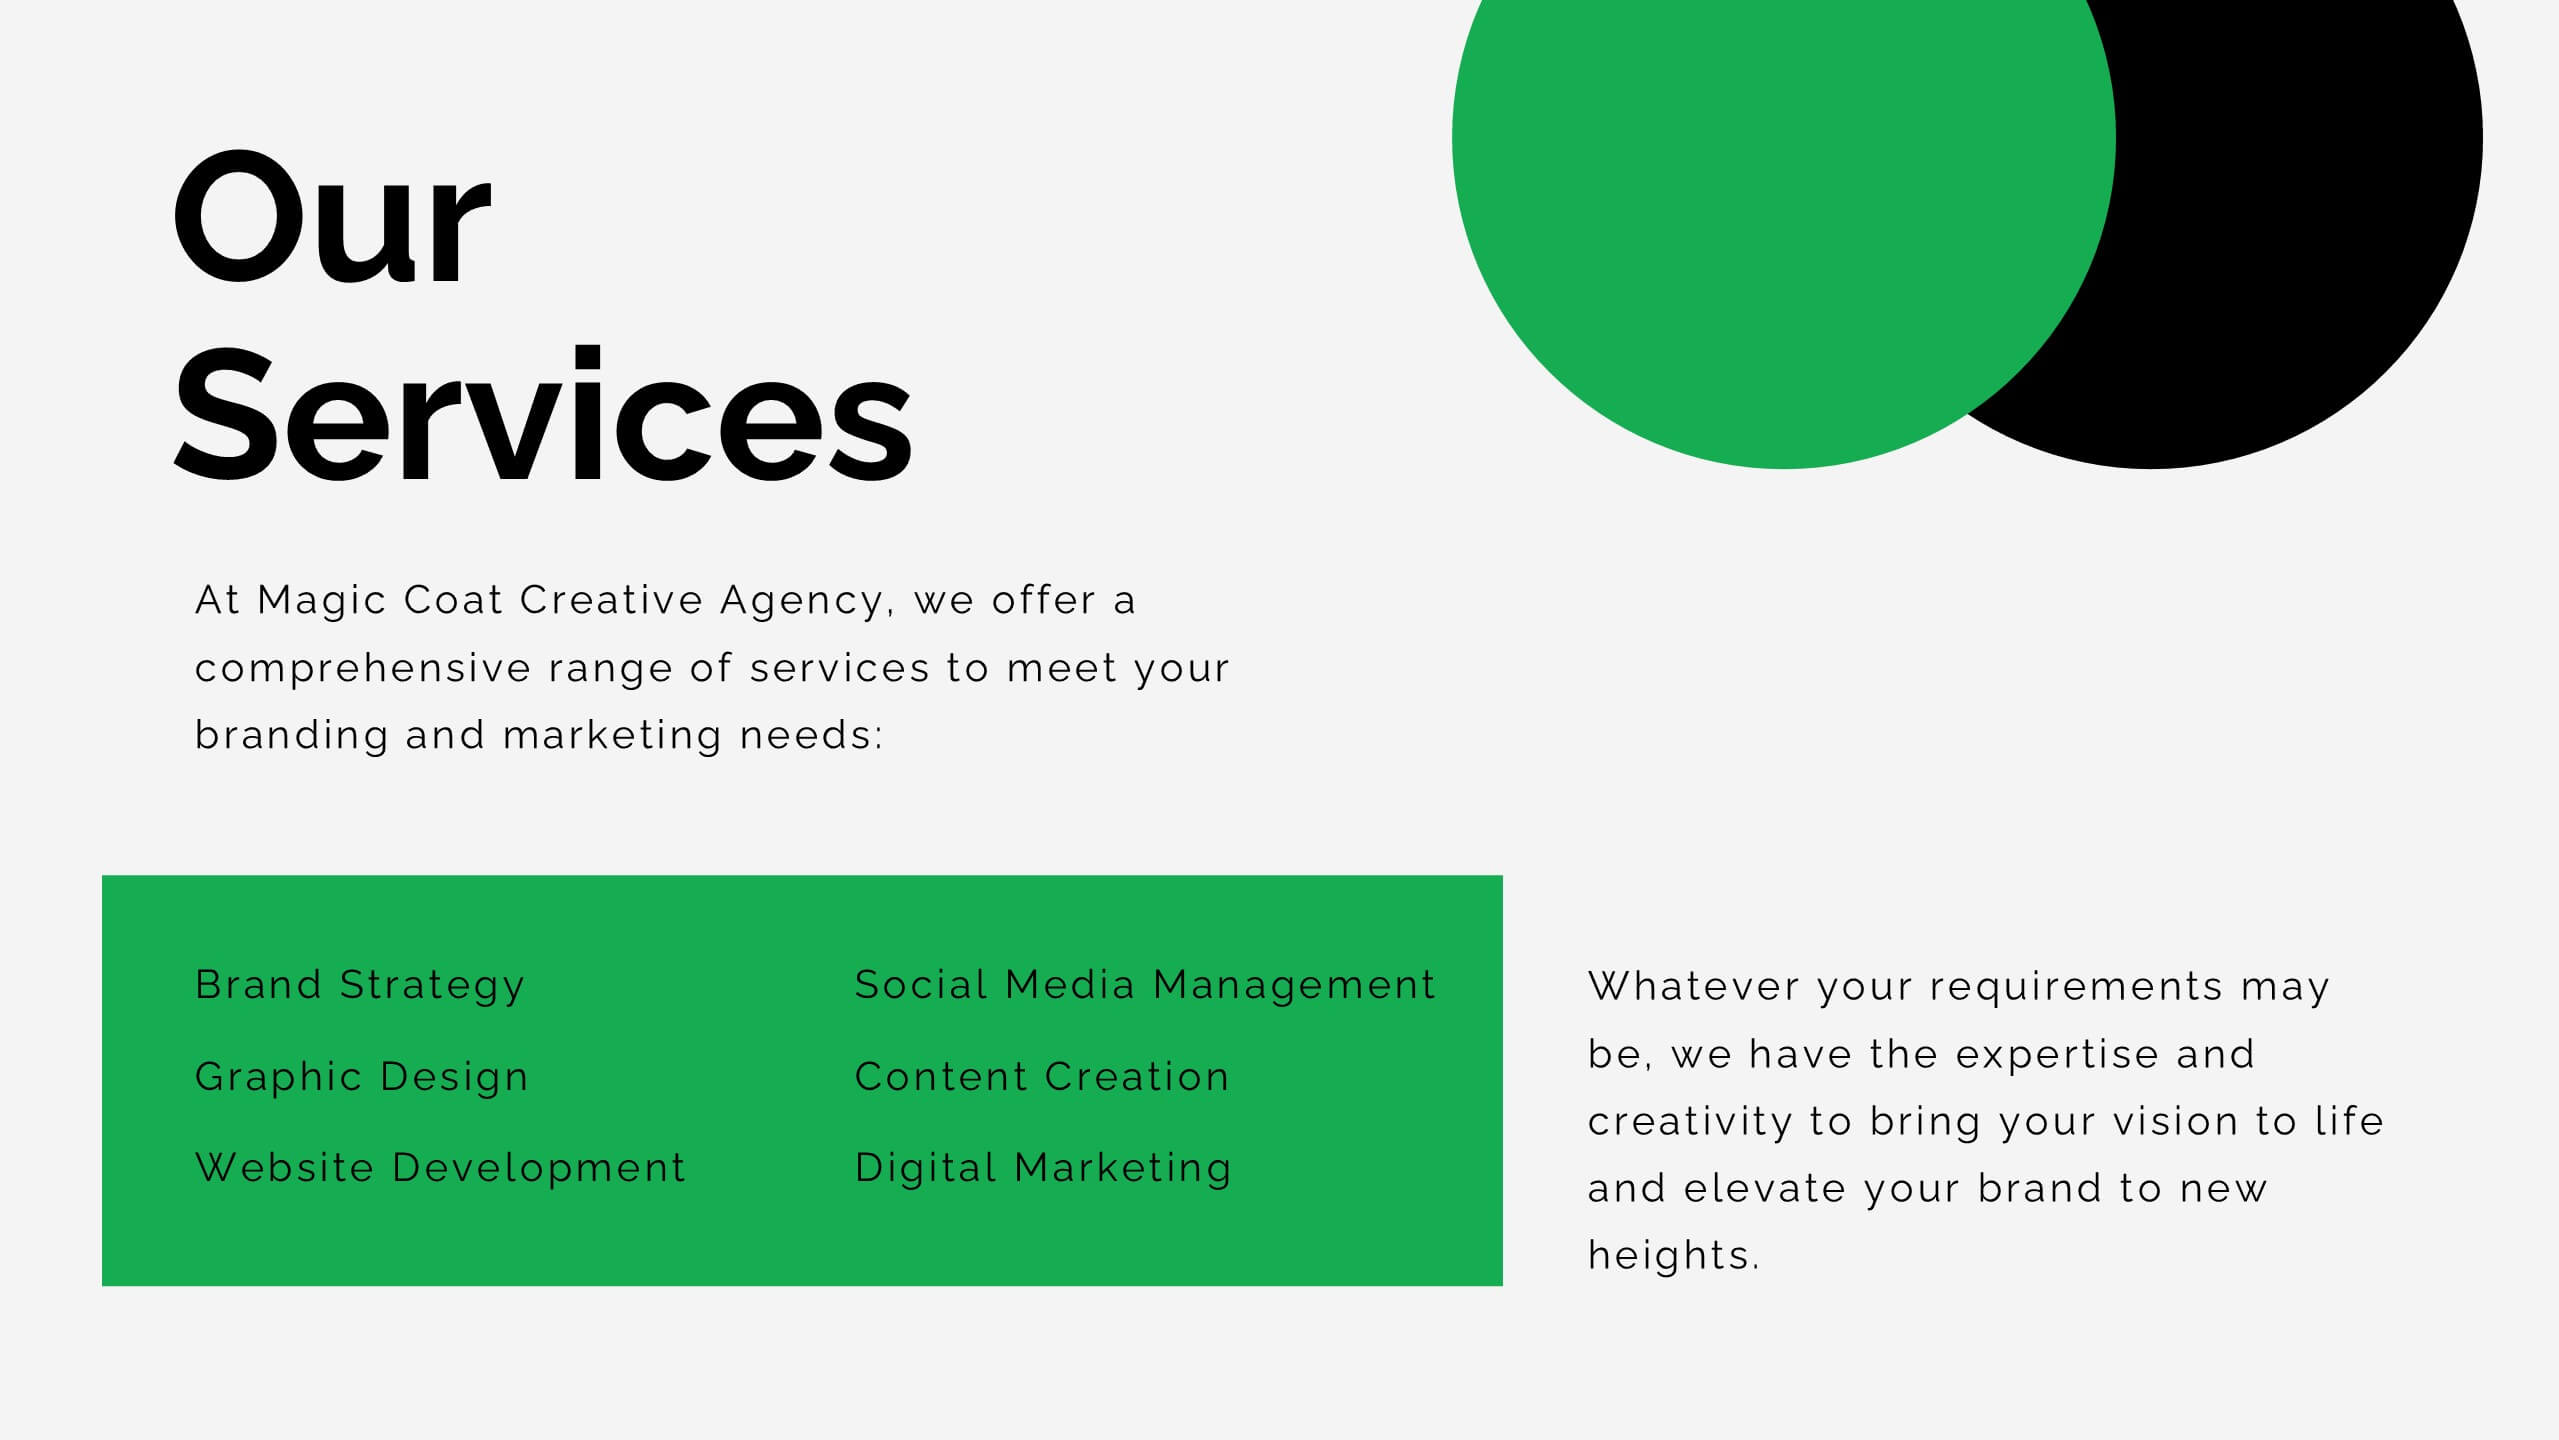
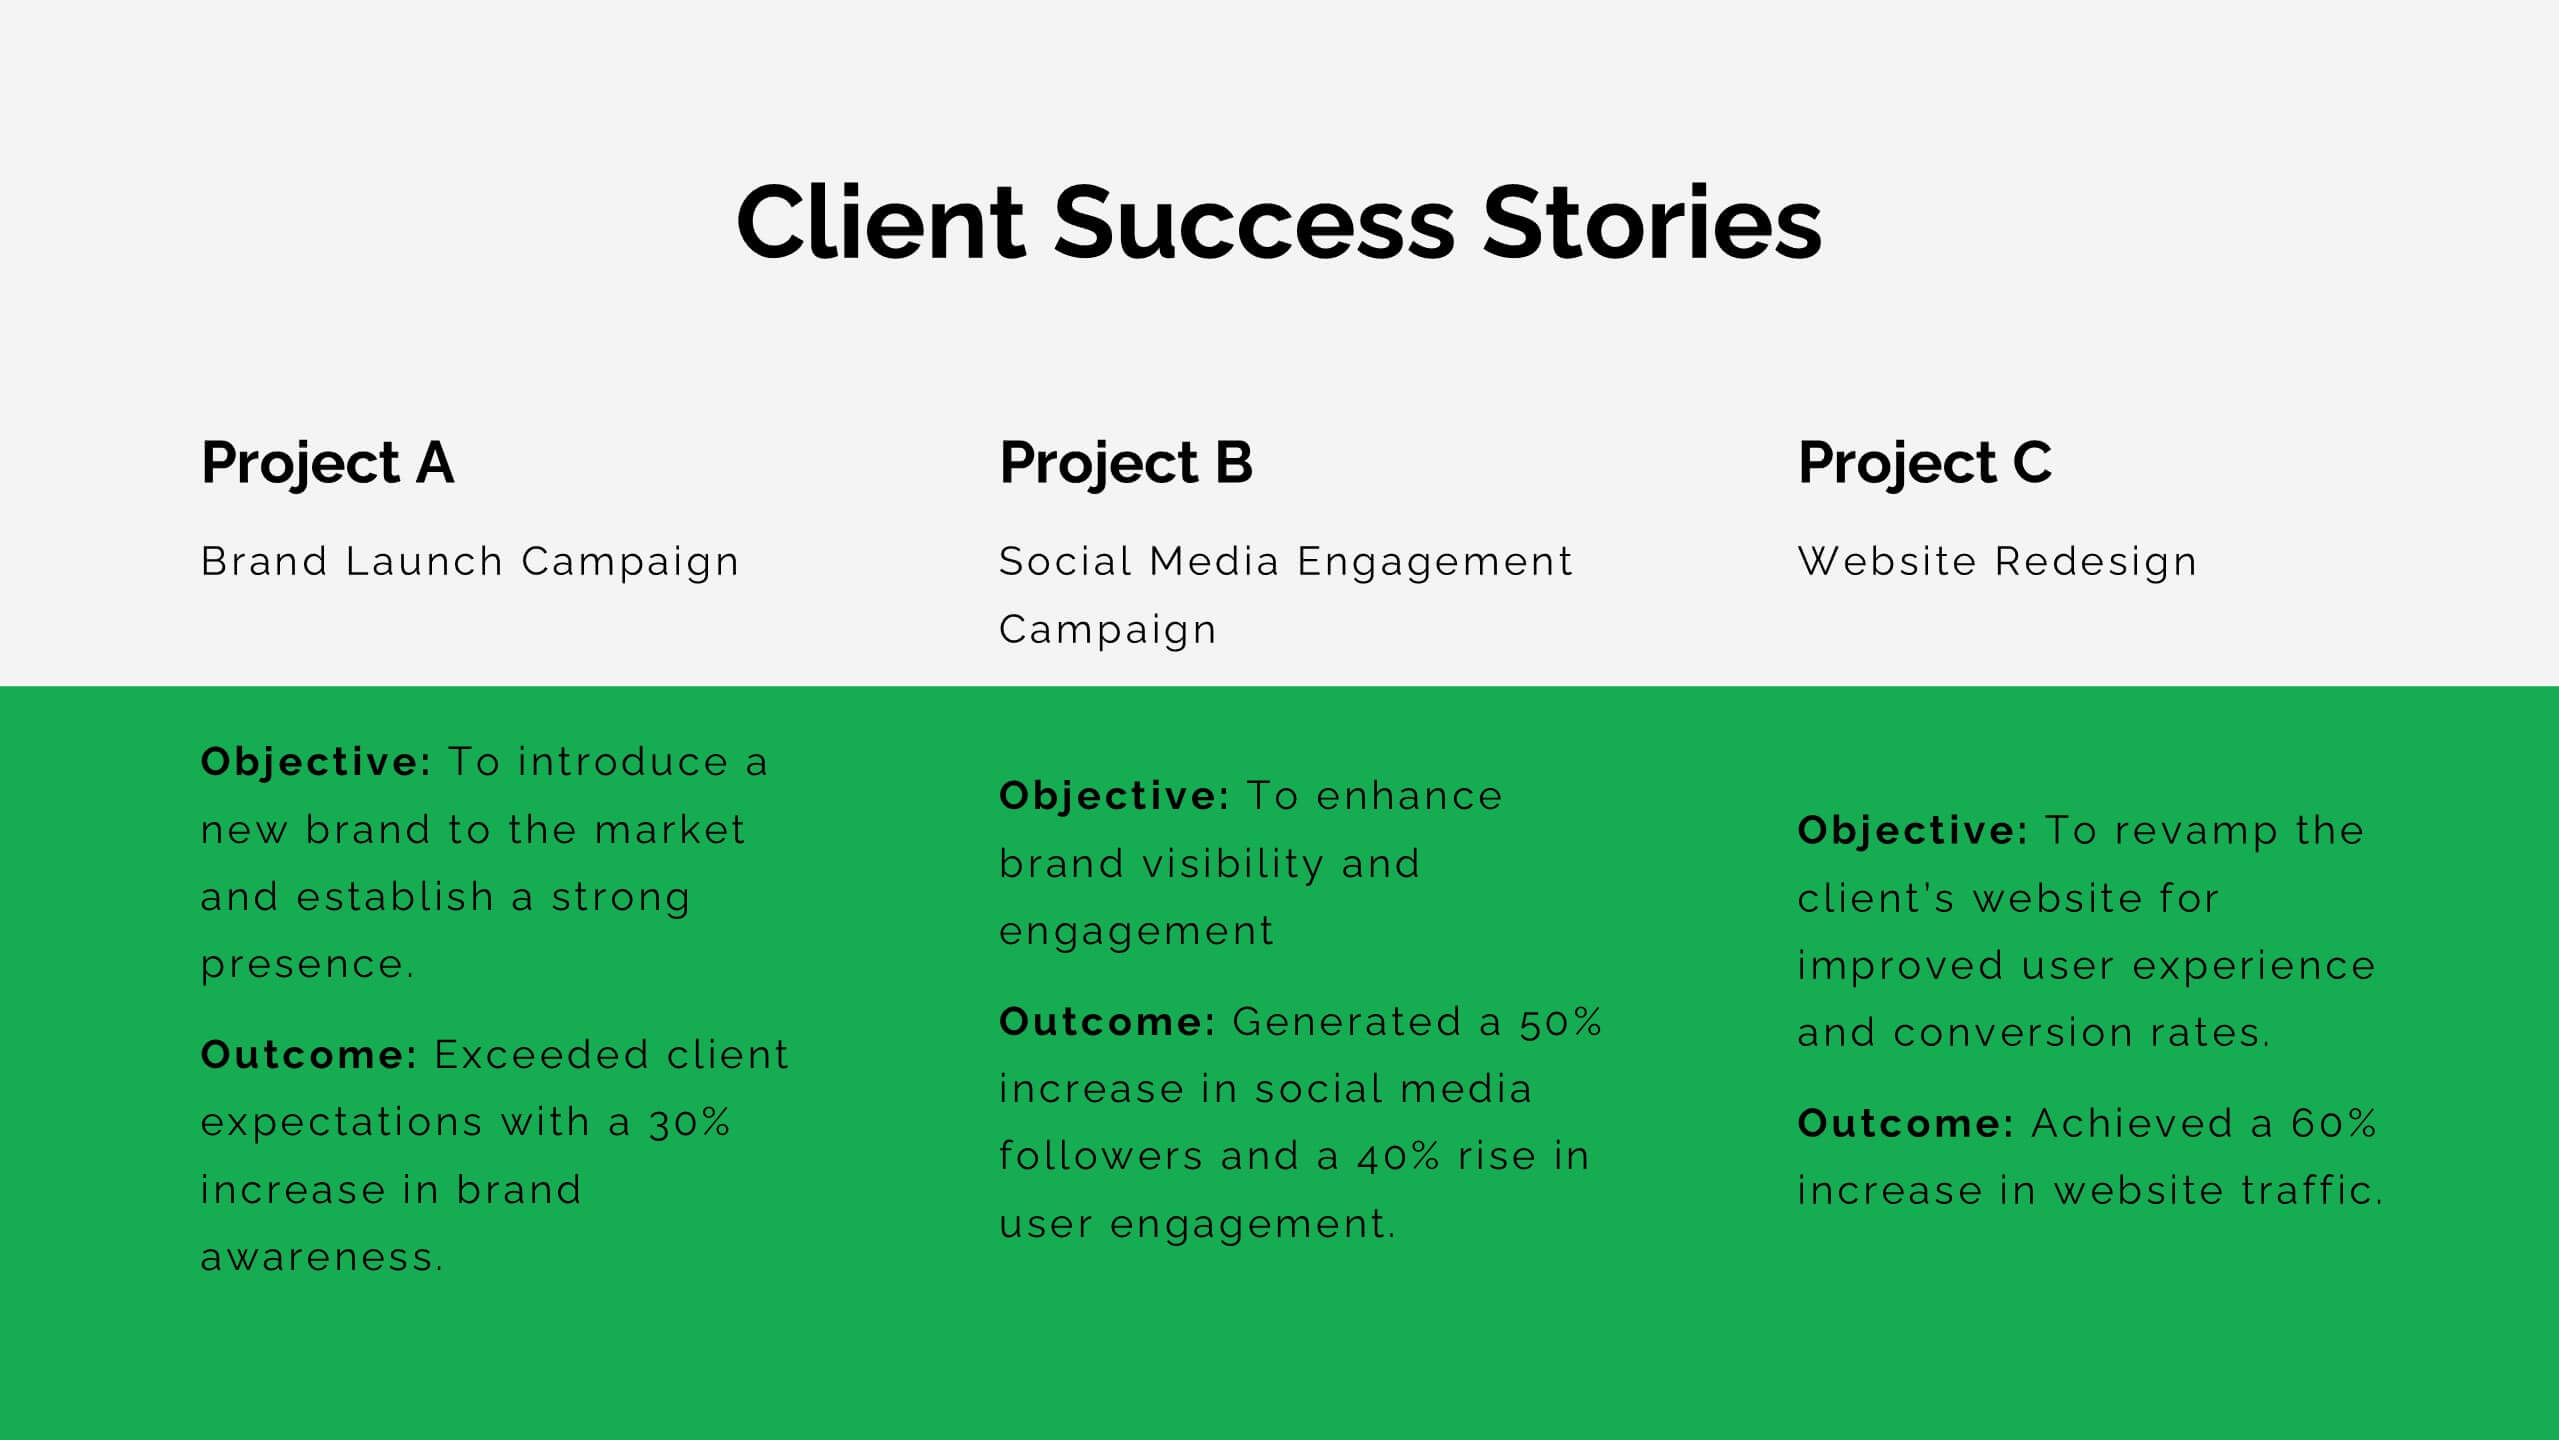
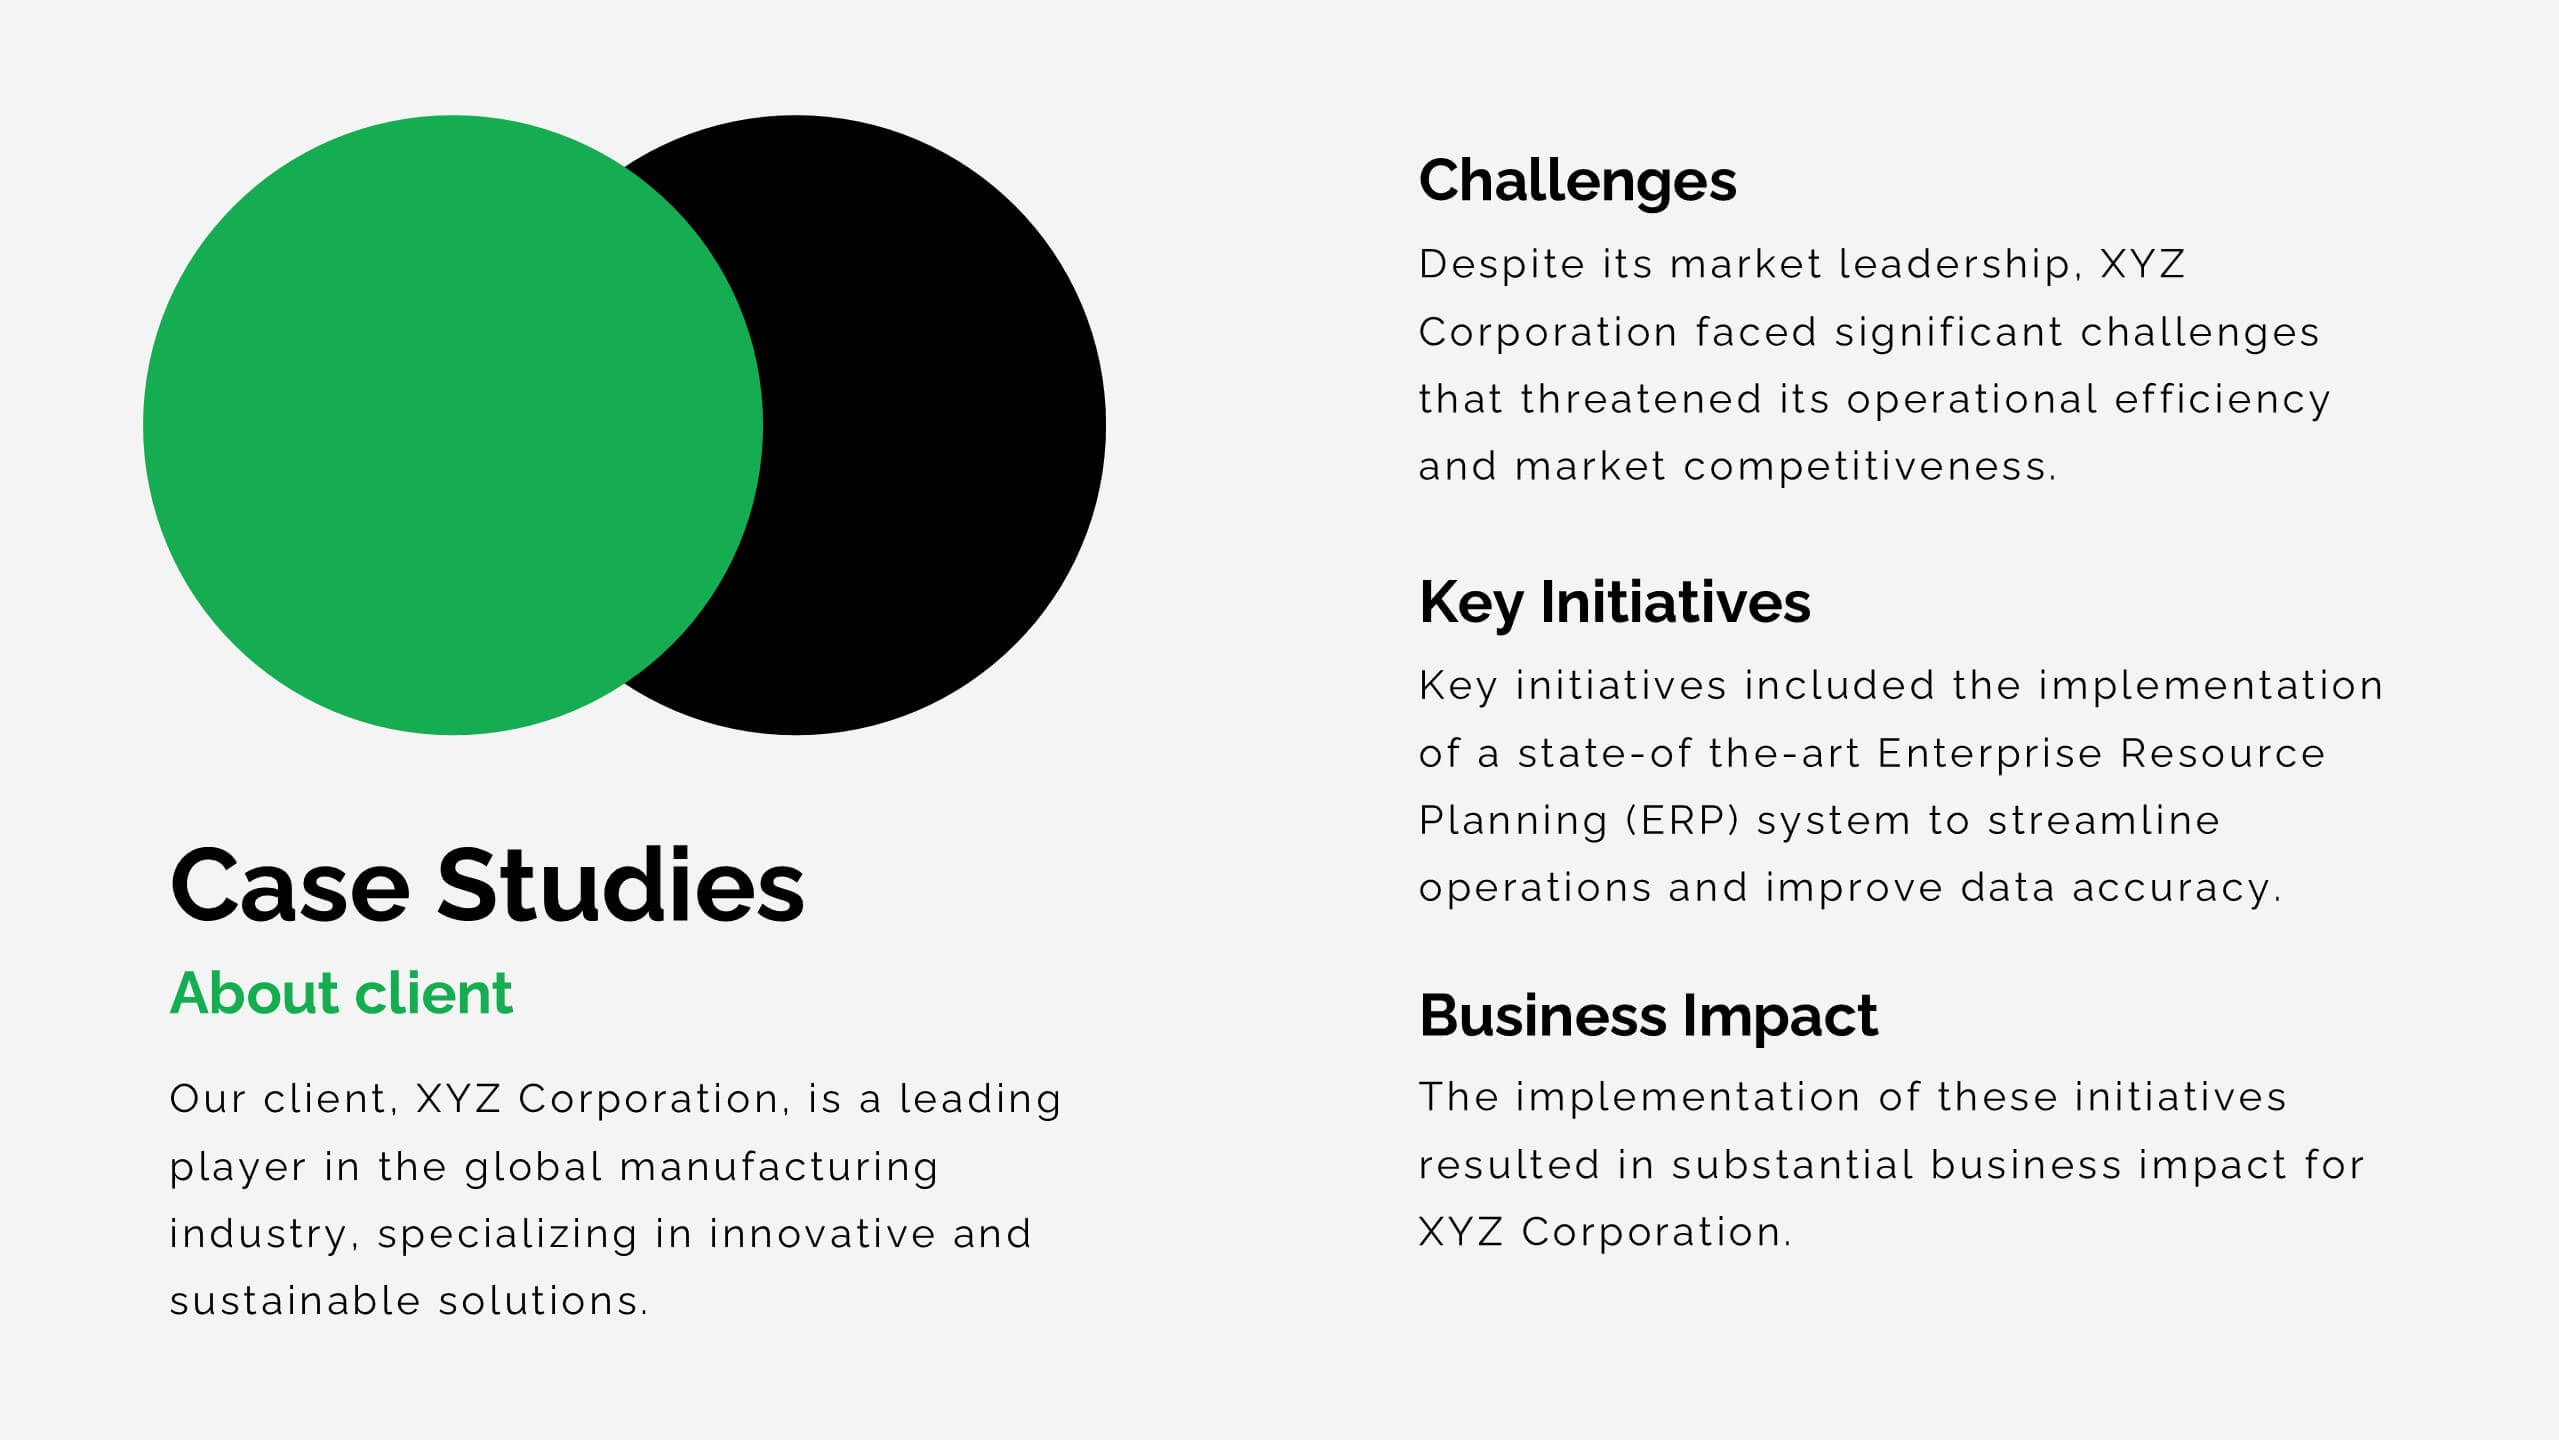
Lithium Advertising Agency Proposal Presentation
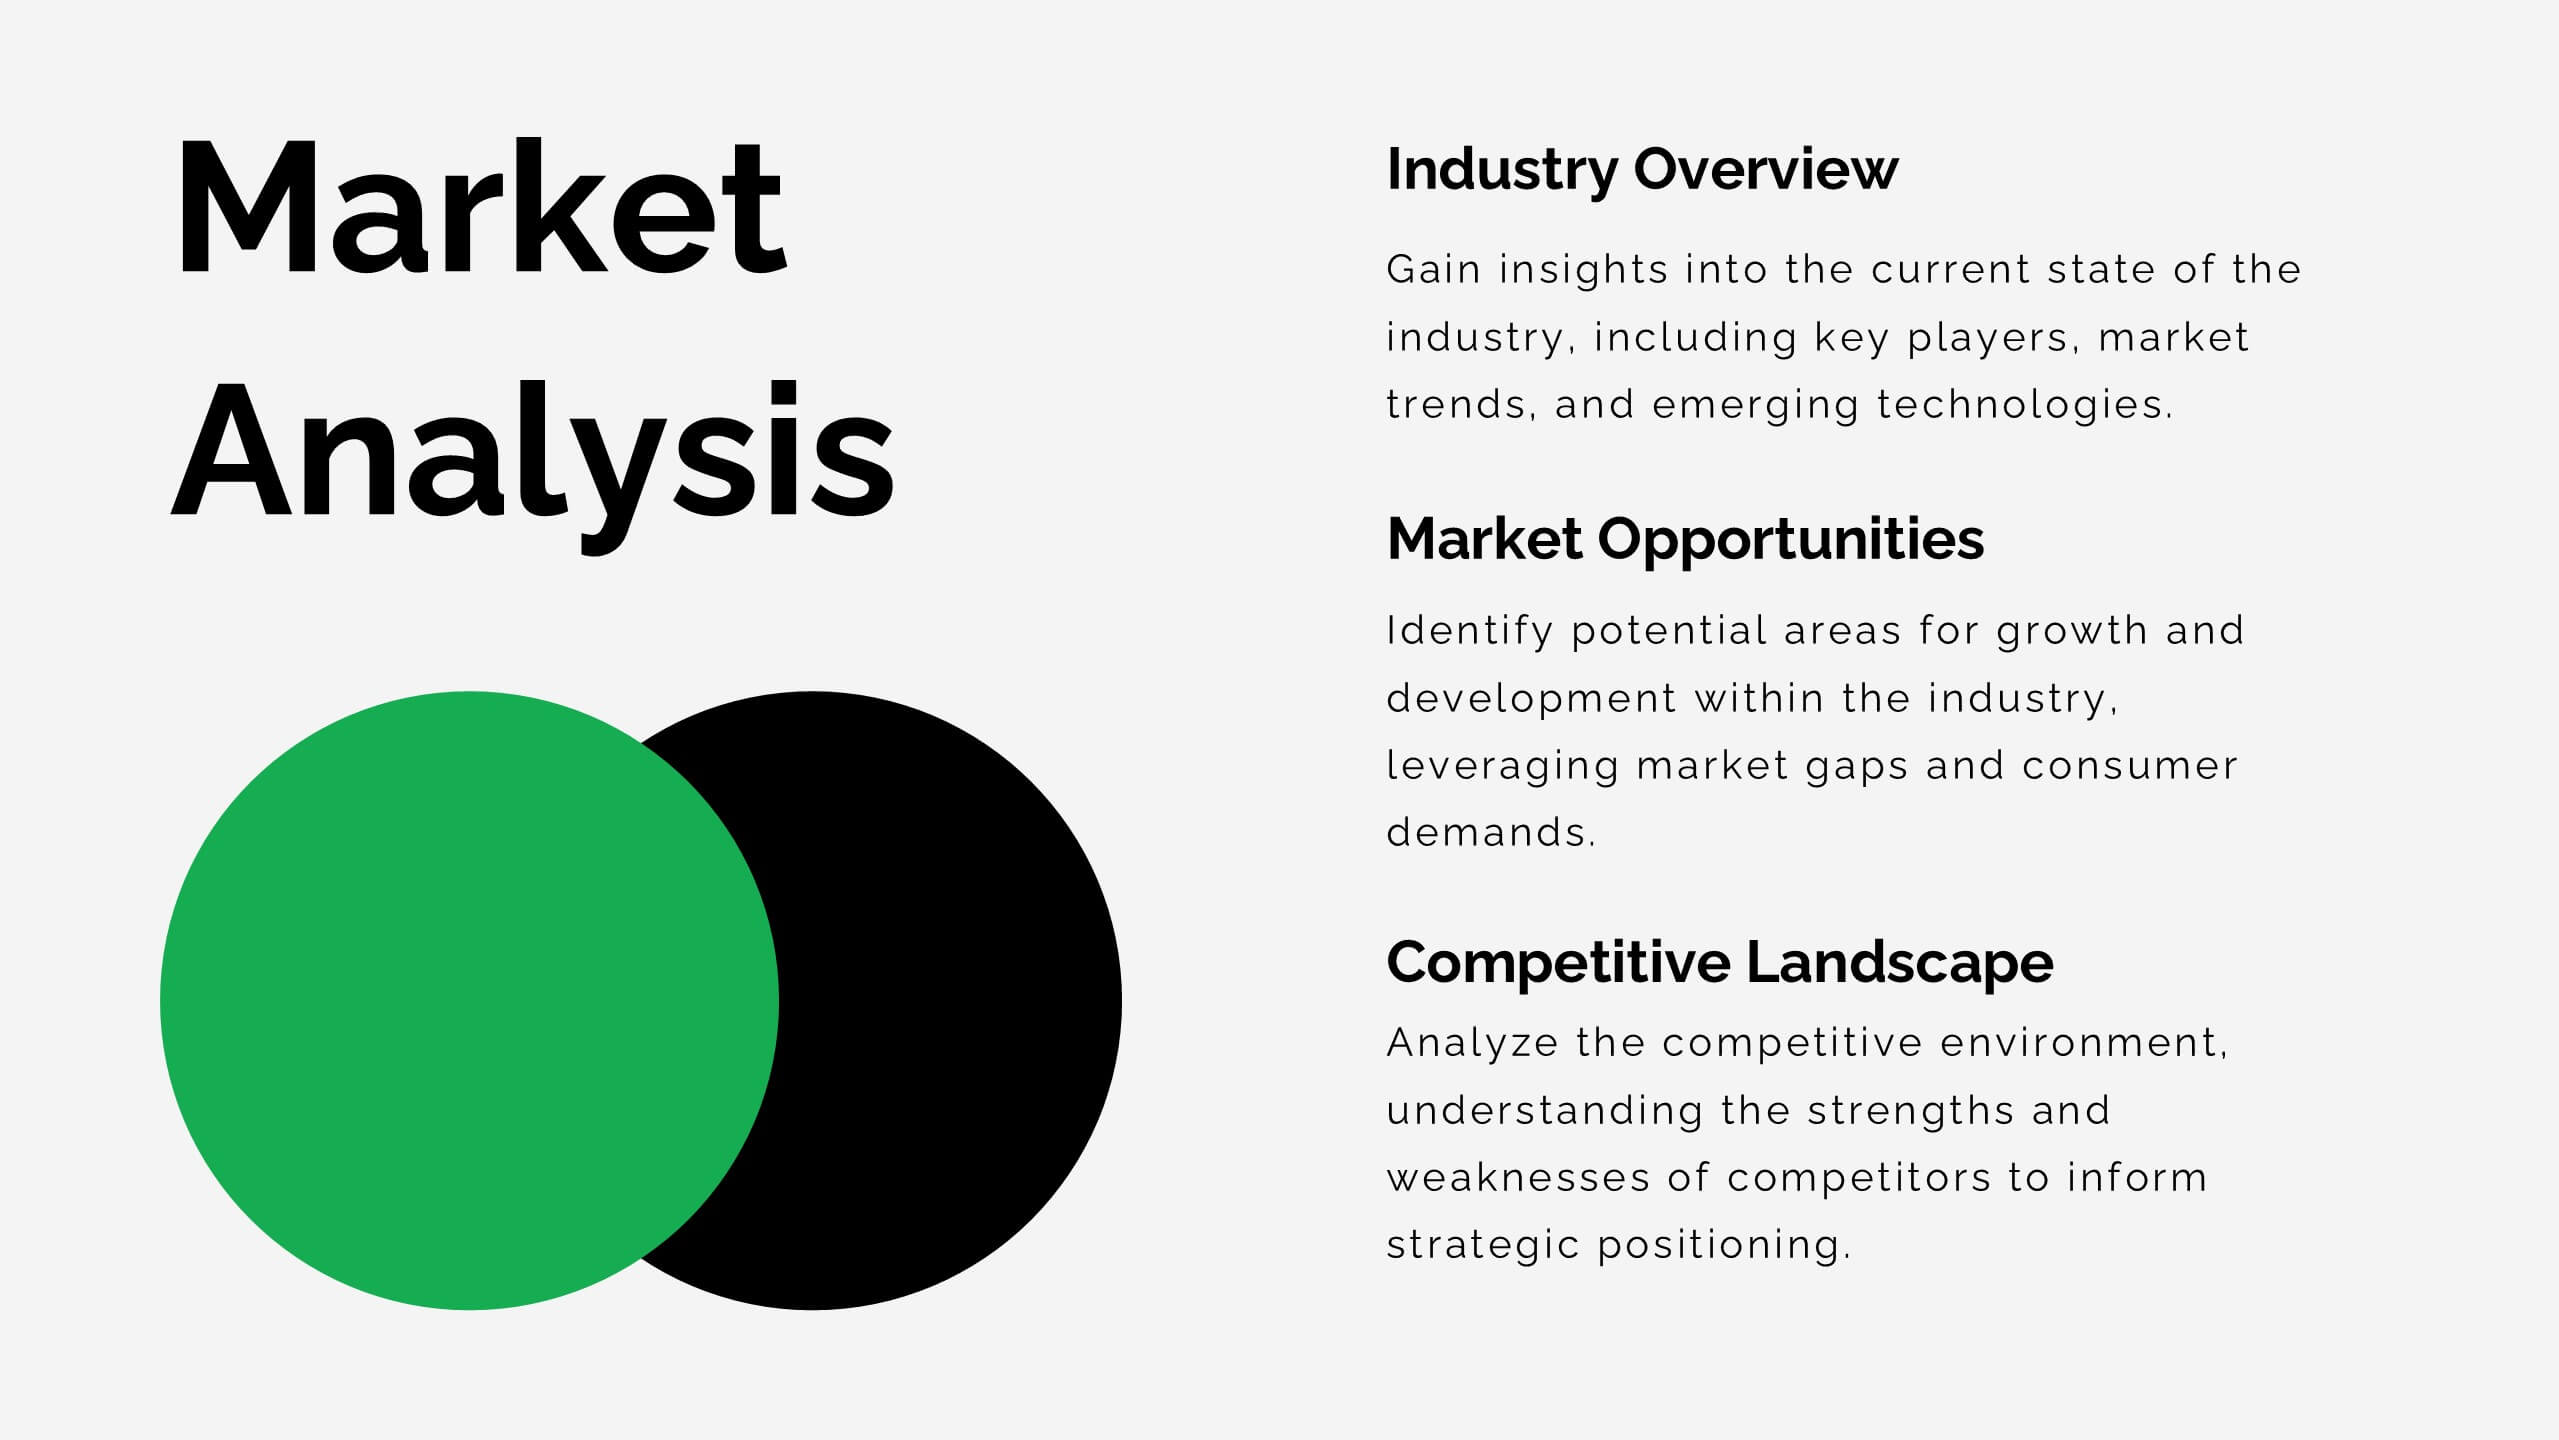
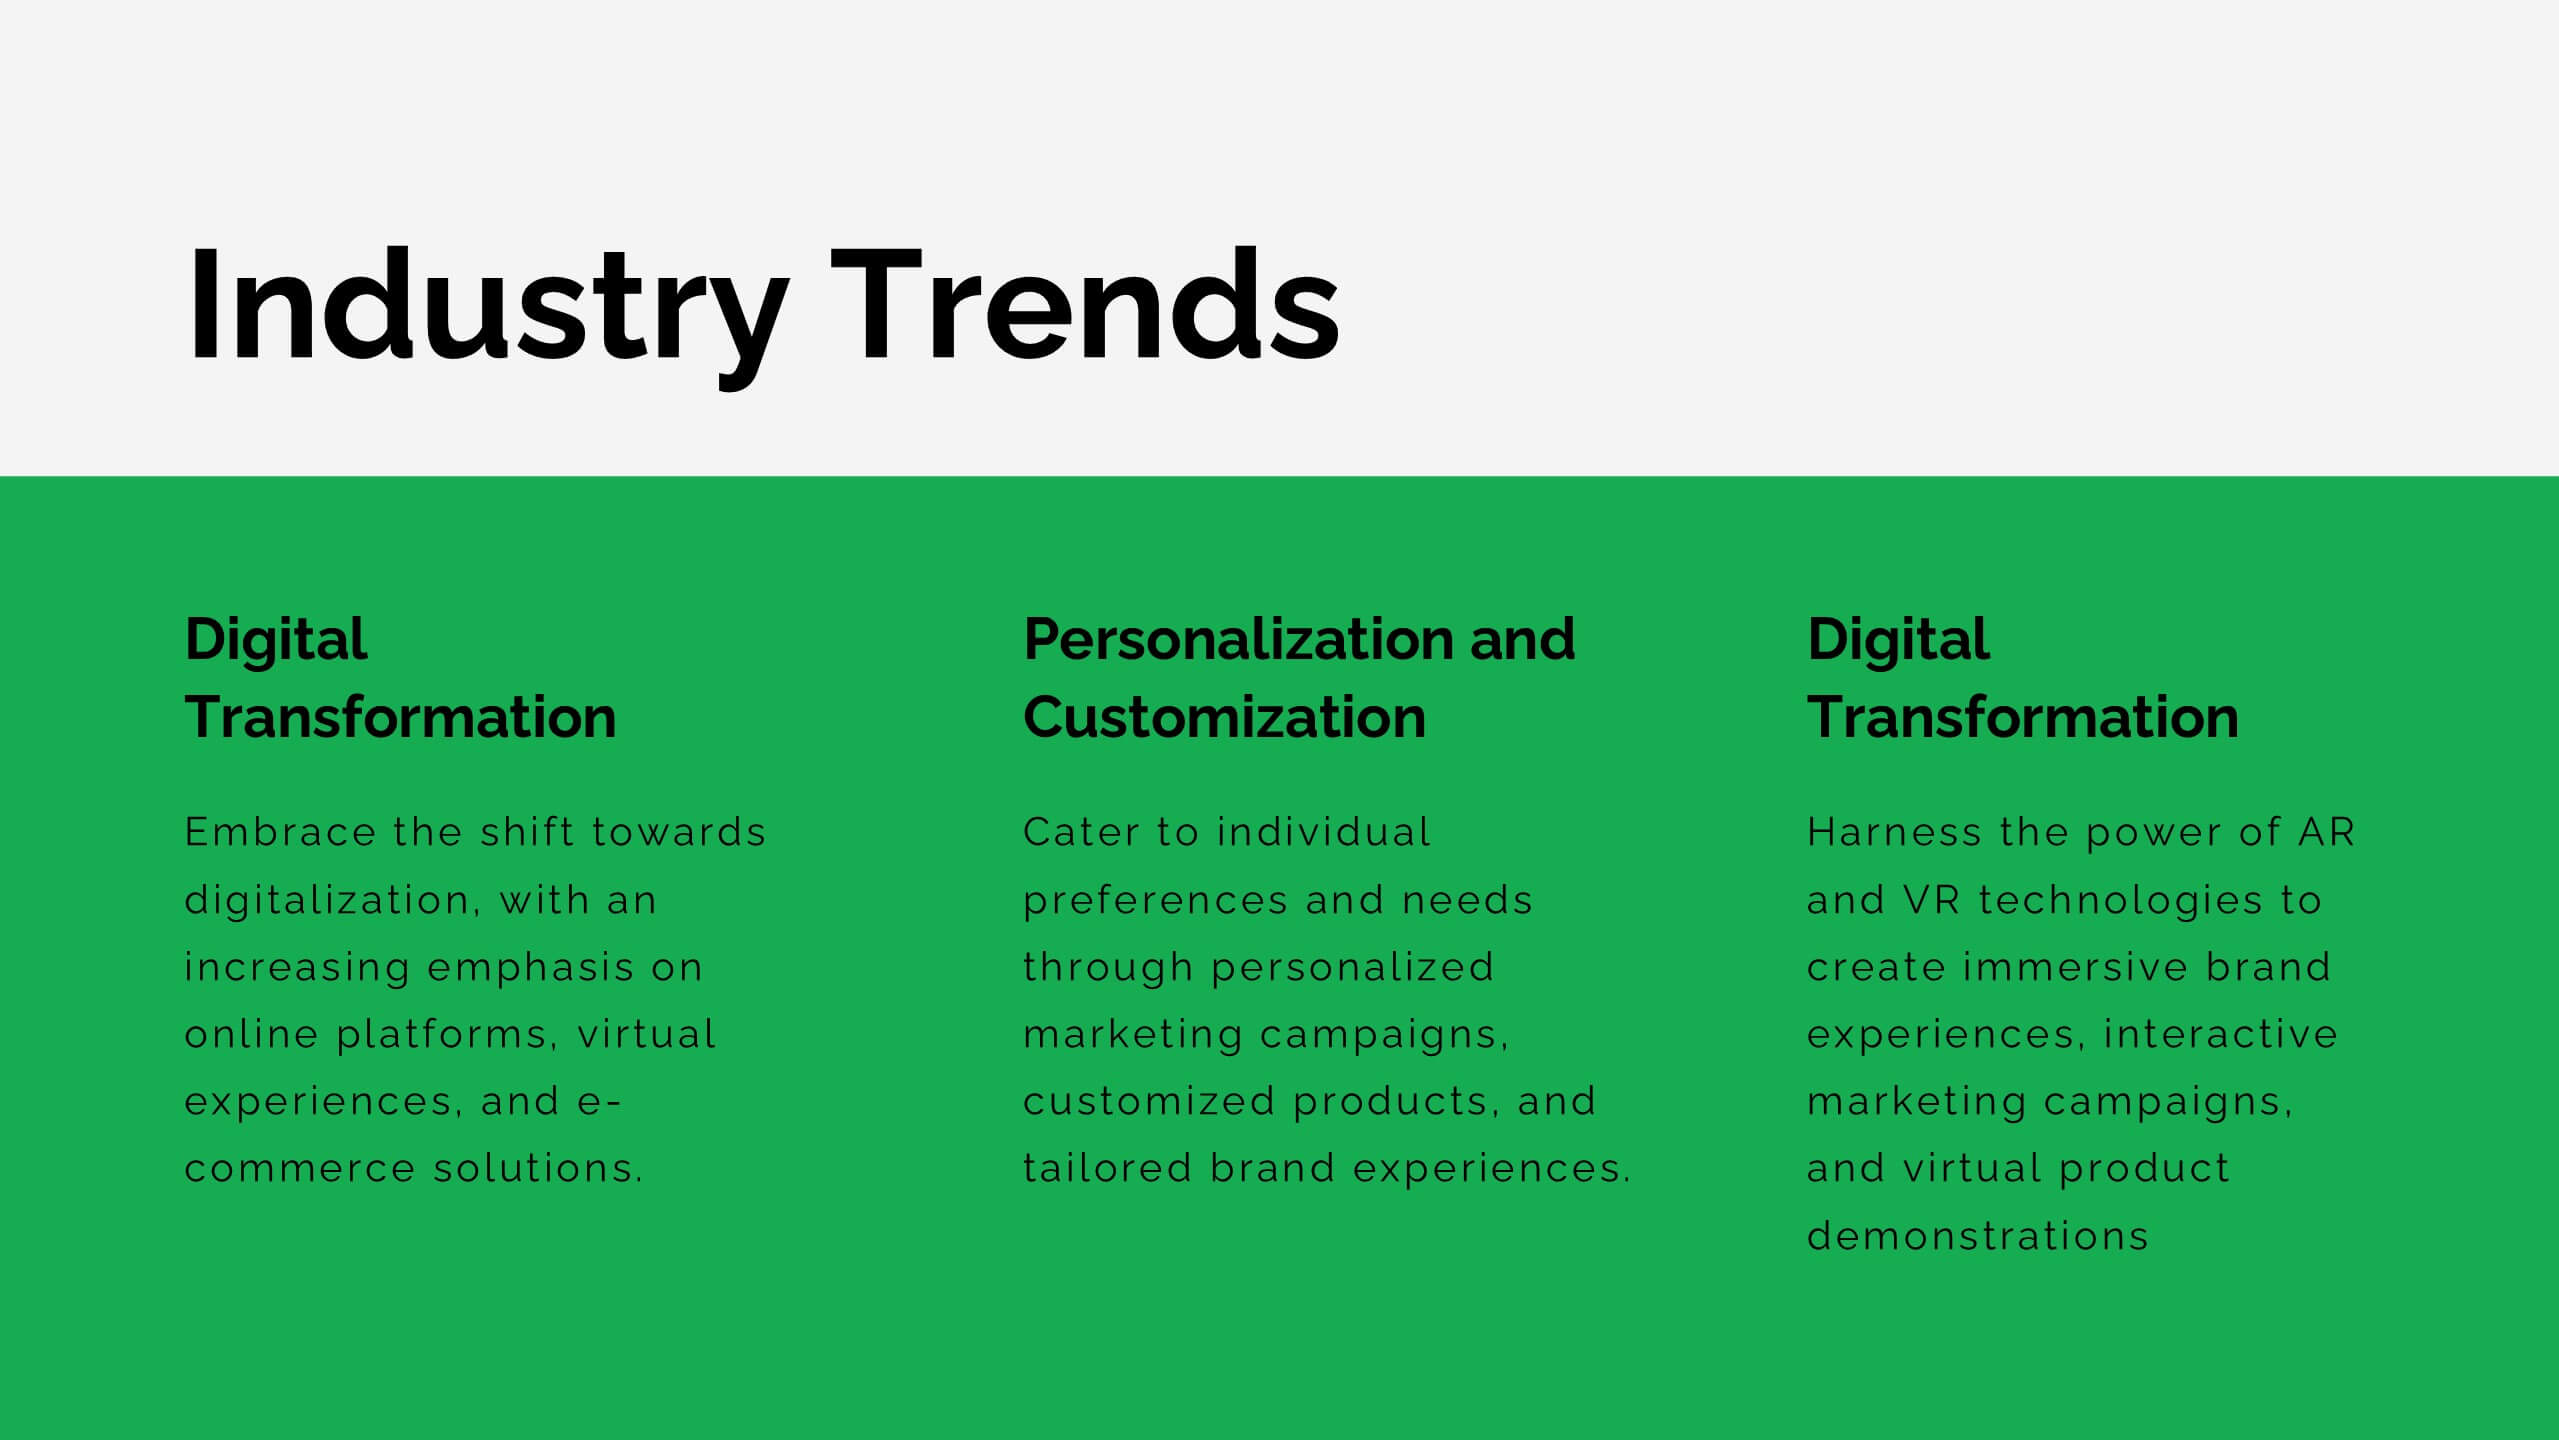
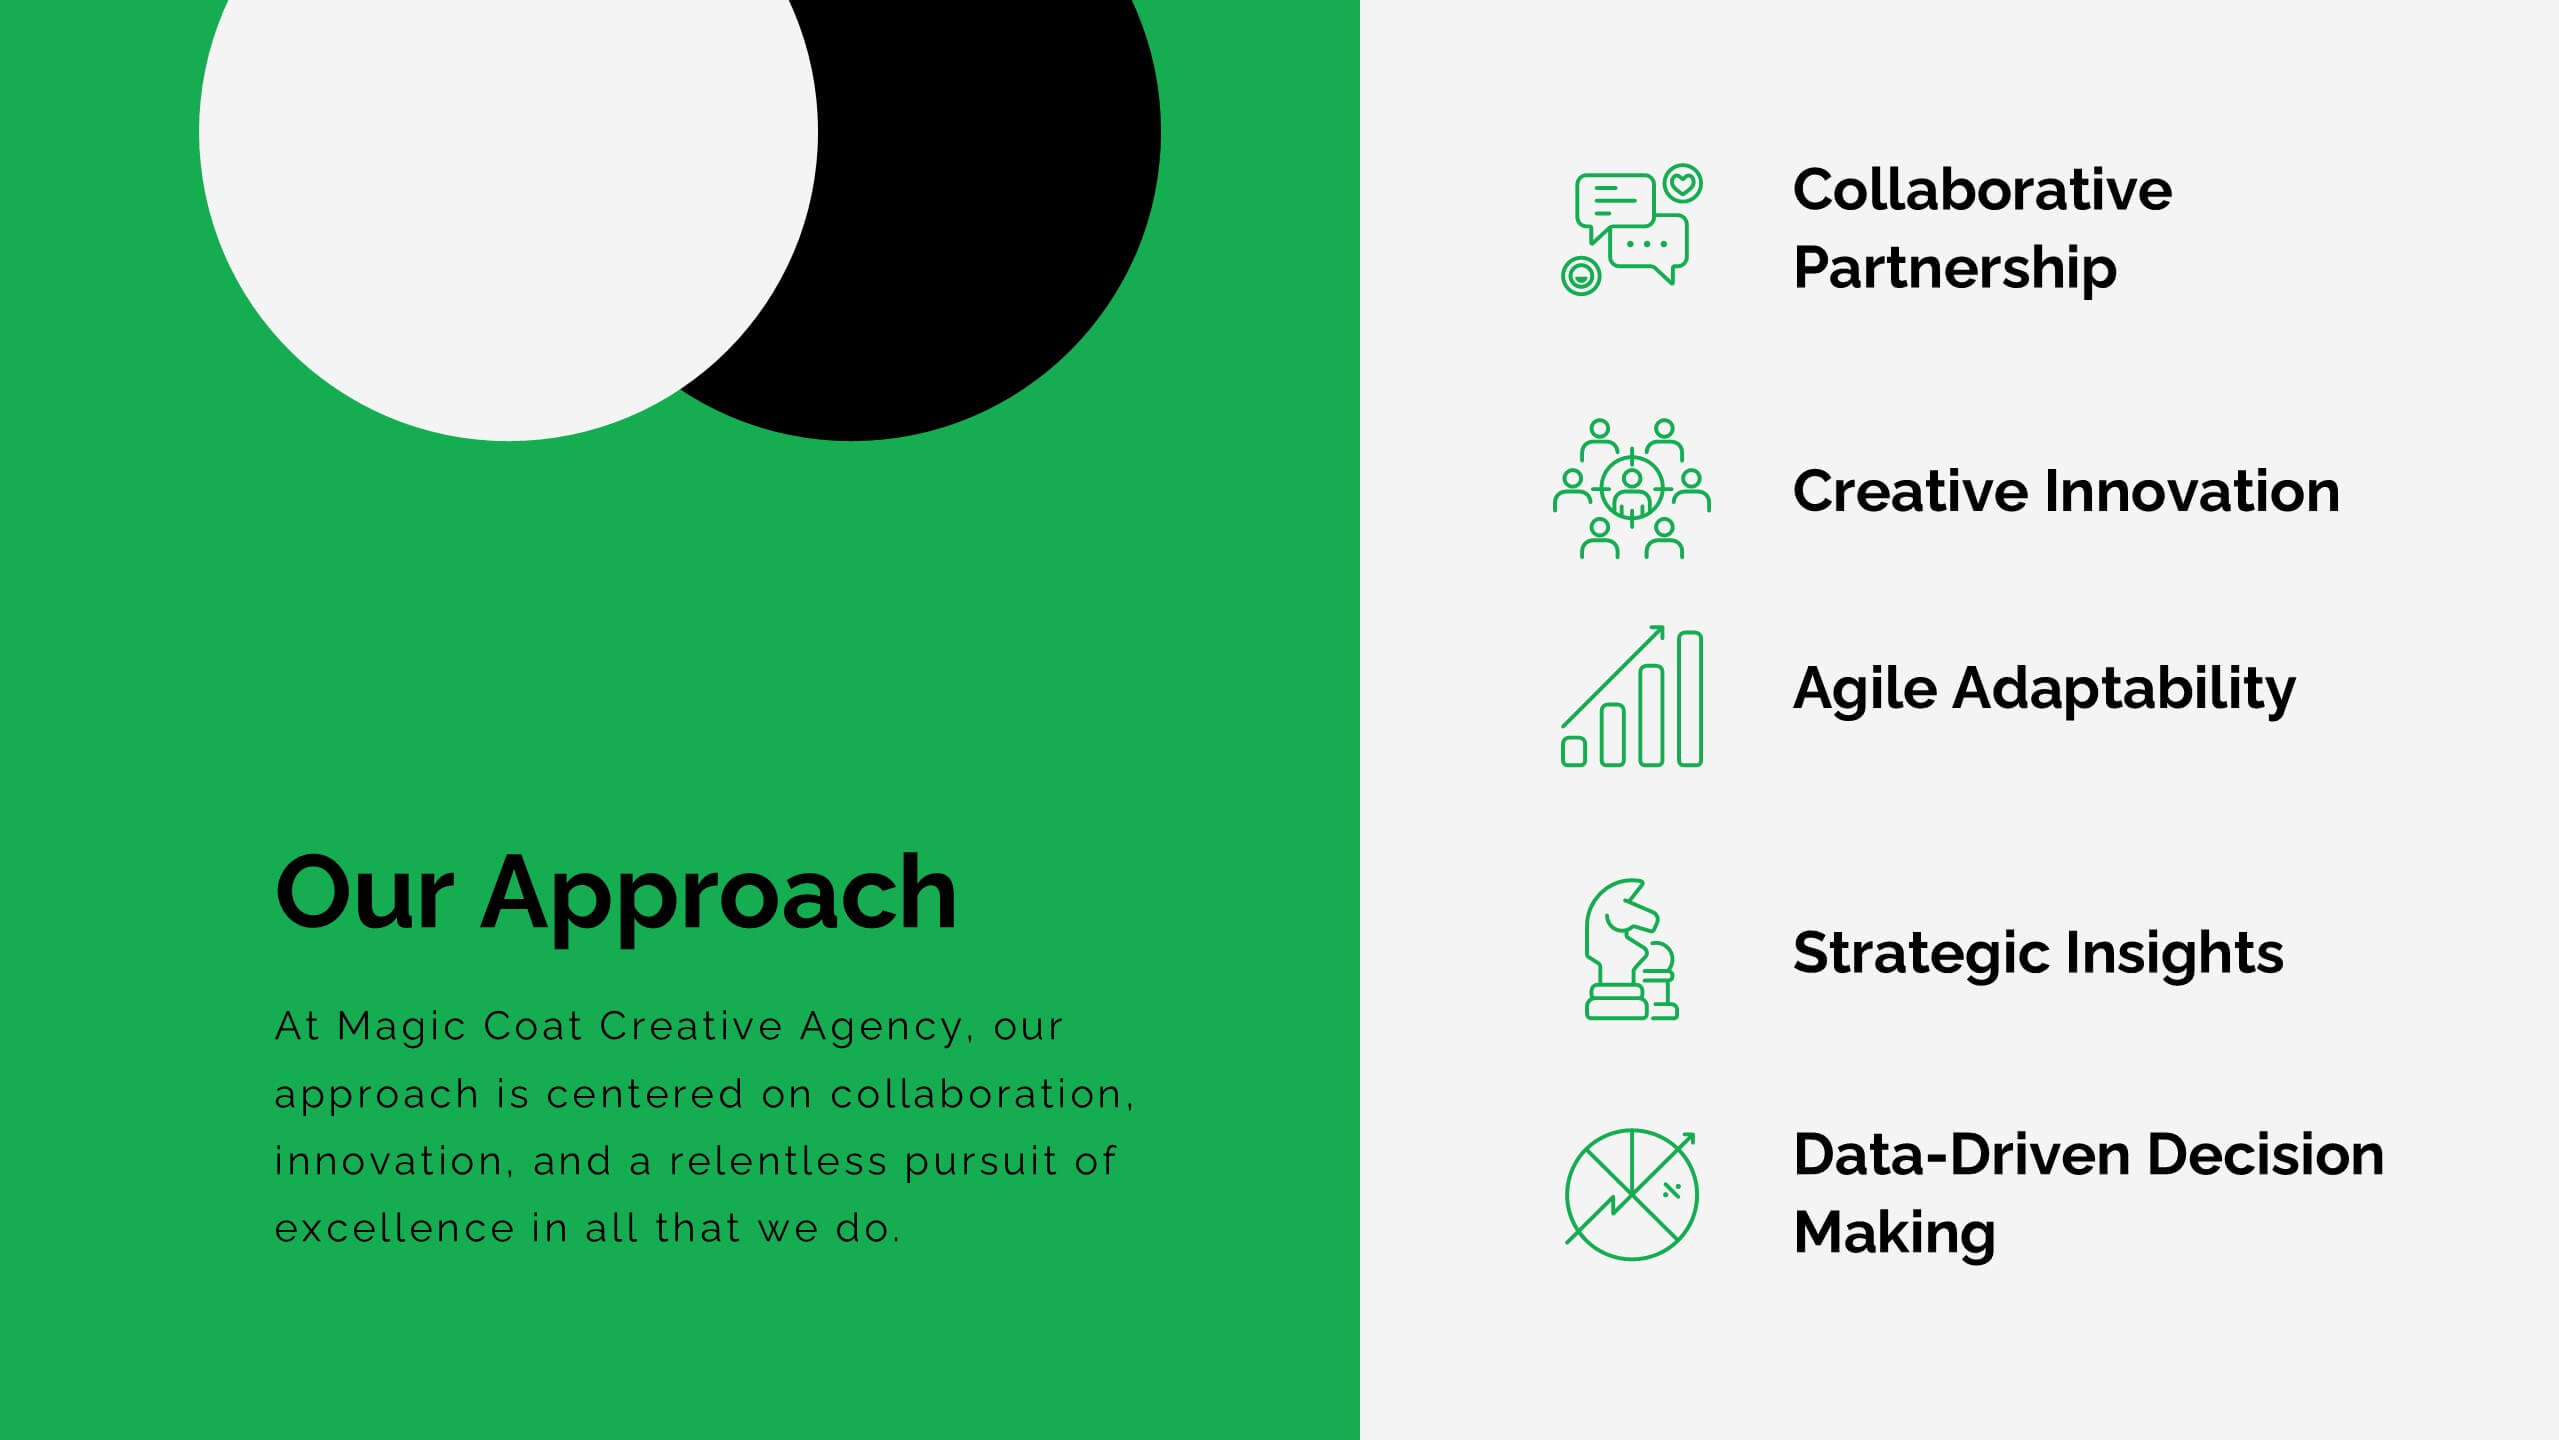
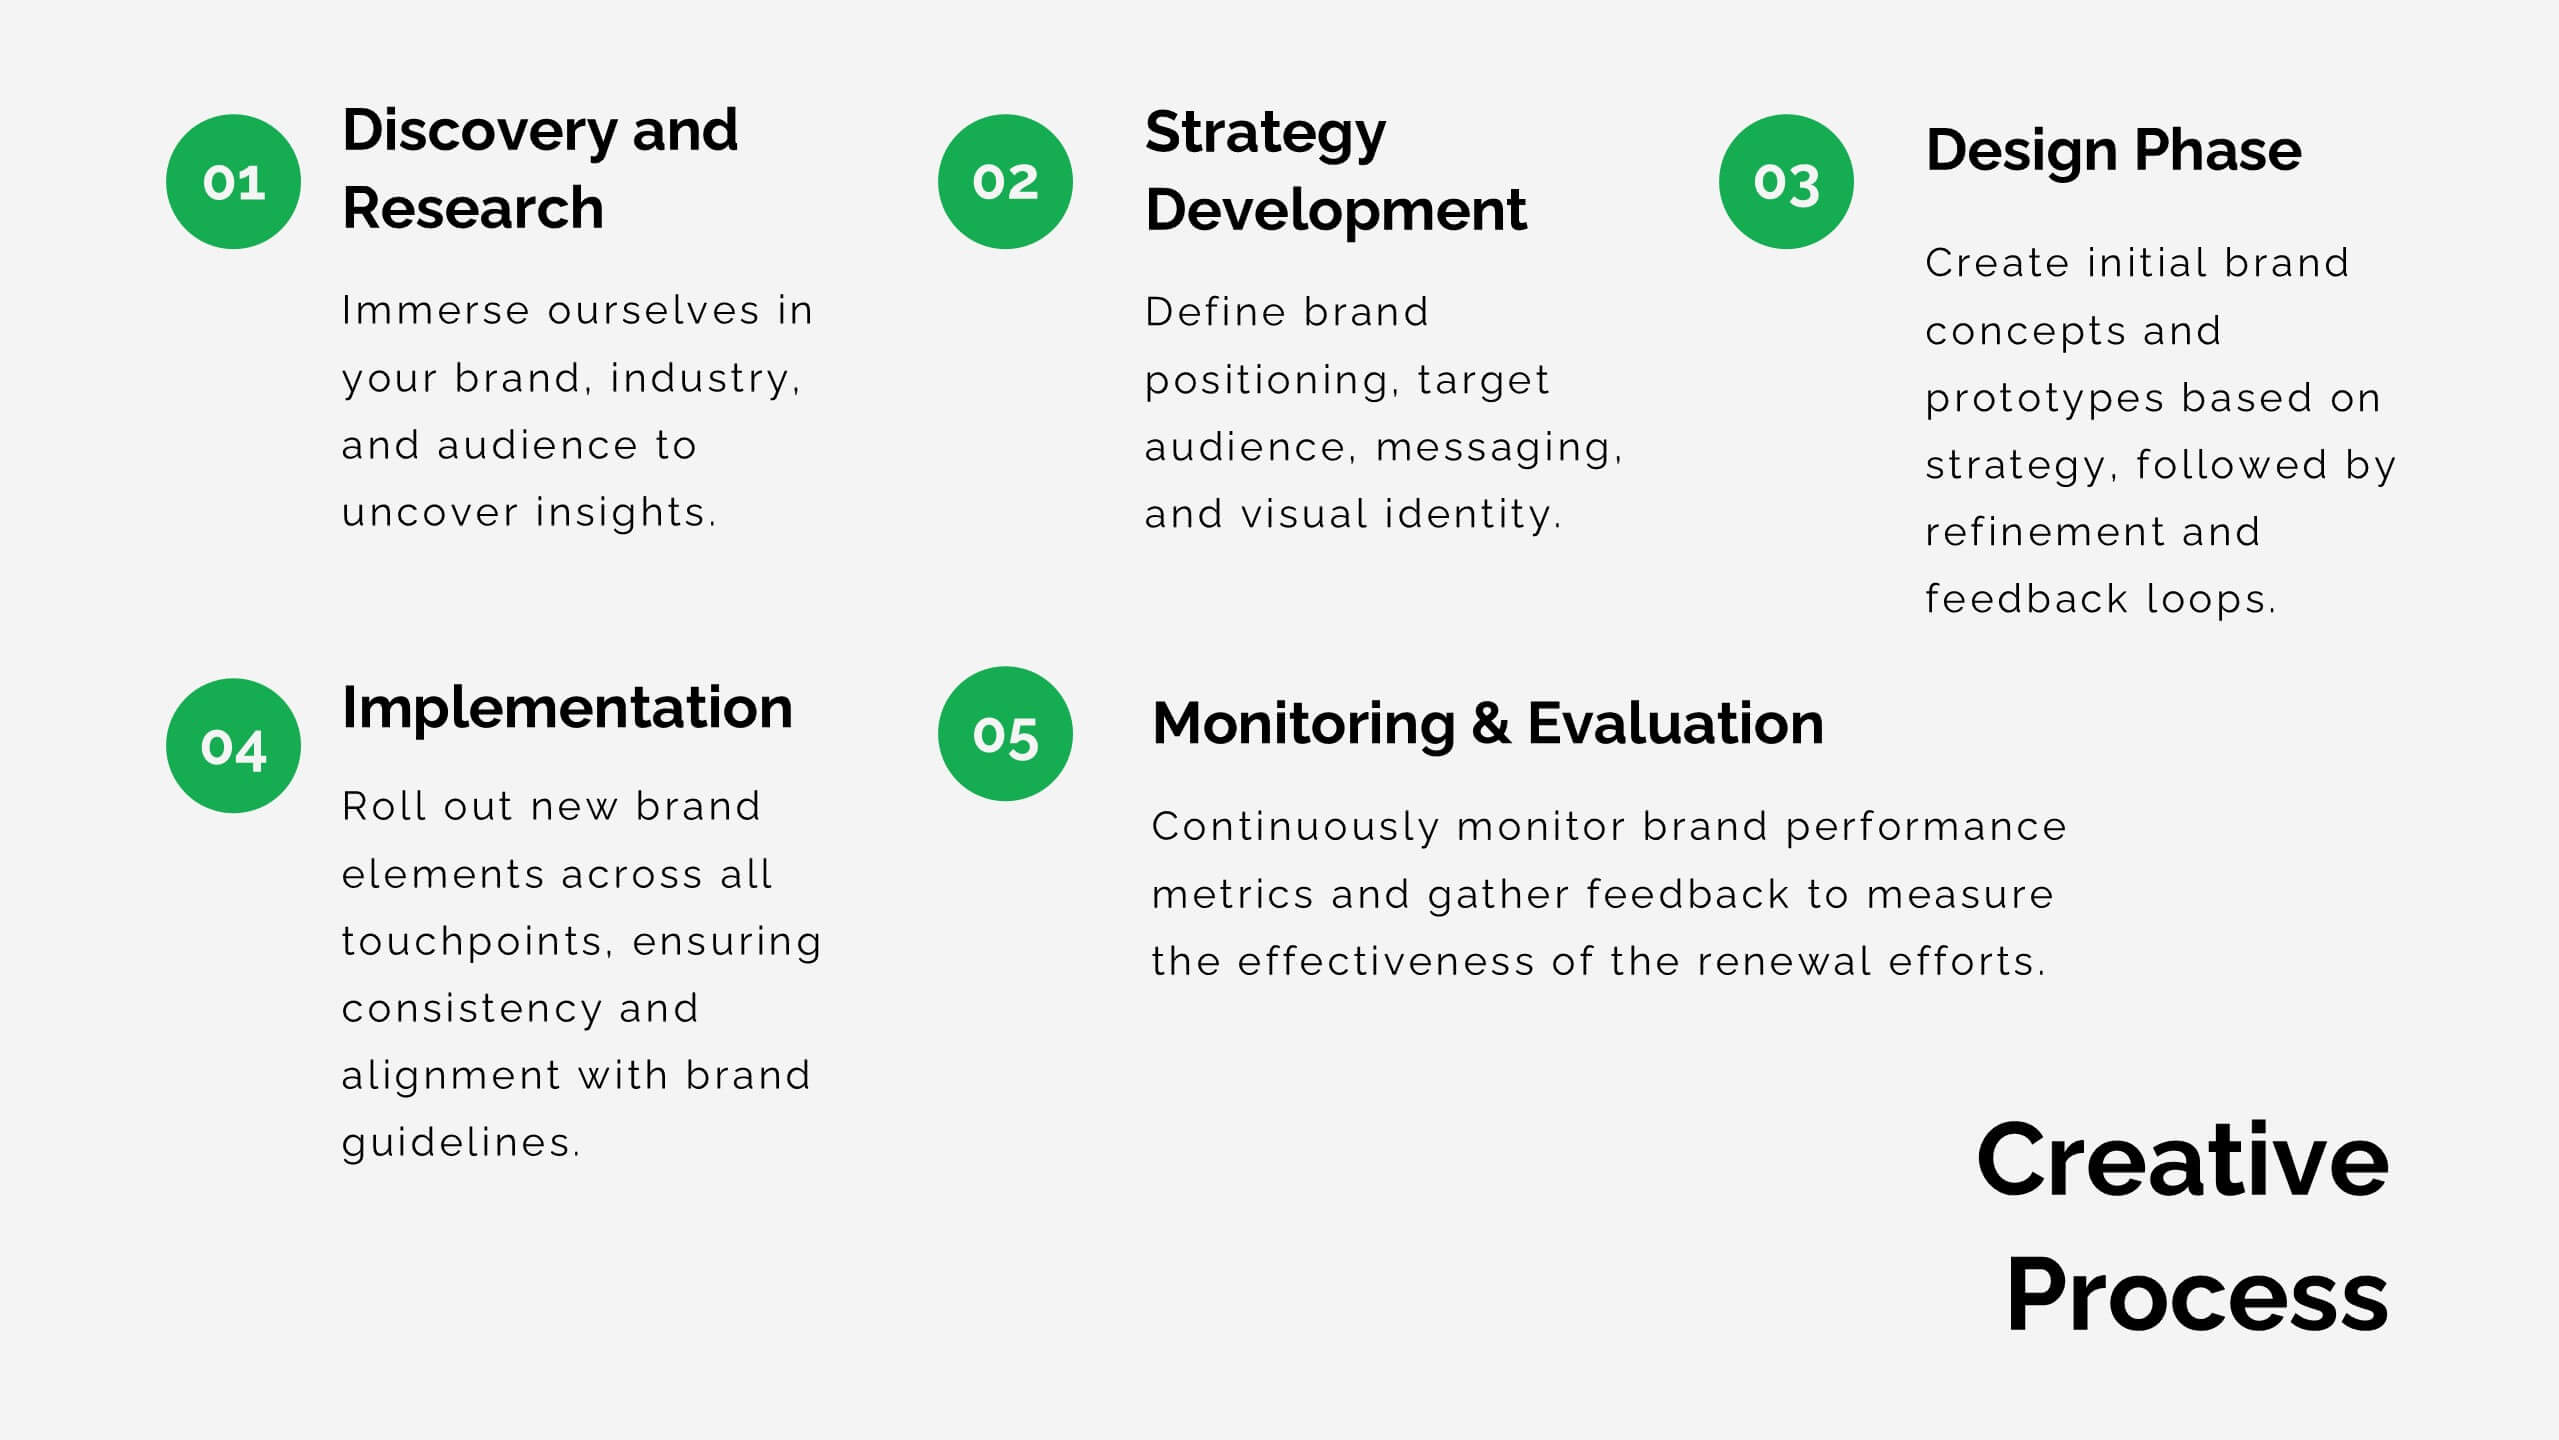
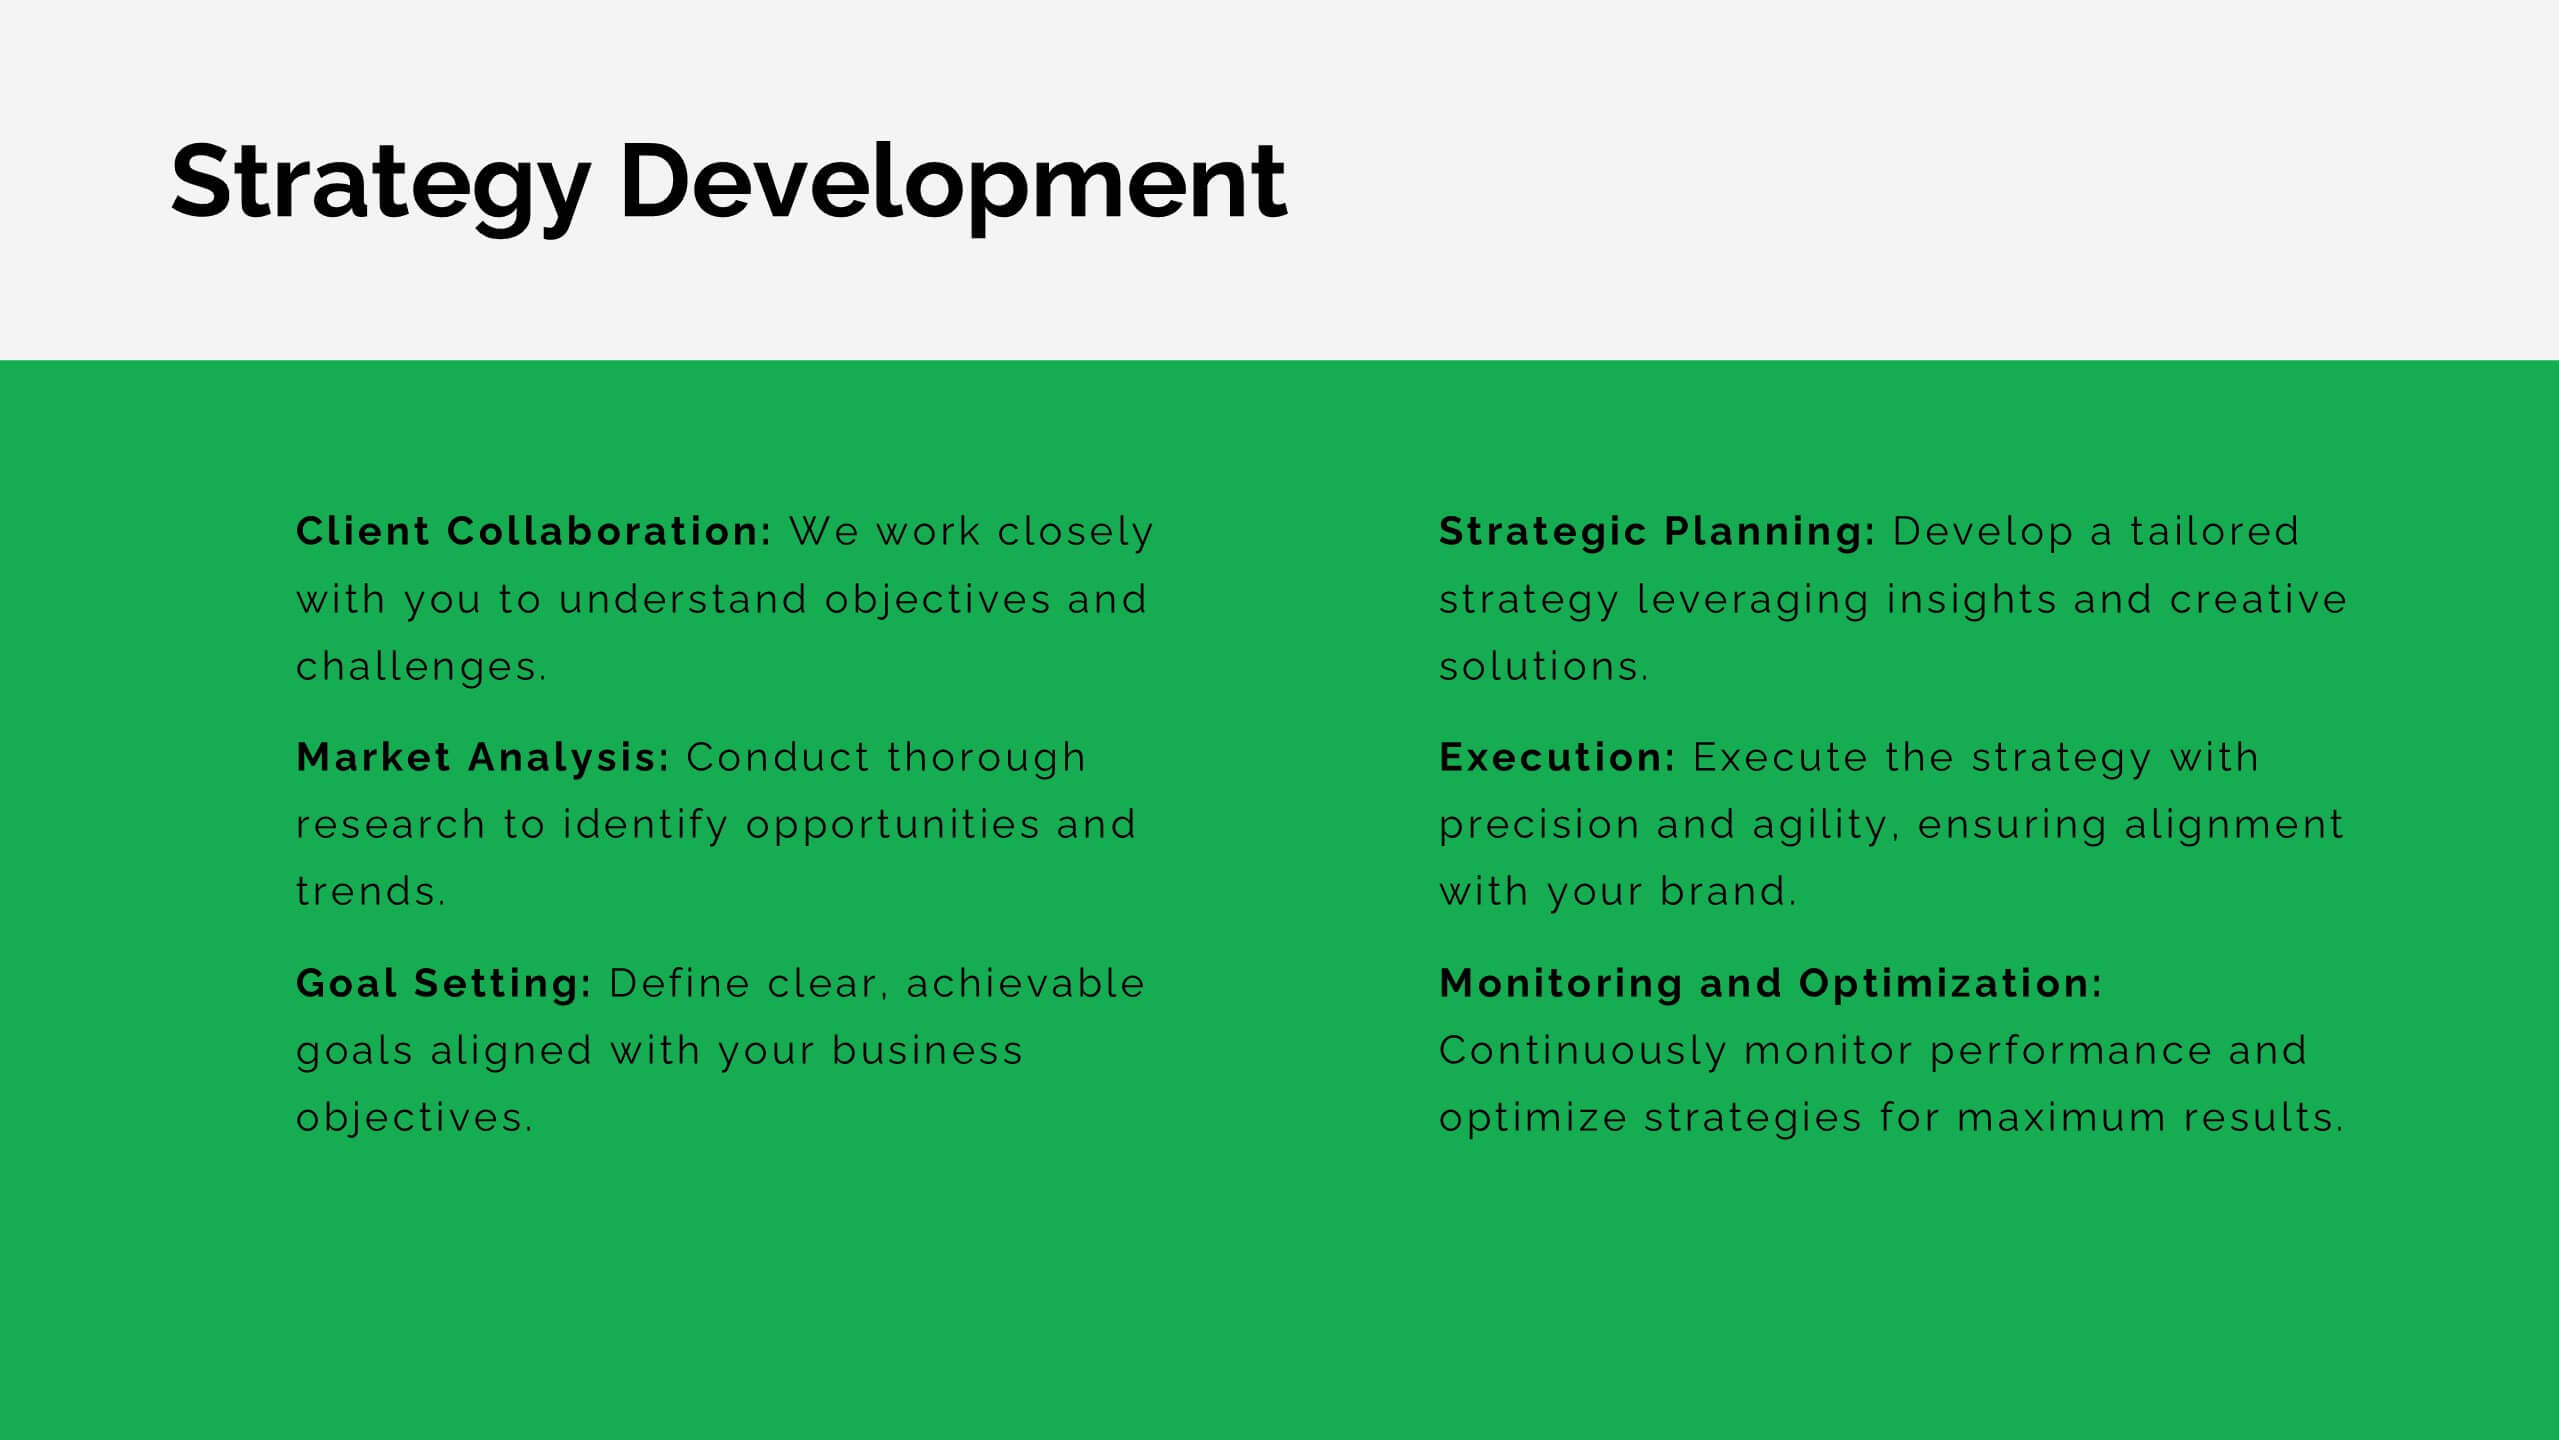
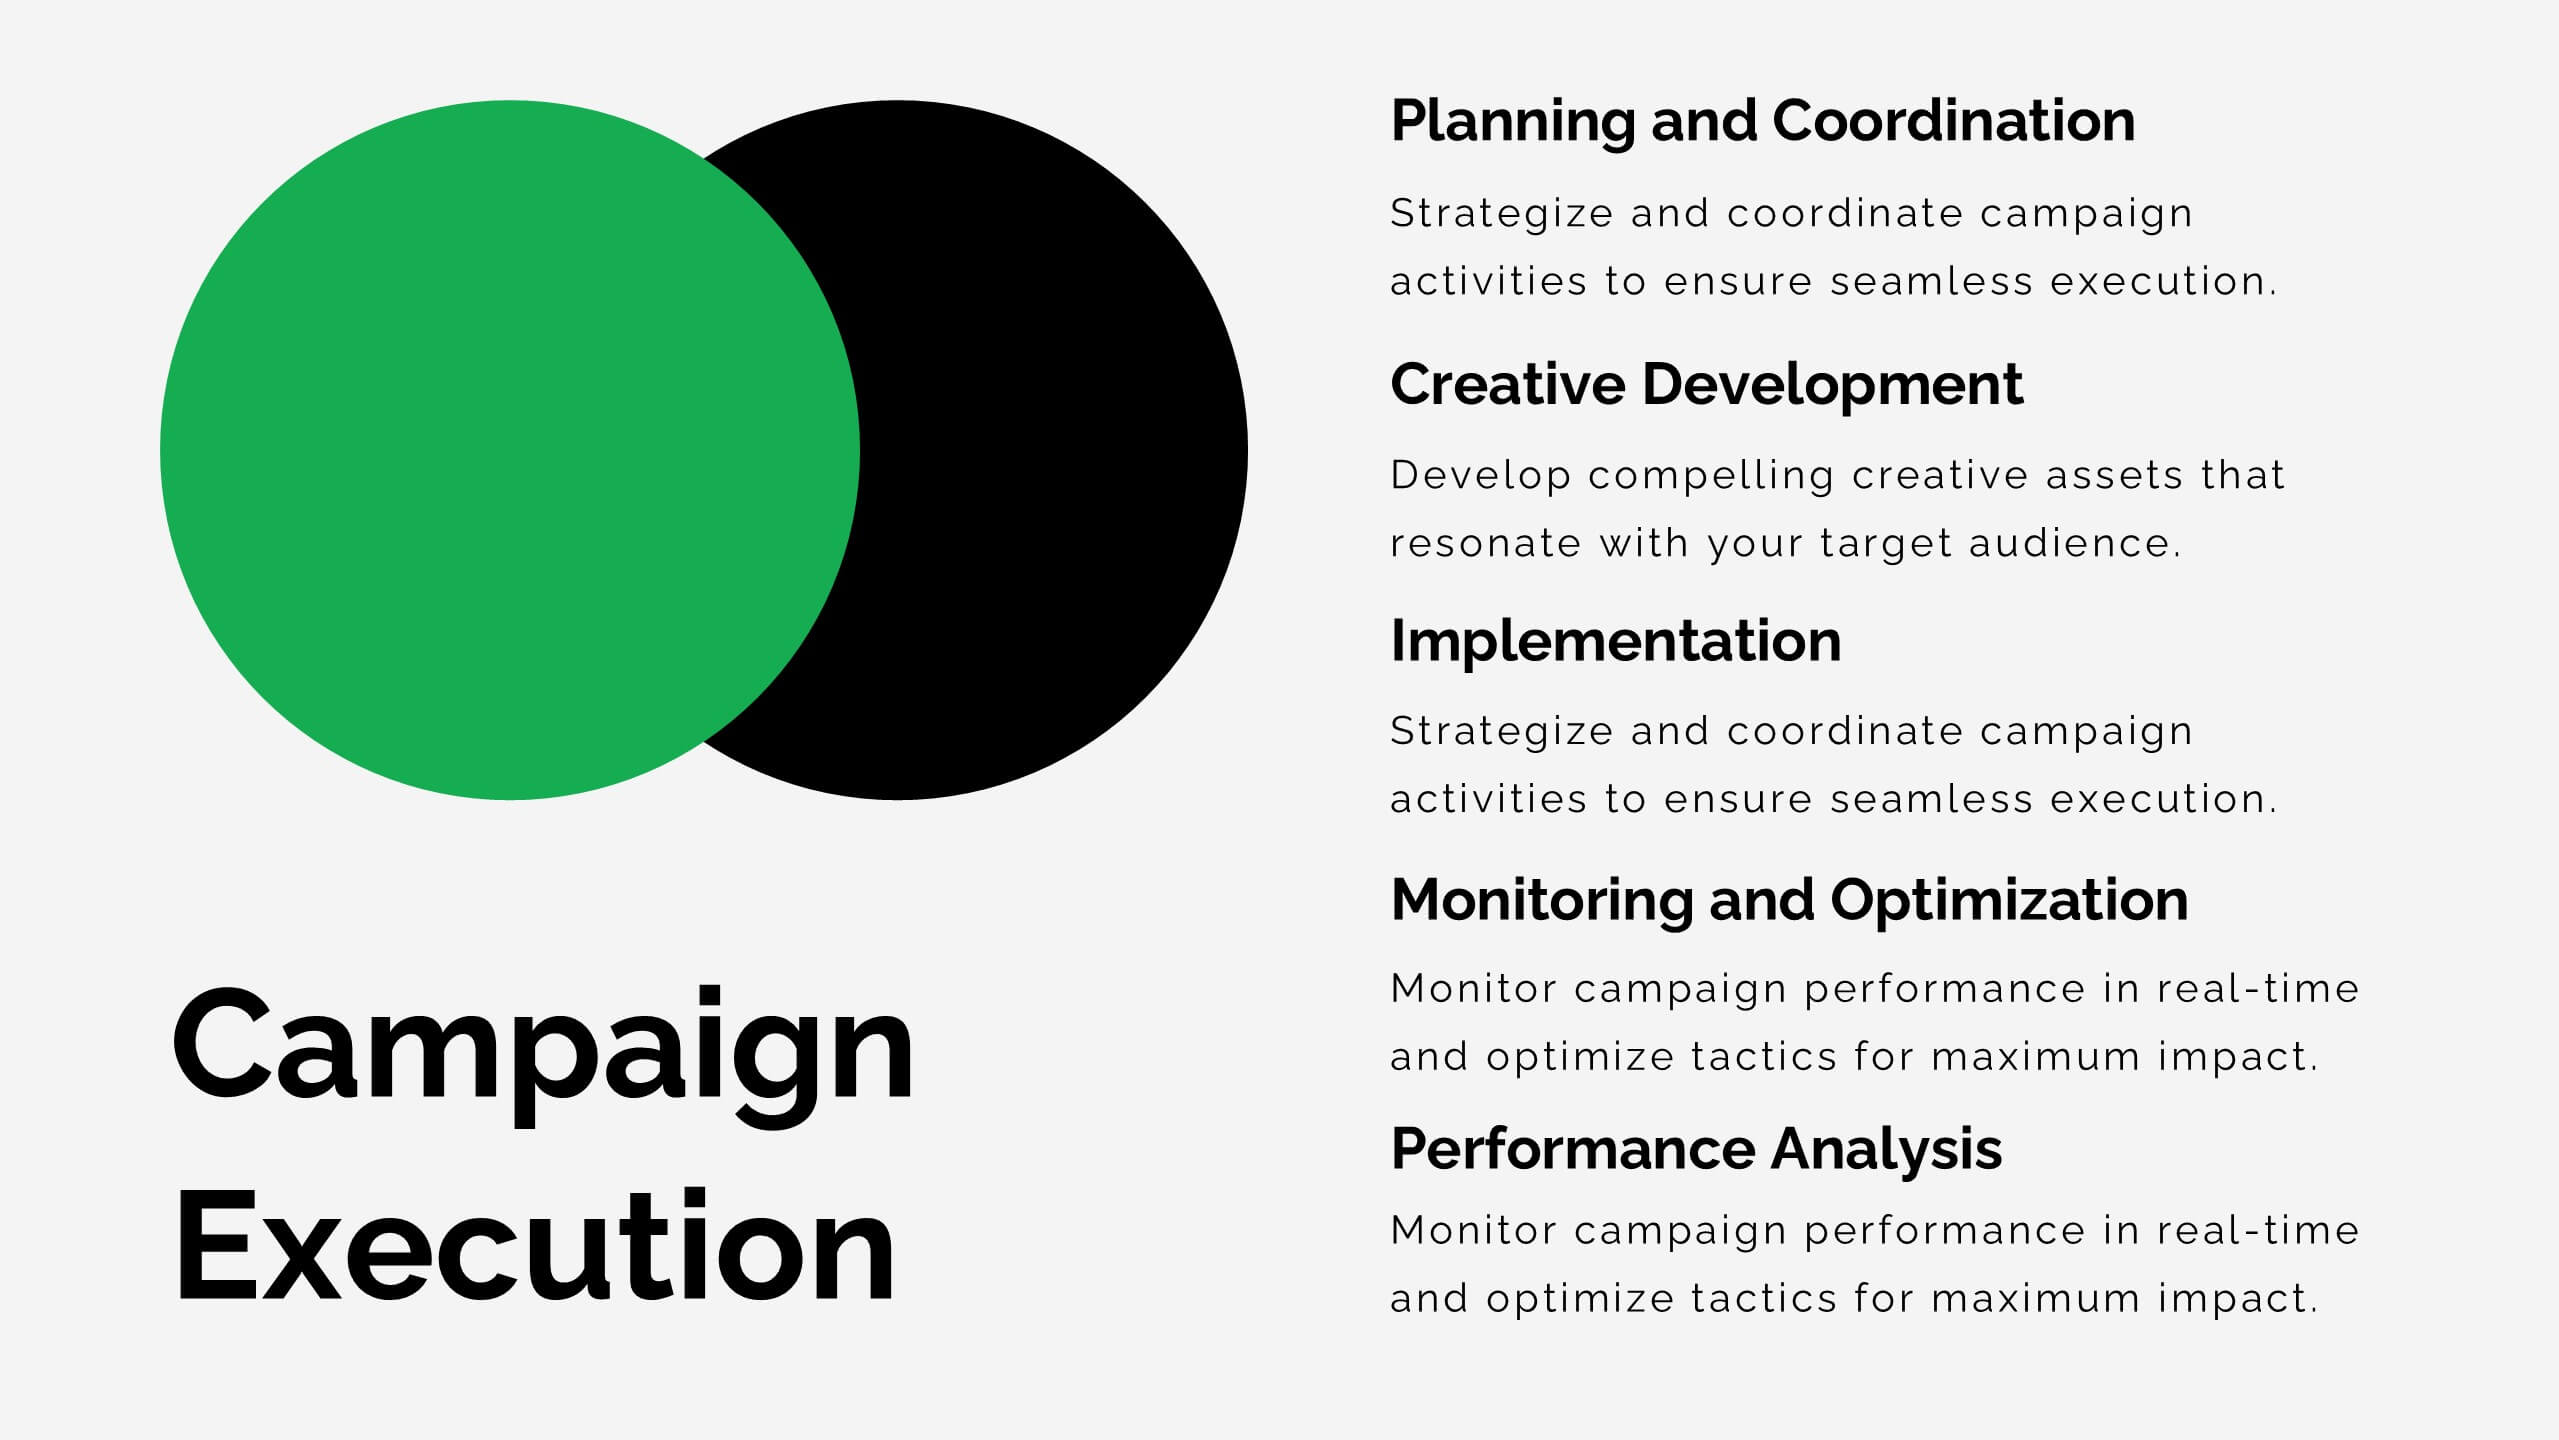
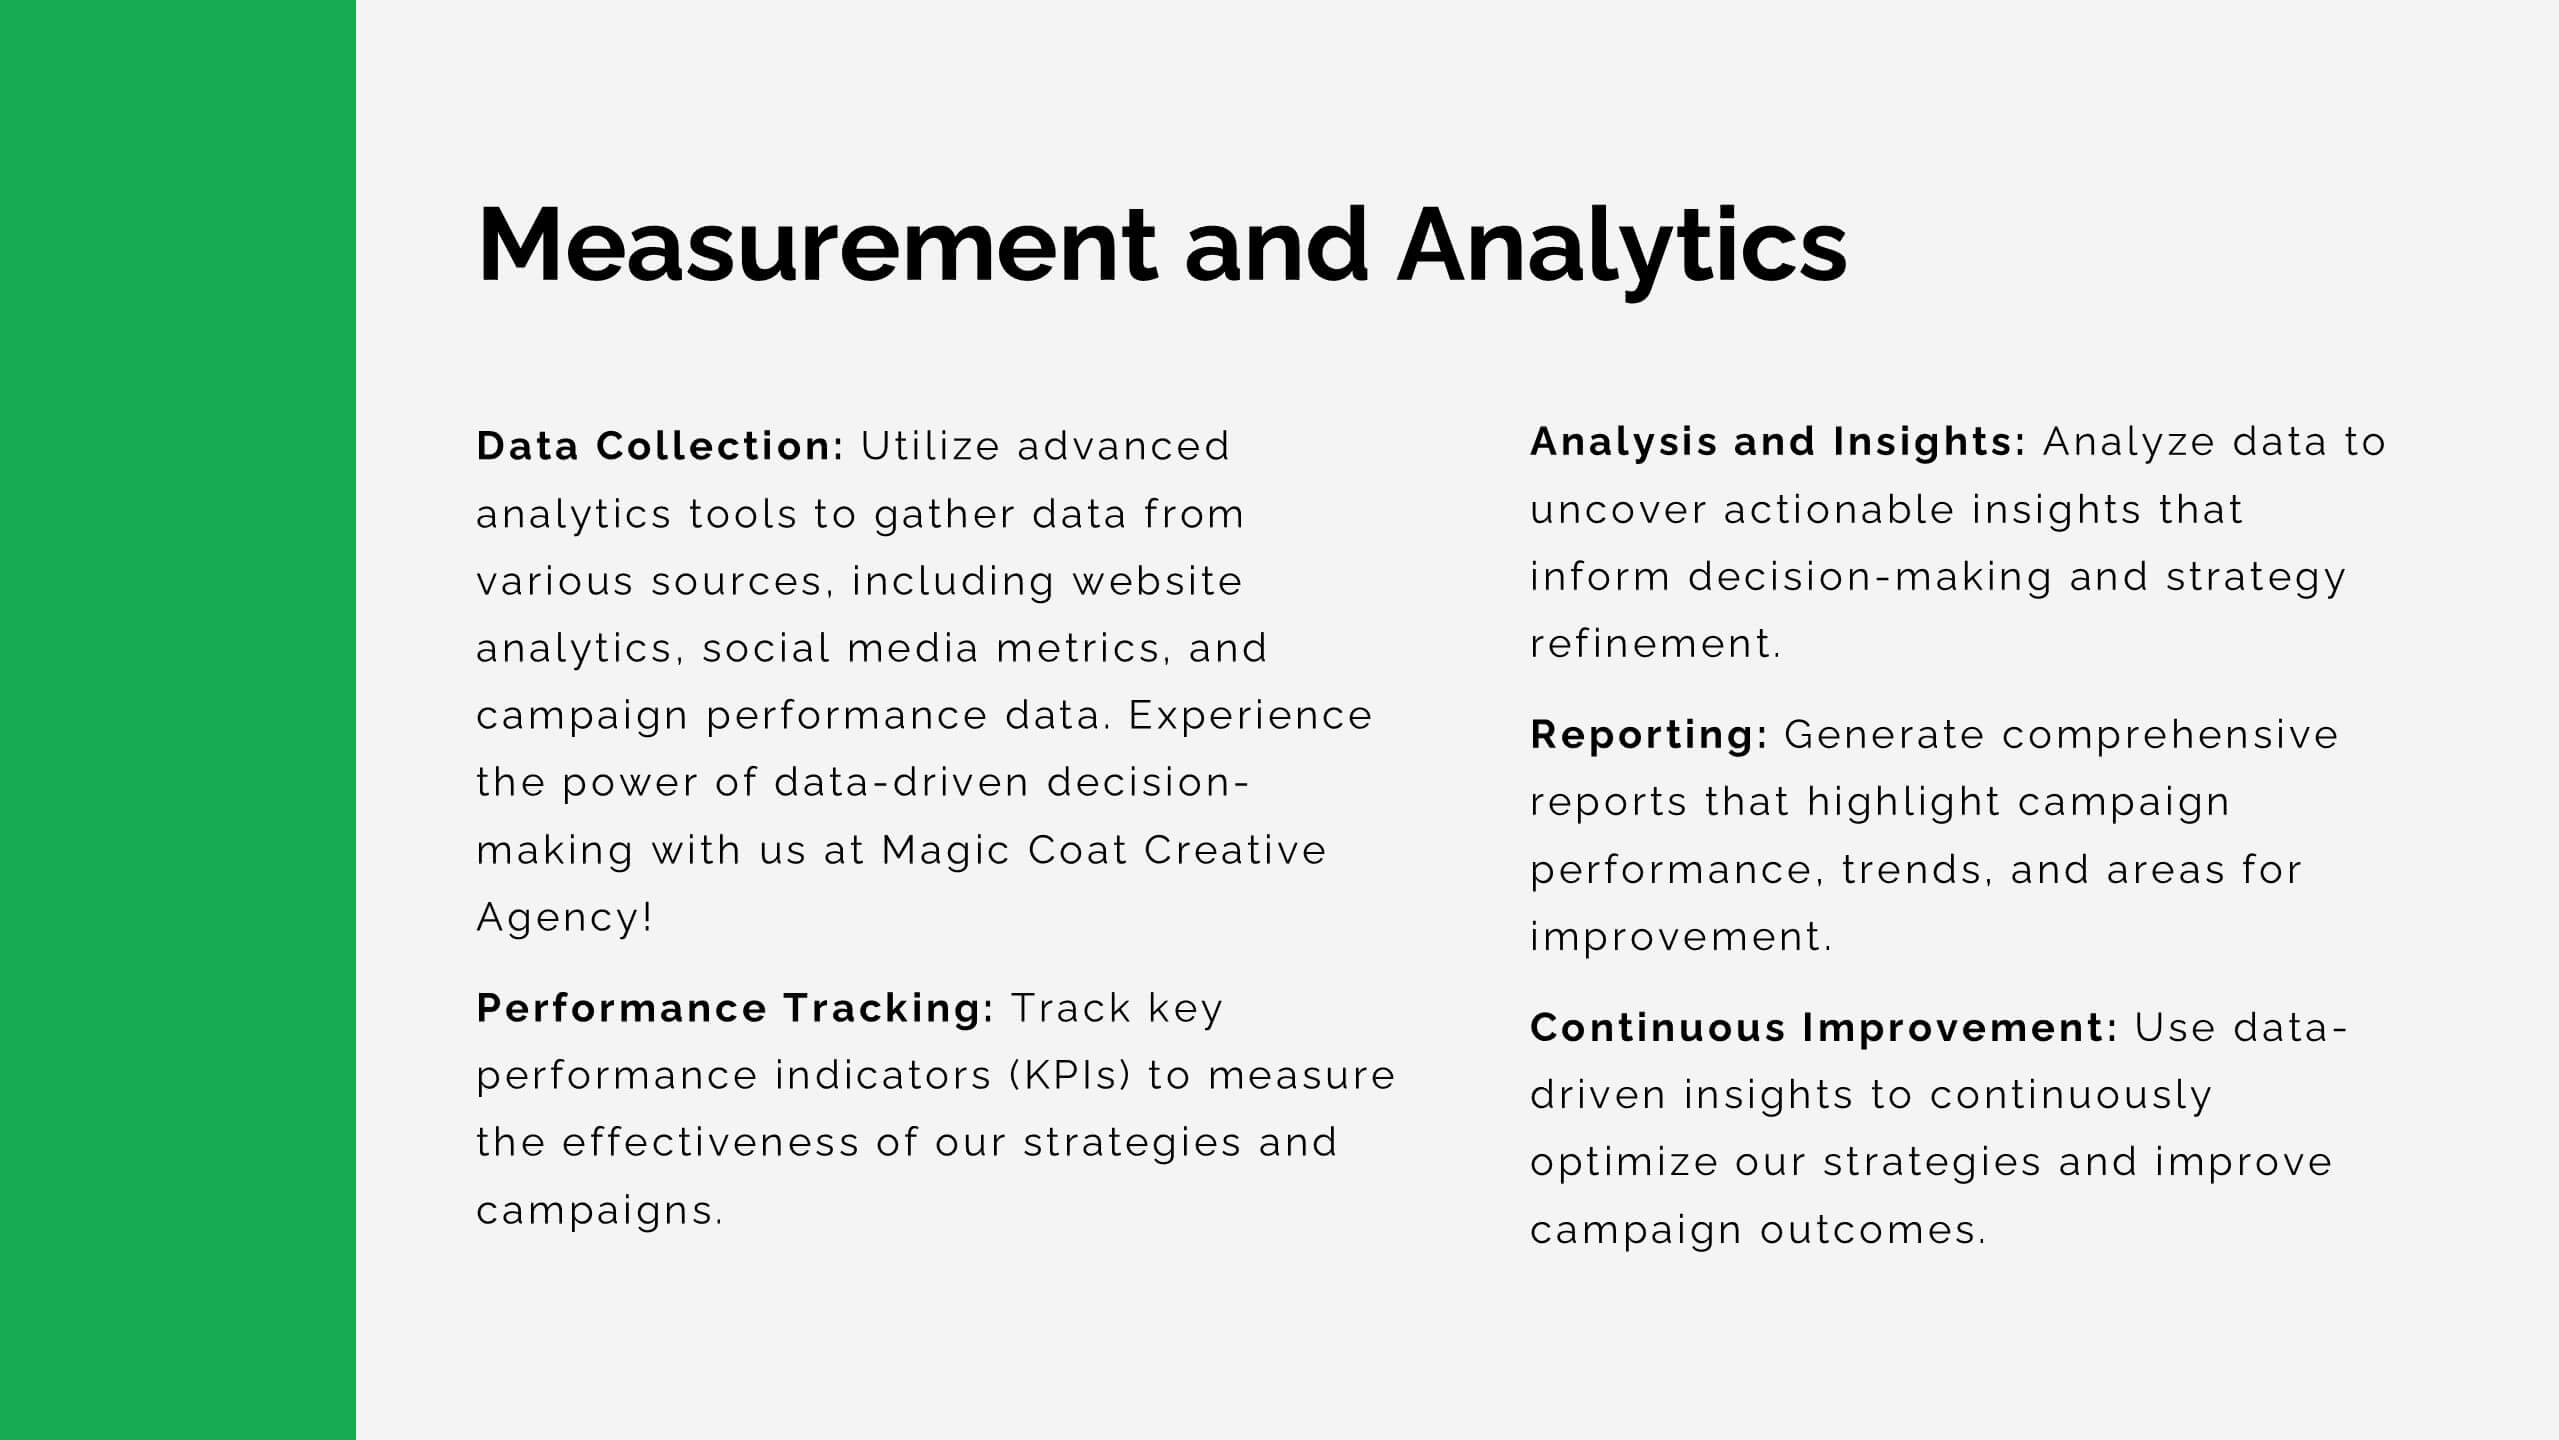
Elevate your advertising agency’s proposals with this sleek and modern template! It covers key areas like market analysis, case studies, client success stories, and campaign execution. Fully customizable, this template is perfect for presenting your agency’s services and strategies. Compatible with PowerPoint, Keynote, and Google Slides, it’s designed for impactful client presentations.


7 slides
Europe Population Infographic Presentation
A Europe Map infographic is a visual representation of the European continent, highlighting its geographic features, population, culture, history, and other relevant information. This template is a perfect graphic representation of Europe that combines text, data, and images in a fun and engaging way. This pre-designed template allows users to modify or customize the map to suit their specific needs. This includes a map of Europe with its countries, major cities, and geographic features, along with additional information and visuals related to the topic or purpose of the infographic.


4 slides
Digital Payment and Card Services Presentation
Step into the world of contactless commerce with this clean, modern slide design. It’s built to help you present how digital payment systems and card-based services are transforming transactions in today’s economy. Perfect for fintech updates, product walkthroughs, or training decks. Fully compatible with PowerPoint, Keynote, and Google Slides.


4 slides
Financial Budget Forecasting Presentation
Predict and manage your financial future with our 'Financial Budget Forecasting' template, perfect for visualizing quarterly budget allocations and expectations. This versatile tool aids in creating clear, concise, and visually engaging financial presentations, and is compatible with PowerPoint, Keynote, and Google Slides, making it a must-have for finance professionals and budget planners.


5 slides
Real Estate Investing Infographics
Real estate investing refers to the purchase, ownership, management, rental, or sale of real estate properties with the objective of generating income and/or capital appreciation. These infographic templates can be used to provide key information and insights about real estate investing. These are designed to educate individuals about the basics of real estate investing, its benefits, and important considerations to help them make informed investment decisions. These infographics are great for anyone seeking to understand the basics of real estate. Compatible with Powerpoint, Keynote, and Google Slides.


20 slides
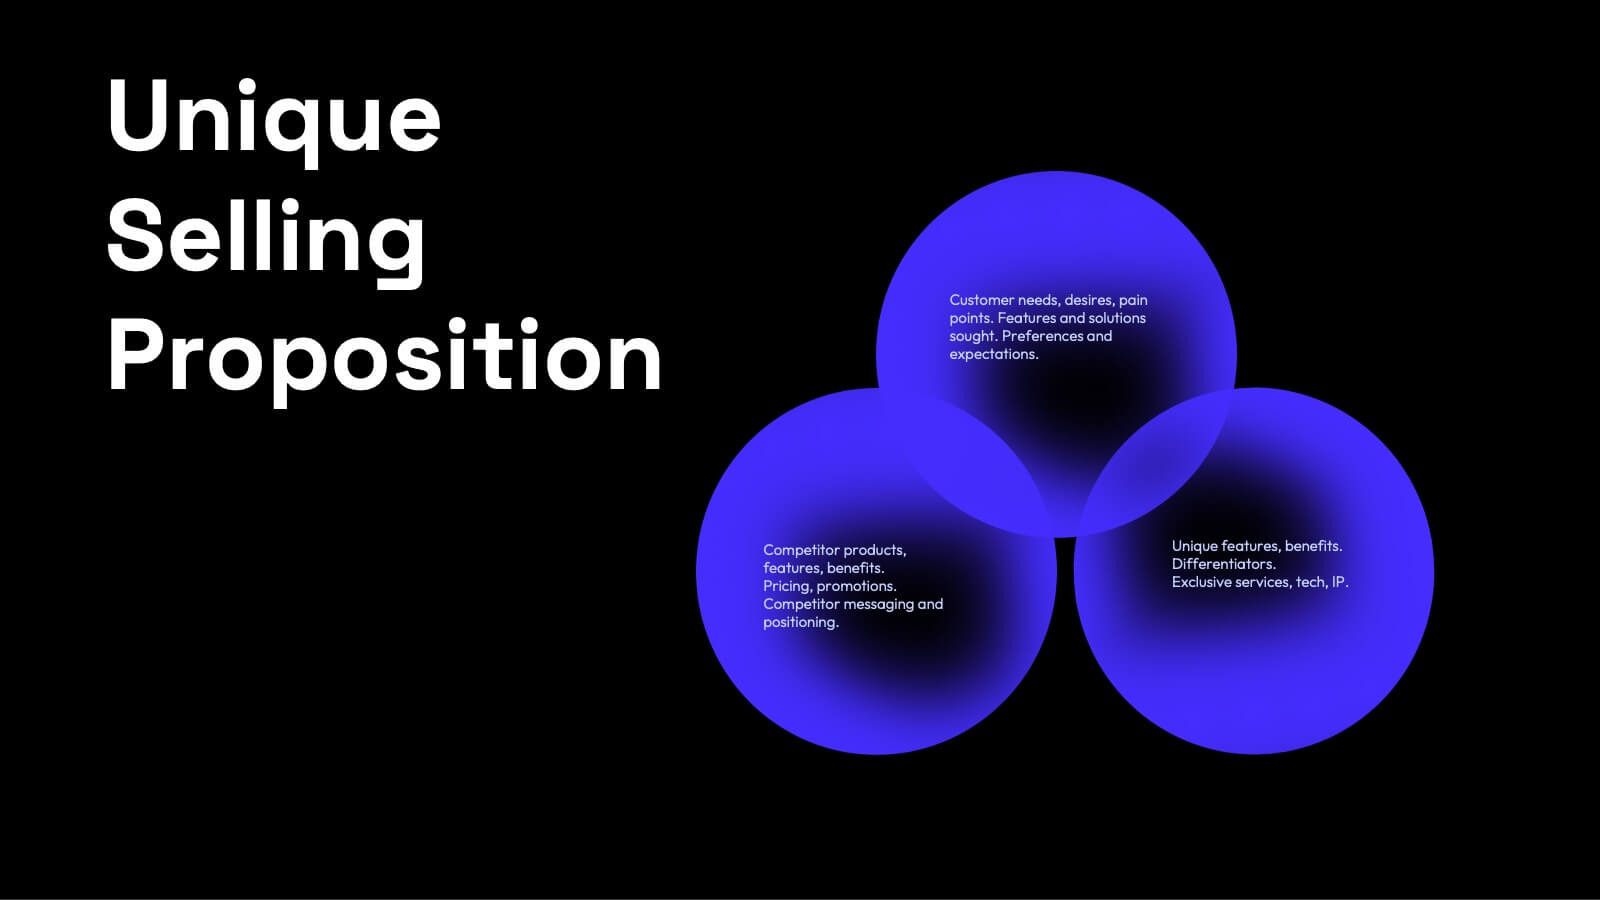
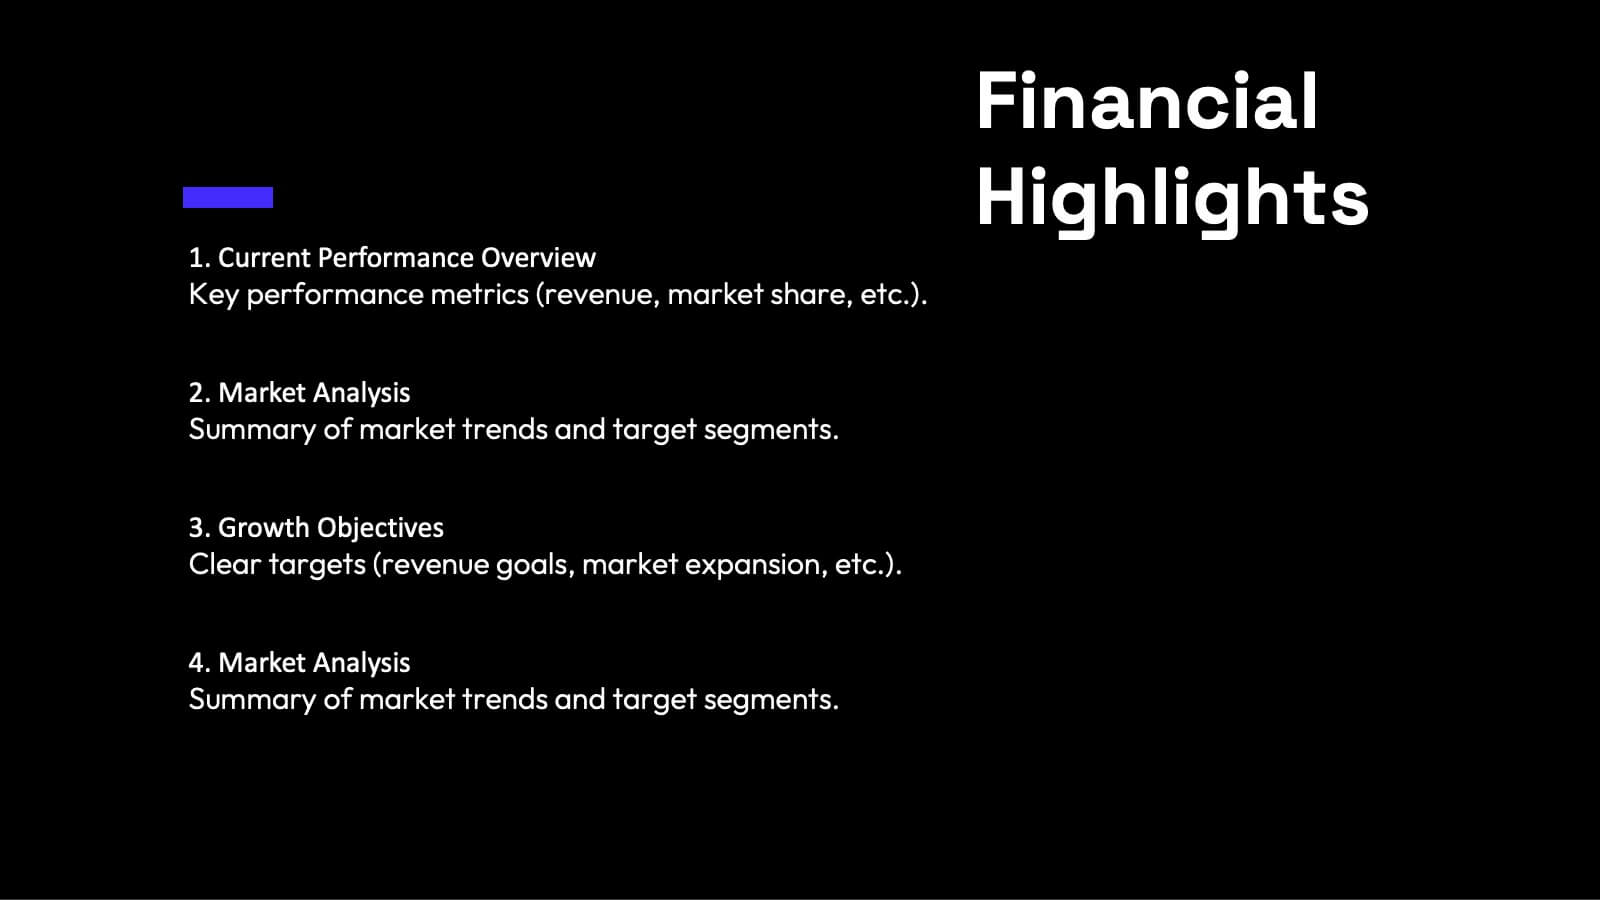
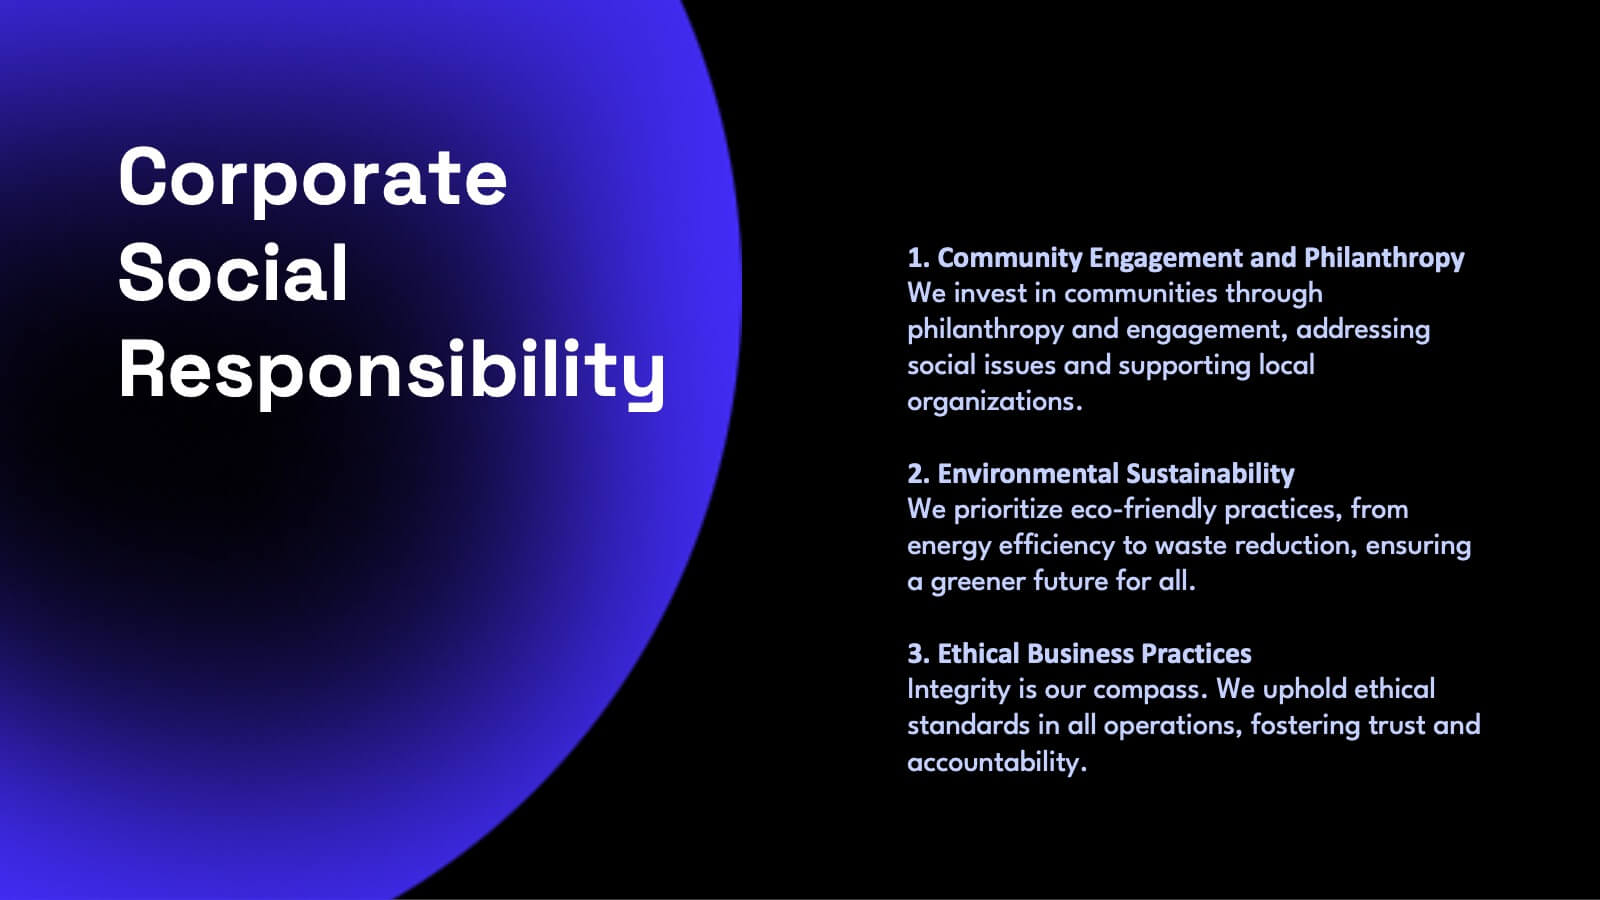
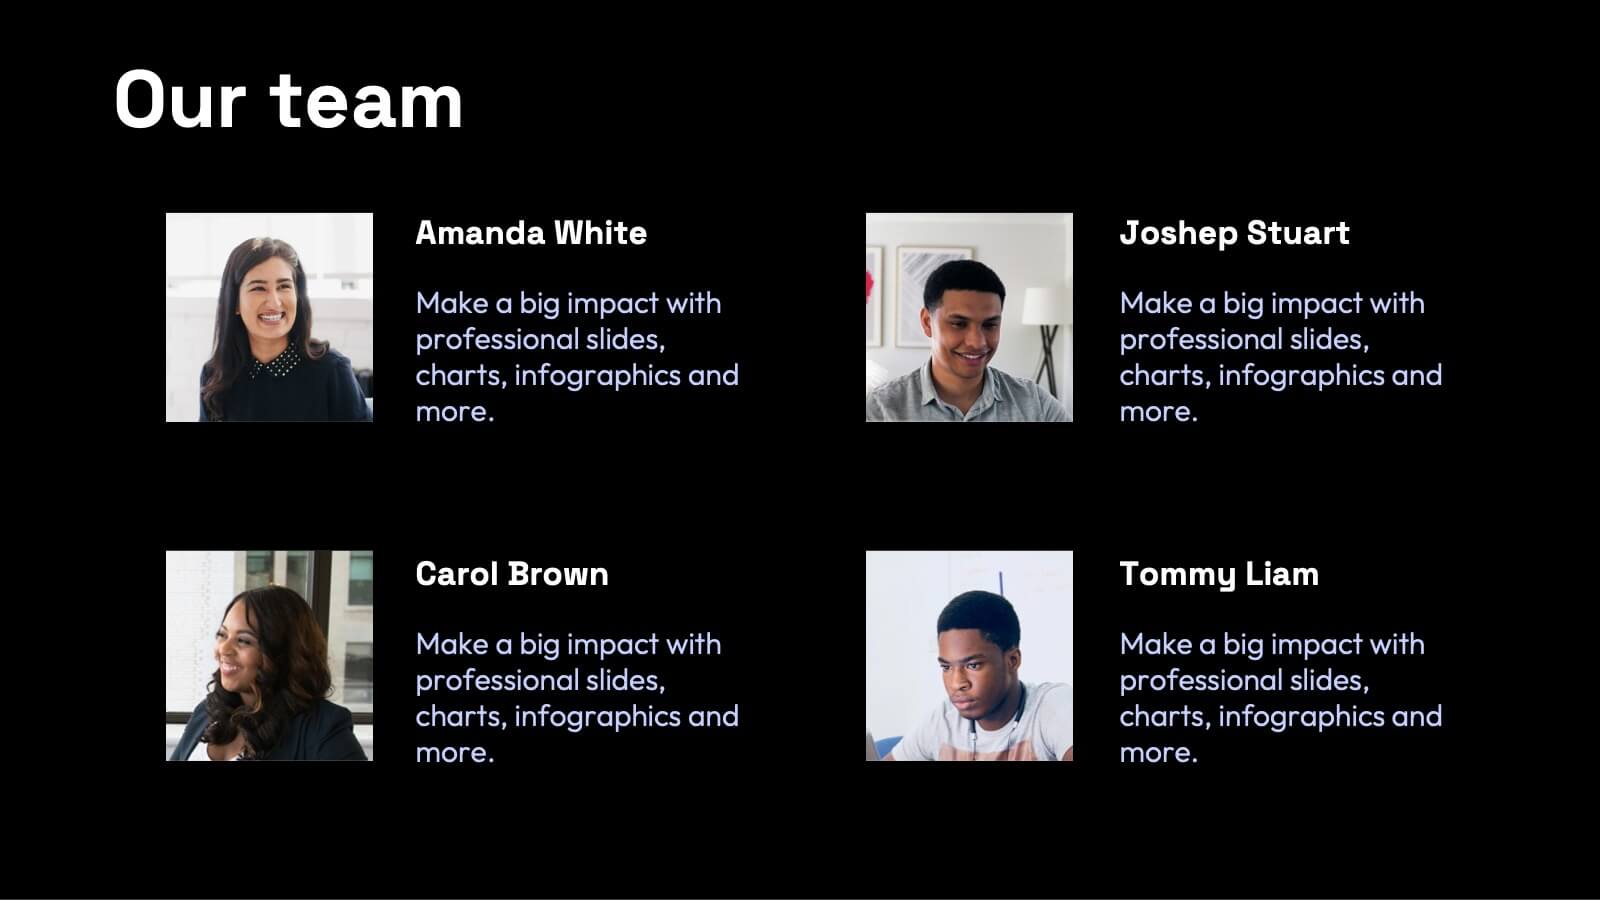
Apex Content Marketing Pitch Deck Presentation
Ignite your marketing strategy with this captivating pitch deck! Perfect for showcasing content marketing plans, it features slides on company history, target audience, and unique selling propositions. Make a lasting impression with sleek, modern designs and compelling content. Compatible with PowerPoint, Keynote, and Google Slides for a smooth presentation experience on any platform.


5 slides
Workplace Productivity Moments Presentation
Track progress and boost team performance with this clear and colorful productivity grid. Ideal for visualizing routines, task cycles, or time management strategies across a workweek or project phases. Each column and row is fully editable, making it easy to tailor the layout to your goals. Compatible with PowerPoint, Keynote, and Google Slides.


5 slides
Productivity and Time Optimization Presentation
Visualize time-saving strategies and workflow efficiency with this hourglass-themed productivity template. Ideal for illustrating phased progress, deadlines, or time distribution, this design breaks your message into four clear sections with engaging visuals. Fully editable in PowerPoint, Keynote, and Google Slides.


5 slides
The History of Beer Infographics
Beer has a long and fascinating history that dates back thousands of years, throughout its history beer has played a significant role in social, cultural, and economic contexts. These engaging infographics take viewers on a journey through the fascinating history of beer. It provides a comprehensive overview of the origins, evolution, and cultural significance of beer throughout different eras and regions. This visual resource is perfect for beer enthusiasts, historians, and anyone interested in the cultural and historical aspects of this beloved beverage. Compatible with Powerpoint, Keynote, and Google Slides.


5 slides
IT Infrastructure and Architecture
Visualize your tech ecosystem with this layered pyramid infographic designed for showcasing IT infrastructure components. Ideal for CIOs, network architects, or IT consultants, this slide highlights five essential levels—from hardware to services. Fully editable in PowerPoint, Keynote, and Google Slides.


5 slides
Asia Geographic and Business Analysis Map Presentation
Gain a strategic edge with the Asia Geographic and Business Analysis Map template, designed to visualize market trends and demographic data across the region. Ideal for businesses, investors, and academics, it supports PowerPoint, Keynote and Google Slides. This adaptable template is perfect for presenting geographic data analyses and exploring regional business potentials.


21 slides
Stonelight Qualitative Research Findings Presentation
Present your research findings with clarity and impact using this sleek and modern presentation template. Designed for professionals and researchers, it guides you through all key aspects of your project, from introduction and background to detailed literature reviews, methodology, and data collection processes. Showcase your insights with sections for data analysis, key findings, and results interpretation, ensuring your audience stays engaged. This template also includes areas for recommendations, implications, and future research opportunities, making it ideal for academic, business, or industry presentations. Fully customizable and compatible with PowerPoint, Google Slides, and Keynote, it adapts seamlessly to your branding and content needs. Communicate your findings effectively and make a lasting impression with this professional and polished design.


21 slides
Karma Design Portfolio Presentation
Step into the spotlight with this bold and contemporary design portfolio! It presents your creative work in a sleek, visually striking format. From featured projects to your creative process and collaborations, this portfolio will leave a lasting impression. Perfect for showcasing your design style on PowerPoint, Keynote, or Google Slides!


6 slides
Domestic Statistics Infographic
Domestic statistics typically refers to numerical data and information related to a specific country's internal affairs, activities, and demographics. This infographics can be an effective way to present important data and trends related to a specific country or region. This template is designed with a balance between design aesthetics and data accuracy. By presenting the information in a visually engaging manner, you can effectively communicate key insights to your target audience. Compatible with Powerpoint, Keynote, and Google Slides. This ensures that your infographic is accessible by providing alternative text for images and using high-contrast colors.


6 slides
Agile Development Methodology Infographic
Discover a visually engaging way to present the Agile Development Methodology with our versatile infographic template. Perfect for Powerpoint, Google Slides, and Keynote users, this template breaks down complex Agile concepts into easy-to-understand visuals. Whether you're illustrating the cycle of sprints, the importance of daily scrums, or the process of backlog refinement and reviews, our infographic makes it simple. It’s ideal for project managers, agile coaches, scrum masters, and team members looking to communicate the flexibility and dynamics of Agile workflows. Adopt a clear, concise approach to explaining iterative development and foster a better understanding in your audience with this user-friendly template.