


Features
- 5 Unique slides
- Fully editable and easy to edit in Microsoft Powerpoint, Keynote and Google Slides
- 16:9 widescreen layout
- Clean and professional designs
- Export to JPG, PDF or send by email


Do you have any questions?
Recommend


7 slides
Concentric Circles Model Infographic Presentation
A Concentric Circle Infographic is a visual tool that represents information, data or ideas in a circular format, where each circle is centered inside the next larger circle. In this template you can use the circles to show the relationships between different elements or components, with the innermost circle representing the most important or central idea, and the outer circles representing related or peripheral ideas. Designed in Powerpoint, Keynote, and Google slides the circles in the template can be easily customized with different colors, sizes, and designs to fit your needs.


5 slides
Opportunity Mapping with Market Segments Presentation
Spot untapped potential with the Opportunity Mapping with Market Segments Presentation. This strategic quadrant chart helps visualize market segments by plotting quality against size, ideal for identifying where to focus efforts. Customize each section with your data in PowerPoint, Keynote, or Google Slides for a clean, professional pitch.


6 slides
International Business Operations Layout Presentation
Showcase your company’s global workflow with this international operations map. Featuring a step-by-step arrow layout and matching location markers, it’s perfect for visualizing supply chains, regional tasks, or expansion strategies. Easily customizable and ideal for executive briefings, logistics updates, and global strategy decks. Compatible with PowerPoint, Keynote, and Google Slides.


4 slides
Project Planning in Four Steps Presentation
Streamline your workflow with the Project Planning in Four Steps presentation. This structured slide layout simplifies task organization, milestone tracking, and goal-setting into a clear, four-step process. Perfect for business strategies, project management, and team collaboration. Fully customizable and compatible with PowerPoint, Keynote, and Google Slides for effortless integration.


15 slides
Business Journal Infographic
A Business Journal Infographic is a visual representation of data, information, or concepts related to business topics that typically follow the style and format often found in business journals or publications. This infographic is designed to present complex information quickly and clearly. The purpose of this is to convey information in a visually engaging and easily digestible format, making it easier for readers to grasp complex business concepts or data. With this template transform your business narrative into a captivating visual story that not only informs but inspires readers to delve into the world of entrepreneurship.


6 slides
Effective Meeting Strategies Presentation
Maximize meeting productivity with the "Effective Meeting Strategies" presentation template. This tool offers a visually engaging layout that helps you outline and implement meeting tactics that promote efficiency and focus. Ideal for team leads and managers looking to streamline communication within meetings, it is compatible with PowerPoint, Keynote, and Google Slides, ensuring accessibility across various platforms.


6 slides
Life Insurance Infographic
Life insurance is a contract between an individual and an insurance company, where the insurance company agrees to pay a sum of money (the death benefit) to the designated beneficiaries upon the death of the insured person. This infographic template is designed to provide a clear and concise overview of what life insurance is, why it is important, and the different types of life insurance coverage available. This infographic aims to educate and inform individuals about the value of life insurance in protecting their loved ones and securing their financial future. This infographic is compatible with Powerpoint, Keynote, and Google Slides.


22 slides
Glidebeam Content Marketing Pitch Deck Presentation
Capture your audience’s attention and showcase your marketing strategy with confidence using this polished and thoughtfully designed marketing pitch deck. It covers key elements like company history, target audience, competitive landscape, financial highlights, and growth strategies. Ideal for pitches or meetings, it’s compatible with PowerPoint, Keynote, and Google Slides.


4 slides
Visual Decision-Making with Harvey Balls
Make smart decisions faster with this clean and strategic Harvey Balls layout. Ideal for comparing key business factors or project options, this slide helps illustrate progress and priorities through four percentage-based visuals. Fully customizable in PowerPoint, Keynote, and Google Slides.


4 slides
Employee Training and Development
Train smarter, not harder—with this bold funnel-style visual that maps your employee development journey from initial training to measurable impact. It's perfect for illustrating progress, performance shifts, or development stages across teams or roles. Fully customizable in PowerPoint, Keynote, and Google Slides for smooth integration into any professional presentation.


22 slides
Virtus Qualitative Research Findings Presentation
This qualitative research findings template features a modern design with geometric shapes and a professional palette of blue, gold, and black. It’s structured to showcase research details effectively, covering objectives, methodology, findings, limitations, and future directions. Compatible with PowerPoint, Keynote, and Google Slides for seamless presentations.


5 slides
Sprint Planning and Agile Cycle Overview Presentation
Break down agile sprints with this clean, circular cycle layout. Ideal for scrum teams and product managers to illustrate sprint planning, task flow, and iterative progress. Includes five key stages with icon support. Fully customizable in PowerPoint, Keynote, and Google Slides for agile ceremonies, planning sessions, or team training.


4 slides
Business Growth through AIDA Model Presentation
Visualize the buyer’s journey with this engaging AIDA model slide. Featuring rounded 3D-style shapes and clear progression from Attention to Action, this layout is ideal for marketing plans, customer engagement strategies, or sales funnels. Each stage is color-coded and icon-enhanced for clarity. Easily customizable in PowerPoint, Keynote, and Google Slides.


4 slides
IT Security Infrastructure Overview Presentation
Lock in your audience's attention with a clean, modern visual that breaks down tech barriers. This presentation template offers a snapshot of critical IT security components—think firewalls, cloud infrastructure, and data safeguards—making it easier to explain complex systems. Fully editable and compatible with PowerPoint, Keynote, and Google Slides for effortless customization.


7 slides
Transportation and Logistics Services Infographic
Transportation and logistics are critical to the functioning of modern economies, facilitating the movement of goods, people, and services from one place to another. This template is a professional infographic focusing on the main topics of transportation, logistics and their relationships. Use this template to illustrate the bustling world of transportation and logistic solutions from around the globe. It comes with a variety of diagrams and illustrations, which will make your presentation more appealing. This template is fully editable and compatible with Powerpoint, keynote and google slides.


20 slides
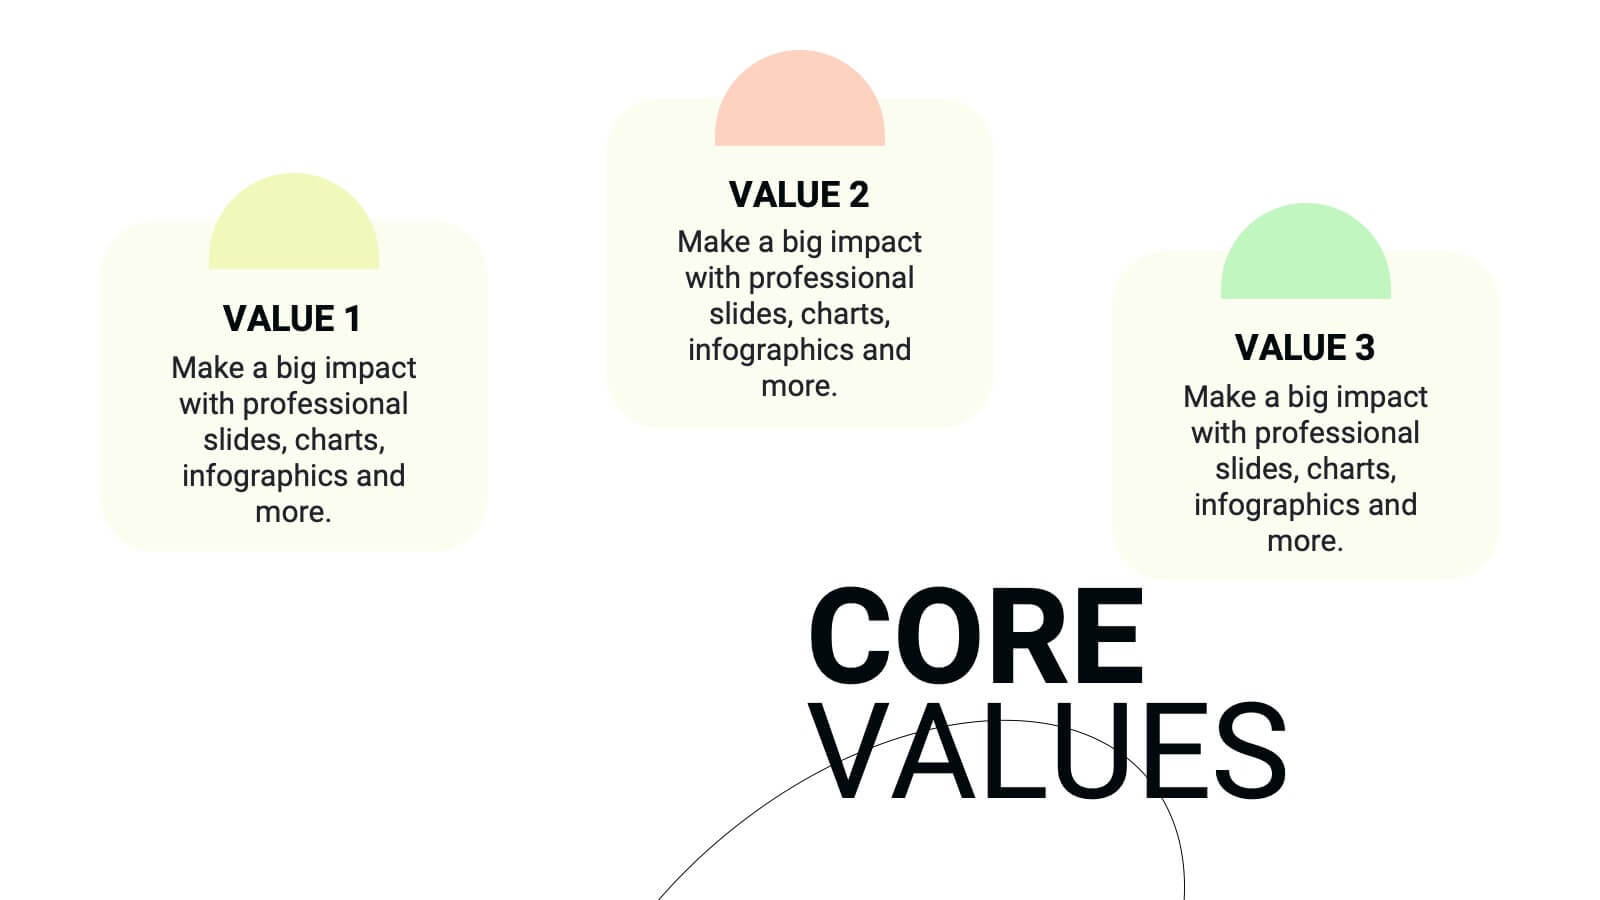
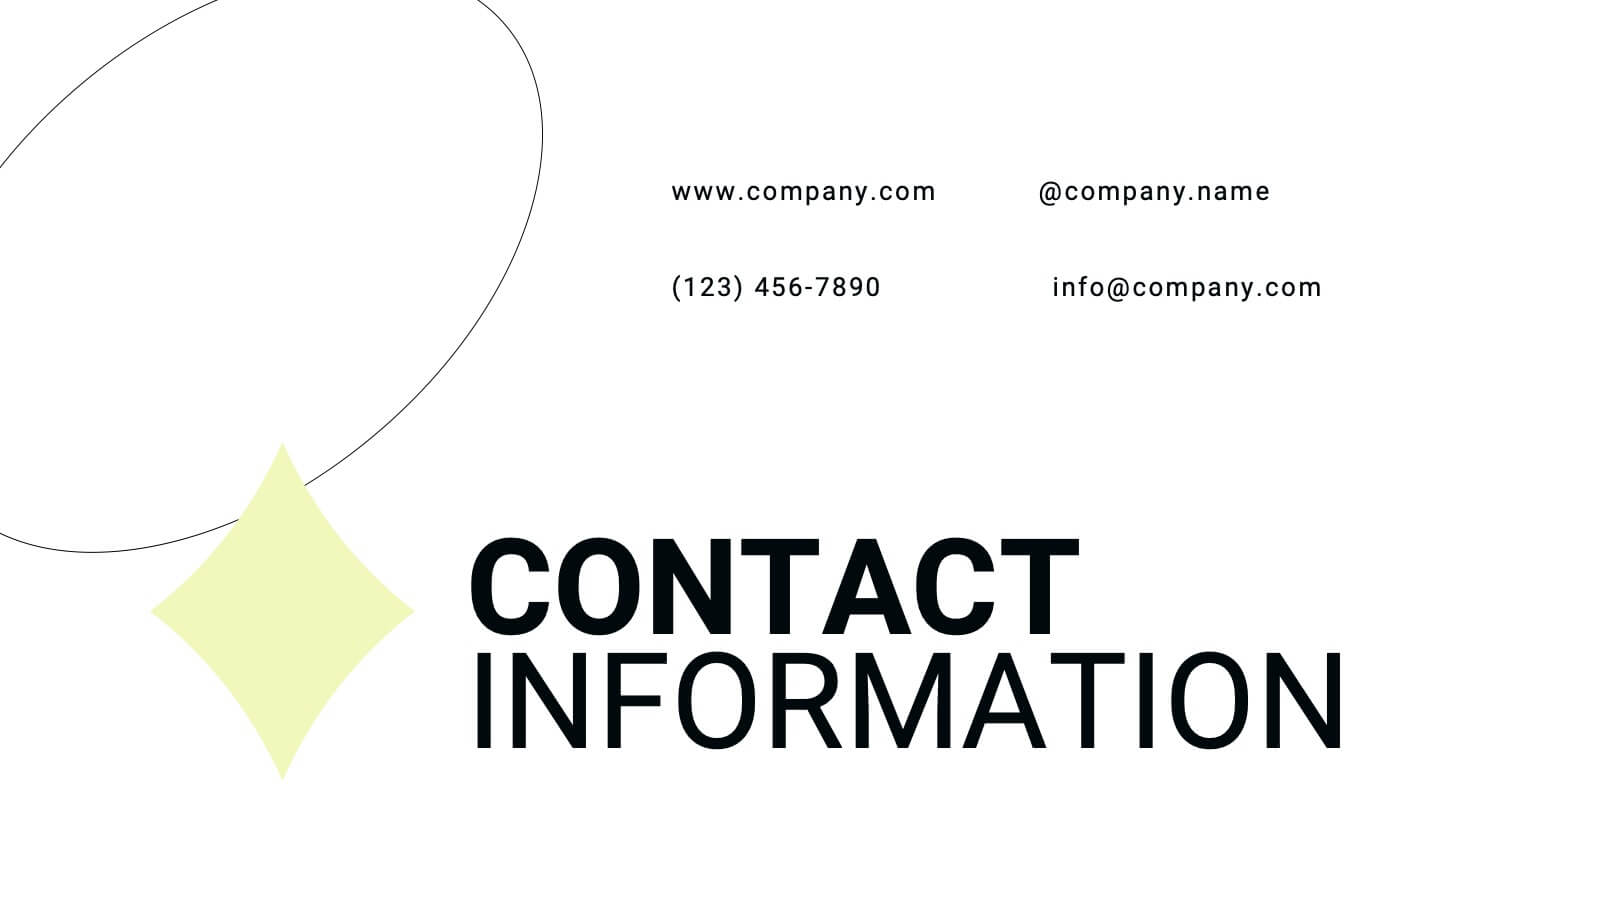
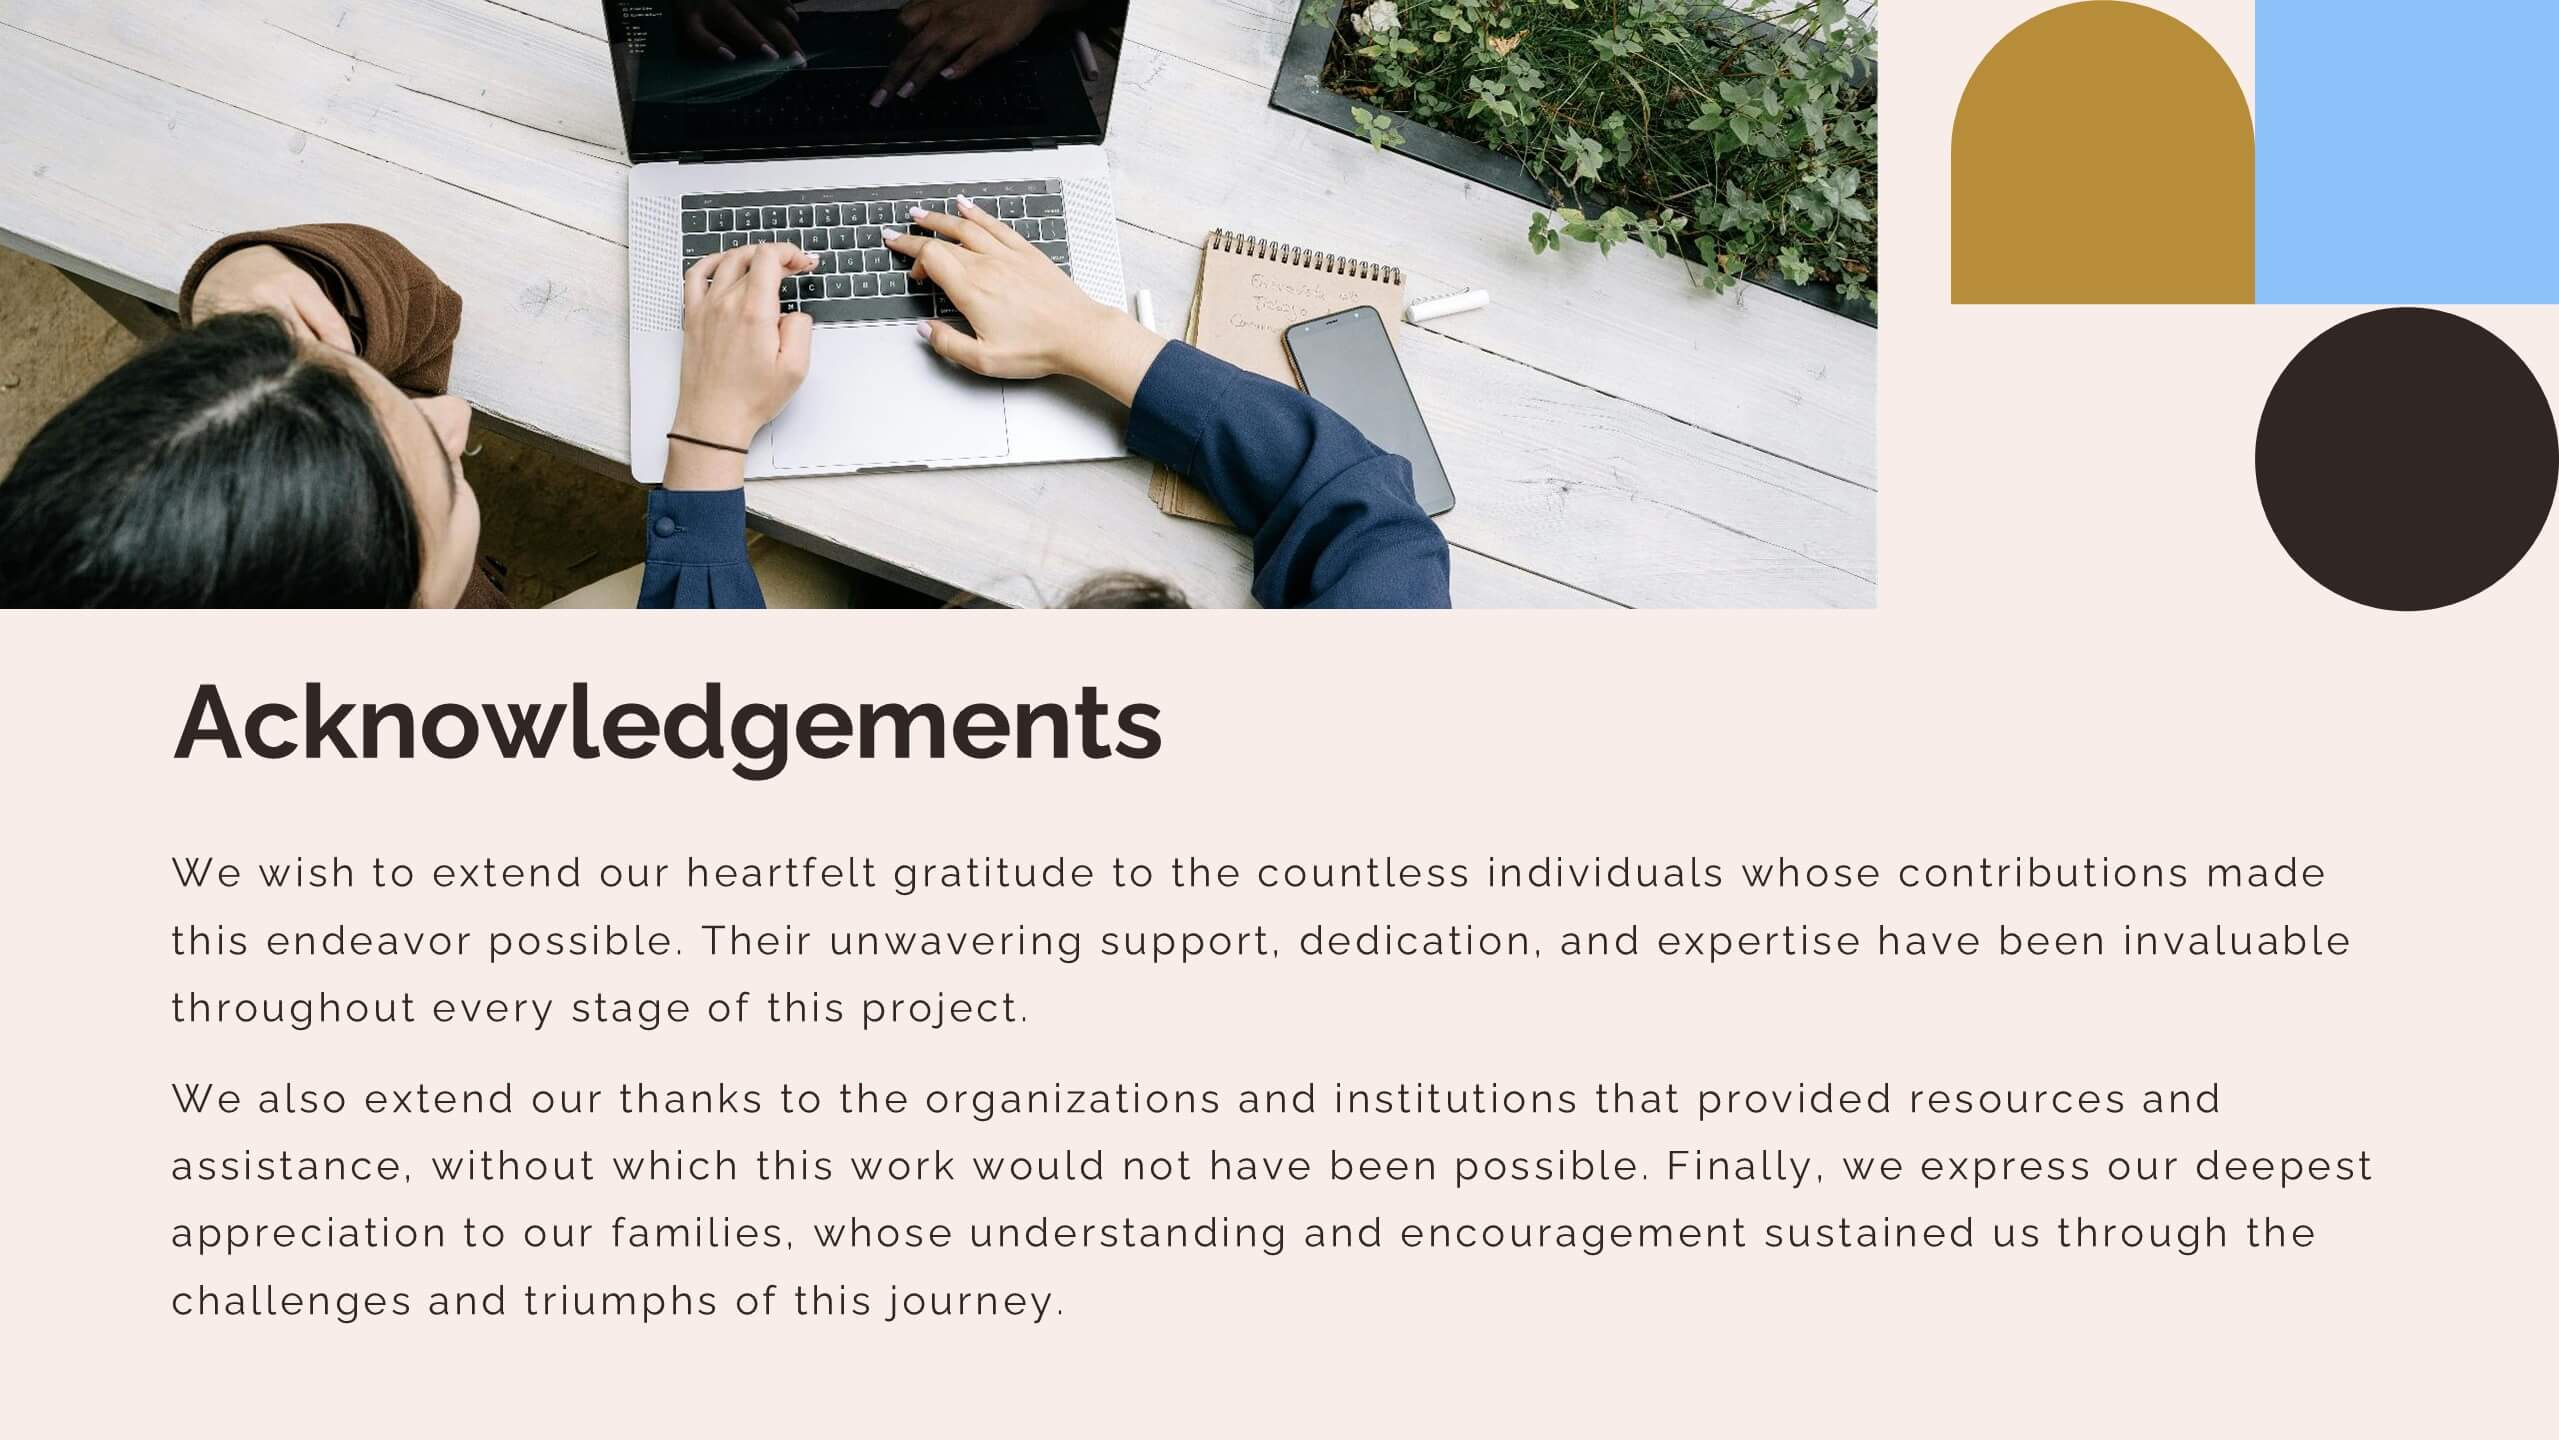
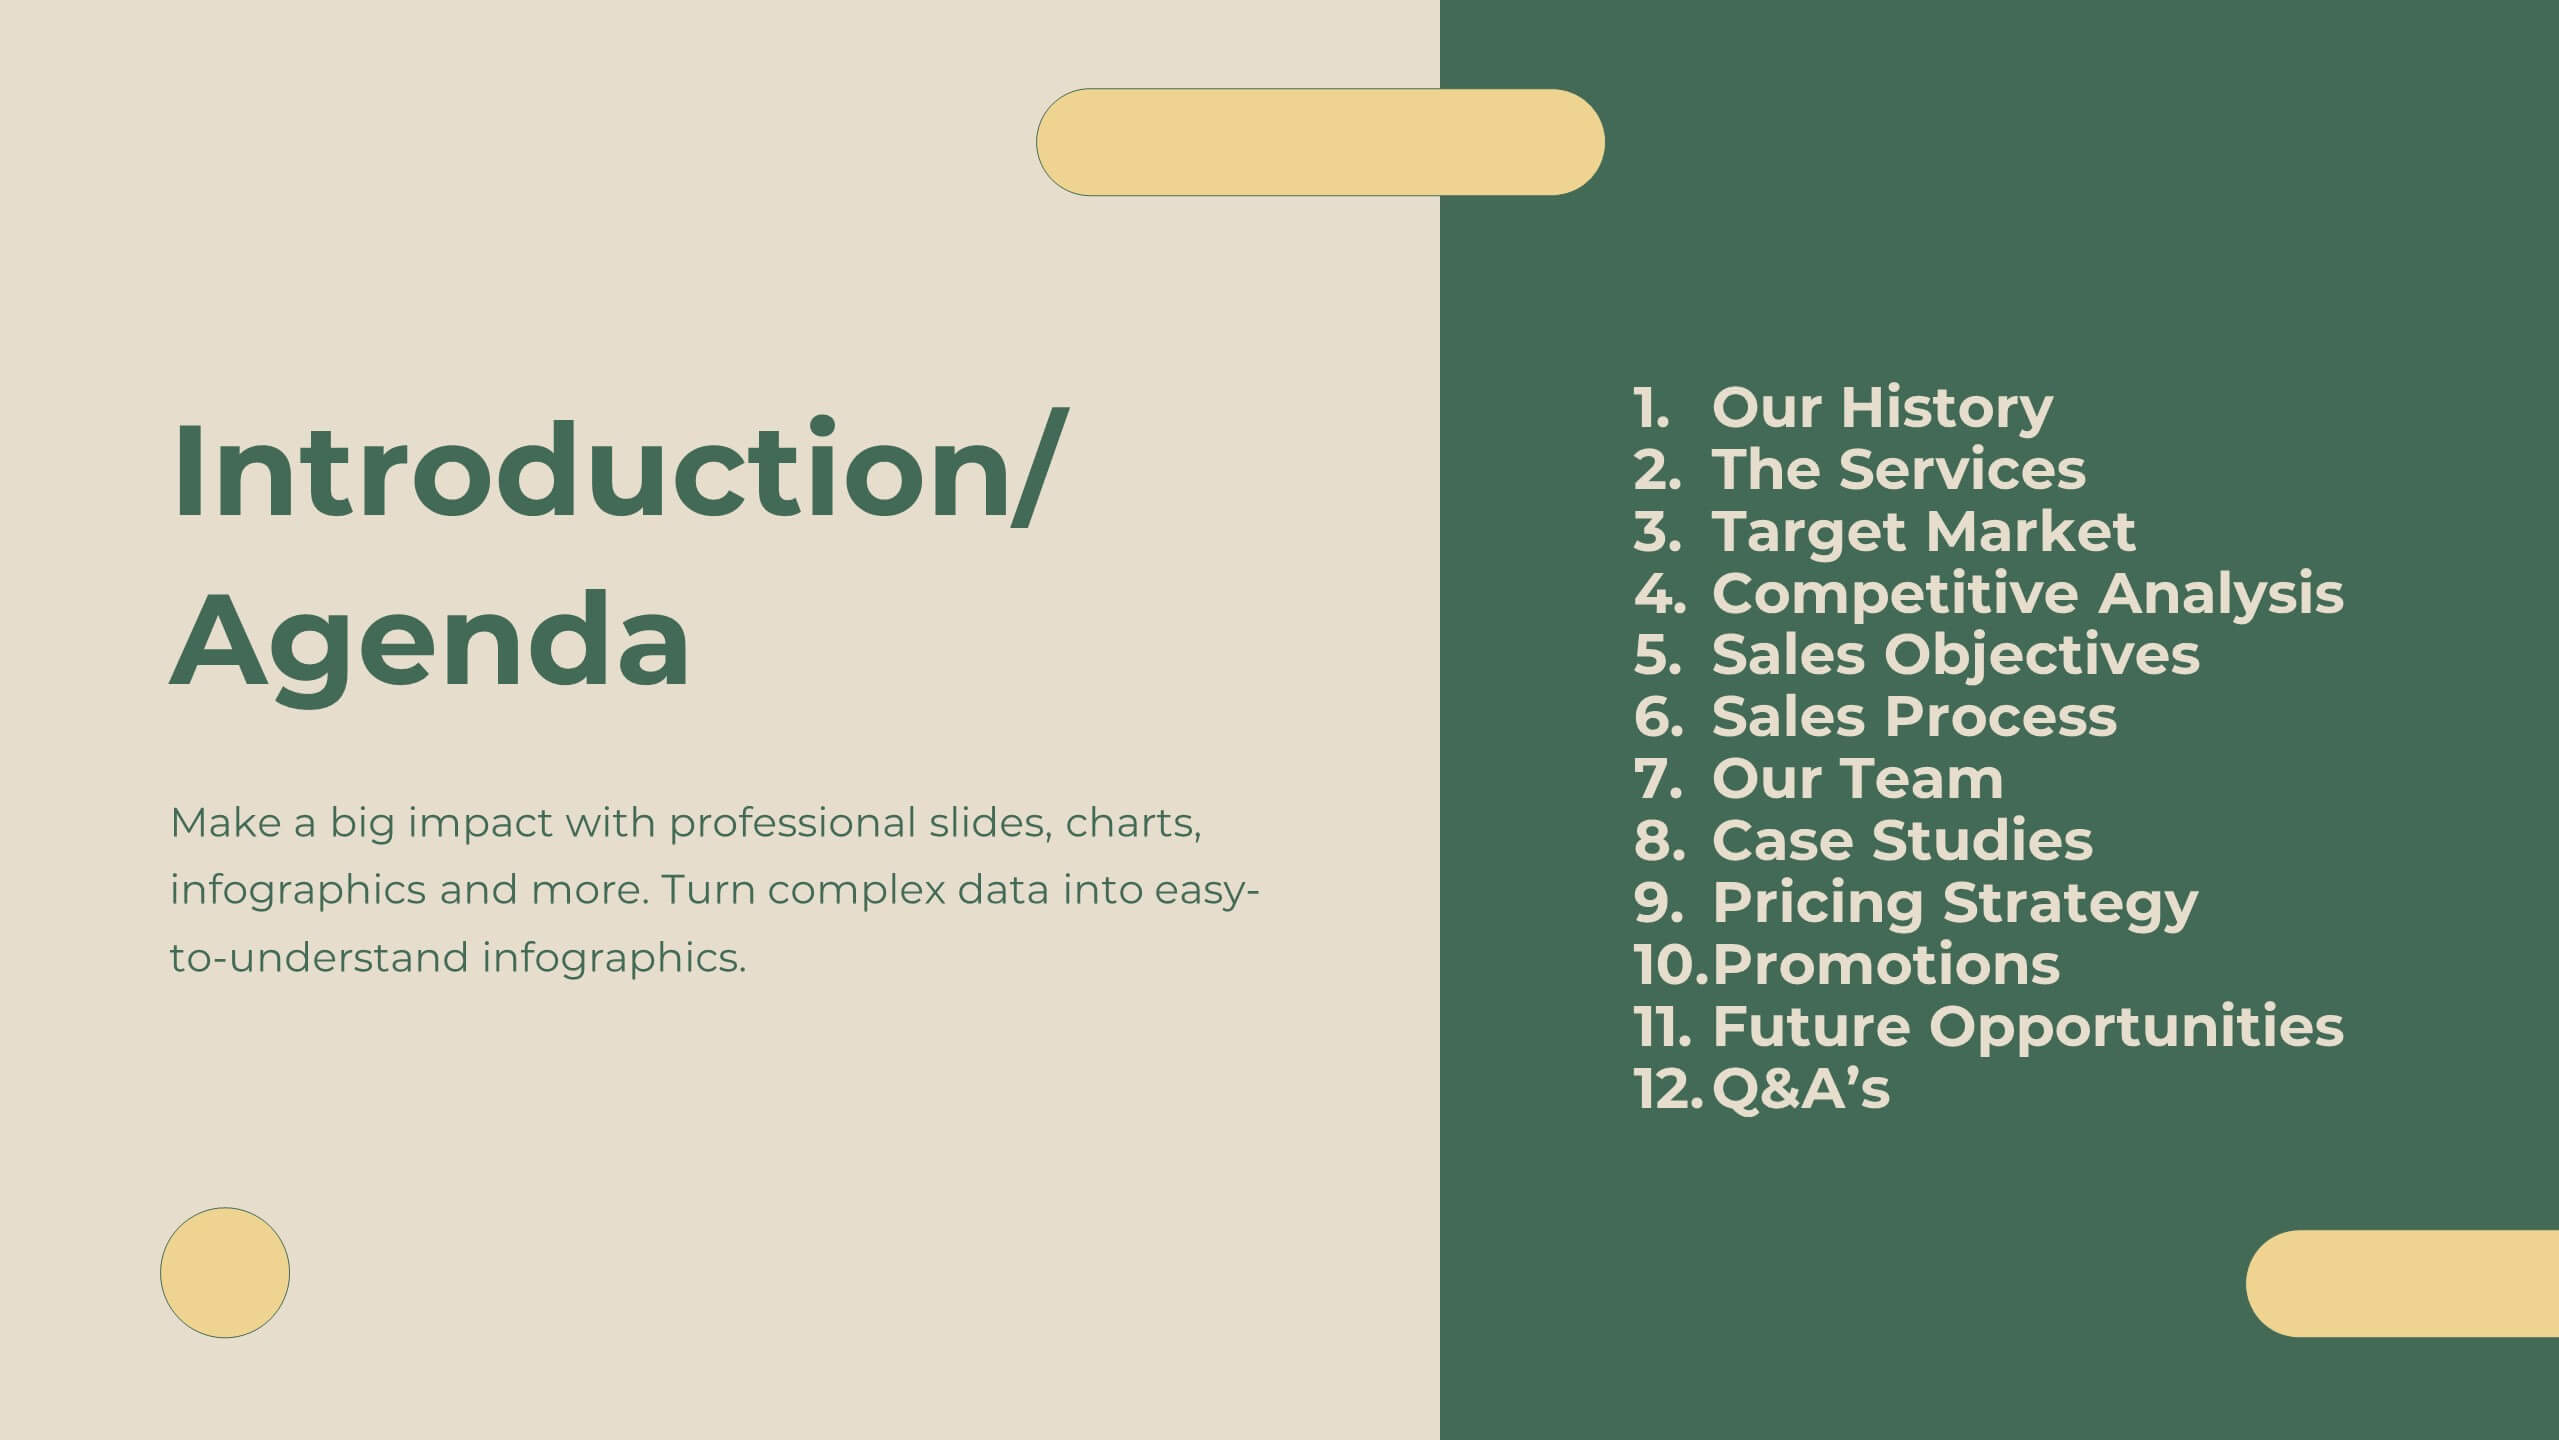
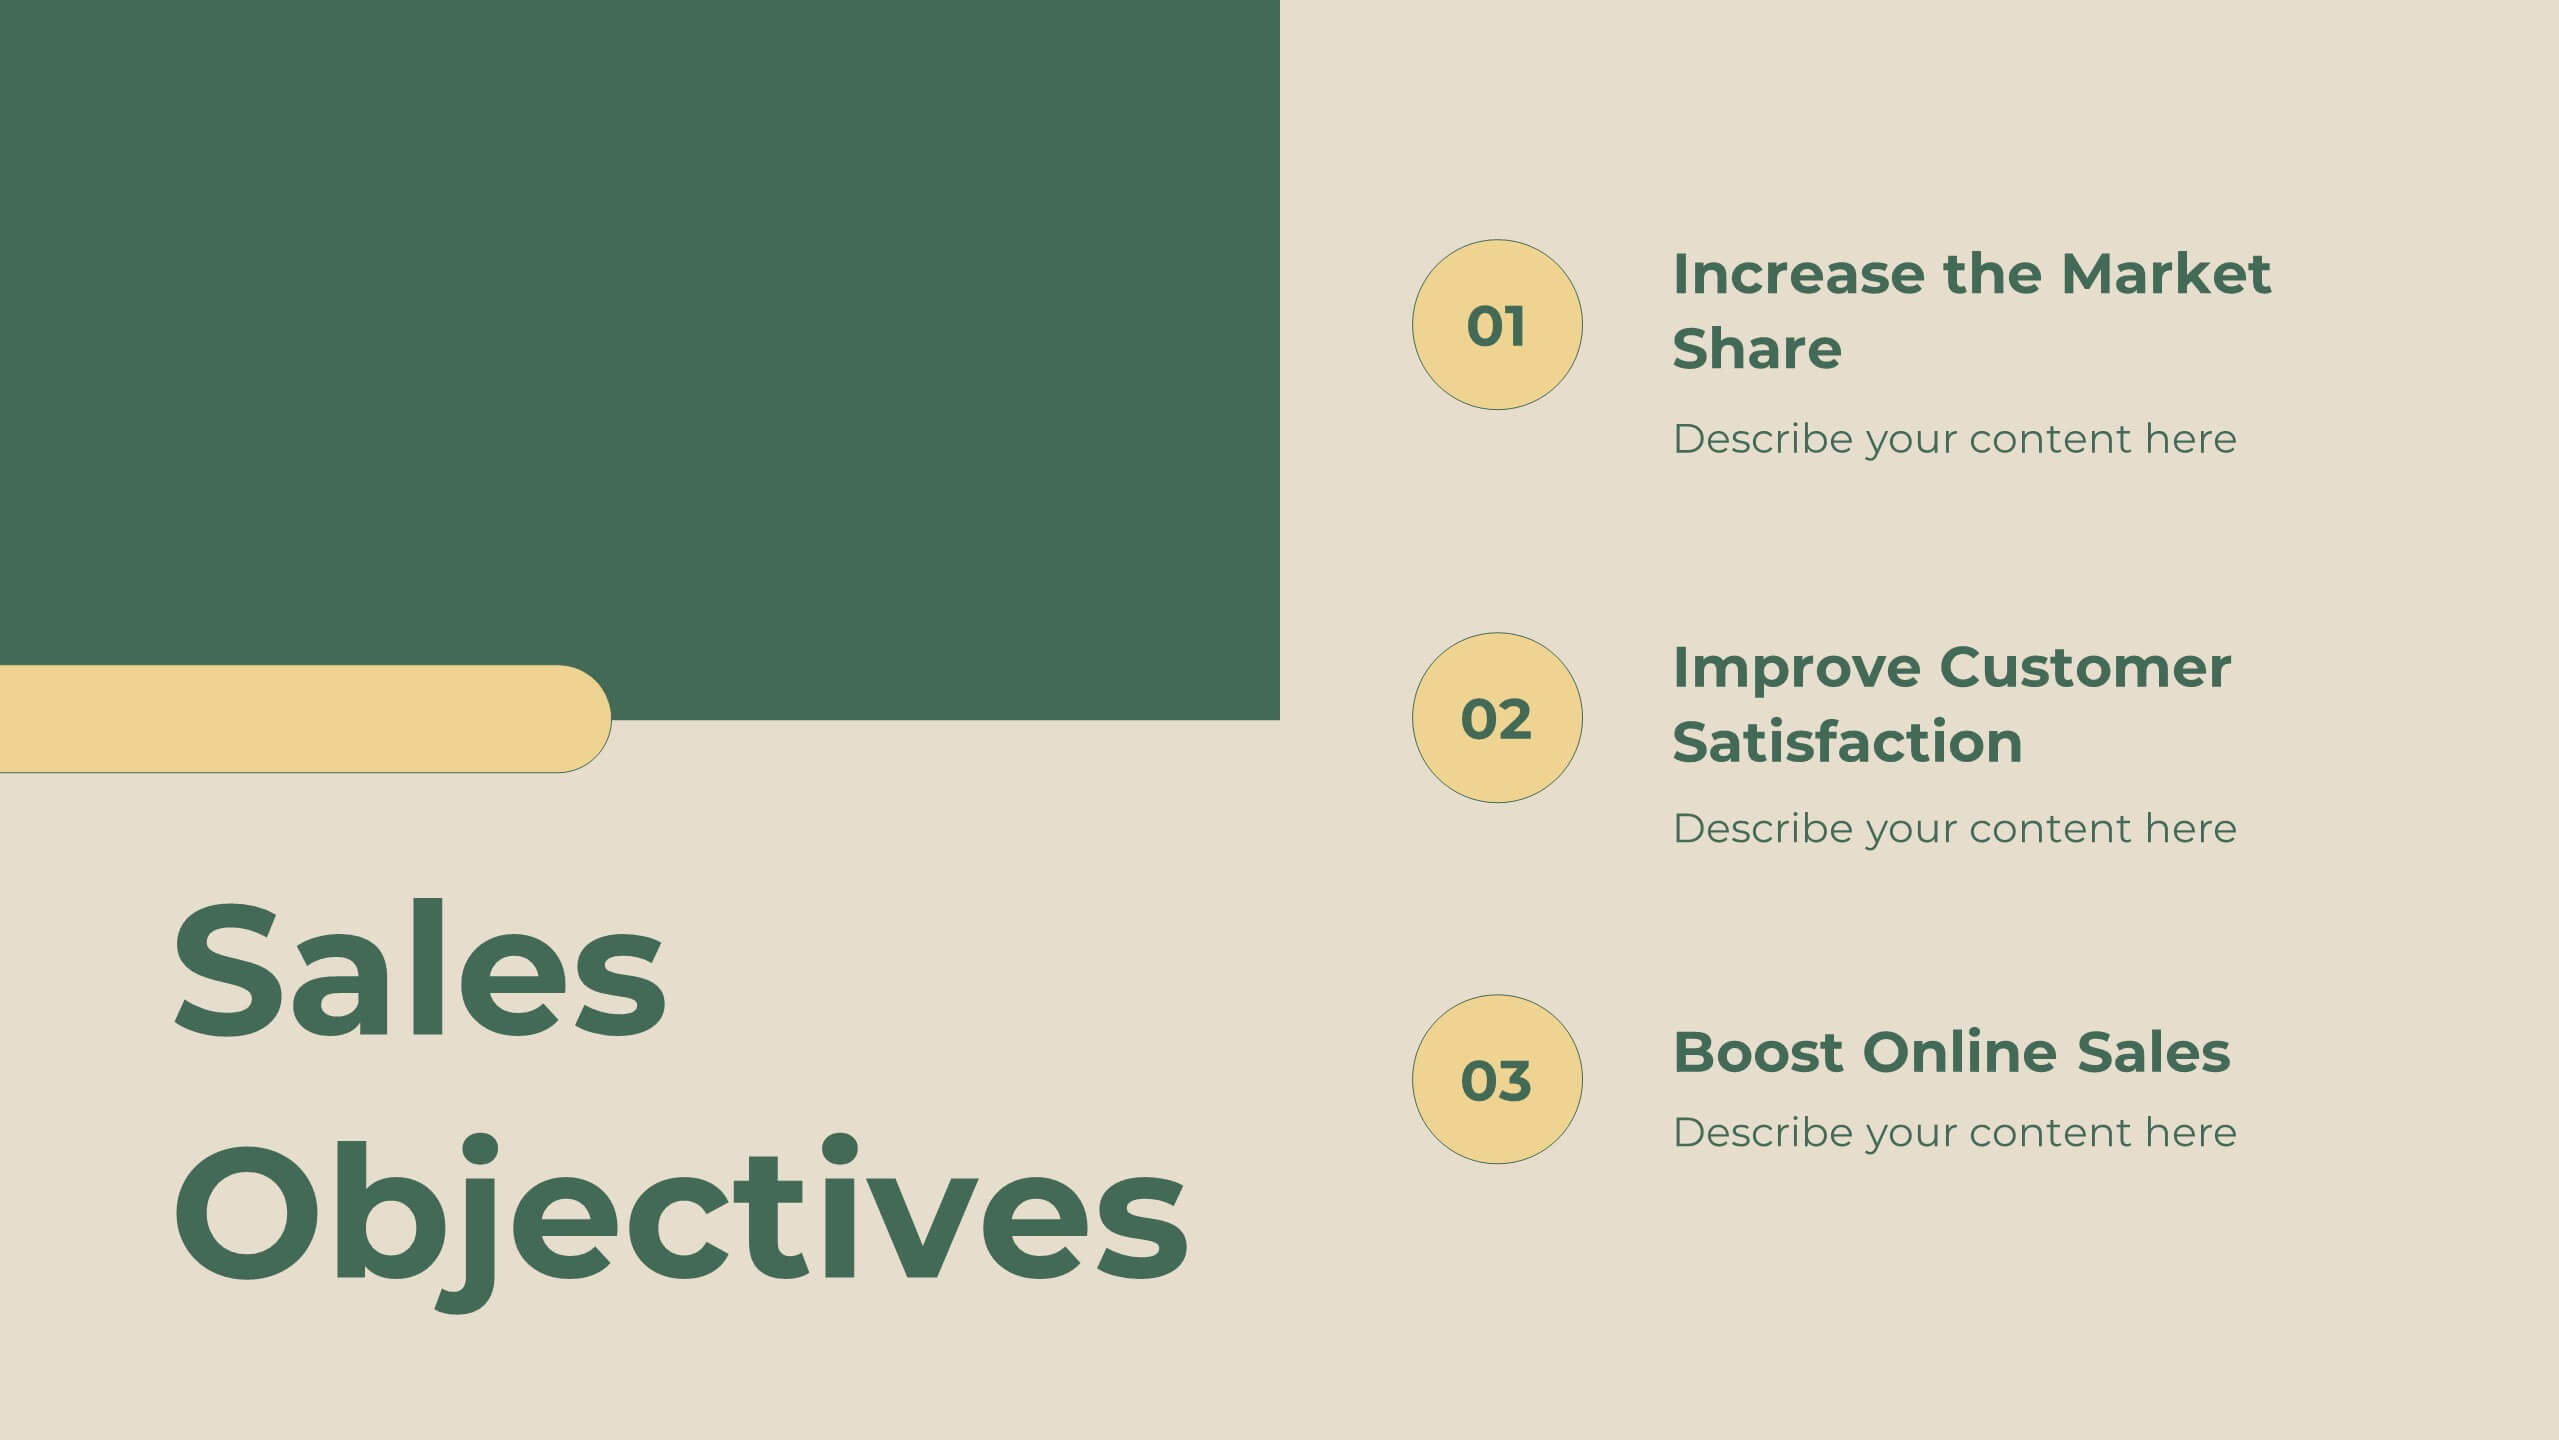
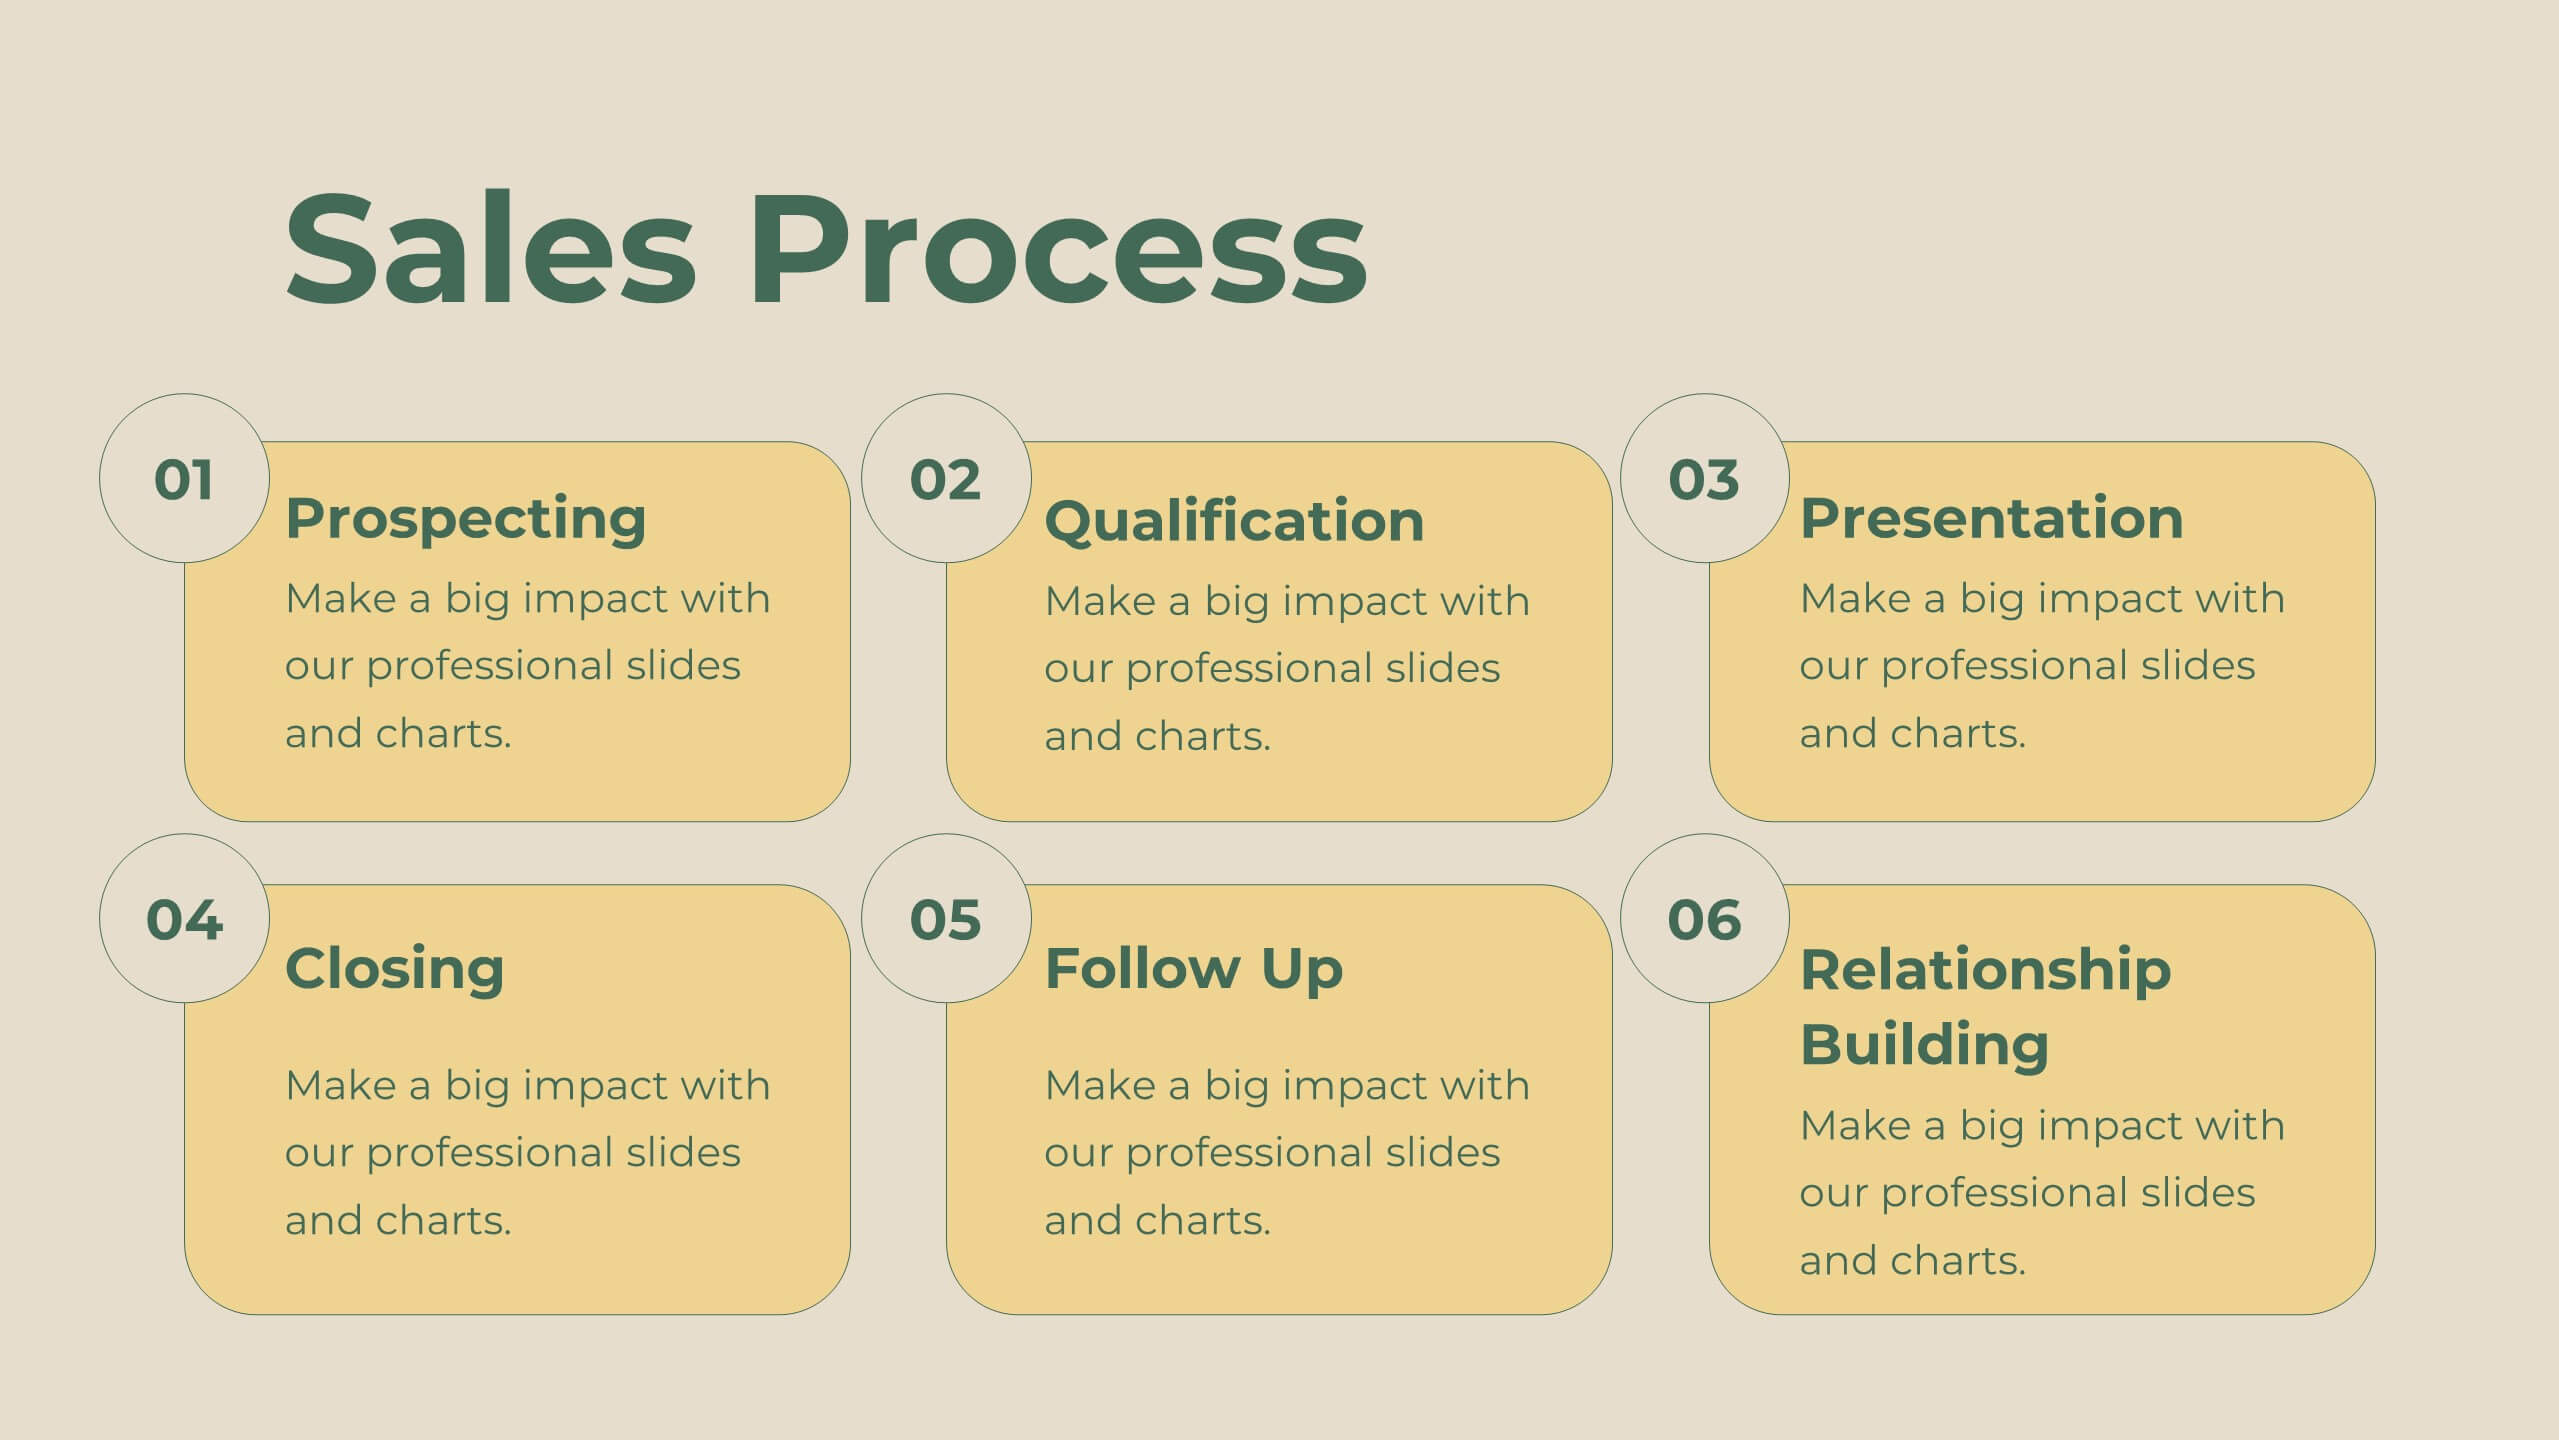
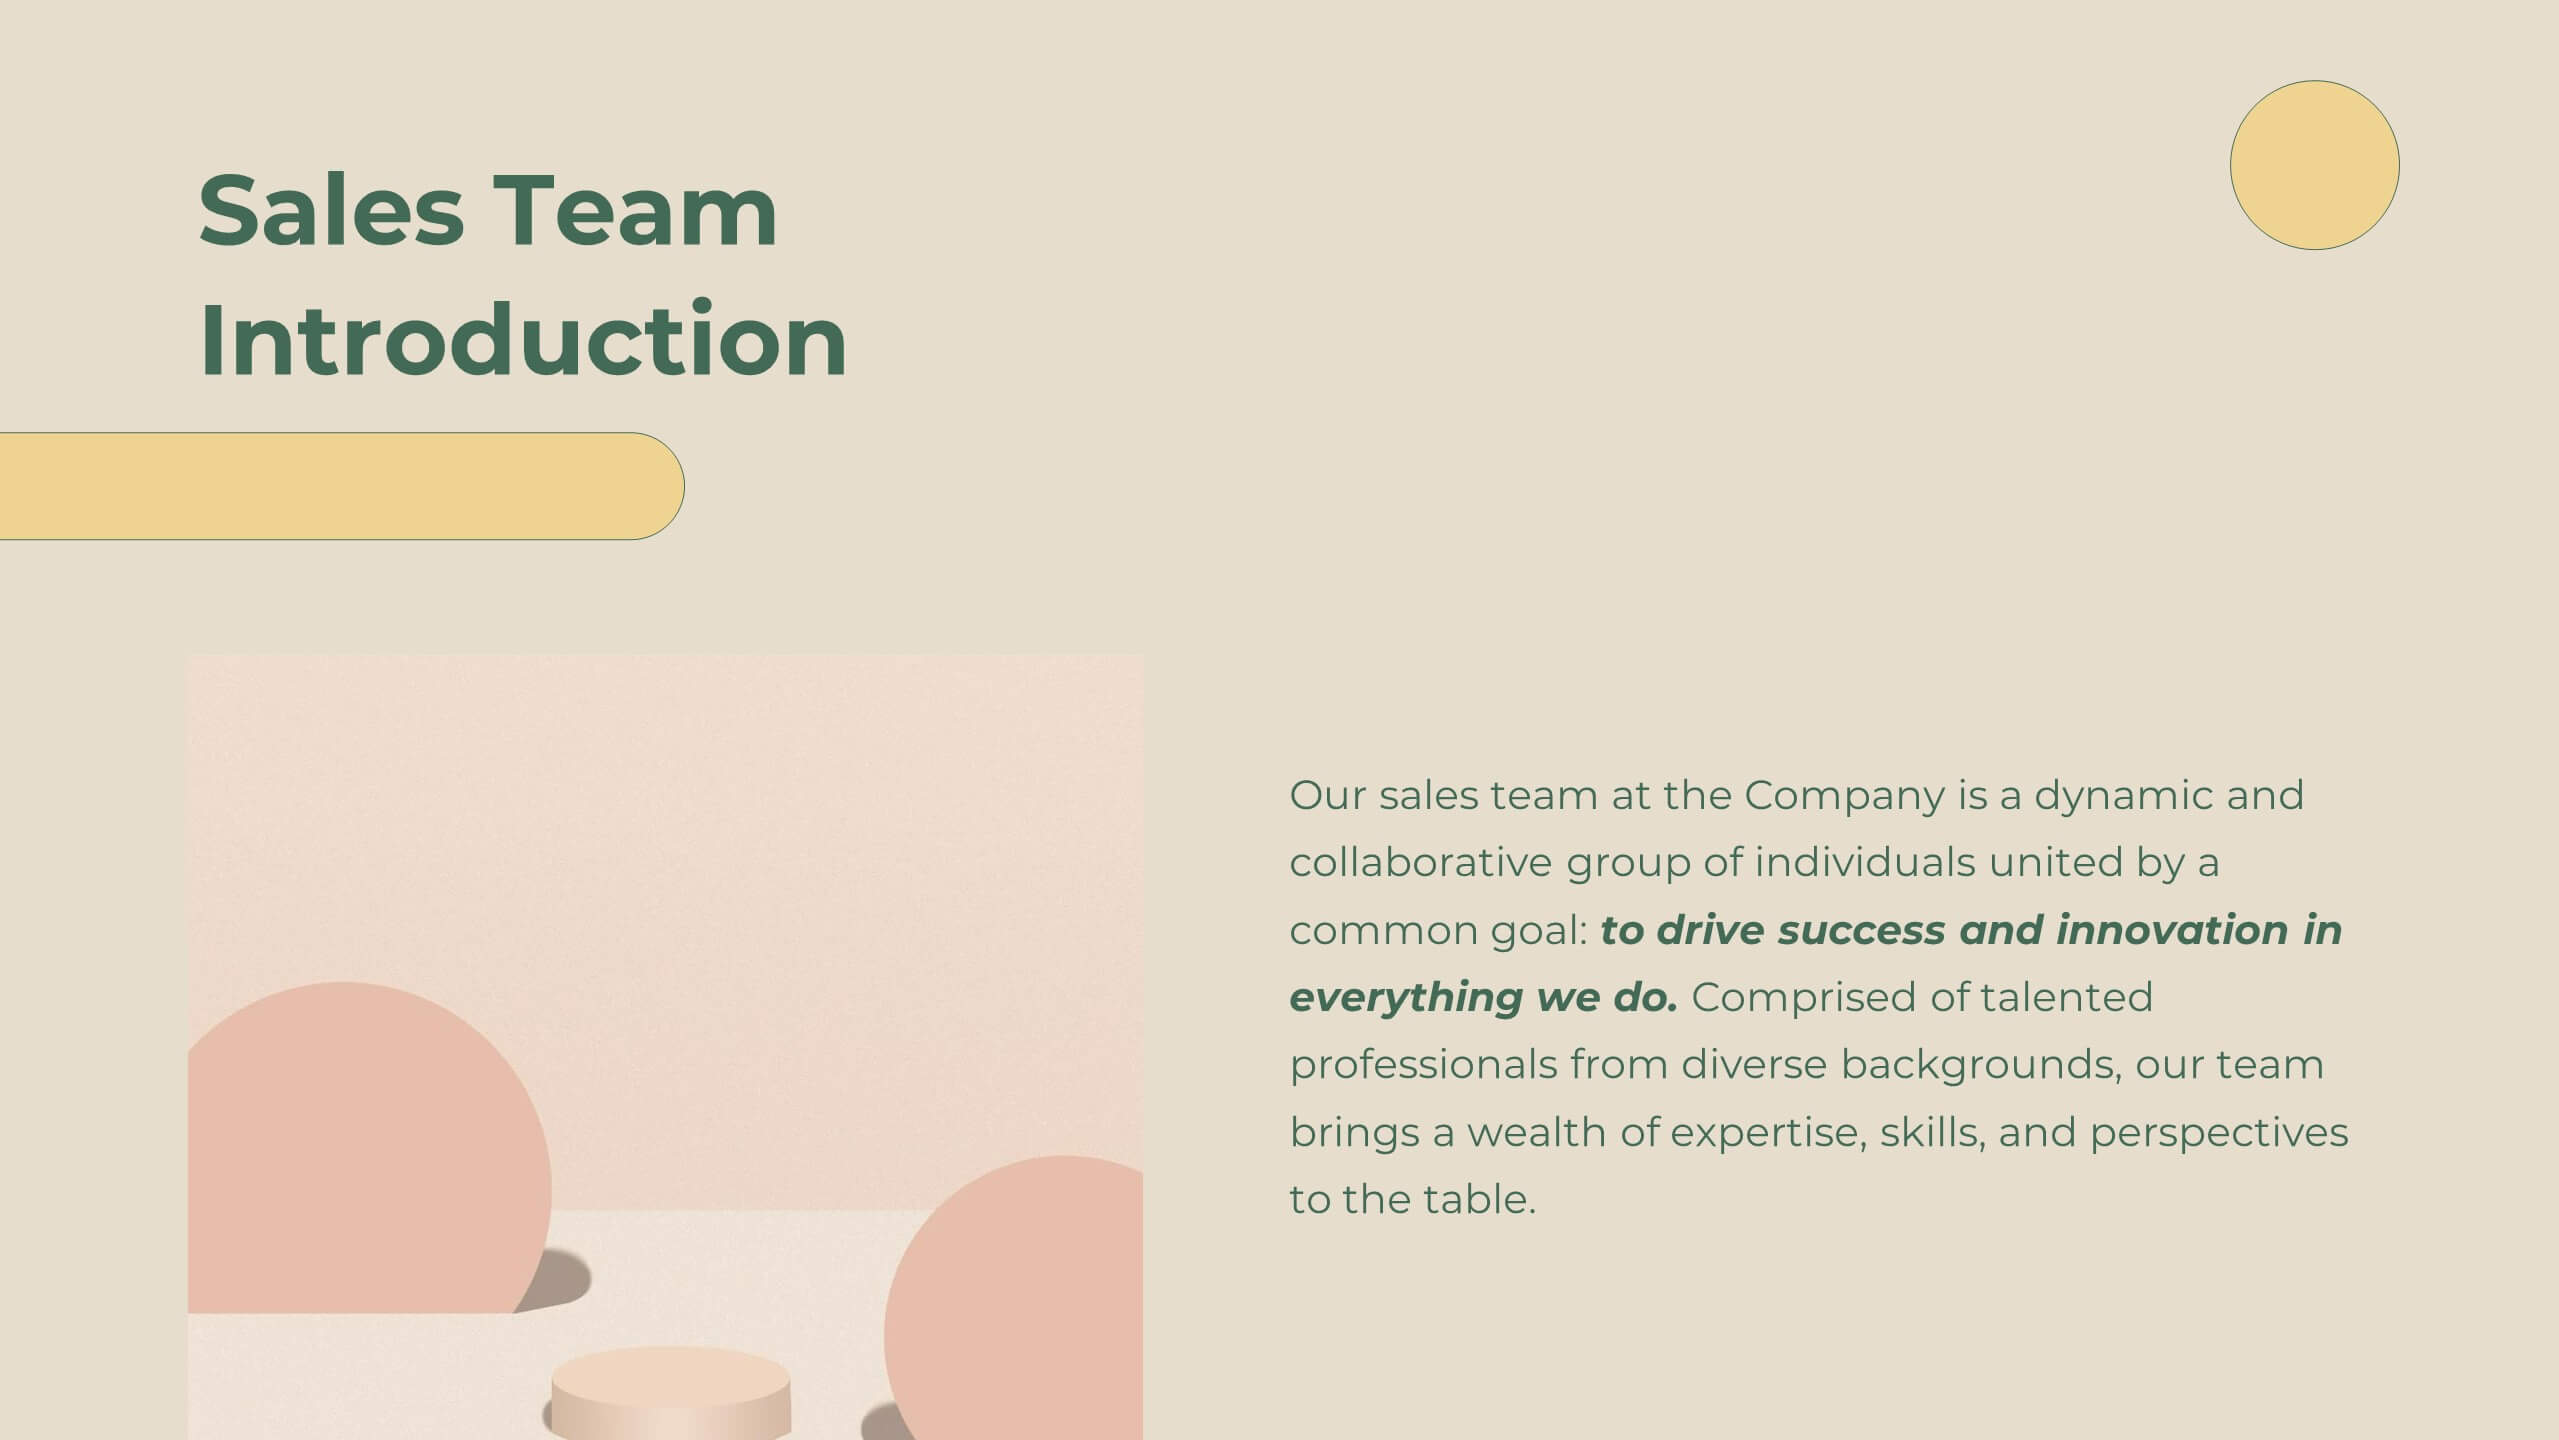
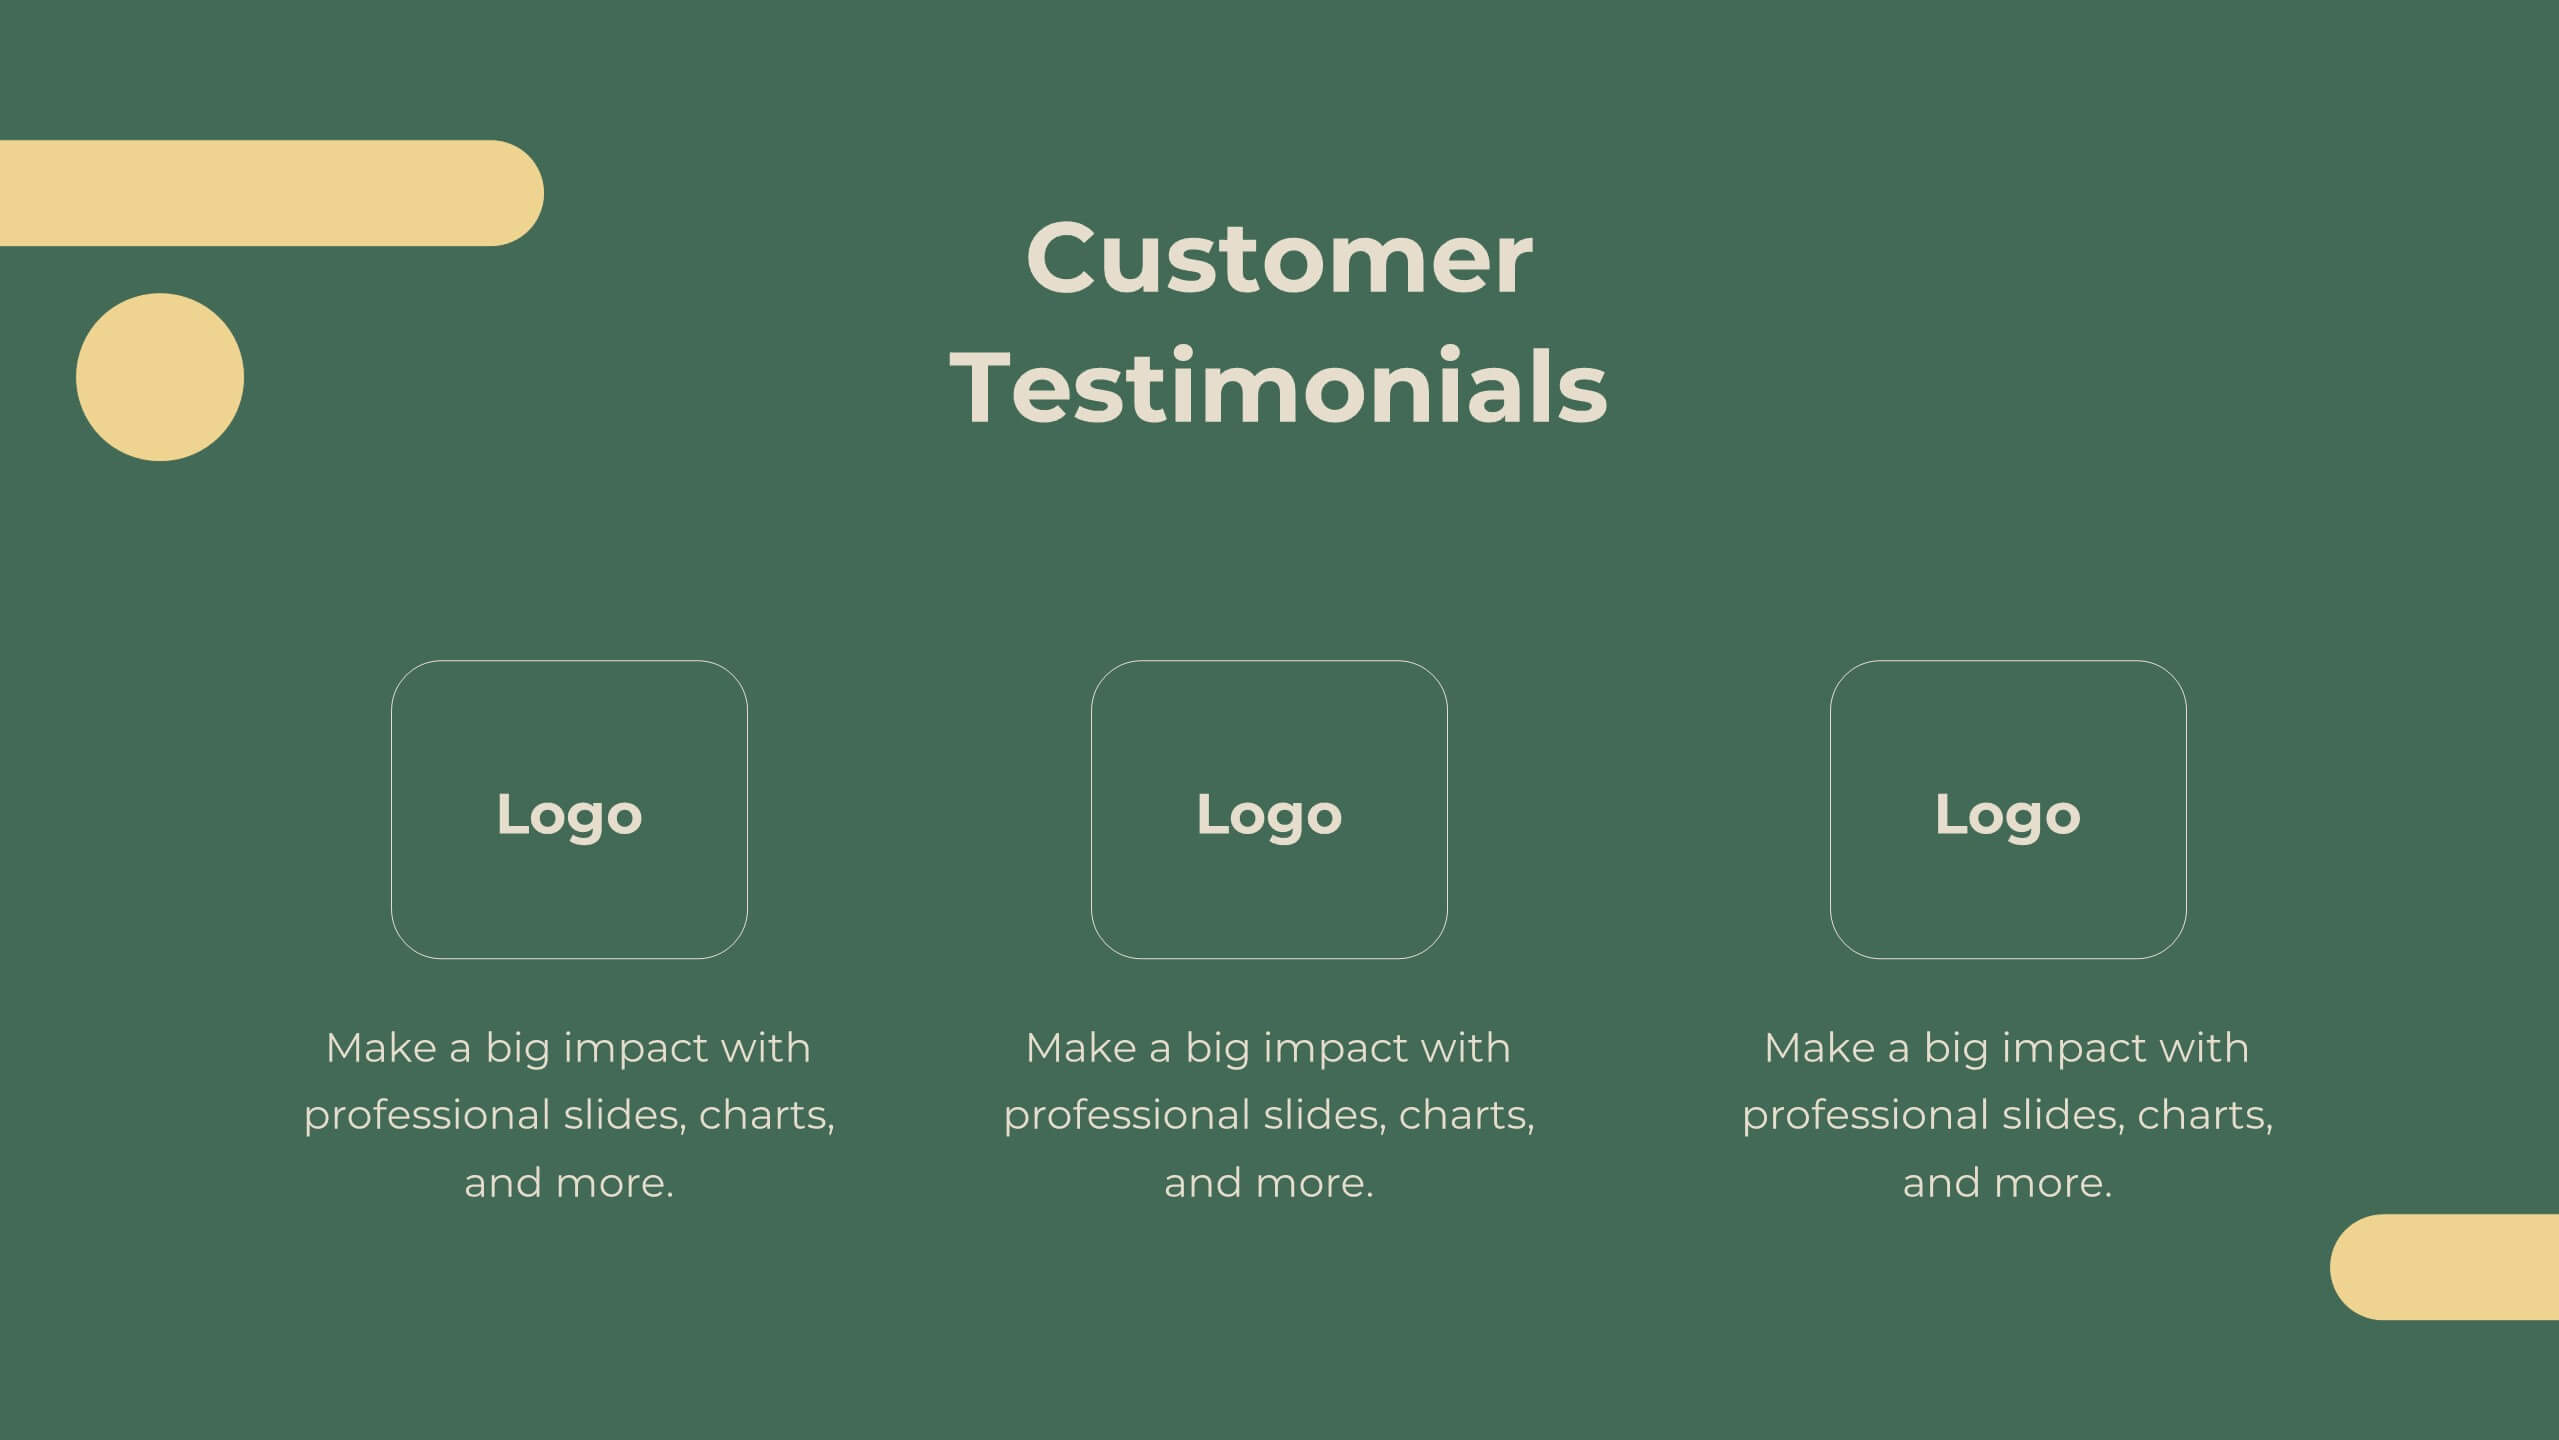
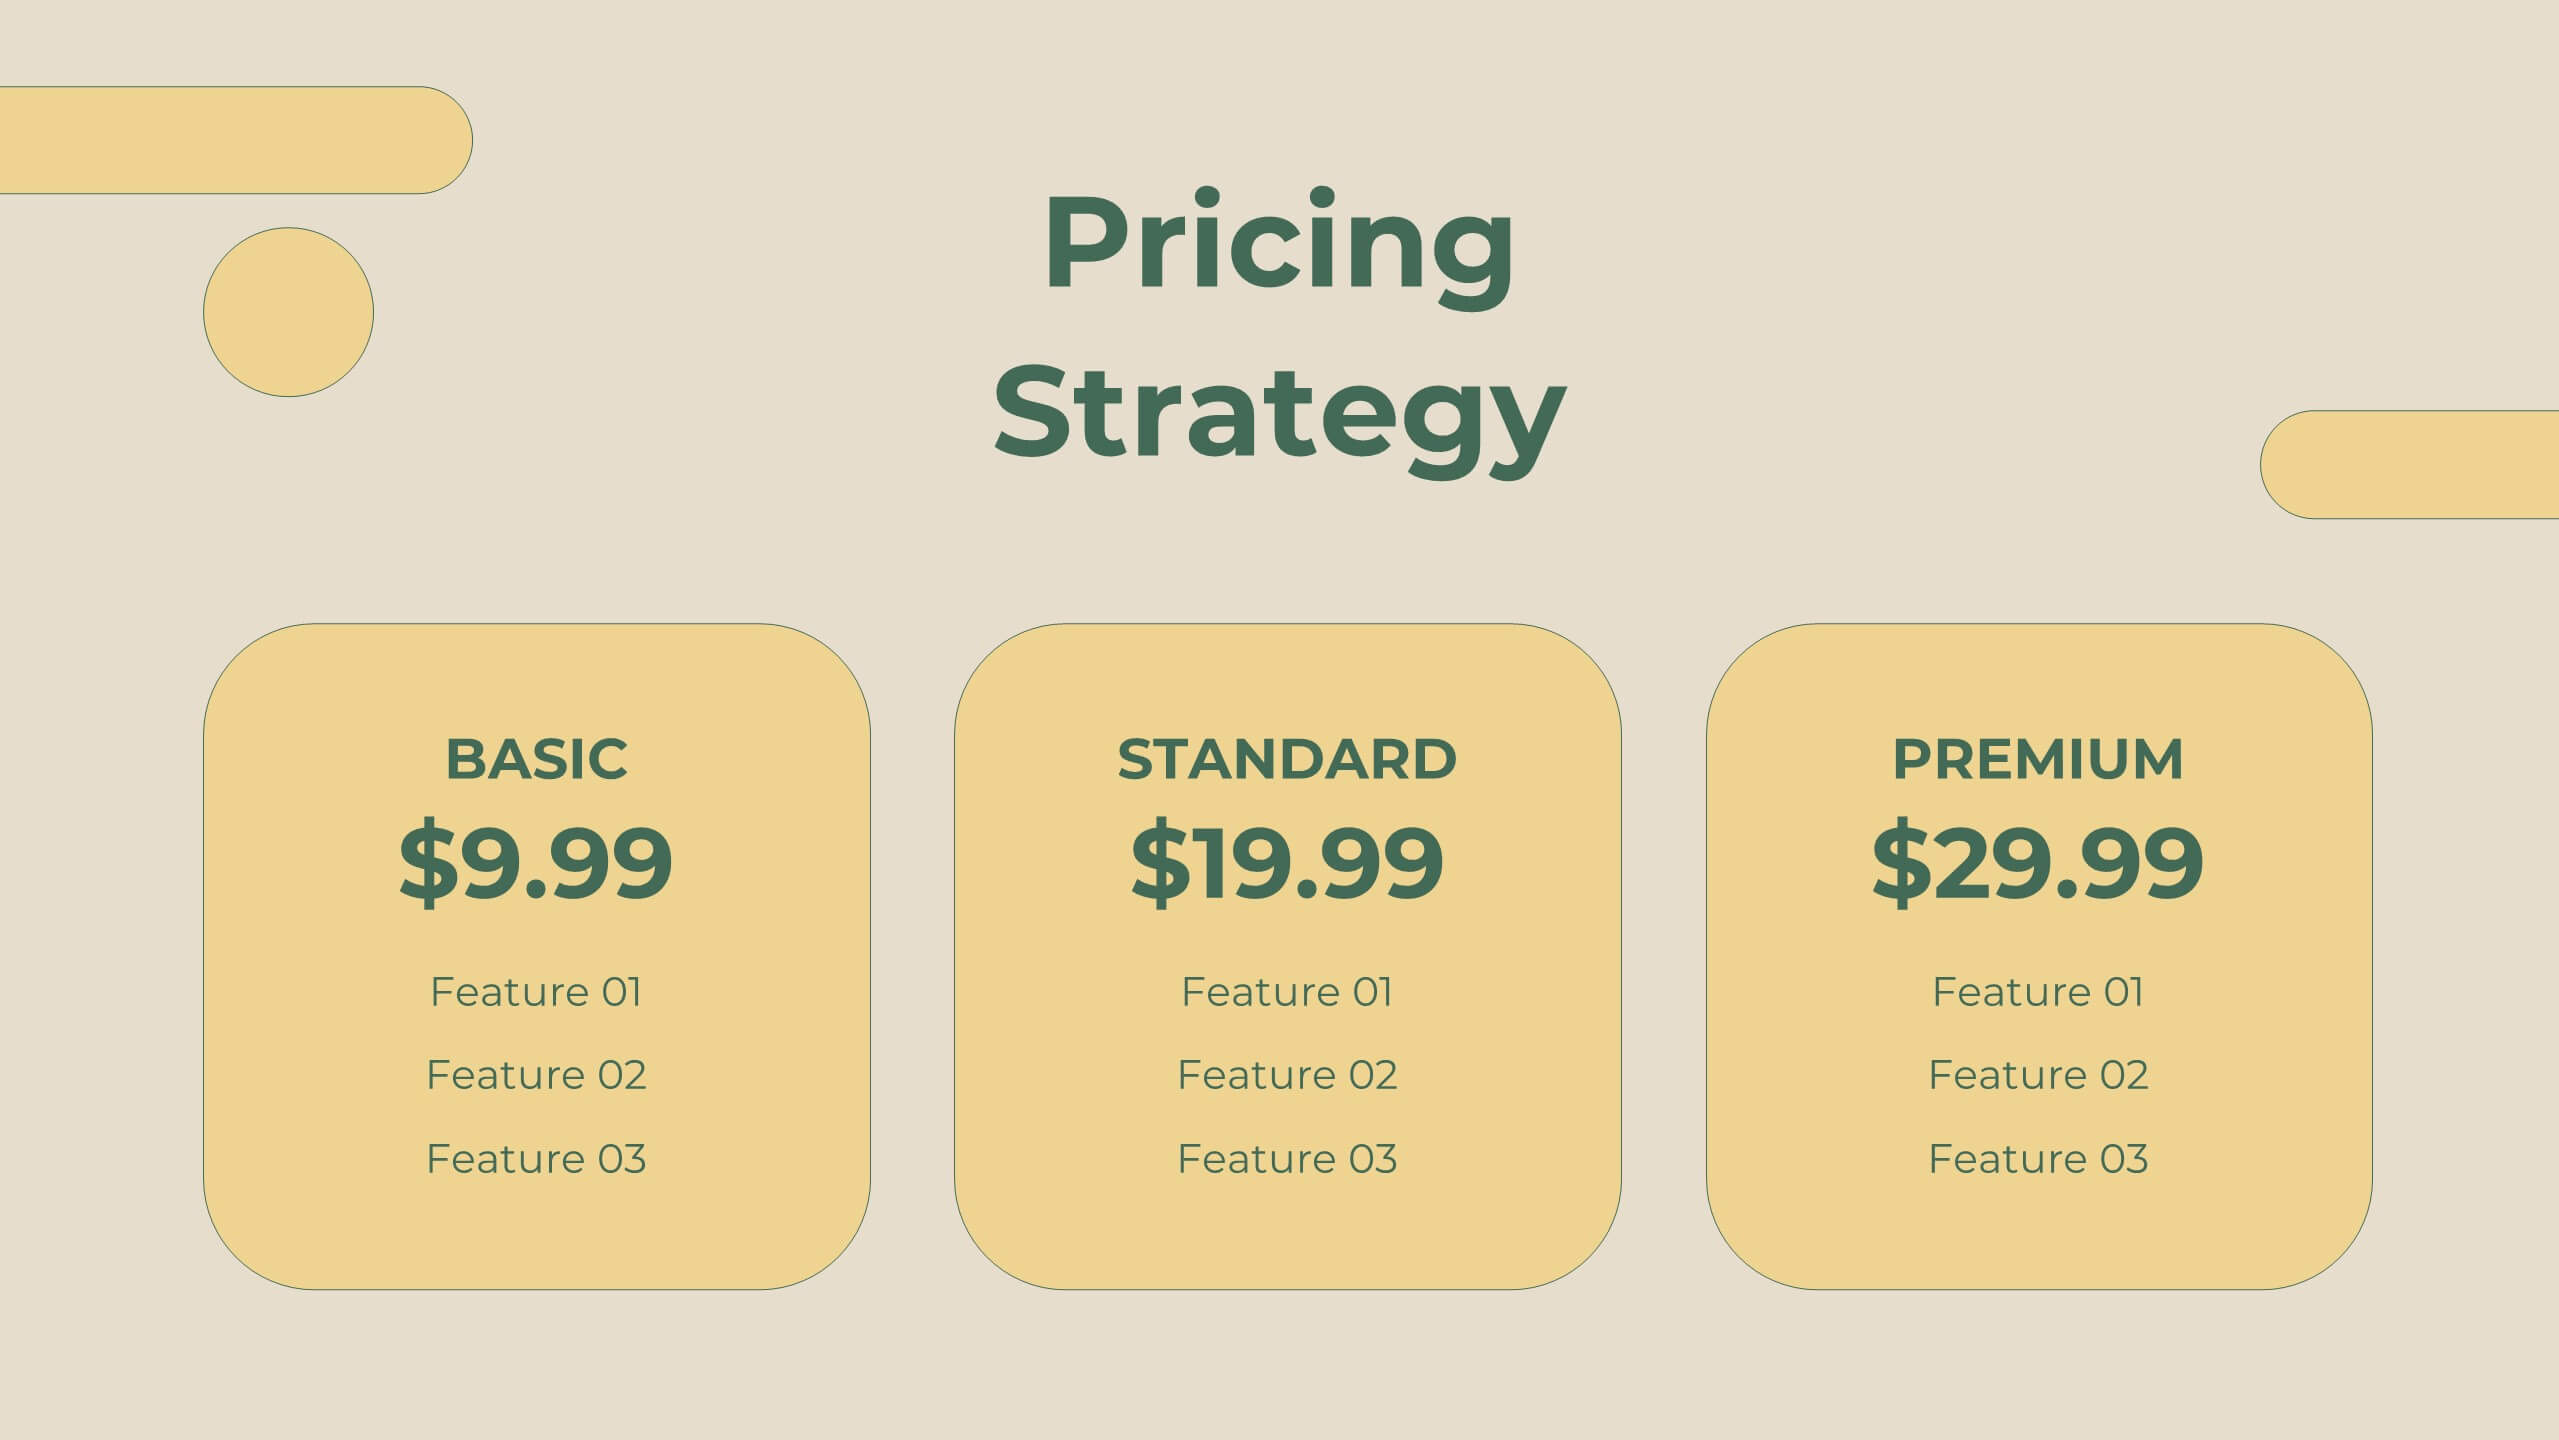
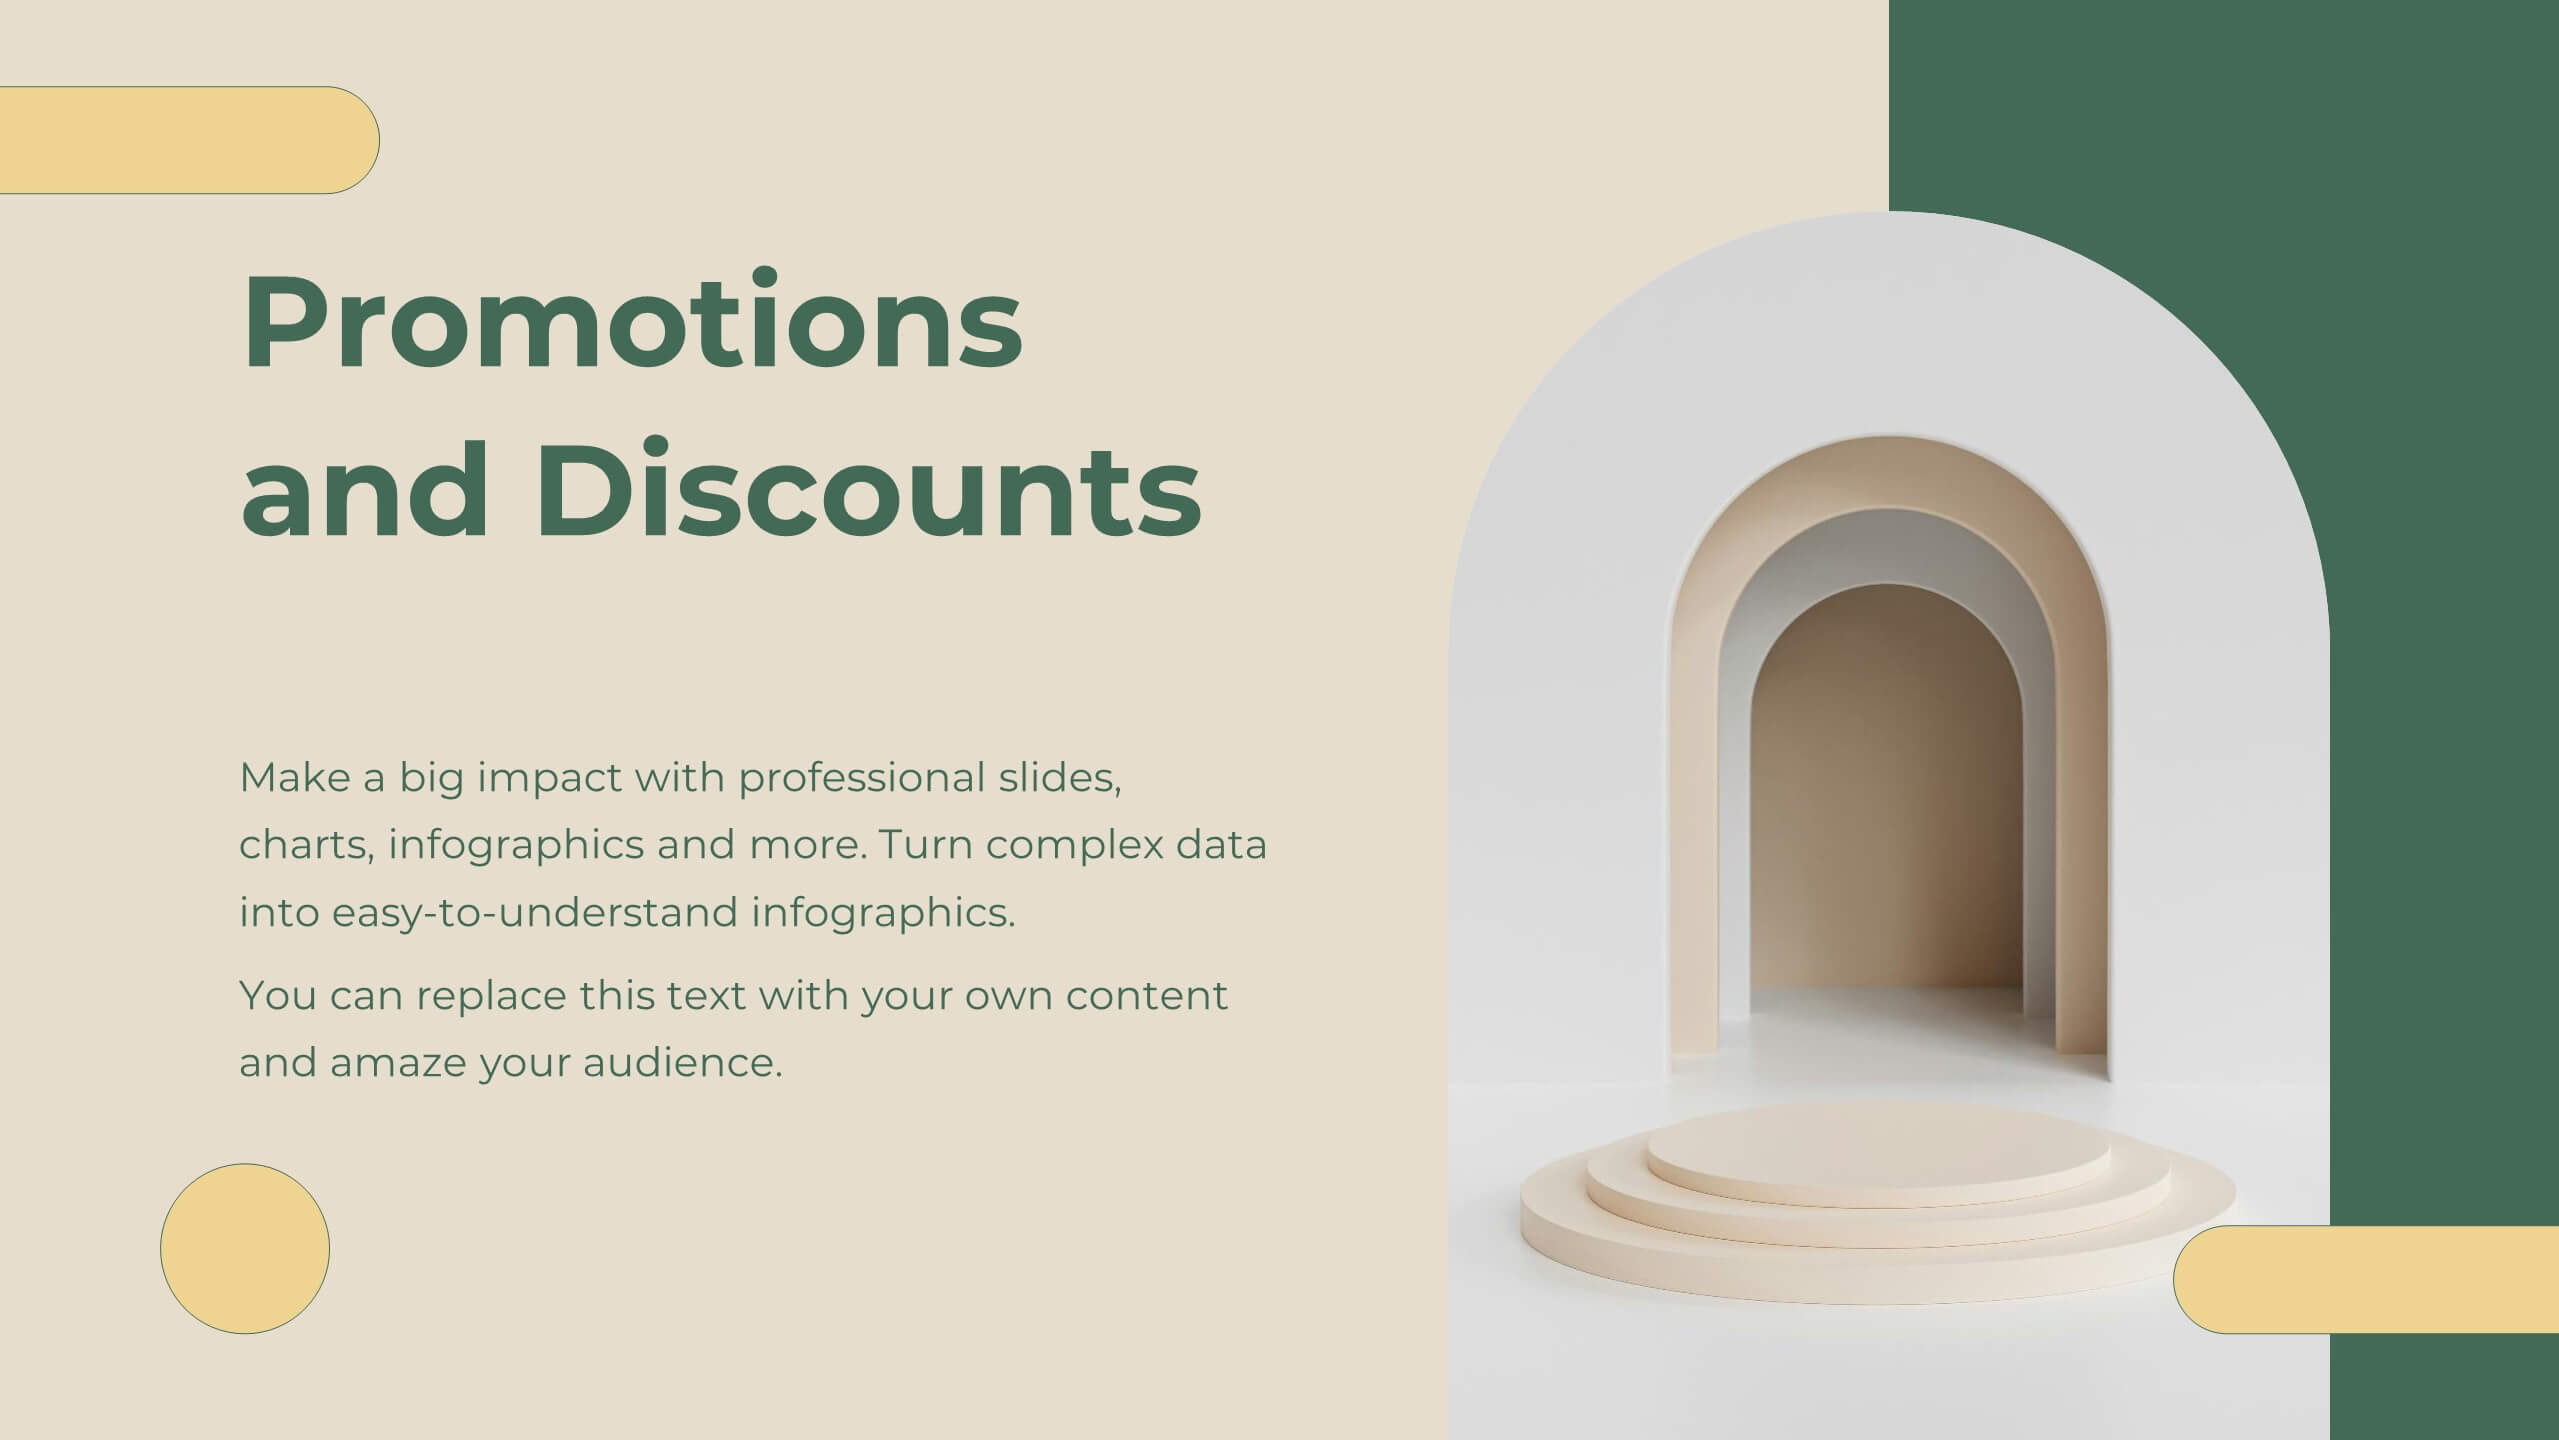
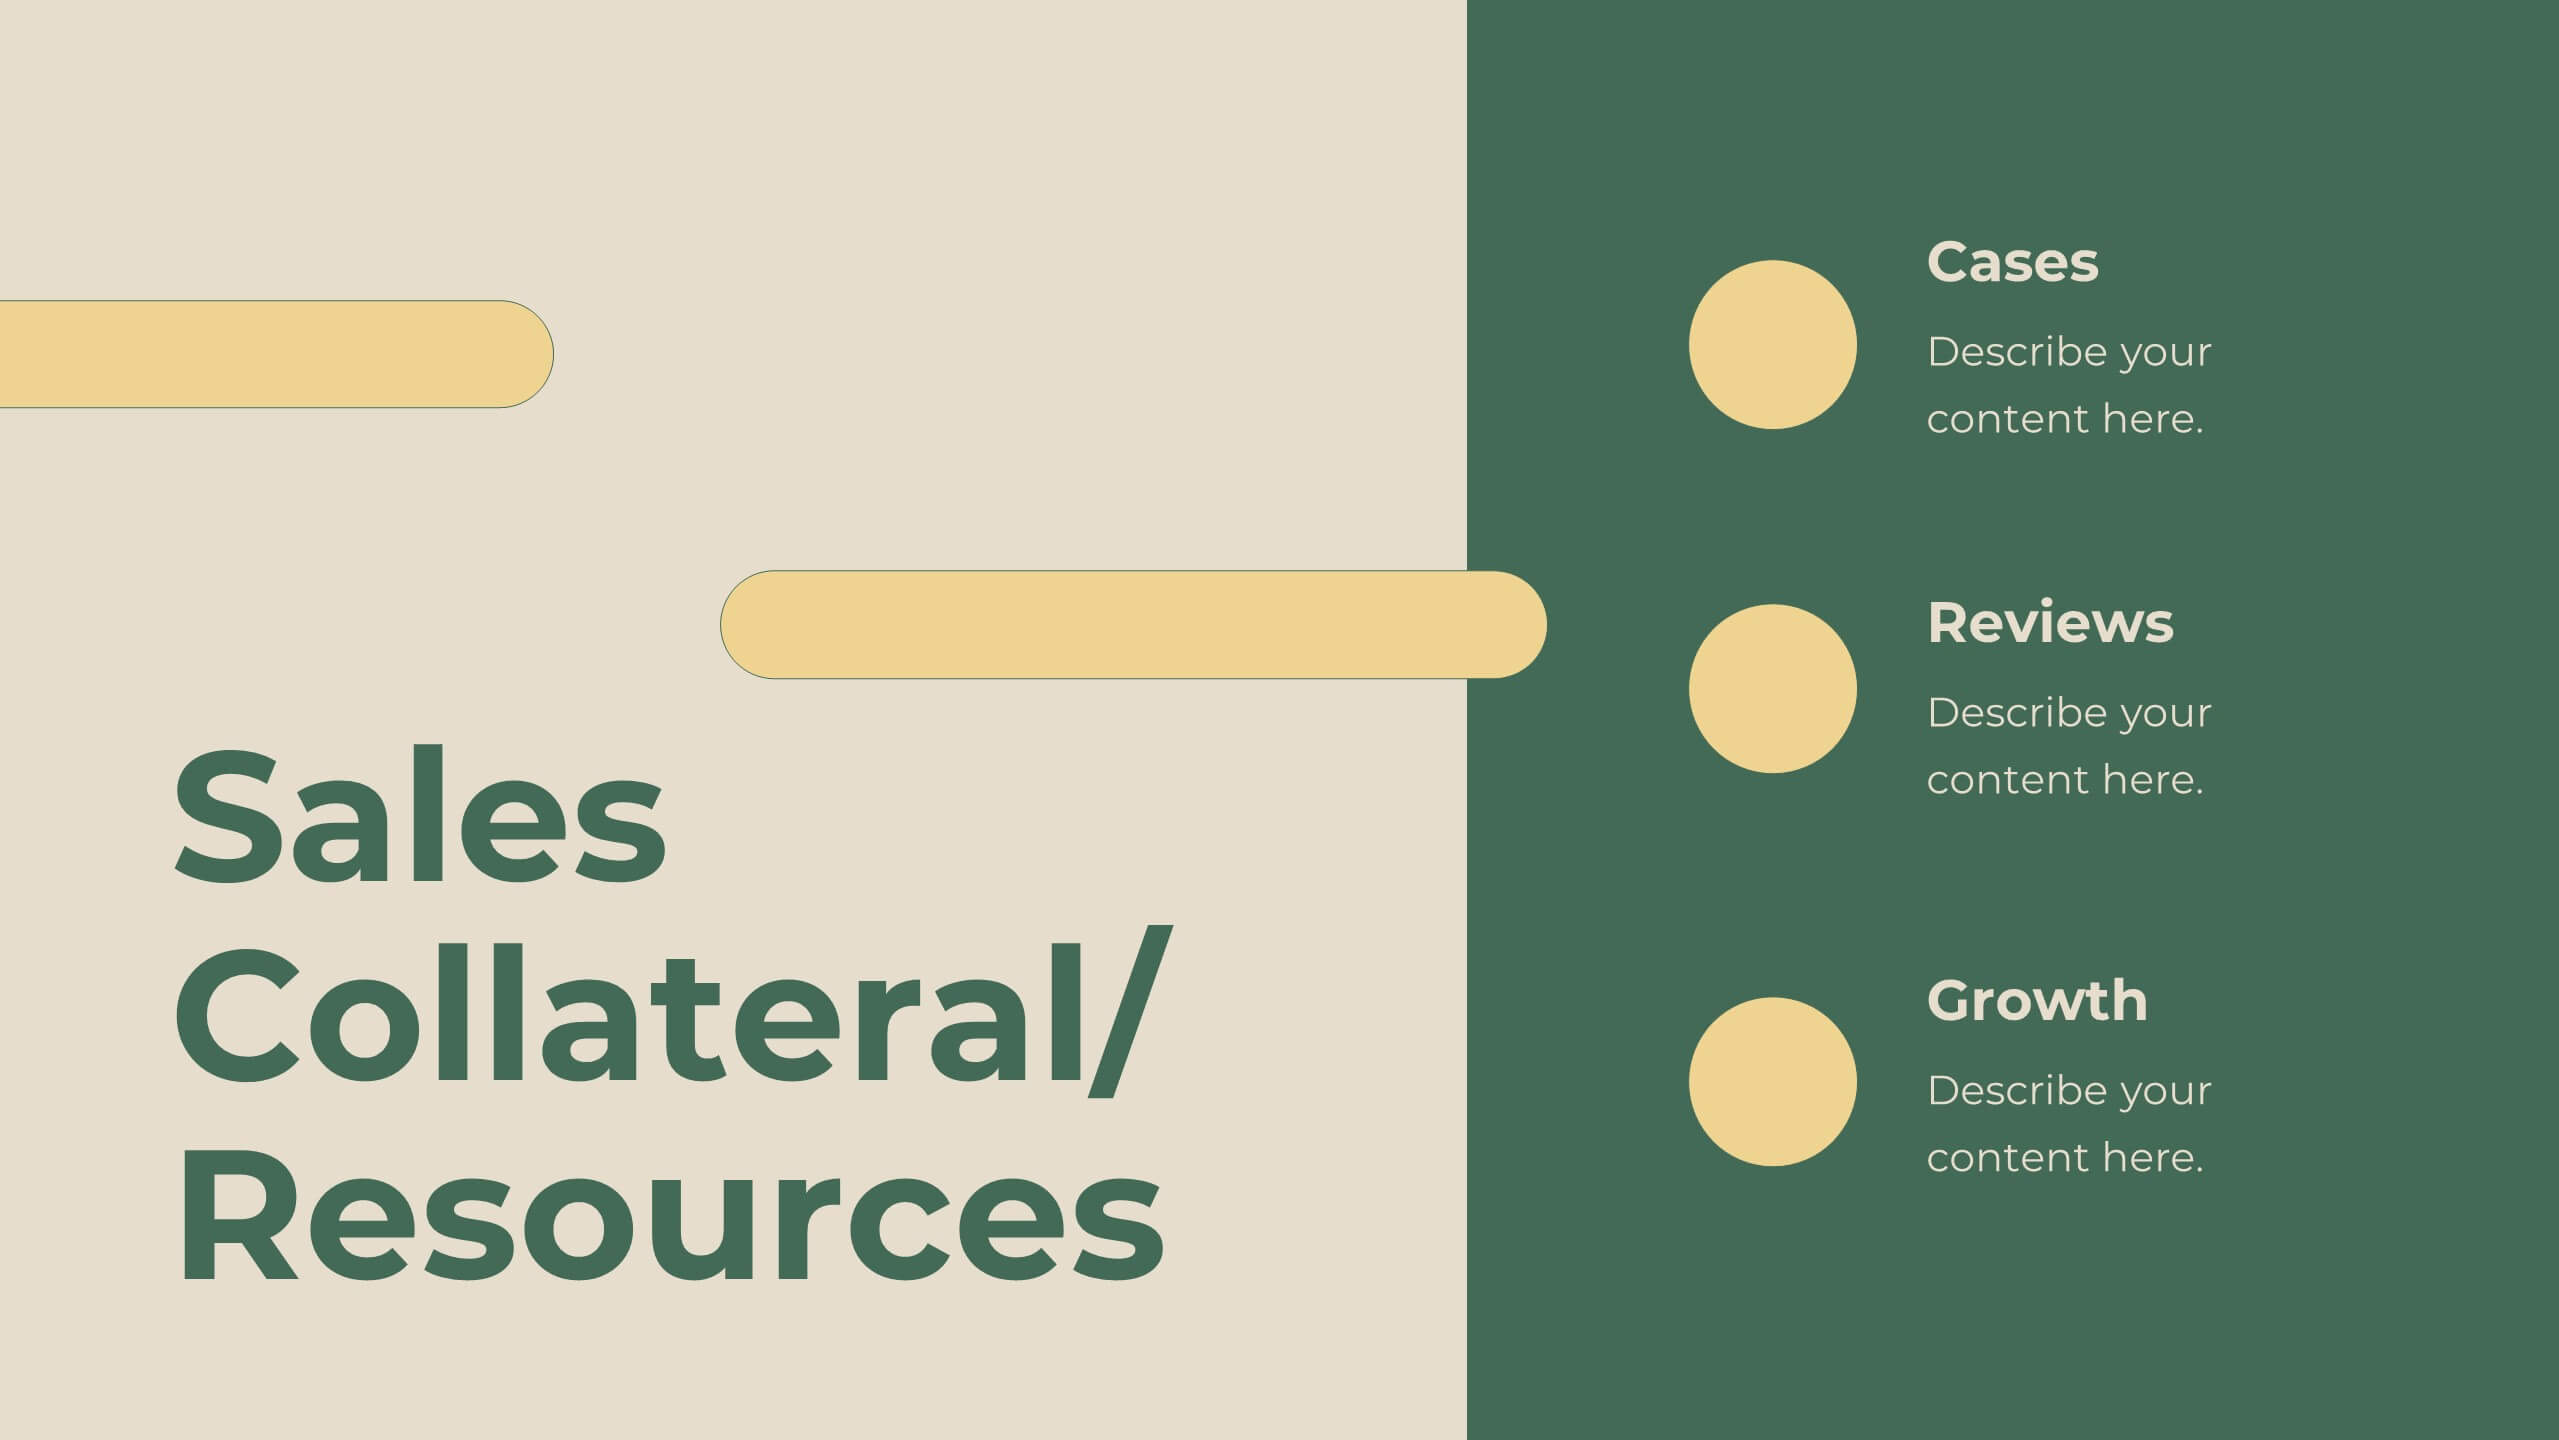
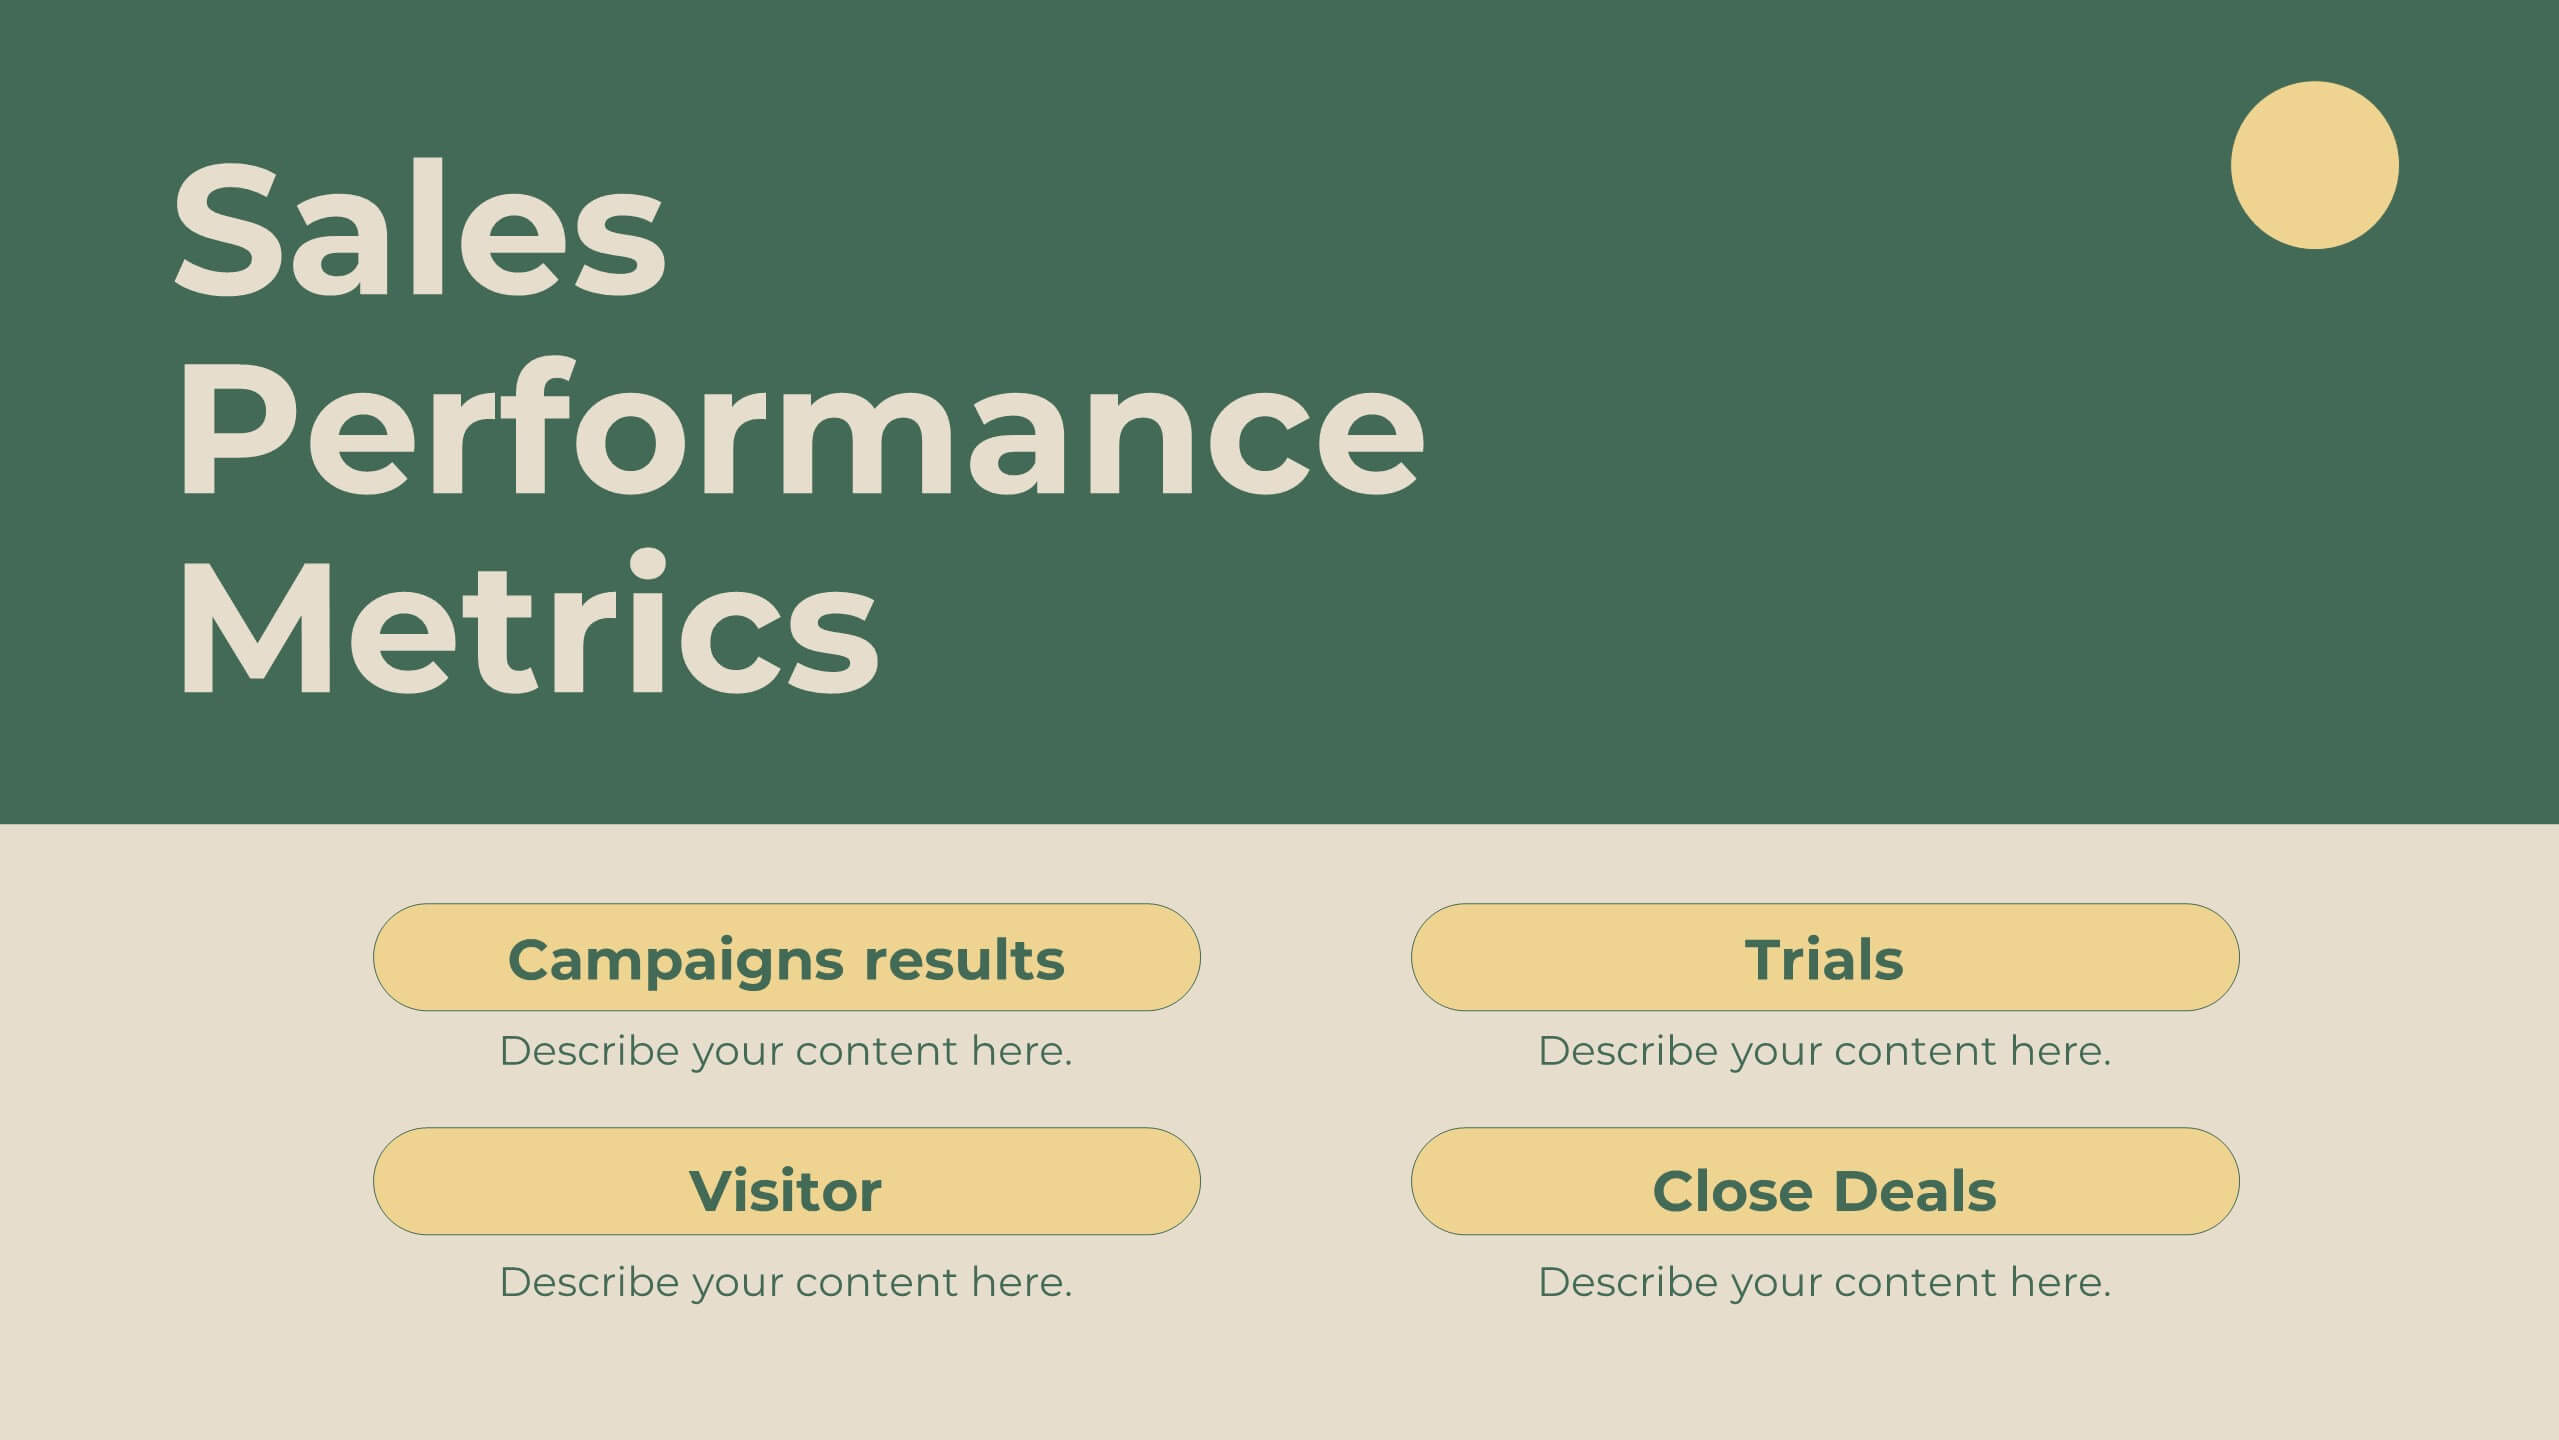
Legacy Sales Strategy Presentation
Boost your sales presentations with this modern template! It features sections for objectives, process, team introduction, customer testimonials, and performance metrics. Ideal for outlining strategies, opportunities, and pricing. Engage your audience with a professional, clean design. Compatible with PowerPoint, Keynote, and Google Slides for seamless integration. Make your sales strategy stand out!


5 slides
Law and Justice Education Infographics
Law and Justice play a critical role in ensuring that people are treated fairly and that their rights are protected. This unique vertical Infographic template is designed to visually present information about legal education and the justice system. The template includes various graphics, charts, and icons that can be customized to fit your specific data and message. Use this to cover different topics related to law and justice, such as legal education, the court system, criminal justice, and more. The infographics are designed to make your information easy to understand and visually appealing.