


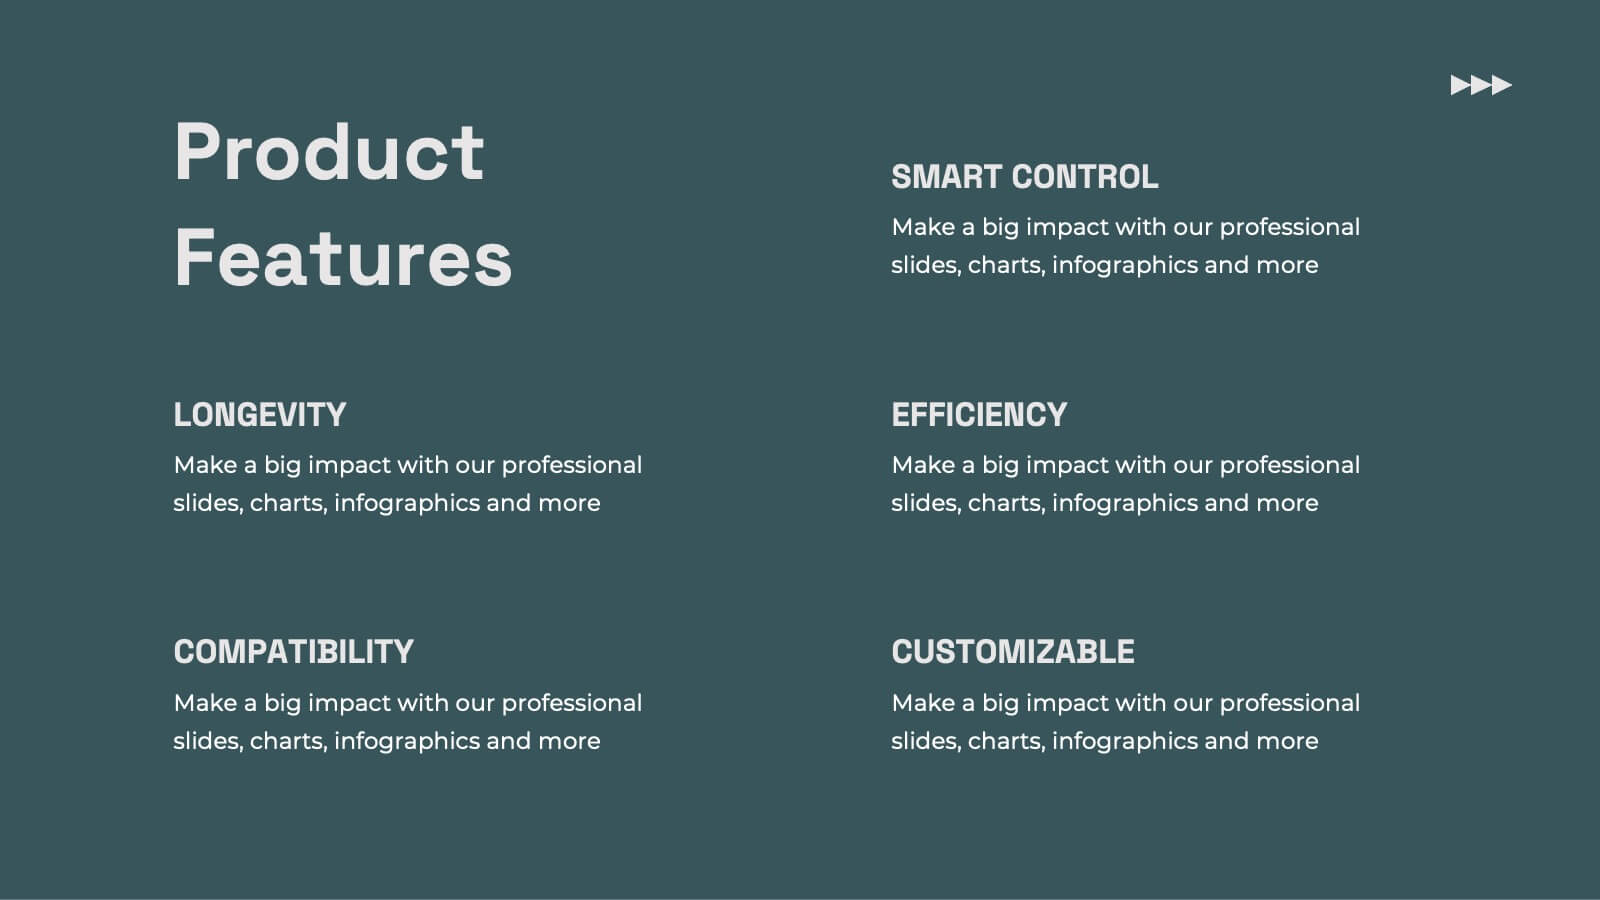
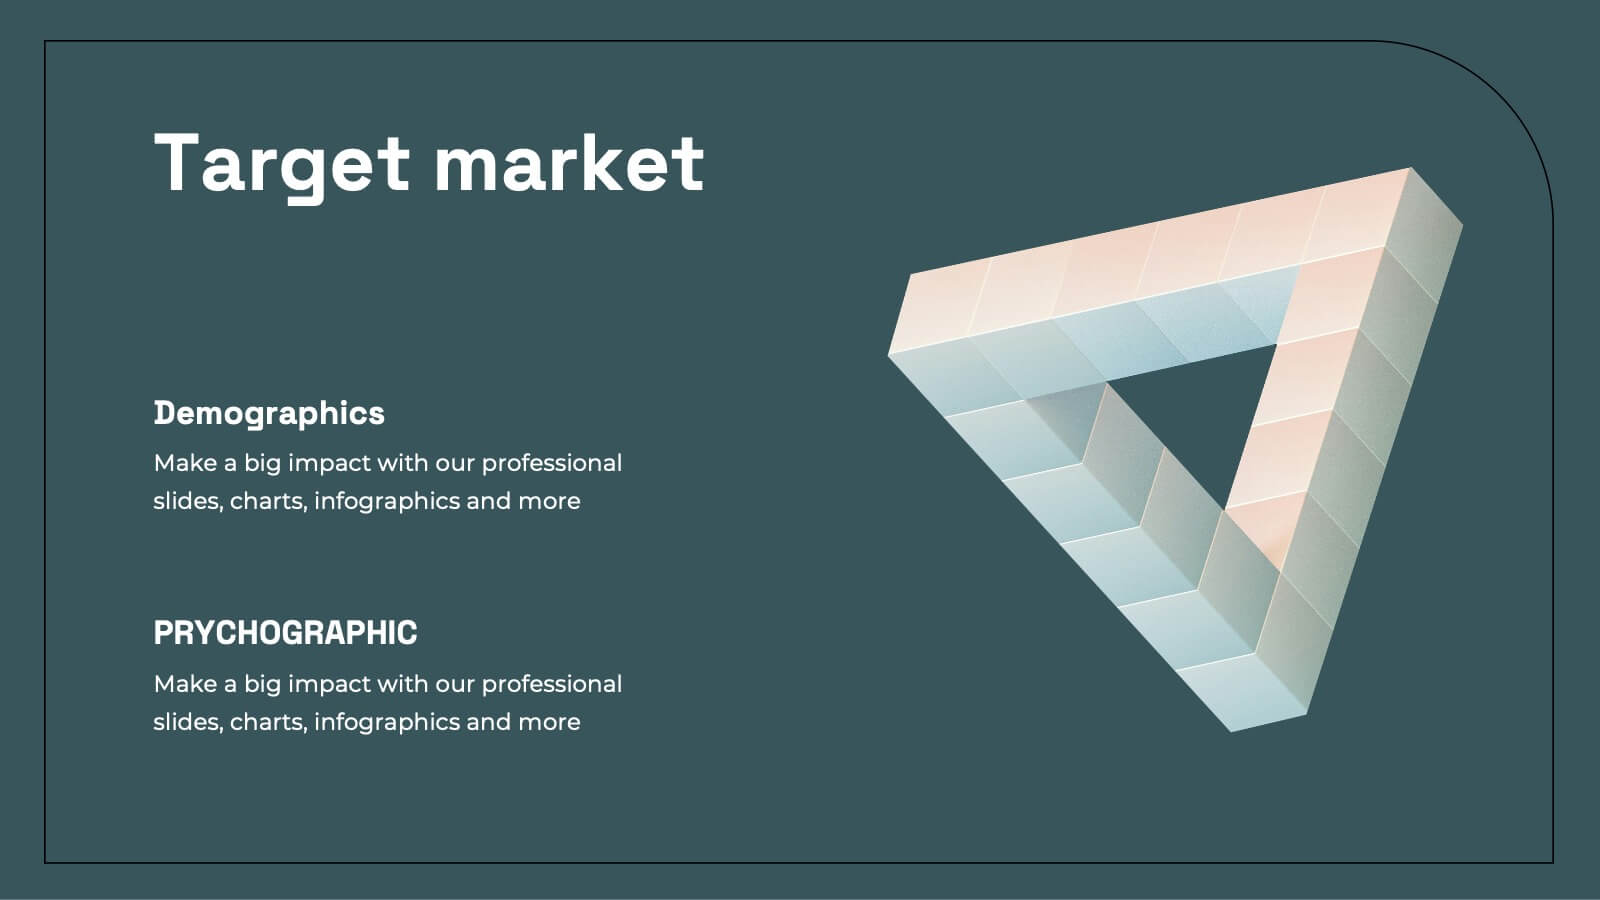
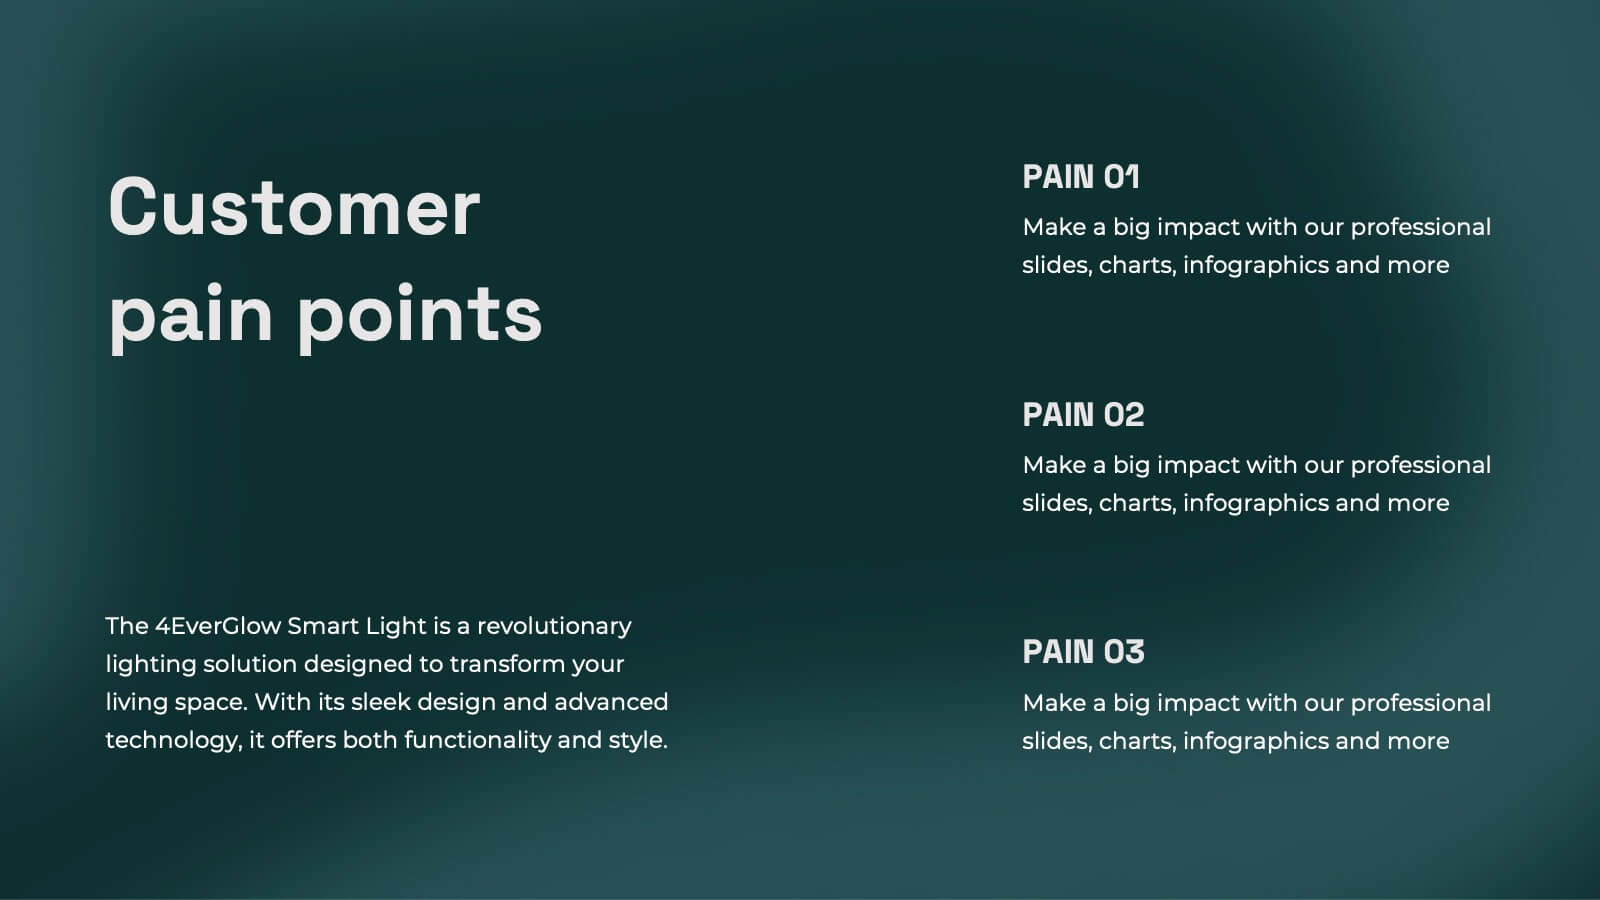
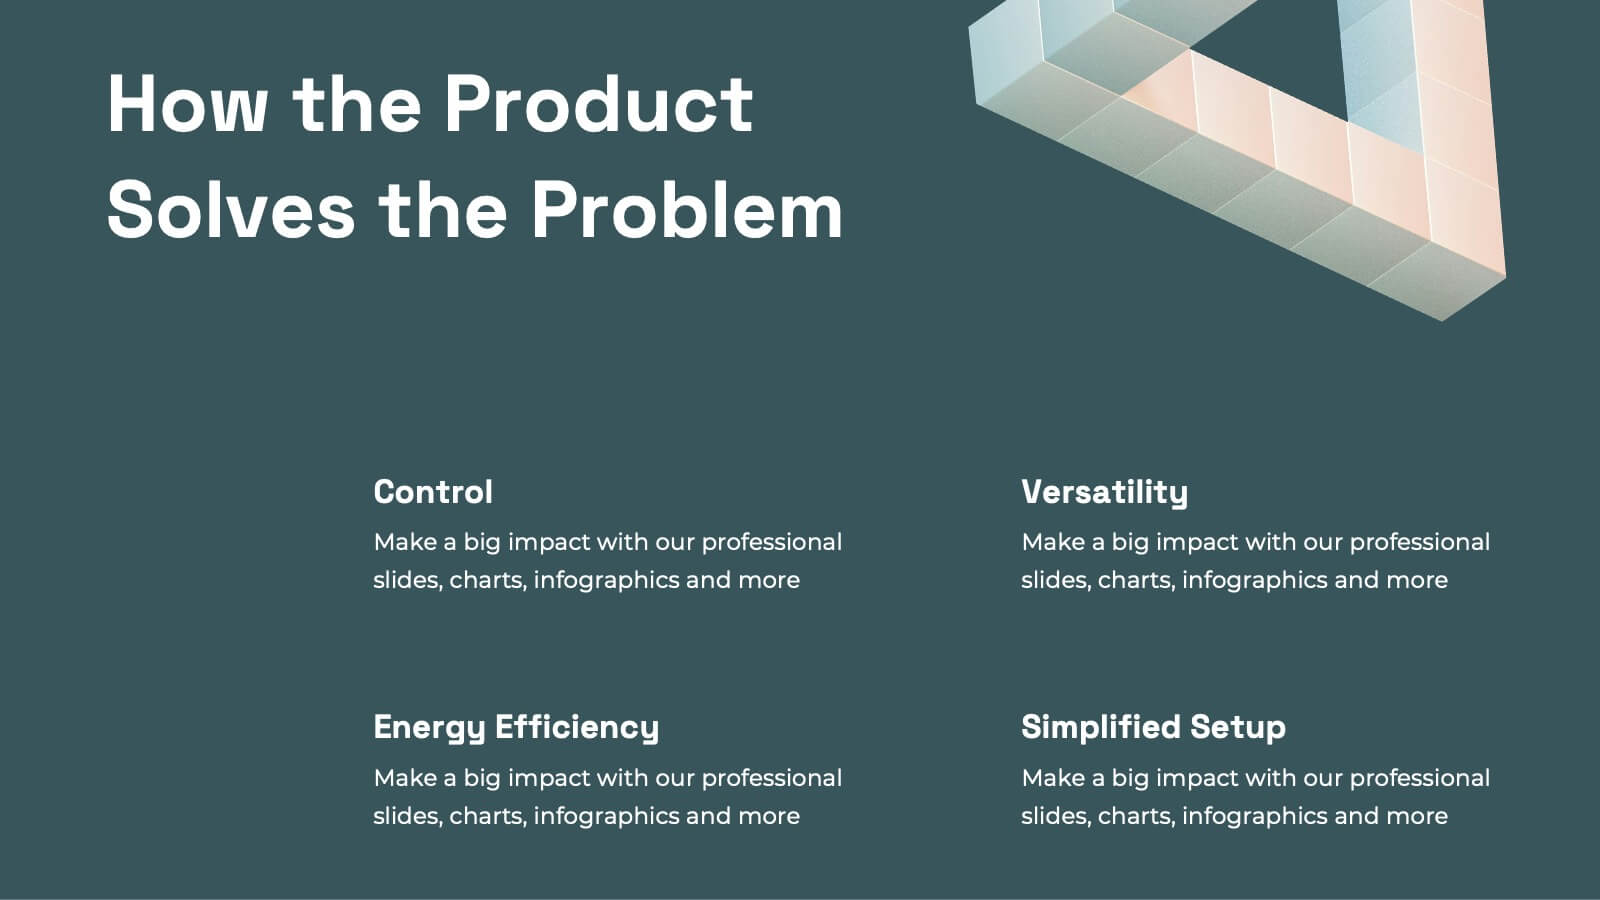
Features
- 5 Unique slides
- Fully editable and easy to edit in Microsoft Powerpoint, Keynote and Google Slides
- 16:9 widescreen layout
- Clean and professional designs
- Export to JPG, PDF or send by email


Do you have any questions?
Recommend


6 slides
Corporate Performance Annual Report
Present key business metrics with precision using this Corporate Performance Annual Report slide. Designed with progress bars and intuitive icons, this layout clearly communicates departmental or project-based performance. Ideal for year-end reviews, board meetings, and investor updates. Fully editable in PowerPoint, Keynote, and Google Slides.


4 slides
Sales and Reach Across Asia Map Presentation
Visualize your company’s market presence with the Sales and Reach Across Asia Map Presentation. Featuring clean markers, color-coded regions, and icon-labeled highlights, this template helps you clearly showcase key sales zones, distribution channels, or growth markets across Asia. Perfect for business reviews, expansion pitches, and performance updates. Fully editable in PowerPoint, Keynote, Google Slides, and Canva.


26 slides
Human Resources Colorful Vectors
Dive into the dynamic realm of human resources, where talent thrives and organizations find their heartbeat. Radiating with a playful palette of sunny yellow, refreshing green, blush pink, and crisp white, our template captures the vibrancy and diversity of the HR world. Adorned with colorful graphics, relatable icons, and insightful image placeholders, it's a testament to the human touch in every organization. Expertly tailored for Powerpoint, Keynote, or Google Slides. An invaluable tool for HR professionals, recruitment agencies, corporate trainers, or anyone focused on building and nurturing talent. Engage, empower, and elevate; let your HR endeavors shine.


10 slides
Teamwide Business Implementation Plan Presentation
Visualize your implementation roadmap with this team-focused progress slide. Featuring circular avatars, percentage bars, and milestone titles, it’s ideal for highlighting departmental progress or execution timelines. Fully editable in PowerPoint, Keynote, and Google Slides—perfect for internal updates, leadership reviews, or showcasing collaborative performance across business functions.


5 slides
Visual Mind Connections Bubble Chart
Present interconnected ideas with clarity using the Visual Mind Connections Bubble Chart Presentation. This diagram helps map key points around a central concept, making it perfect for brainstorming, strategy sessions, or educational content. Easy to customize in PowerPoint, Keynote, or Google Slides. Ideal for teams, coaches, and presenters.


6 slides
Business Project Proposal Template
Showcase your strategy with clarity and confidence using this sleek Business Project Proposal slide. Designed to highlight three core ideas or phases, it's perfect for pitching initiatives, presenting goals, or structuring deliverables. Compatible with PowerPoint, Google Slides, and Keynote for seamless editing and customization.


7 slides
Alphabet Letters Infographic
An alphabet infographic is a visual representation or graphic that presents information related to the alphabet, often used for educational purposes or to convey information in a creative and engaging manner. Get ready to embark on a joyful journey through the wonderland of letters and words with our alphabet letters infographic. This infographic template includes various elements like letters, words, examples, pronunciation guides, or related images. This is more than just an infographic—it's a vibrant celebration of language, learning, and pure happiness. Dive into the kaleidoscope of alphabets and spread the cheer!


8 slides
Survey Poll Results Visualization Presentation
Easily showcase your survey or poll data with this bold and modern results visualization slide. Designed with eye-catching circular charts, it helps your audience quickly grasp key insights at a glance. Perfect for business reviews, feedback summaries, or internal reports. Compatible with PowerPoint, Keynote, and Google Slides.


7 slides
Real Estate Market Analysis Presentation
Bring energy and clarity to your insights with this dynamic slide designed to break down key market factors in a simple, visual flow. It helps you explain trends, opportunities, and performance drivers with ease, making complex real estate data feel intuitive and organized. Fully compatible with PowerPoint, Keynote, and Google Slides.


19 slides
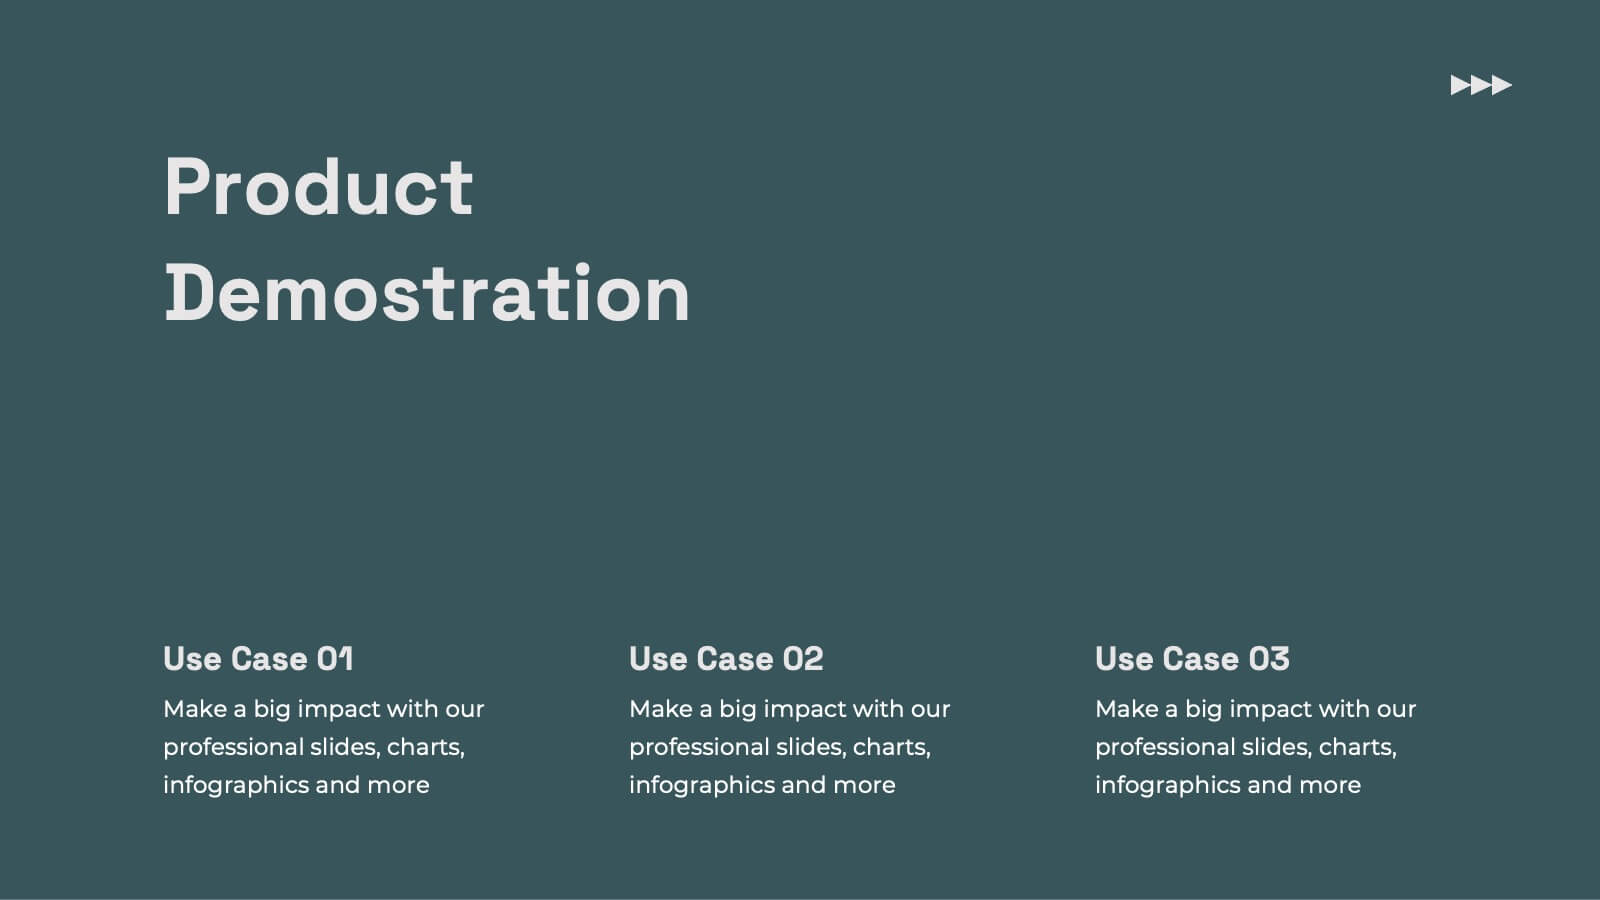
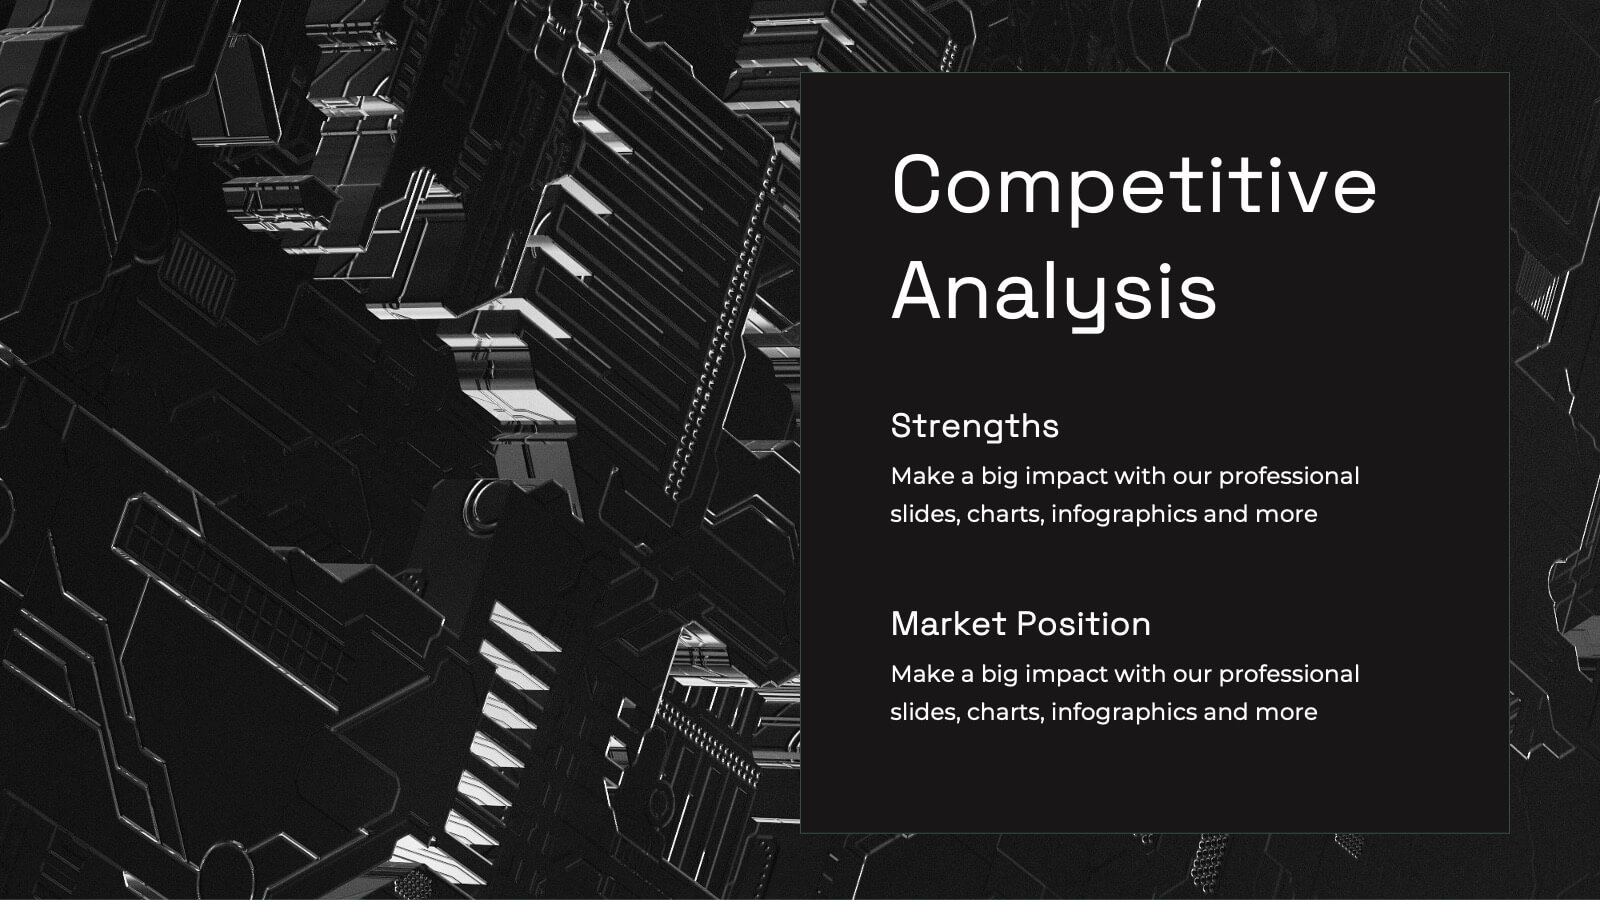
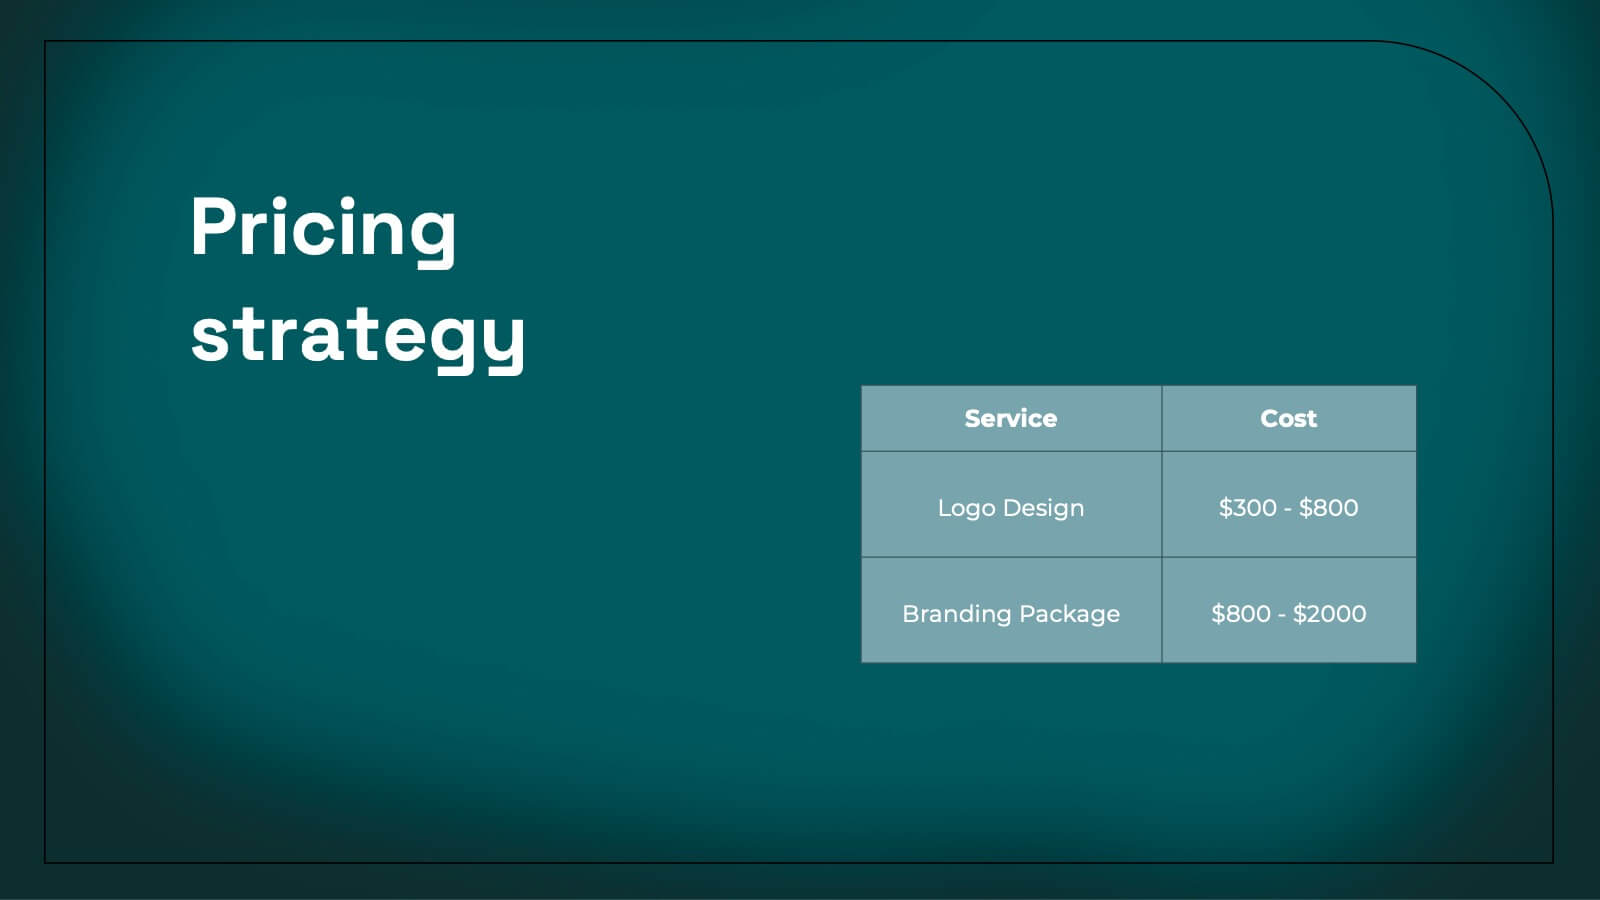
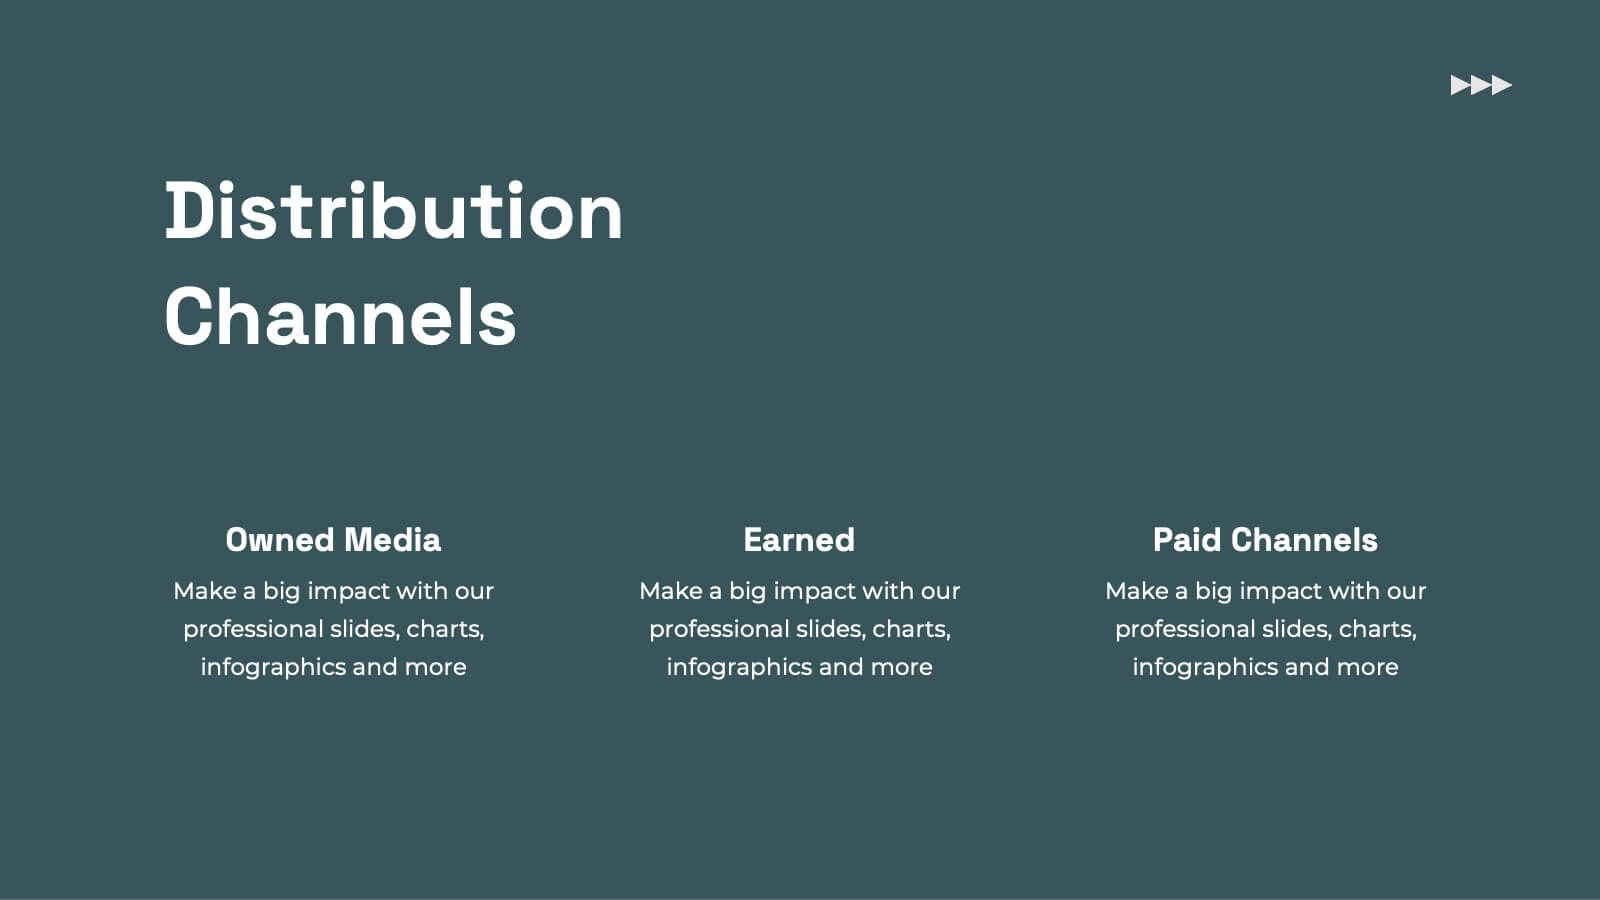
Kale Product Strategy Report Presentation
Unleash the power of your product with this bold and dynamic product strategy report template! Elevate your presentation with eye-catching designs that showcase product features, competitive analysis, and pricing strategies like never before. Captivate your audience from start to finish and leave a lasting impression. Fully compatible with PowerPoint, Keynote, and Google Slides!


5 slides
Future Planning and Next Steps Strategy Presentation
Map out your goals with clarity using the Future Planning and Next Steps Strategy Presentation. This slide features a sleek four-step curved timeline with editable icons and labels, ideal for outlining strategic actions or project phases. Easily customize each stage to match your business objectives. Compatible with PowerPoint, Keynote, and Google Slides.


5 slides
Business Model Canvas Overview Presentation
Streamline your business strategy with the Business Model Canvas Overview Presentation. Designed for entrepreneurs, startups, and strategists, this template visualizes key partners, activities, value propositions, customer segments, revenue streams, and more. Fully editable for PowerPoint, Keynote, and Google Slides, ensuring a structured and professional business plan presentation.


5 slides
Easy Dinner Recipes Infographics
Easy Dinner Recipes offer a practical solution for busy individuals or those who are new to cooking. These infographic templates offer a practical resource for meal planning and preparation. Its visually appealing design, clear instructions, and organized layout make it easy to follow and implement. Whether for personal use or as a presentation tool in cooking classes this template simplifies the process of discovering and trying out delicious dinner recipes. Use these to provide a collection of quick and delicious dinner recipes. This is designed to make meal planning easier, providing step-by-step instructions, ingredient lists, and visuals.


10 slides
Agile Project Status Review Presentation
Streamline your Agile methodologies with our "Agile Project Status Review" presentation templates. Designed to enhance visual communication, these templates help you effectively display project phases from start to finish. Ideal for dynamic project management, they are compatible with PowerPoint, Keynote, and Google Slides, ensuring seamless integration into your workflow.


5 slides
Employee Lifecycle Management Presentation
Visualize every stage of the employee journey with the Employee Lifecycle Management template. Featuring a streamlined process flow, this layout is ideal for showcasing recruitment, onboarding, development, retention, and offboarding strategies. Fully editable in Canva, PowerPoint, and Google Slides, allowing seamless customization to align with your HR goals and branding.


6 slides
Onboarding 30-60-90 Day Roadmap Presentation
Get your team excited from day one with this colorful, easy-to-follow visual layout! This presentation template helps clearly map out onboarding goals and key activities across 30, 60, and 90 days. Perfect for HR professionals and team leads, it's fully editable and works with PowerPoint, Keynote, and Google Slides.


2 slides
Client-Oriented Project Proposal Deck Presentation
Deliver polished, persuasive proposals with the Client-Oriented Project Proposal Deck Presentation. Designed to balance visual appeal and clarity, this layout is perfect for consultants, agencies, or freelancers presenting solutions to clients. Includes space for project overviews, photos, and key value points. Fully editable in PowerPoint, Keynote, and Google Slides.