


Features
- 6 Unique slides
- Fully editable and easy to edit in Microsoft Powerpoint, Keynote and Google Slides
- 16:9 widescreen layout
- Clean and professional designs
- Export to JPG, PDF or send by email


Do you have any questions?
Recommend


20 slides
Legacy Product Launch Presentation
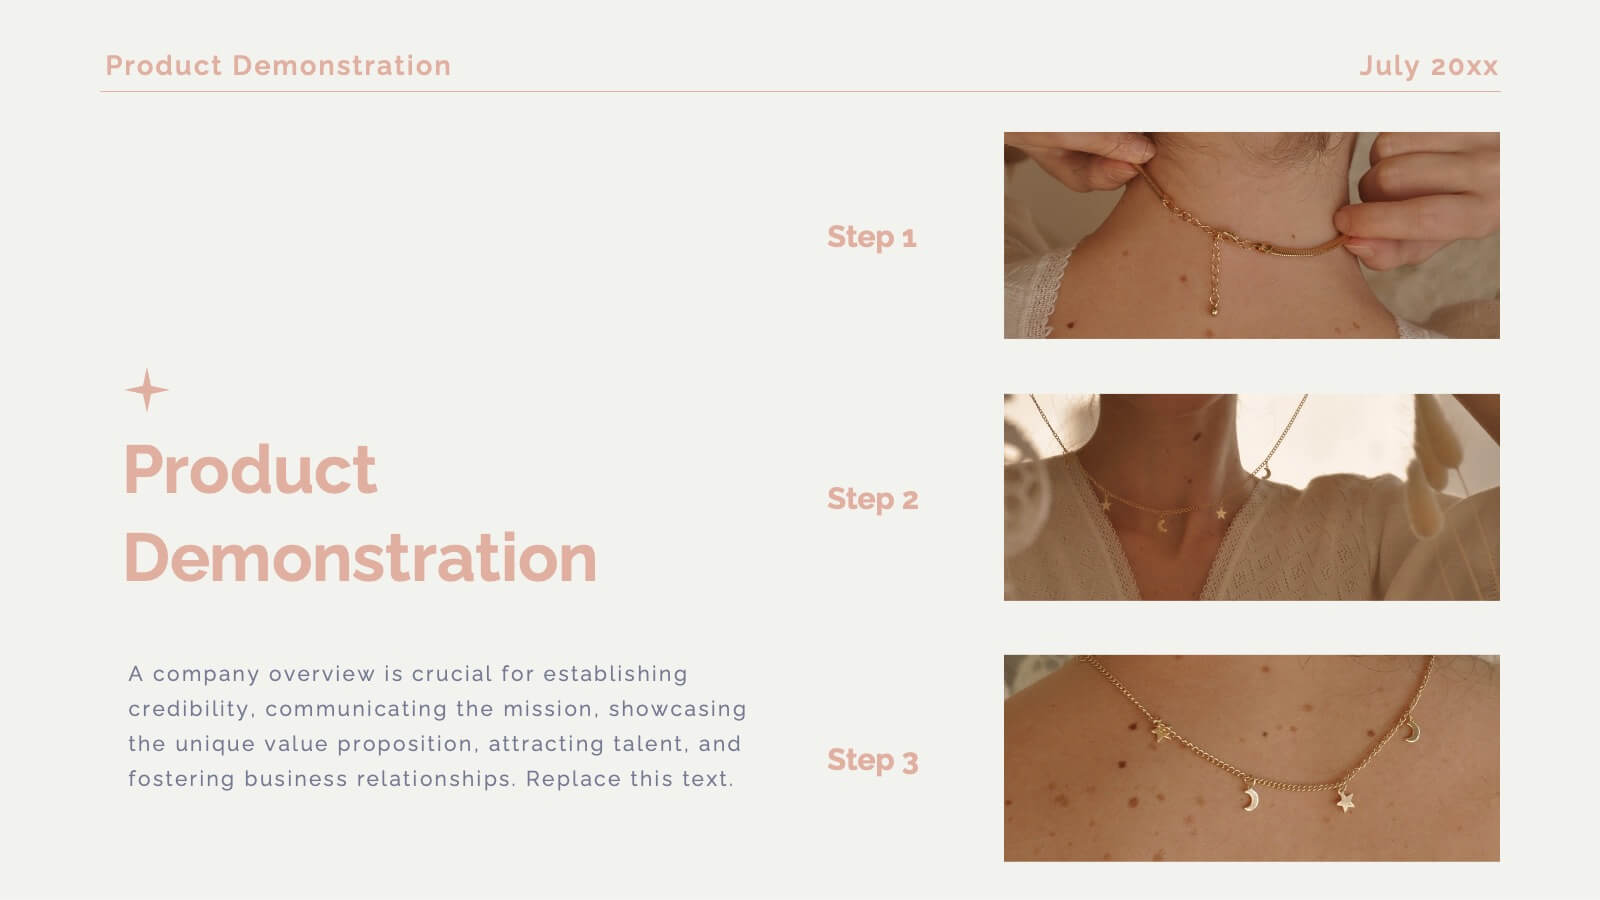
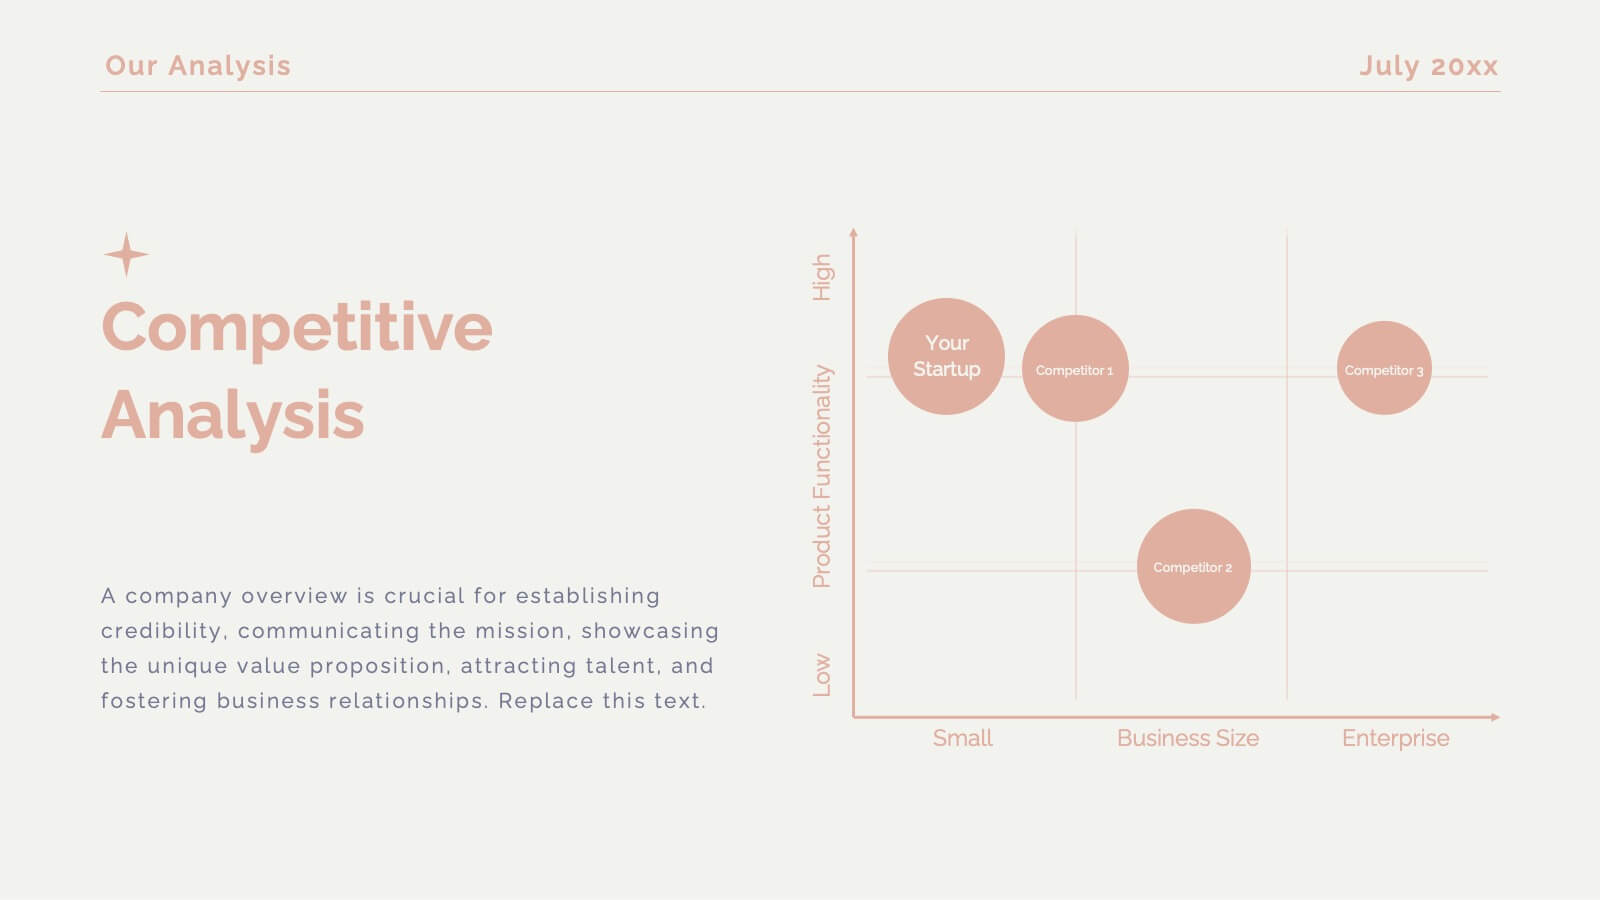
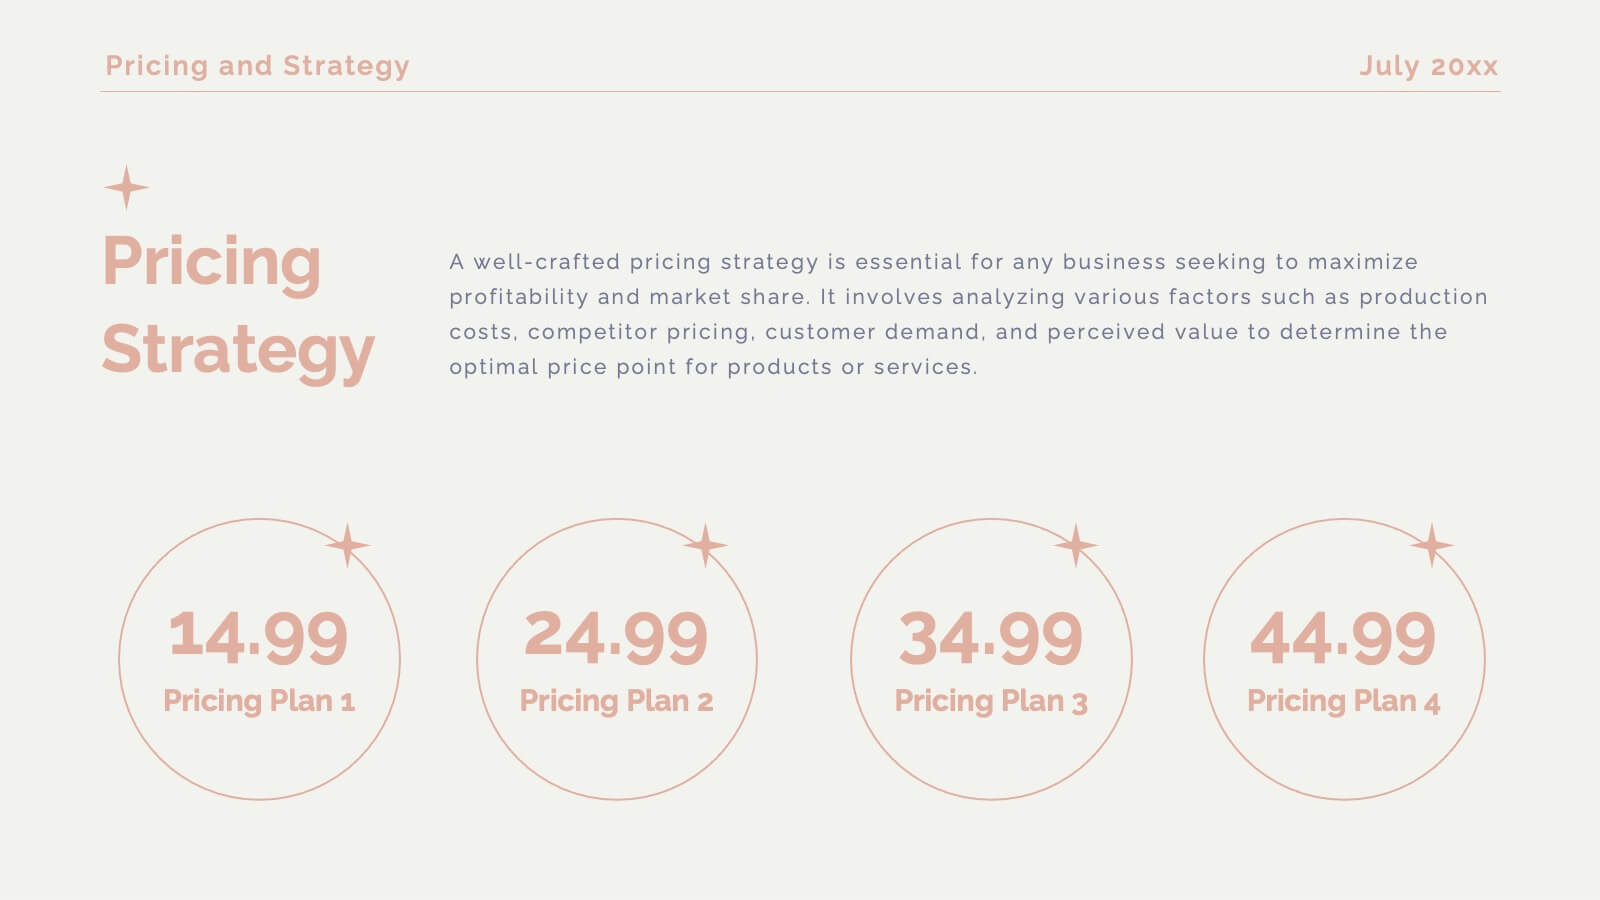
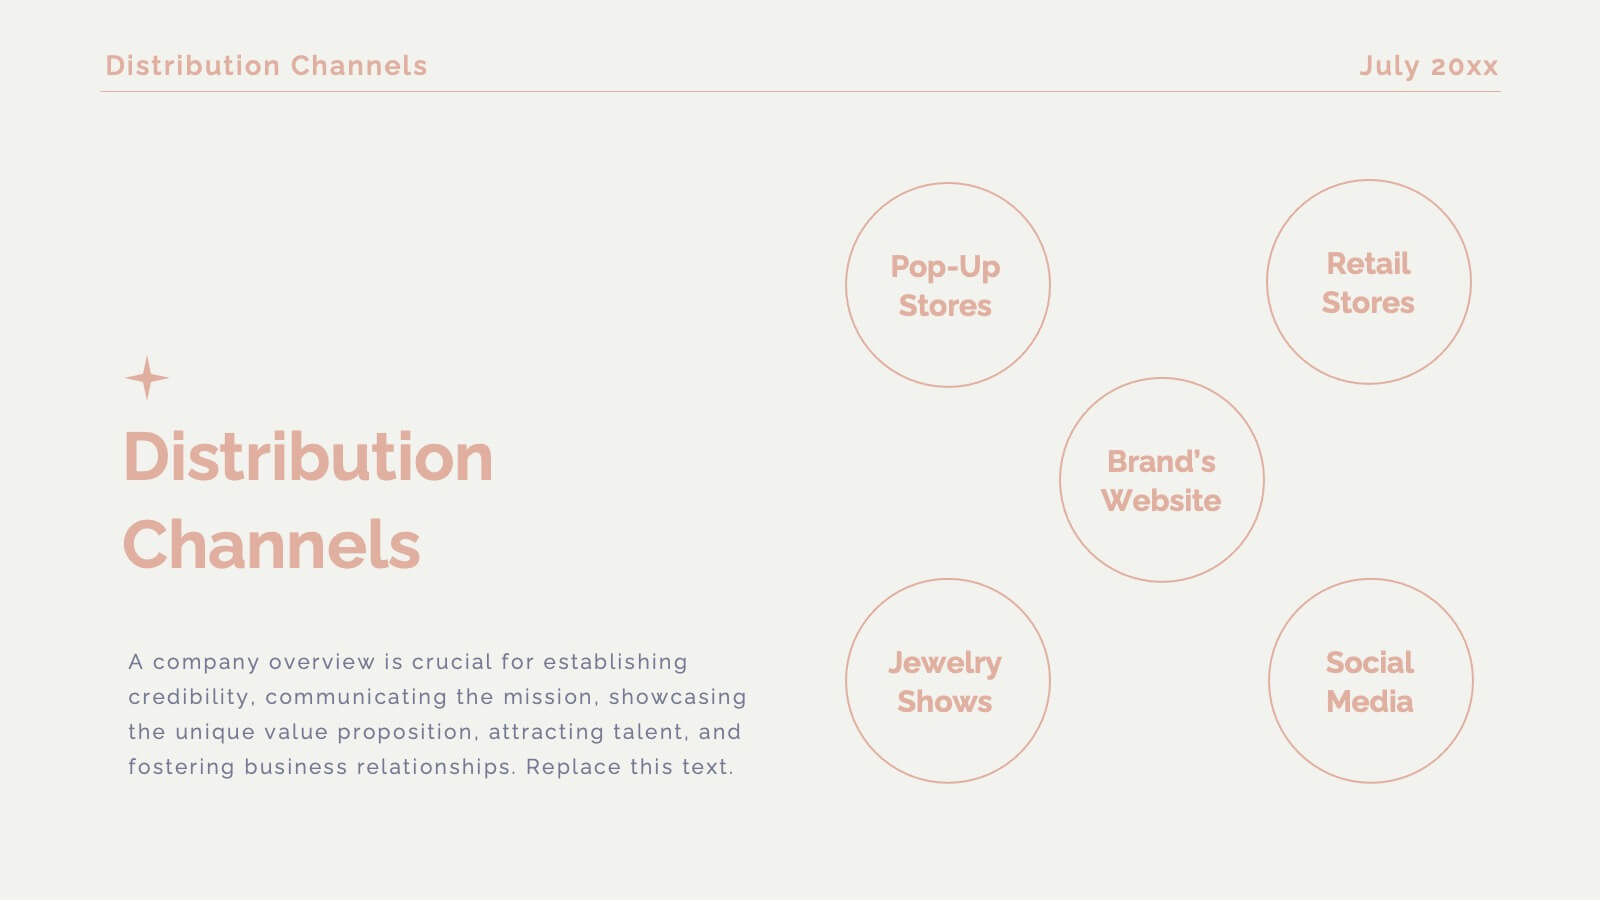
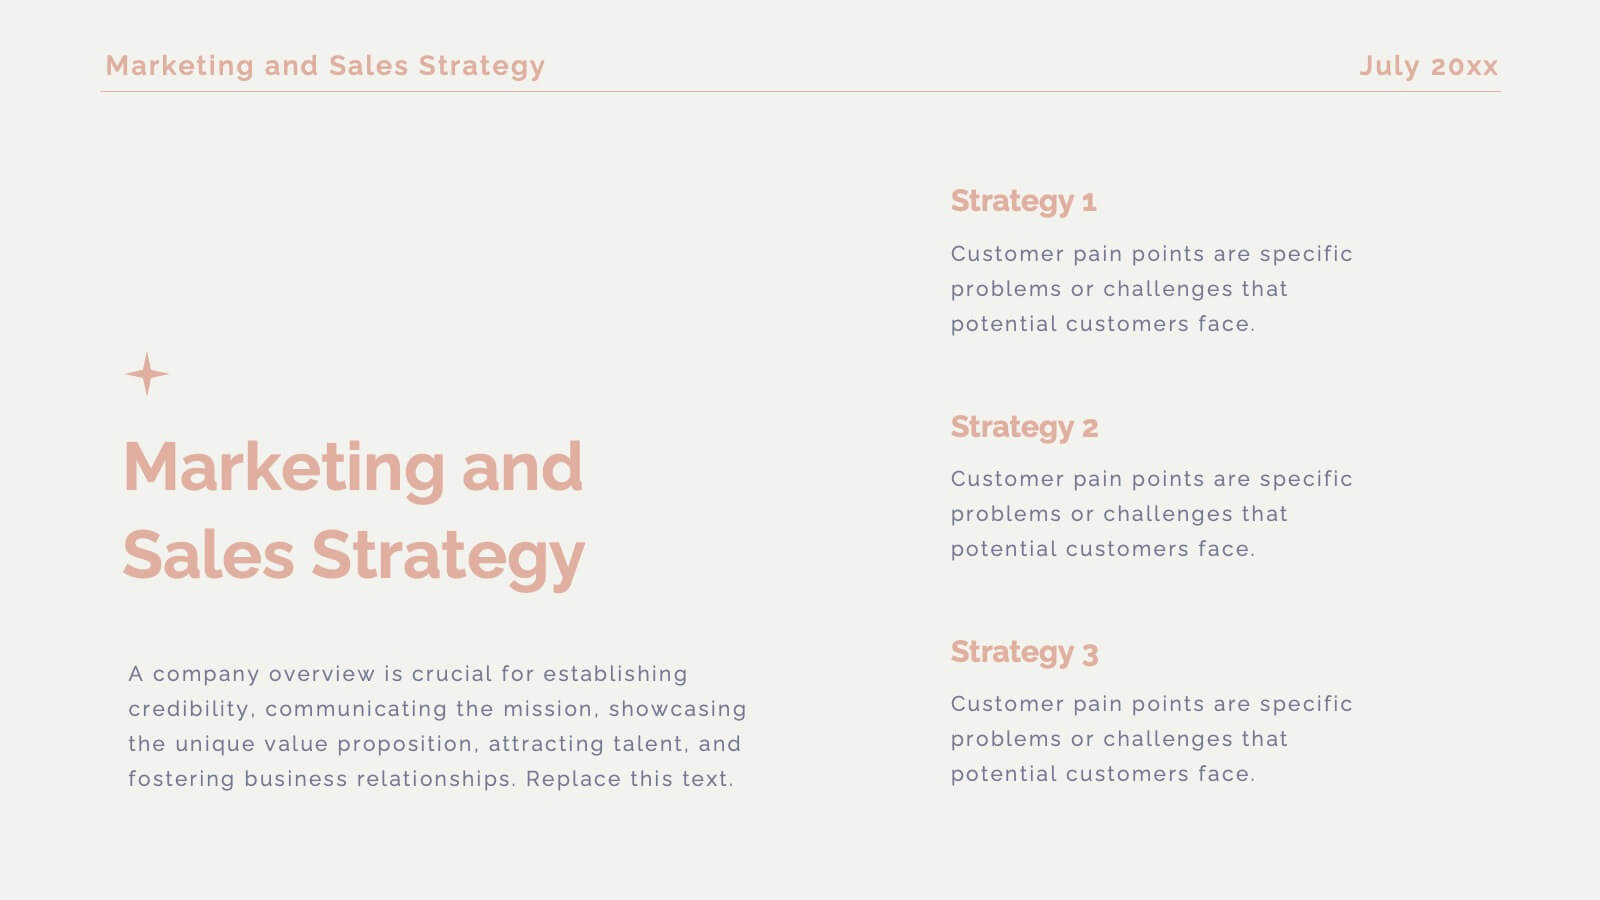
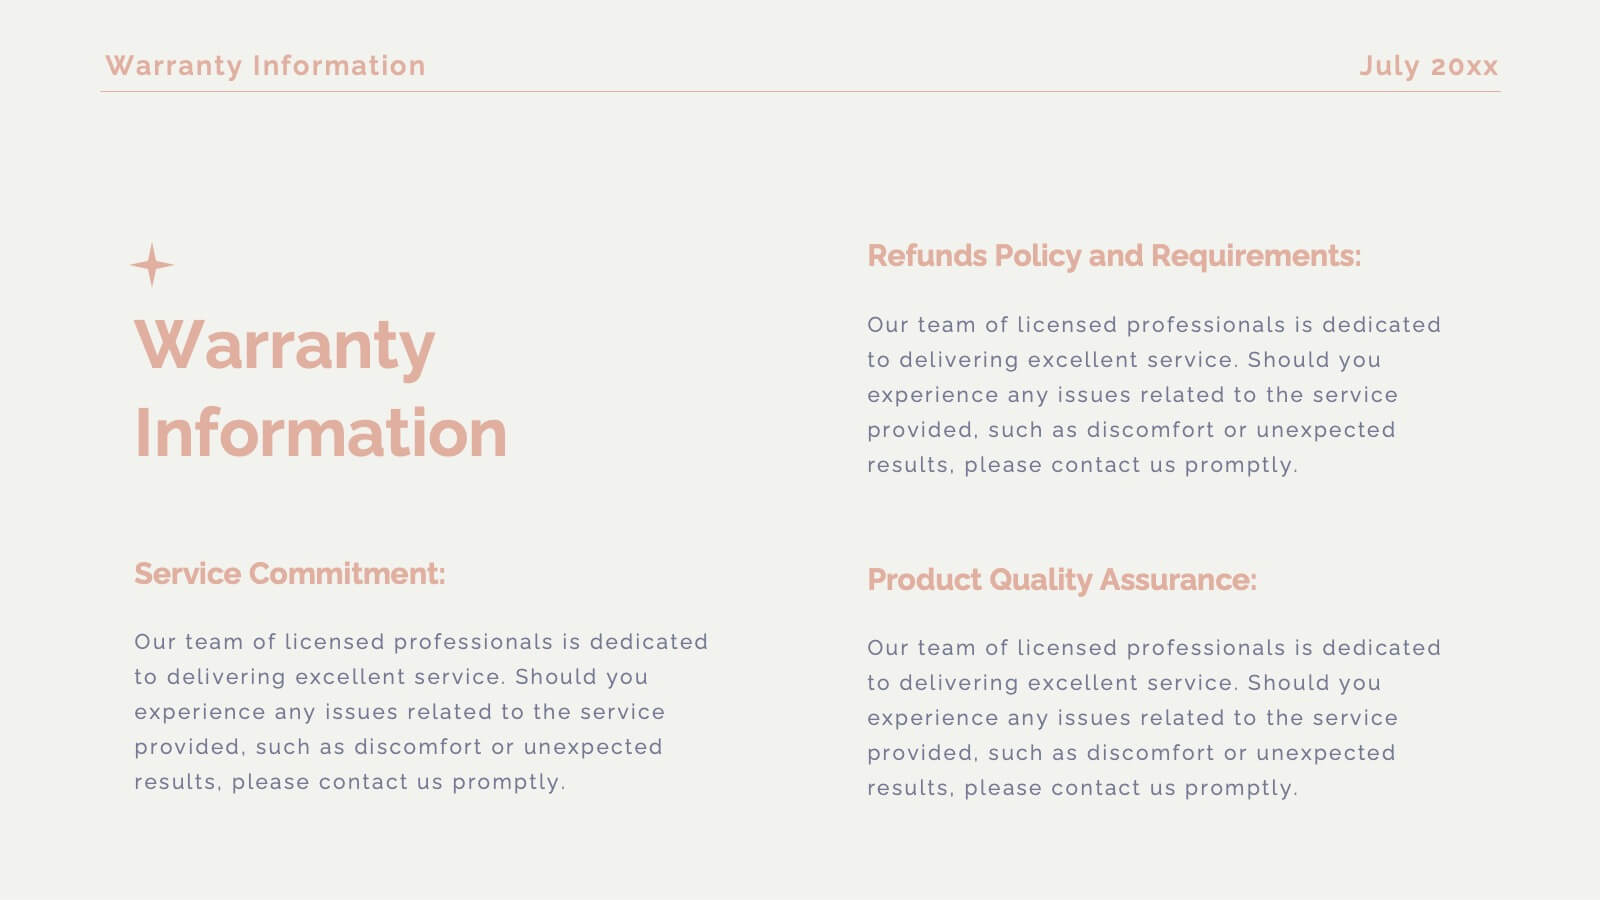
Get ready to unveil your product with a stunning and sophisticated launch template designed to captivate and convert! This template offers everything you need to present your product in the most compelling way possible, from an inviting welcome slide to an in-depth company overview that sets the stage for your brand’s story. The sleek design highlights key product features, unique selling propositions, and a thorough competitive analysis that positions your product as the market leader. With sections dedicated to customer pain points, solutions, and a powerful product demonstration, this template ensures your audience understands the value and impact of your offering. It also includes critical details like pricing strategy, distribution channels, and manufacturing processes, giving a full picture of your product’s journey from concept to market. Compatible with PowerPoint, Keynote, and Google Slides, this template is your ultimate tool for a successful product launch that leaves a lasting impression!


6 slides
Asia Colonization Map Infographics
Discover the versatility of our Asia Colonization Map infographic template, a powerful tool for visualizing the historical impact of colonization across the diverse continent of Asia. This template is fully compatible with popular presentation software like PowerPoint, Keynote, and Google Slides, enabling effortless customization to suit your specific needs. The Asia Colonization Map infographic template offers a robust foundation for illustrating colonization timelines, colonial powers, and regions affected by colonization throughout Asia's rich history. Whether you're a historian, educator, or simply intrigued by Asia's colonial past, this template provides a user-friendly platform to create engaging presentations and informative materials. Impress your audience with this SEO-optimized Asia Colonization Map infographic template, expertly designed for clarity and ease of use. Tailor it to showcase the historical narratives, impact, and legacies of colonization in Asia, making it a valuable asset for your projects and presentations. Start crafting your personalized infographic today!


6 slides
Successful Loyalty Program Ideas Presentation
Turn creative reward concepts into visually engaging stories that inspire customer retention and brand loyalty. This modern layout is ideal for presenting program ideas, reward systems, and engagement strategies with clarity and style. Fully customizable and compatible with PowerPoint, Keynote, and Google Slides for seamless presentation design.


6 slides
Stock Market Trends and Charts Presentation
Turn financial data into a story that’s easy to follow with this clean, professional layout designed to highlight market growth, patterns, and investment insights. Ideal for analysts and educators, it combines charts with sleek visuals. Fully compatible with PowerPoint, Keynote, and Google Slides for effortless customization.


7 slides
Sustainability Business Management Infographic Presentation
Sustainability Management presents information related to sustainable business practices and management strategies. The goal of this template is to help you create a balance between environmental factors to ensure long-term success for a business or organization. This infographic can cover a variety of topics, including sustainable supply chain management, energy, resource efficiency, and waste reduction. This template has different layouts including diagrams and graphs. It also includes icons, symbols, and color-coding to make the information more accessible and easier to understand.


5 slides
Monthly Financial Report Infographics
Dive into financial analytics with our monthly financial report infographics template. This indispensable tool, designed for finance professionals, managers, and business owners, comes in a stimulating mix of orange, pink, and green, reflecting the dynamic nature of finance. The template stands out with creative graphics, detailed icons, and designated areas for images that encapsulate various financial parameters. Ideal for depicting key statistics, trends, and financial insights in a clear, engaging manner, this vertical-style infographic template is perfect for simplifying complex data, ensuring your monthly reports are both comprehensive and captivating.


7 slides
Enforcement Law Infographic Presentation
A Law Enforcement Infographic is a visual representation of key concepts, statistics, and procedures related to law enforcement. This template can be used to provide an overview of various aspects of law enforcement, such as crime rates, policing strategies, and legal procedures. This infographic includes a variety of icons, illustrations, and other design elements law themed to enhance the visual appeal and make it more appealing for your viewers. This template is compatible with Powerpoint, Keynote and Google Slides making it easy to customize and edit with your own text and information.


20 slides
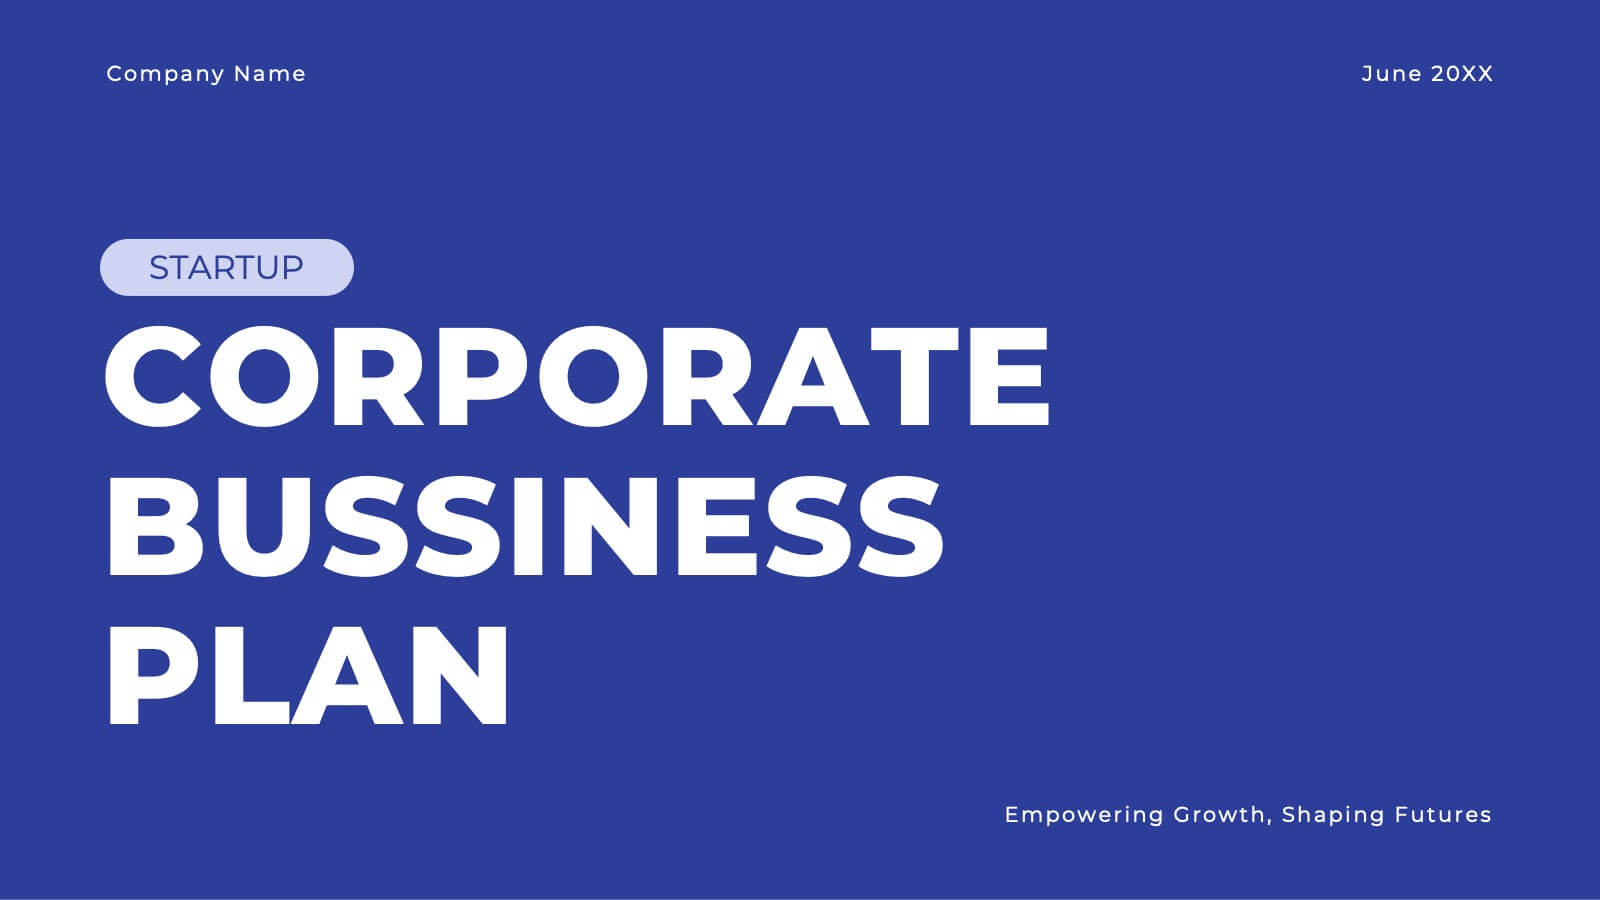
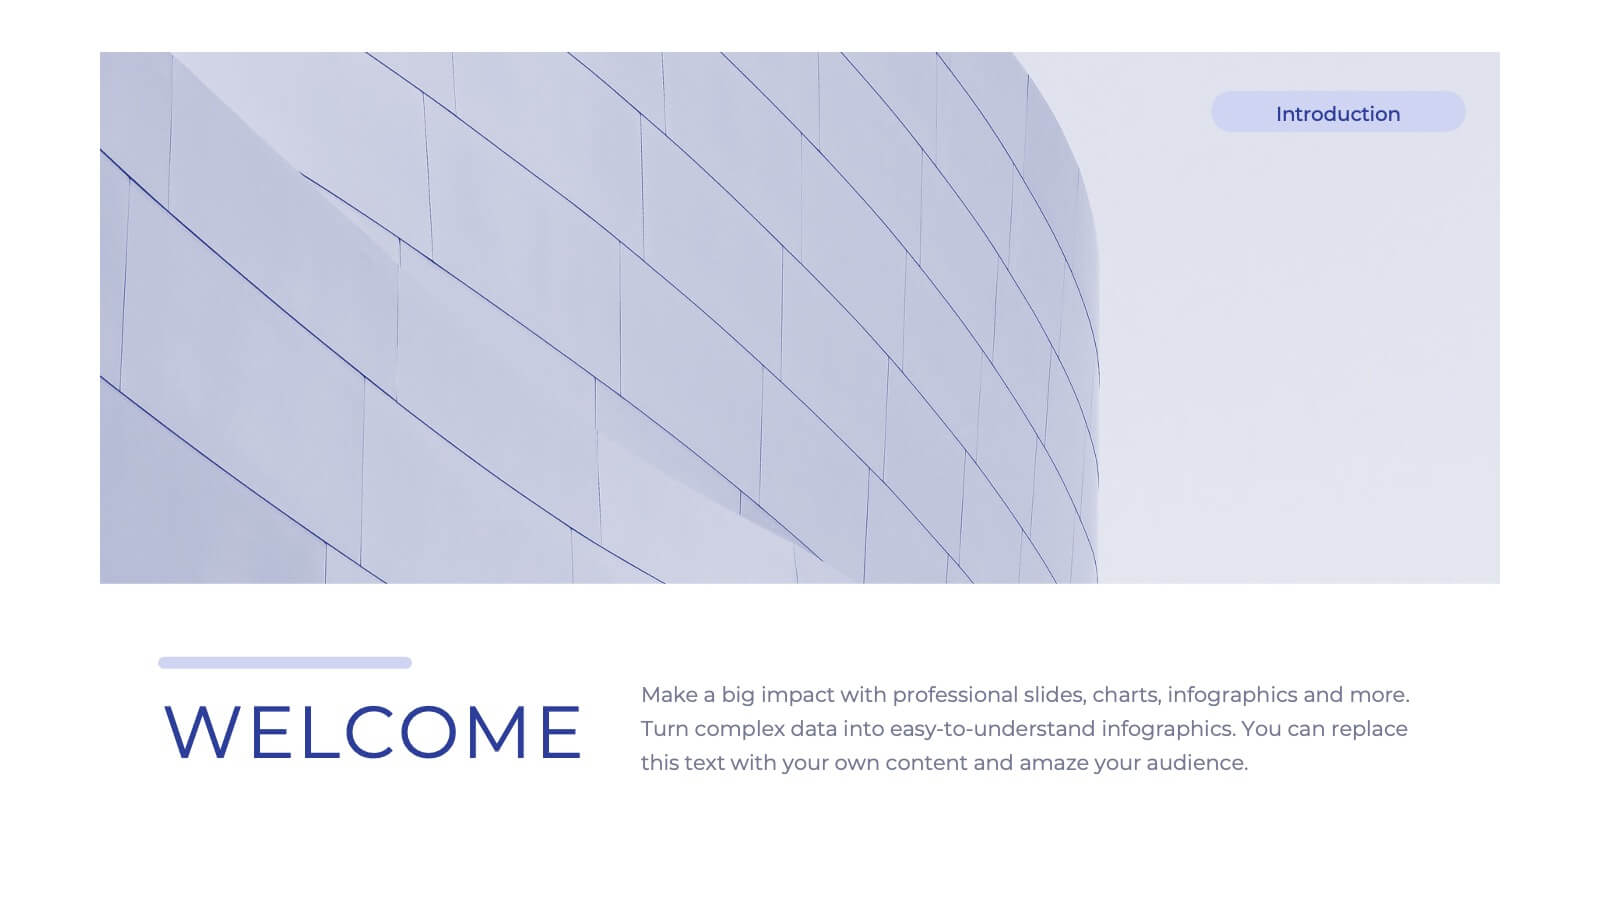
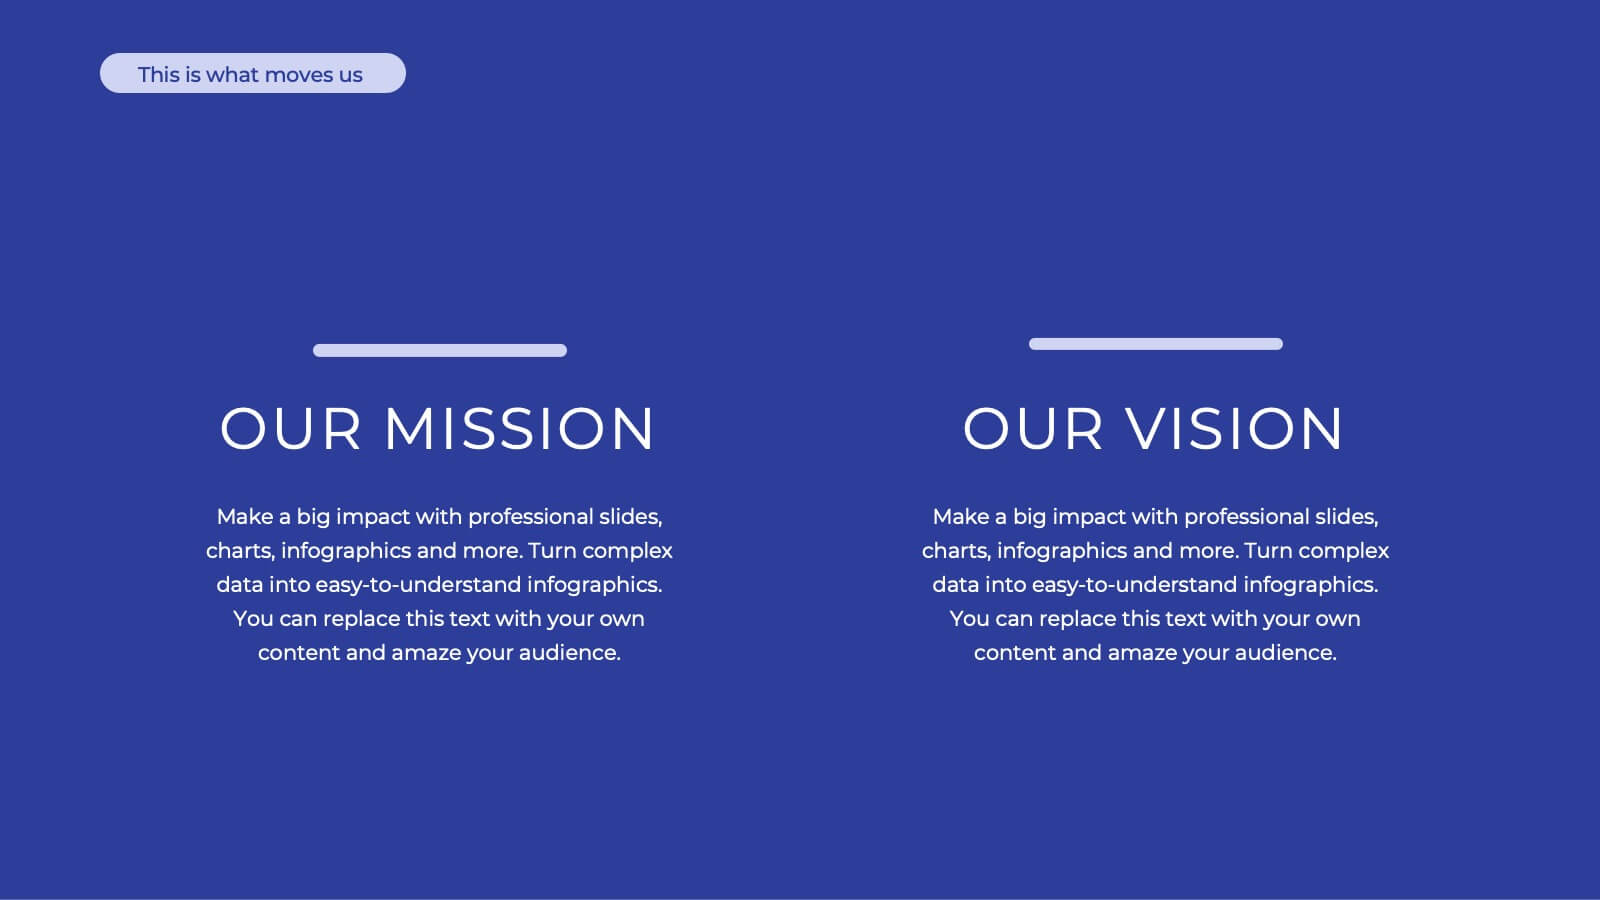
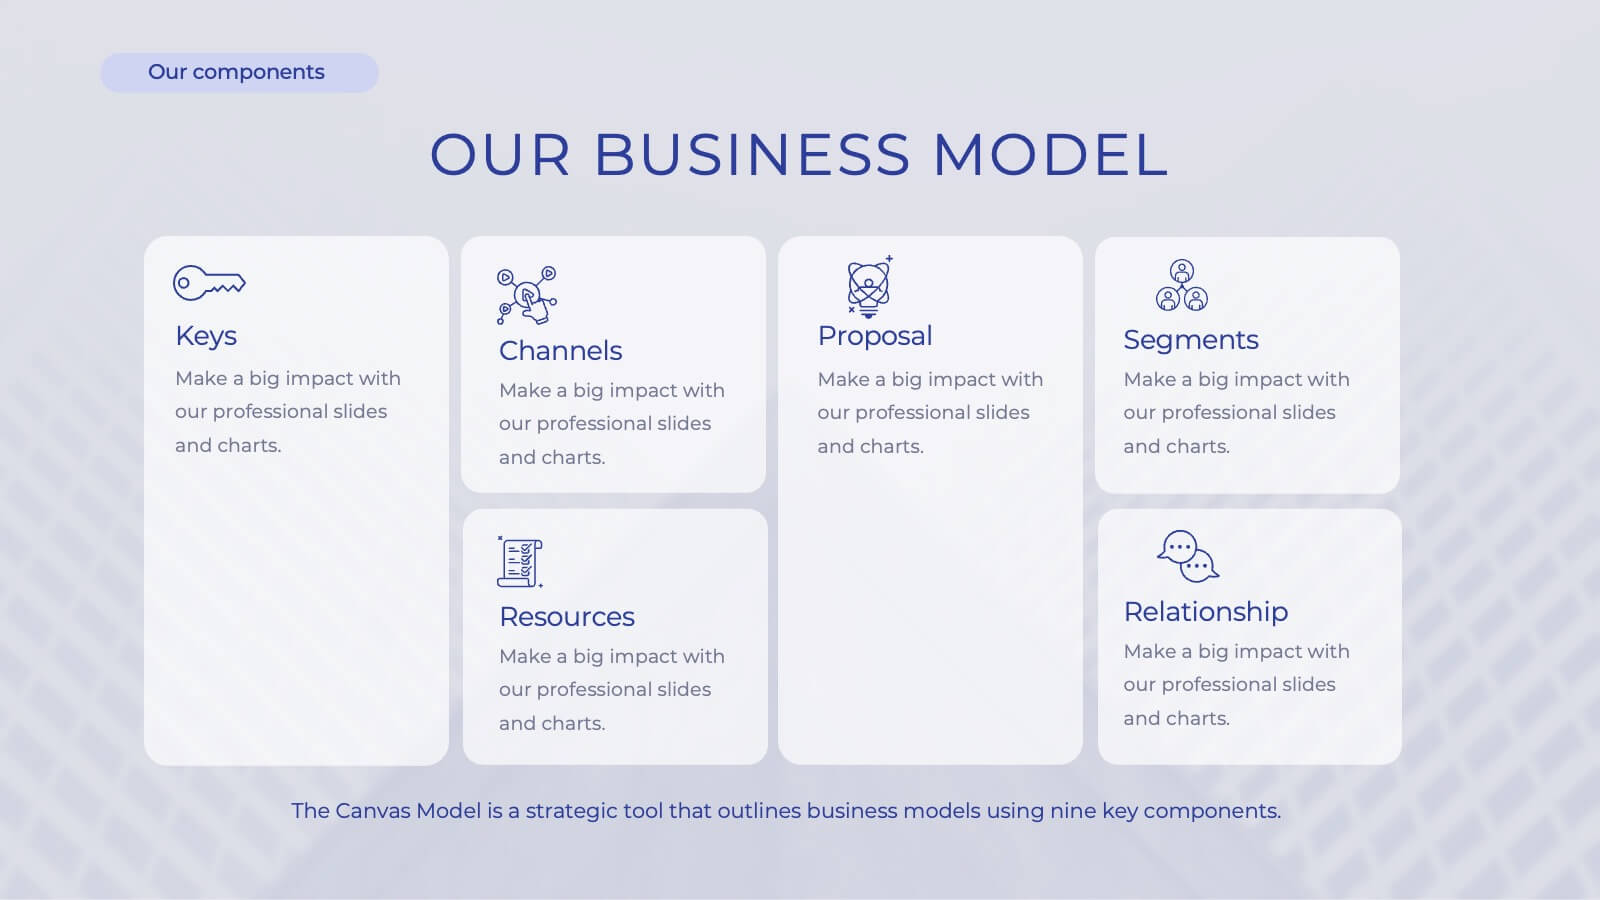
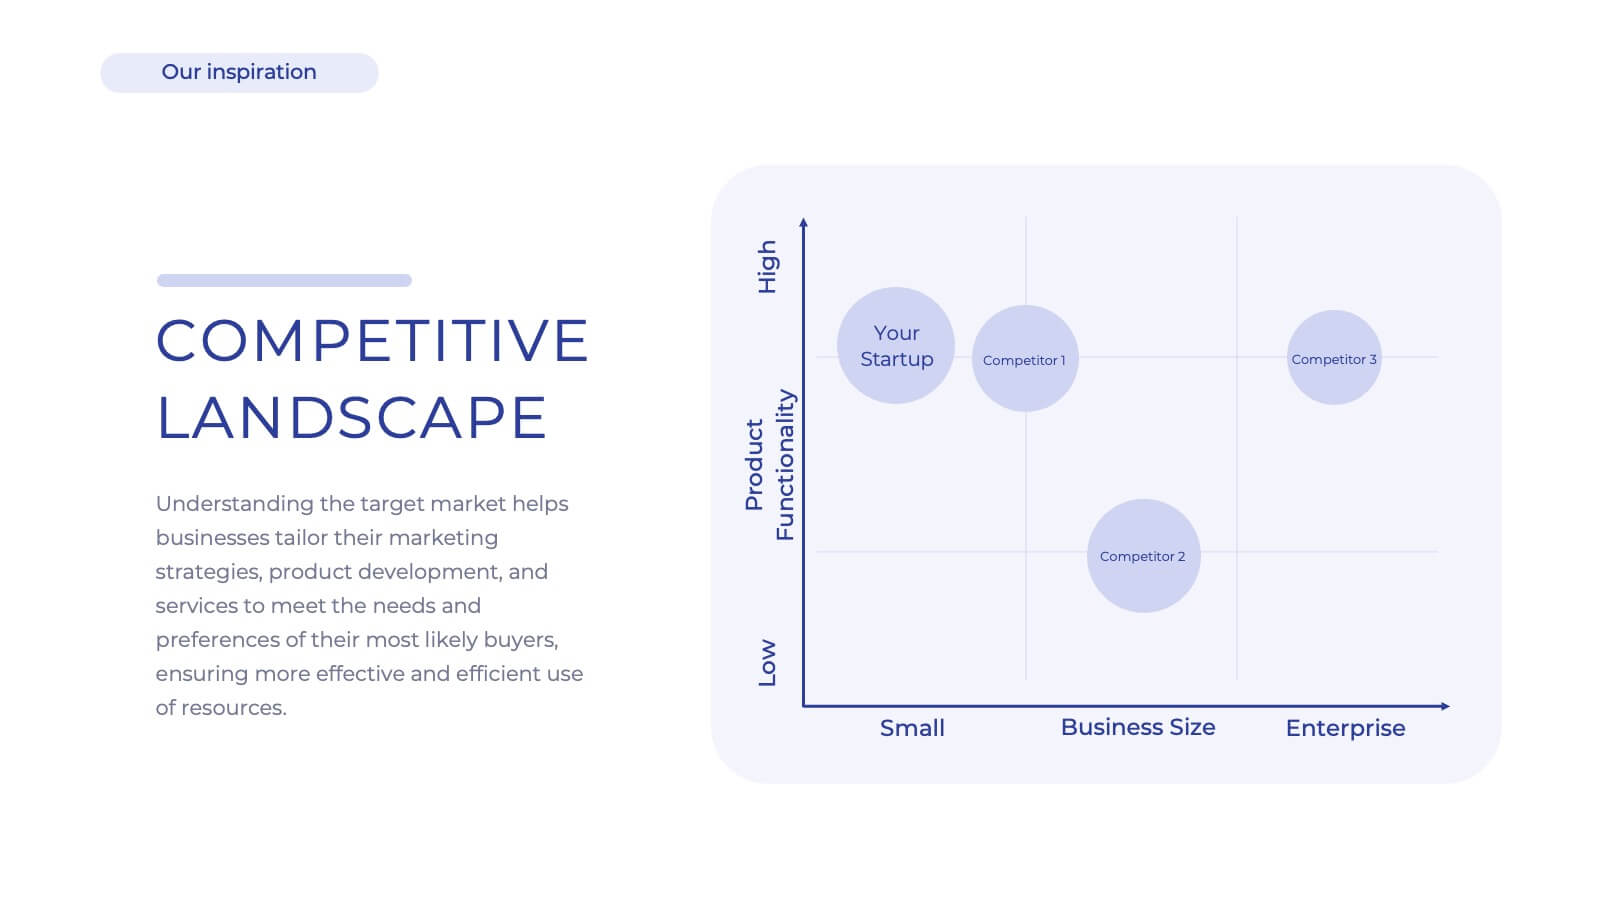
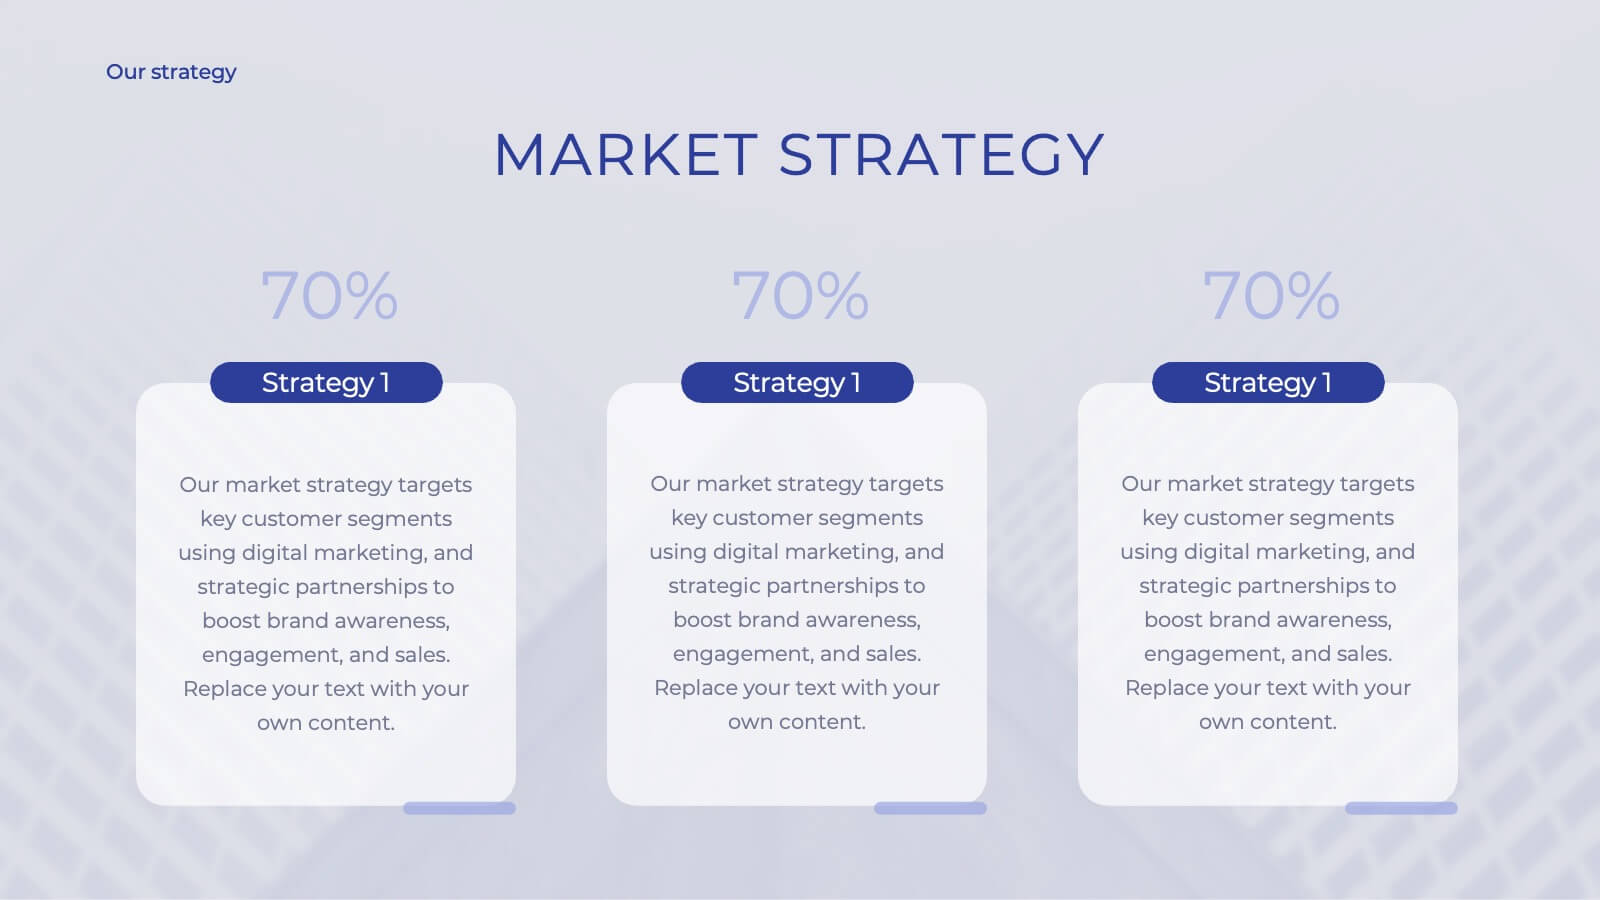
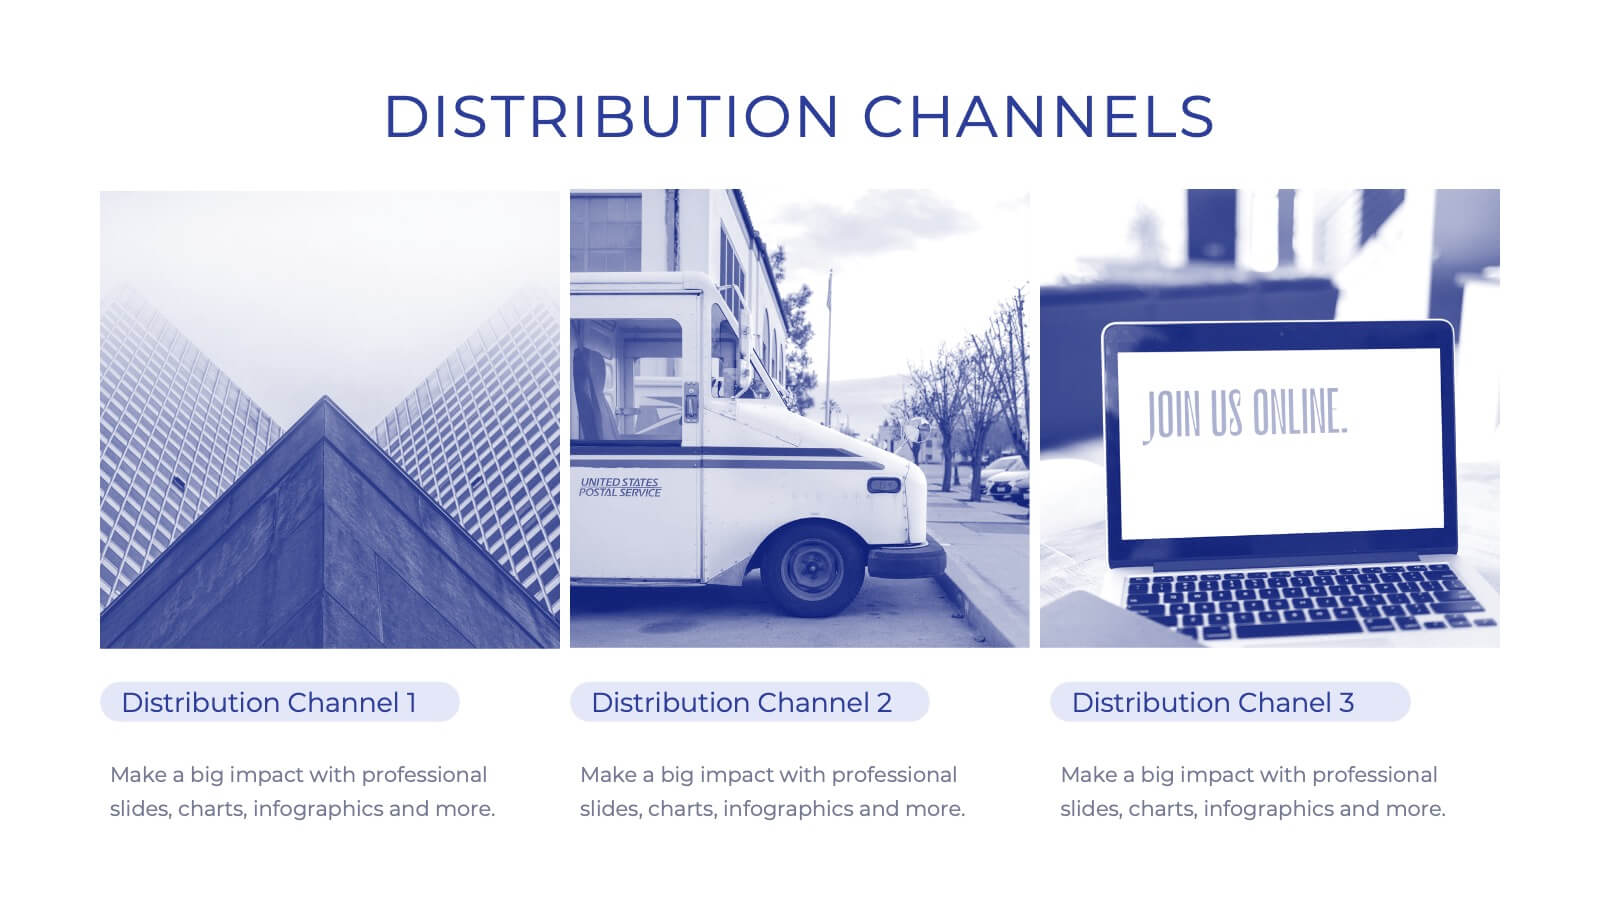
Iconic Startup Business Plan Presentation
Introducing our comprehensive corporate business plan template! Perfect for showcasing your company’s mission, vision, and services. Highlight your market strategy, competitive landscape, and growth plan in a professional design. Ideal for executives and entrepreneurs. Compatible with PowerPoint, Keynote, and Google Slides.


6 slides
Audience Targeting and Segmentation
Get to know your audience like never before with this human-centered visual layout—ideal for mapping out key segments, demographics, and targeting strategies. Great for marketing plans, user personas, or customer insights presentations, this slide keeps your data visually focused and easy to digest. Fully compatible with PowerPoint, Keynote, and Google Slides.


6 slides
Business Process Improvement via Six Sigma Presentation
Present your process improvement journey with clarity using the Business Process Improvement via Six Sigma Presentation. This linear DMAIC layout guides your audience through each essential phase—Define, Measure, Analyze, Improve, and Control—making it perfect for Lean Six Sigma professionals and operational efficiency teams. Fully editable in PowerPoint, Keynote, Canva, and Google Slides.


6 slides
Business Cloud Transformation Strategy Presentation
Streamline your cloud transition with this Business Cloud Transformation Strategy template. Perfect for IT leaders, cloud architects, and business executives, this slide provides a visual roadmap for migrating, integrating, and optimizing cloud solutions. With a modern, data-driven layout, it highlights key transformation phases, challenges, and benefits. Fully customizable and compatible with PowerPoint, Keynote, and Google Slides for professional presentations.


6 slides
Workplace Culture and Office Environment Presentation
Highlight team values and workplace dynamics with this modern layout, featuring a central desk illustration flanked by six color-coded points. Perfect for showcasing employee engagement, office norms, or hybrid work strategies. The split design helps balance visual storytelling with concise content. Easily editable in PowerPoint, Keynote, or Google Slides to match your brand and message.


6 slides
Design Thinking 5-Stage Model Presentation
Turn creativity into structured innovation with a clean, circular layout that guides your audience through each phase of problem-solving and ideation. Ideal for workshops, strategy sessions, or innovation pitches, this presentation makes complex processes easy to follow. Fully compatible with PowerPoint, Keynote, and Google Slides for seamless editing.


7 slides
One-Page Startup Model Canvas
Launch and refine your business idea with clarity using the One-Page Startup Model Canvas Presentation. This slide presents all key startup elements—Partners, Activities, Value Propositions, Customer Segments, Revenue Streams, and more—in a smart puzzle-piece layout that simplifies complex planning. Perfect for founders and pitch decks. Fully customizable in PowerPoint, Keynote, and Google Slides.


21 slides
Illume Detailed Project Execution Plan Presentation
Get ready to wow your audience with this dynamic Project Execution Plan template! Bursting with sleek design, it transforms your project timelines, deliverables, and stakeholder analysis into a stunning visual journey. Keep everyone engaged while you showcase your strategy with flair and finesse. Perfect for PowerPoint, Keynote, and Google Slides!


6 slides
Step-by-Step Process Guide Presentation
Clearly outline your workflow with this step-by-step process guide template, featuring six bold arrow graphics for sequential planning. Perfect for illustrating procedures, timelines, or strategies, this modern design ensures clarity and flow. Fully editable in Canva, PowerPoint, or Google Slides, making it ideal for business, project management, or training presentations.


10 slides
Depth-Based Visual Charts in 3D Presentation
Elevate your data storytelling with the Depth-Based Visual Charts in 3D Presentation. This slide set transforms layered information into eye-catching 3D stack visuals—perfect for showcasing rankings, workflows, or strategic hierarchies. Fully editable in PowerPoint, Keynote, and Google Slides for seamless customization.