


Features
- 10 Unique slides
- Fully editable and easy to edit in Microsoft Powerpoint, Keynote and Google Slides
- 16:9 widescreen layout
- Clean and professional designs
- Export to JPG, PDF or send by email


Do you have any questions?
Recommend


4 slides
Customer Segment Breakdown Presentation
Bring clarity to your audience with a dynamic visual that highlights who your customers truly are and how each segment connects. This presentation helps you map behaviors, priorities, and shared traits in a clean, intuitive layout for smarter marketing and strategy decisions. Fully compatible with PowerPoint, Keynote, and Google Slides.


4 slides
Organizational Layered Structure Presentation
Visualize team dynamics and reporting lines with this clean and professional organizational layered structure template. Designed to help you present hierarchy, roles, and responsibilities across departments, this slide is perfect for HR, operations, or executive updates. Easily editable and fully compatible with PowerPoint, Keynote, and Google Slides.

22 slides
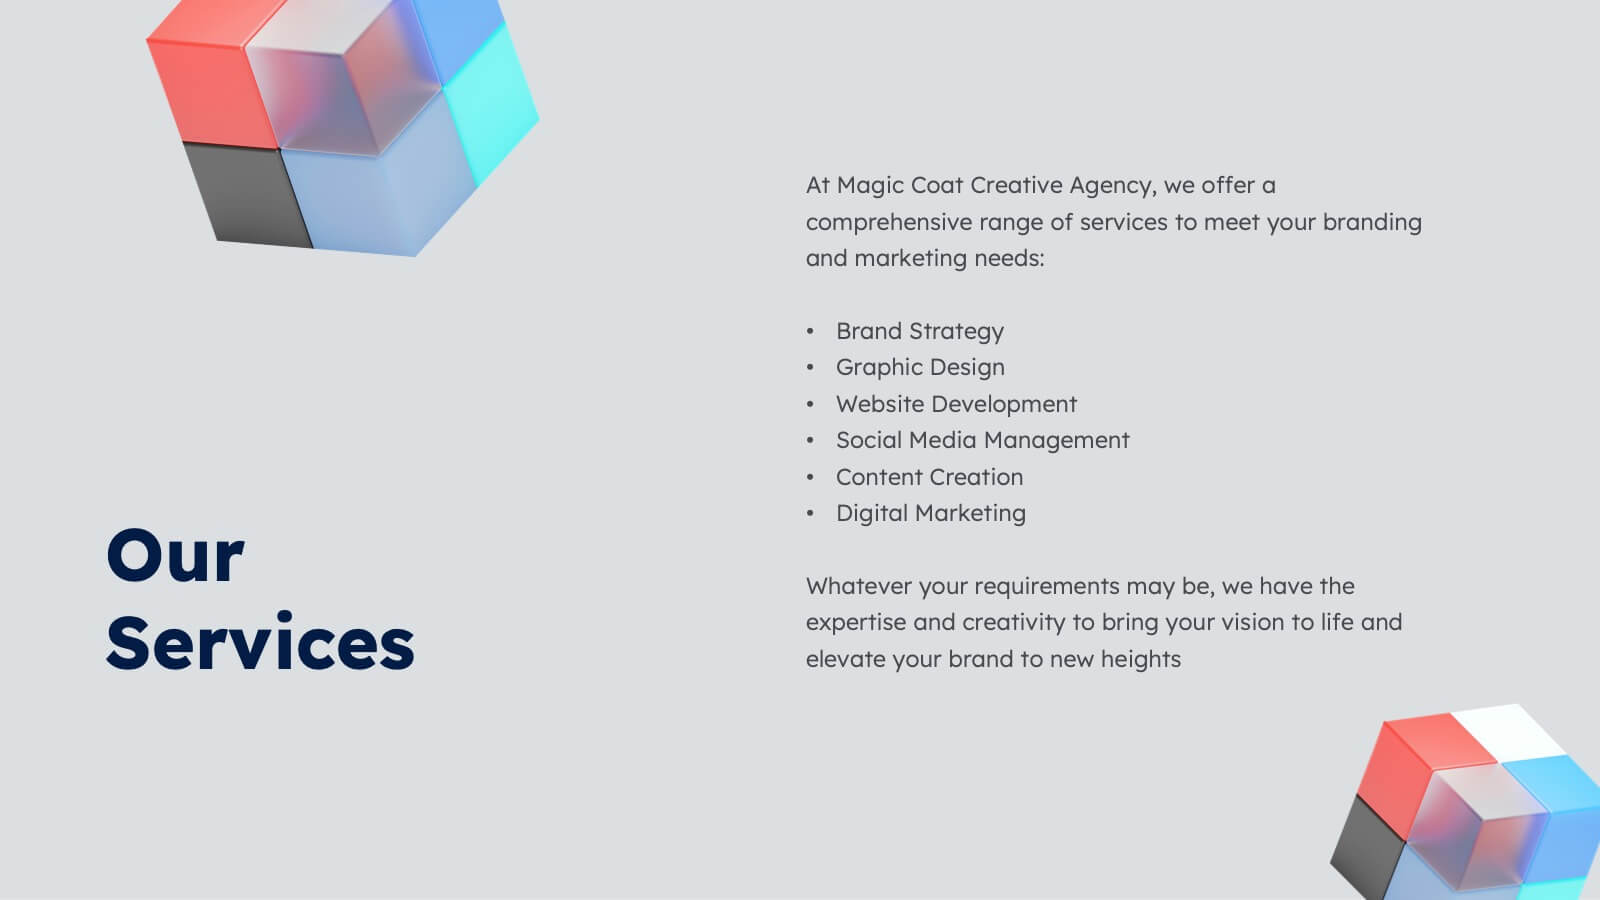
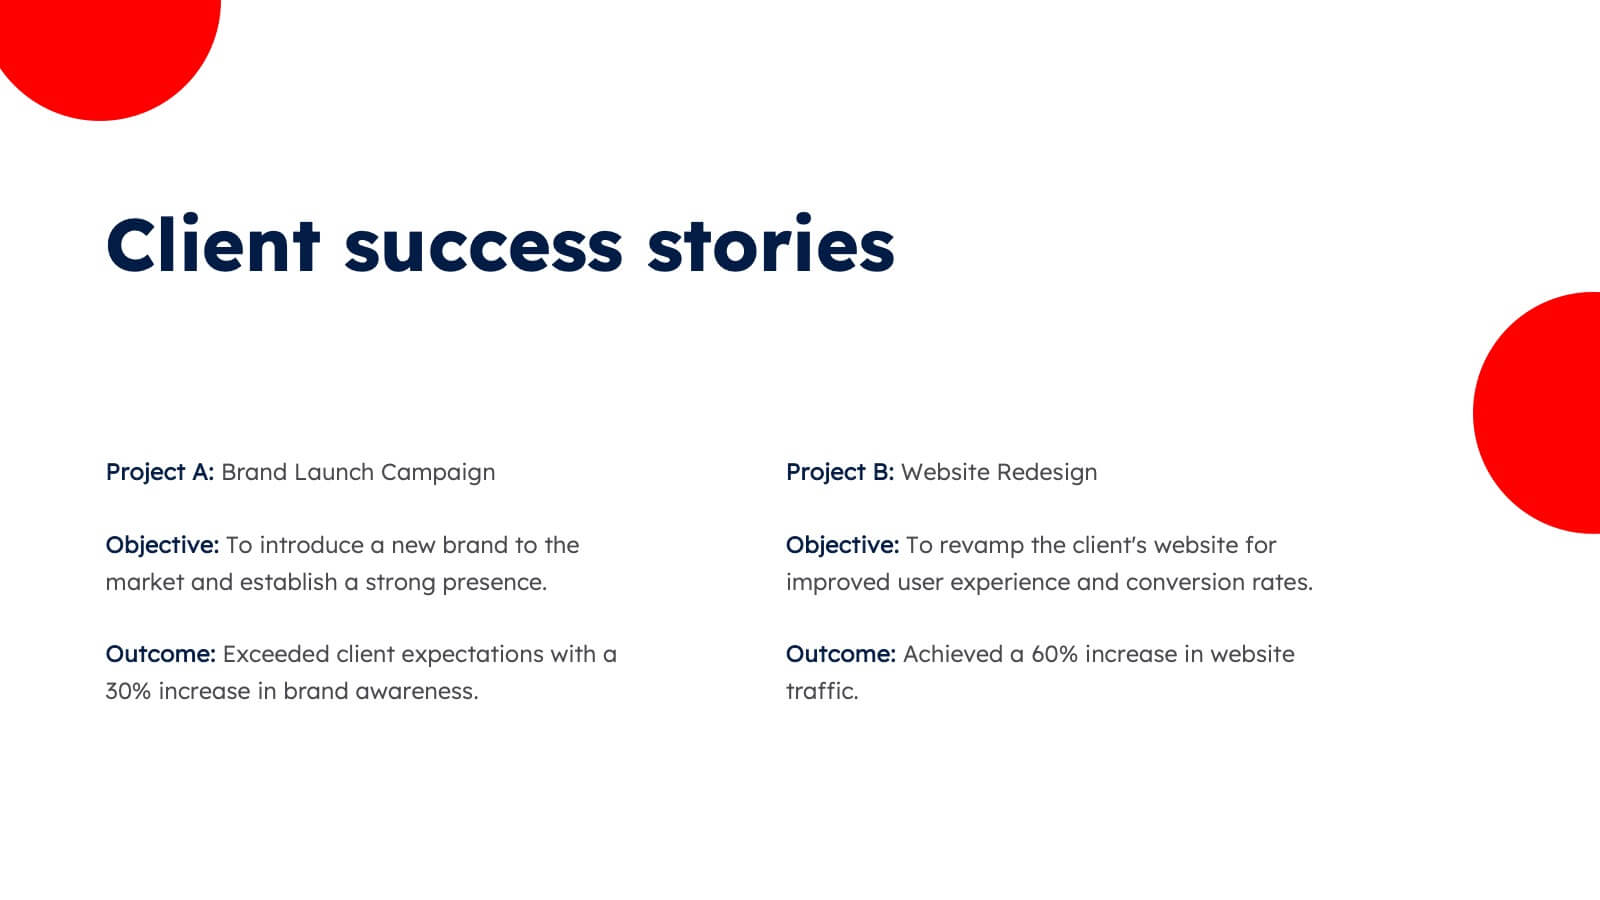
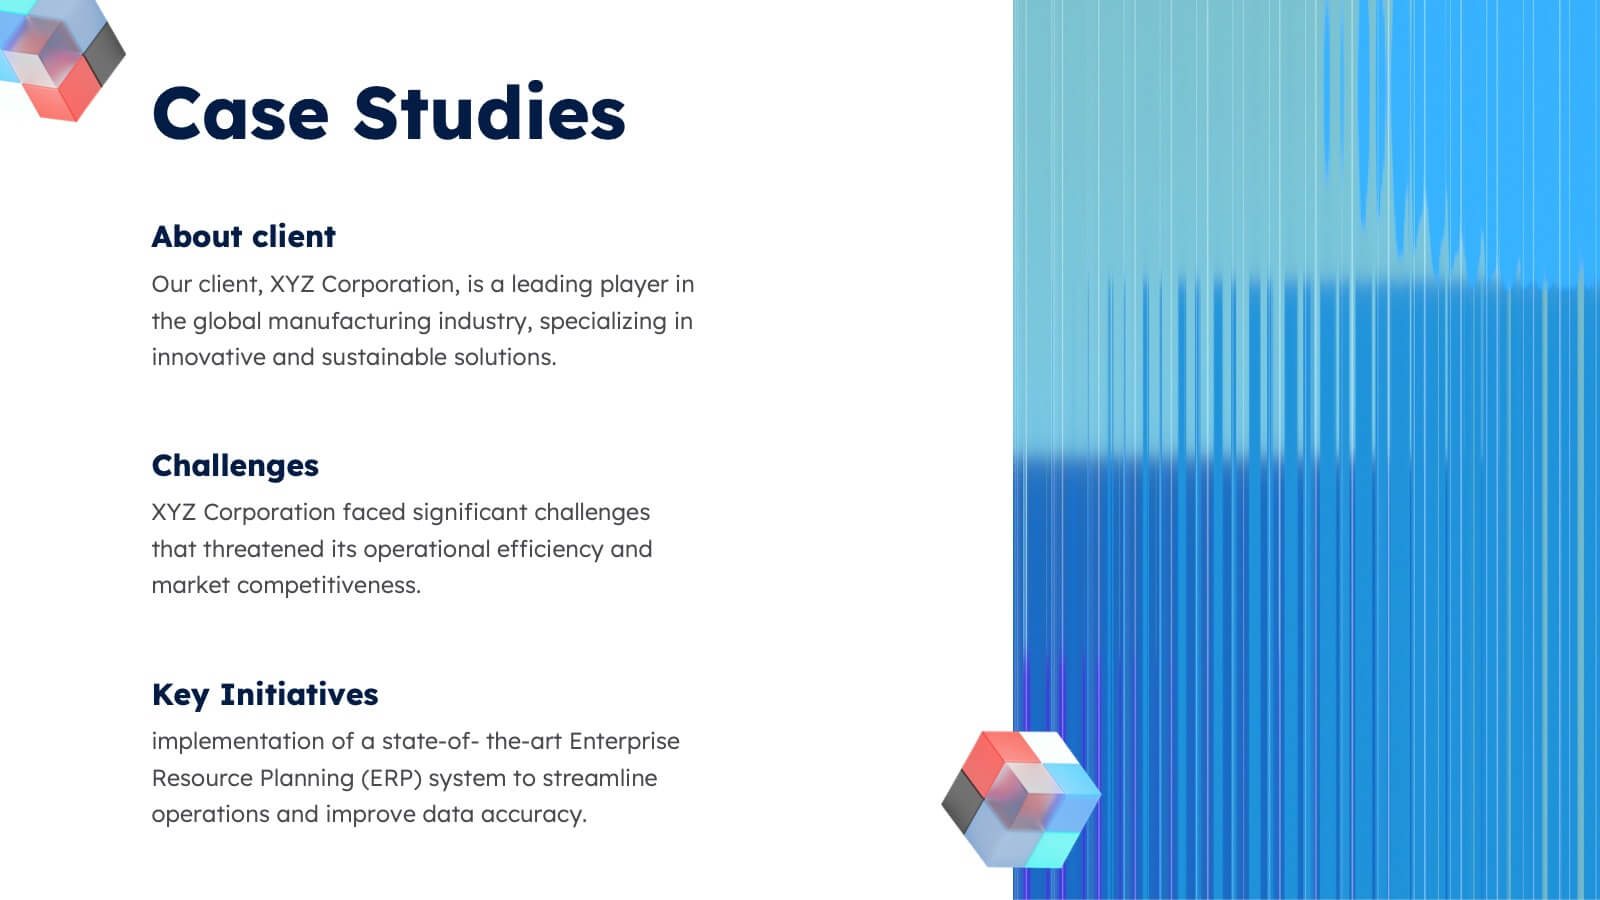
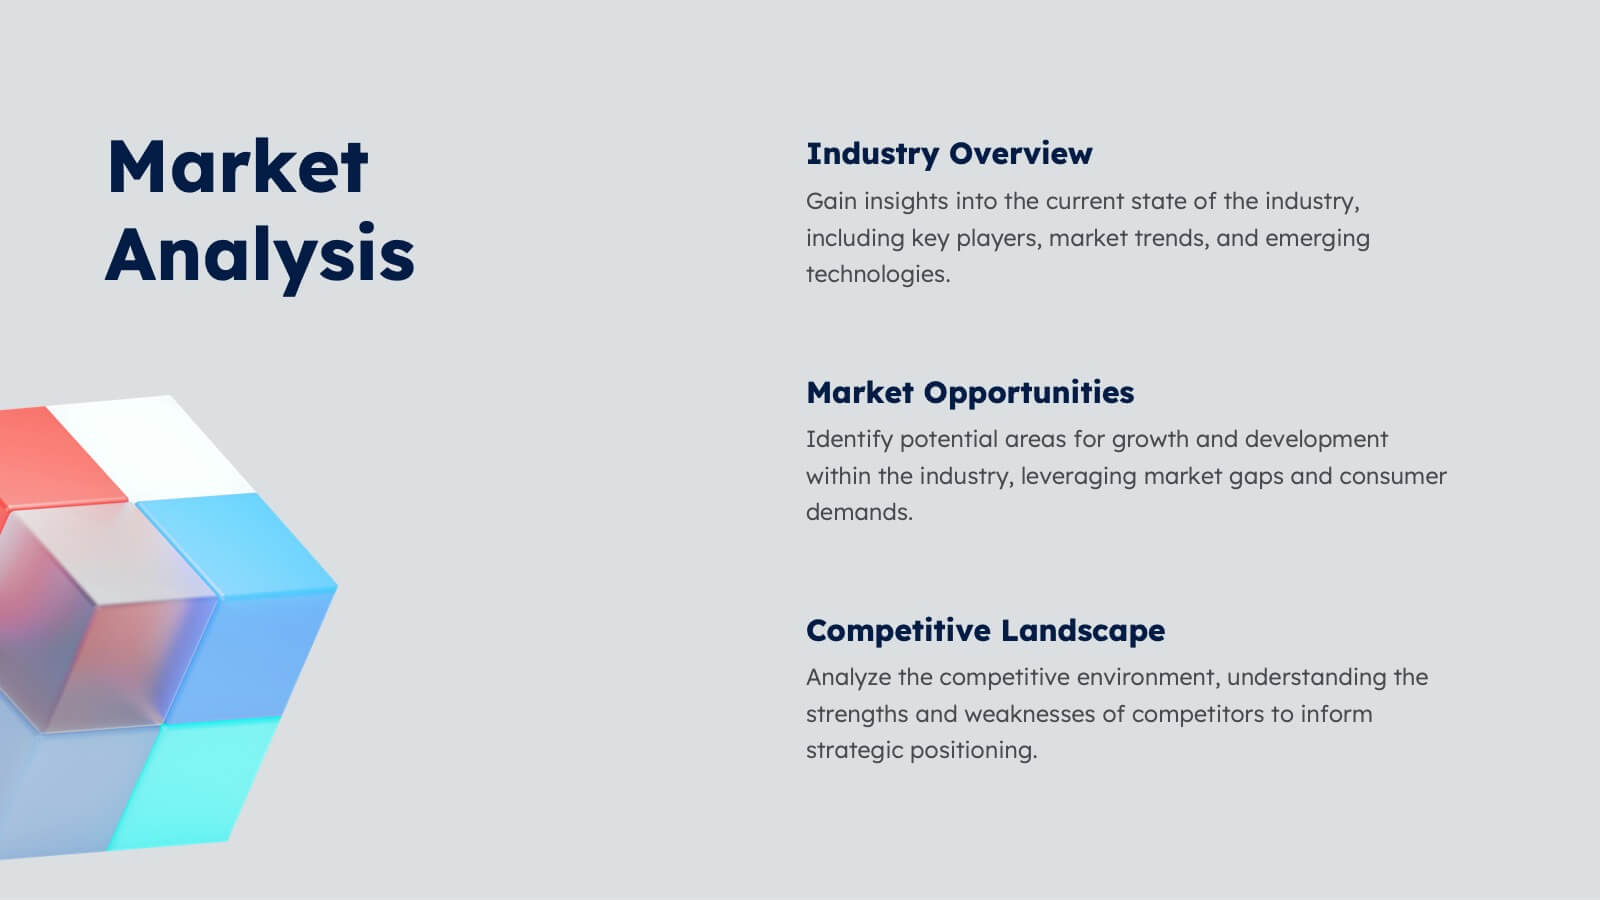
Aura Agency Portfolio Presentation
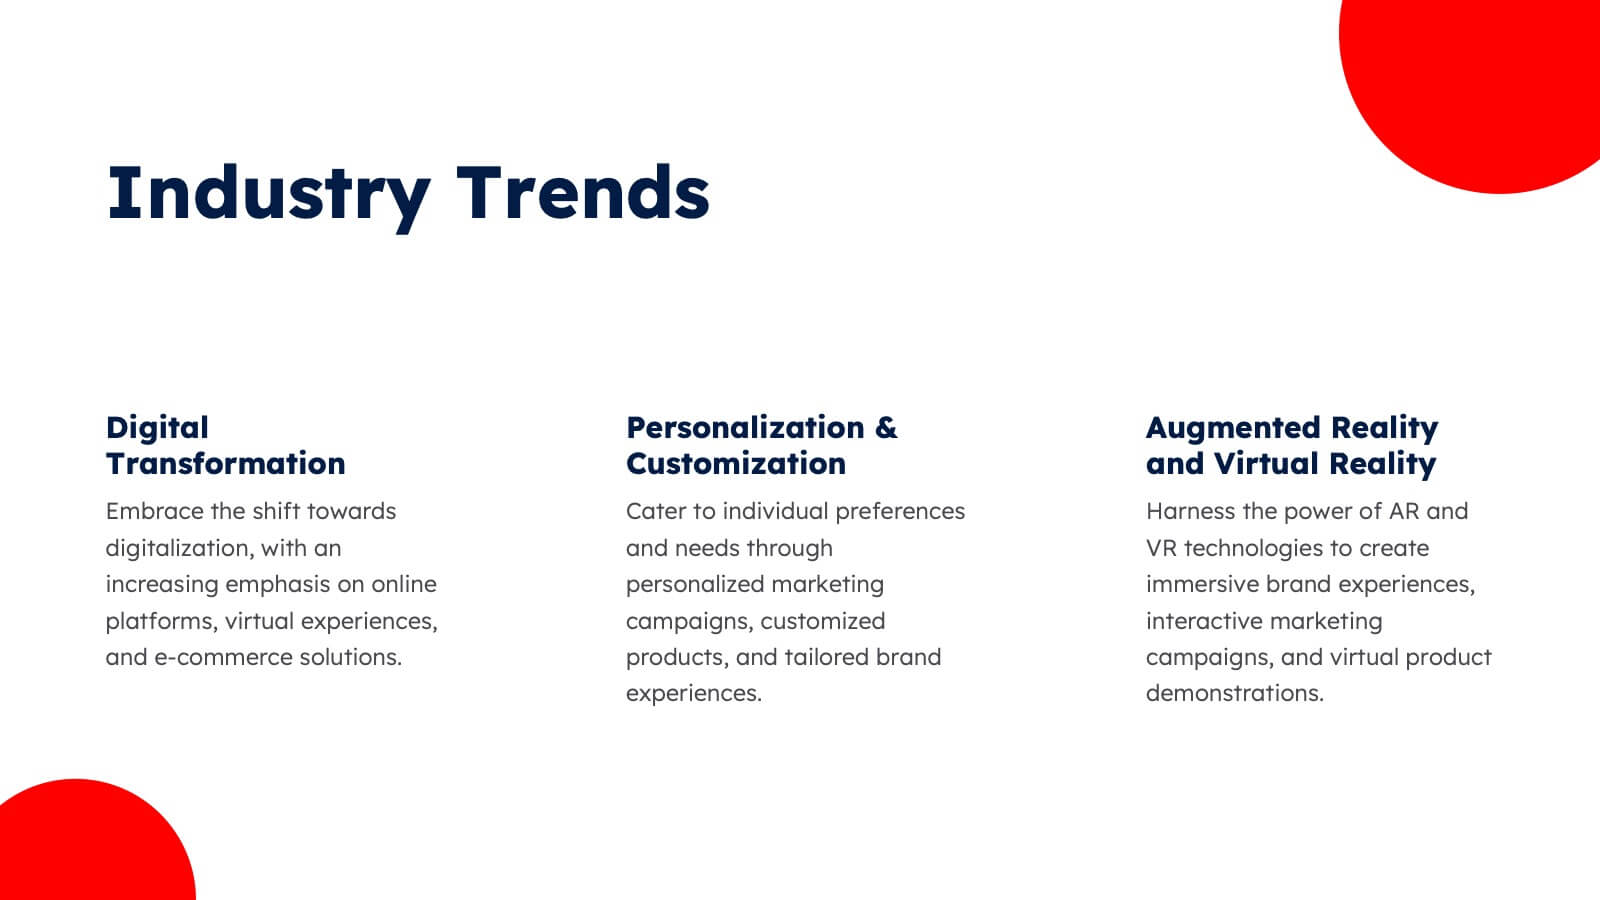
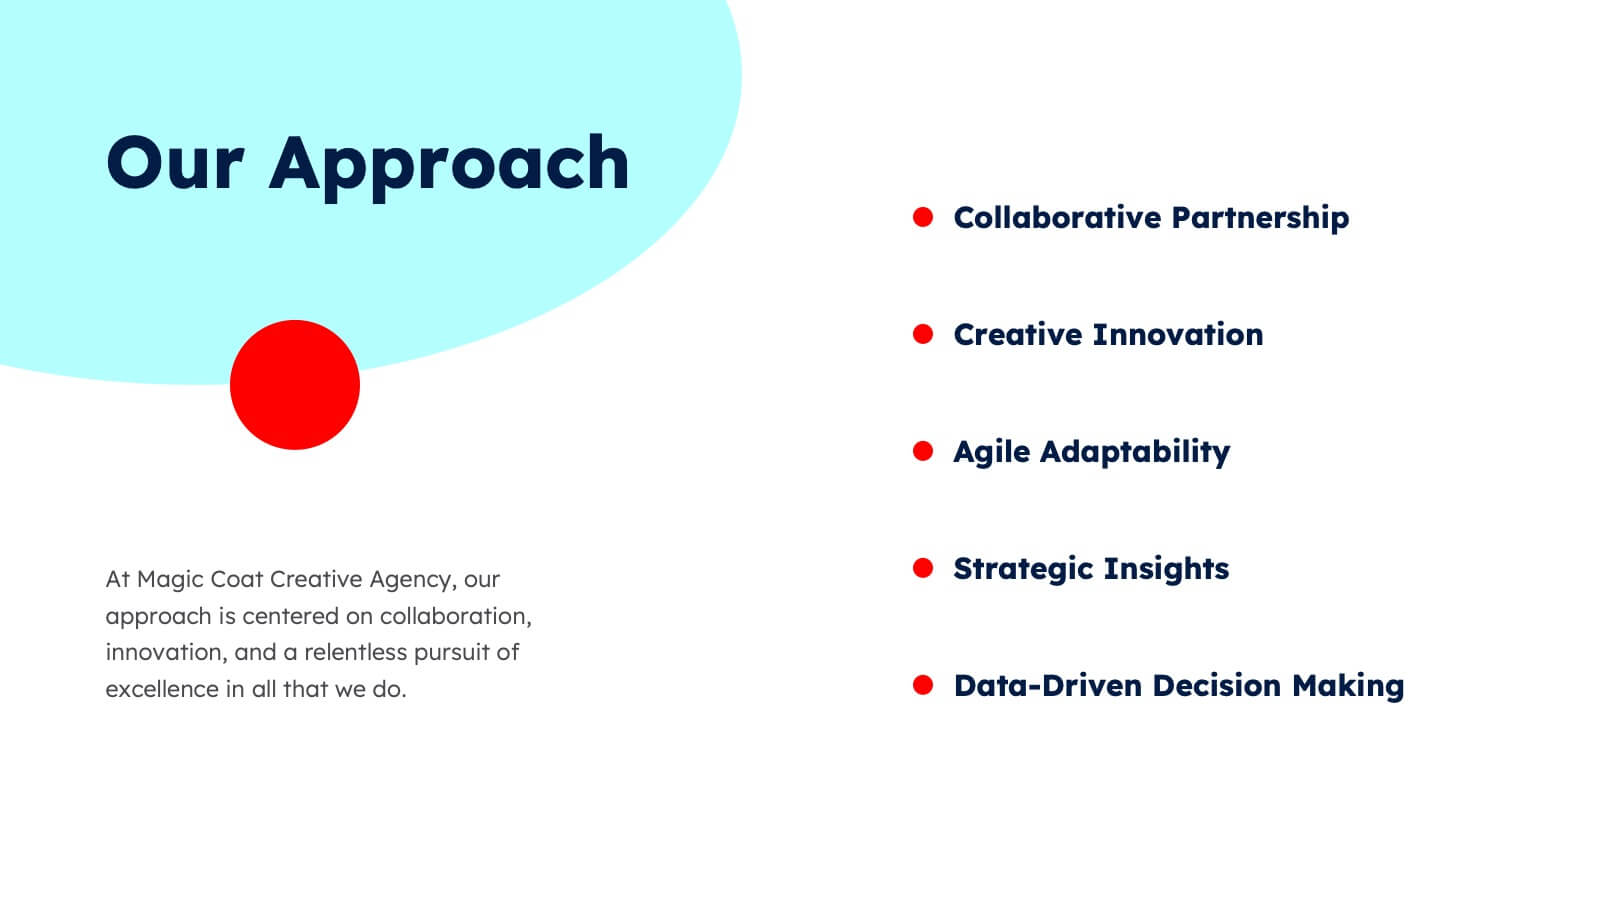
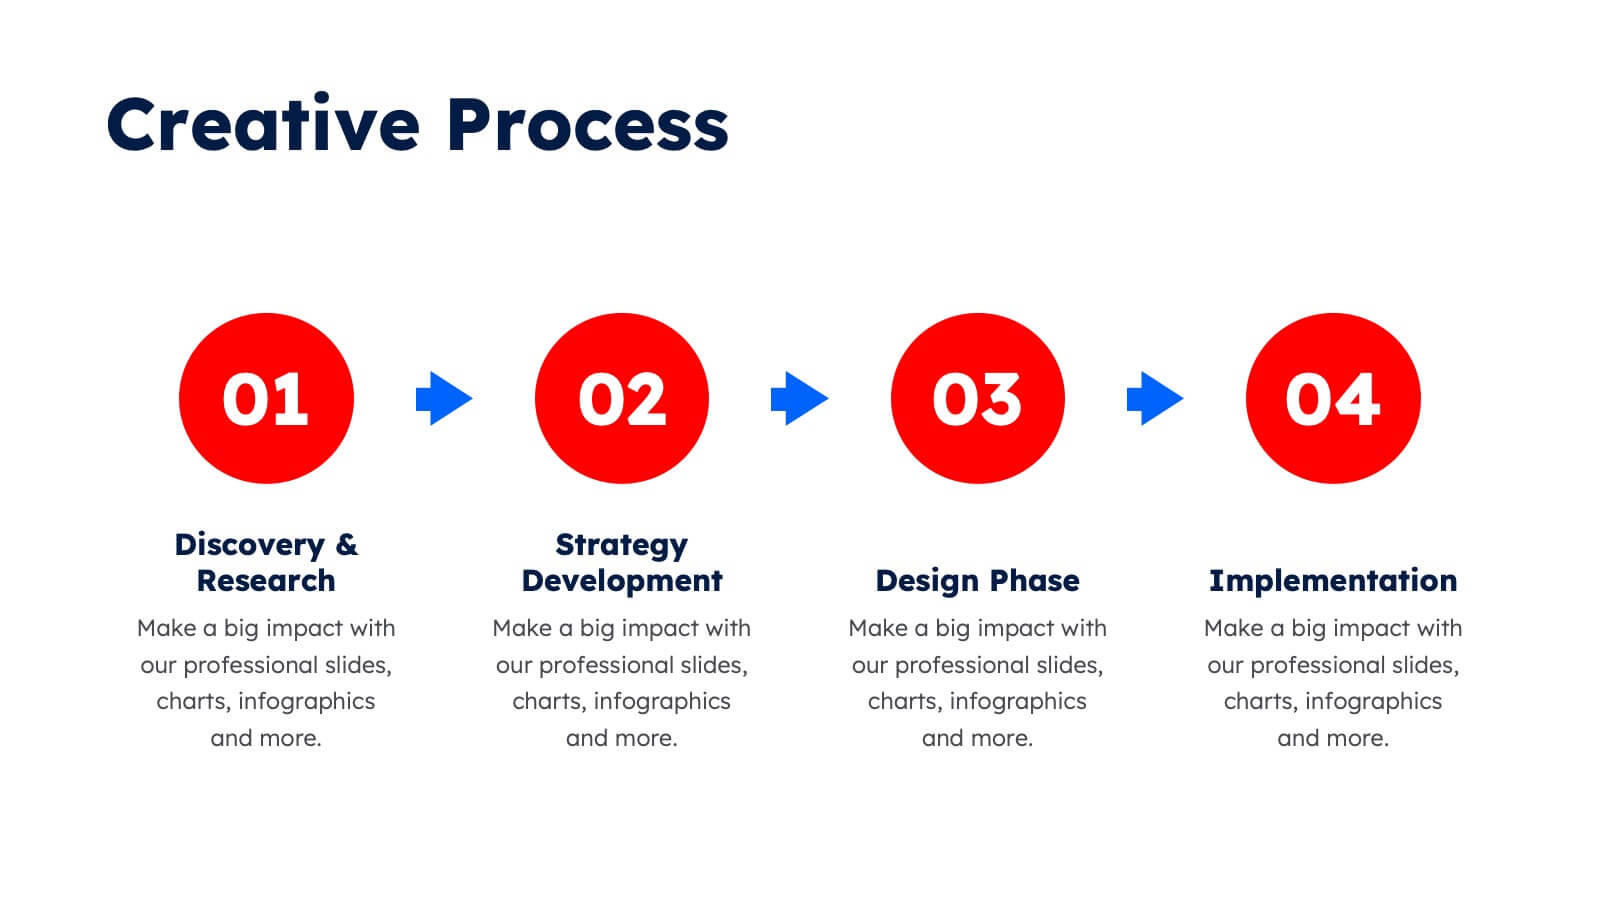
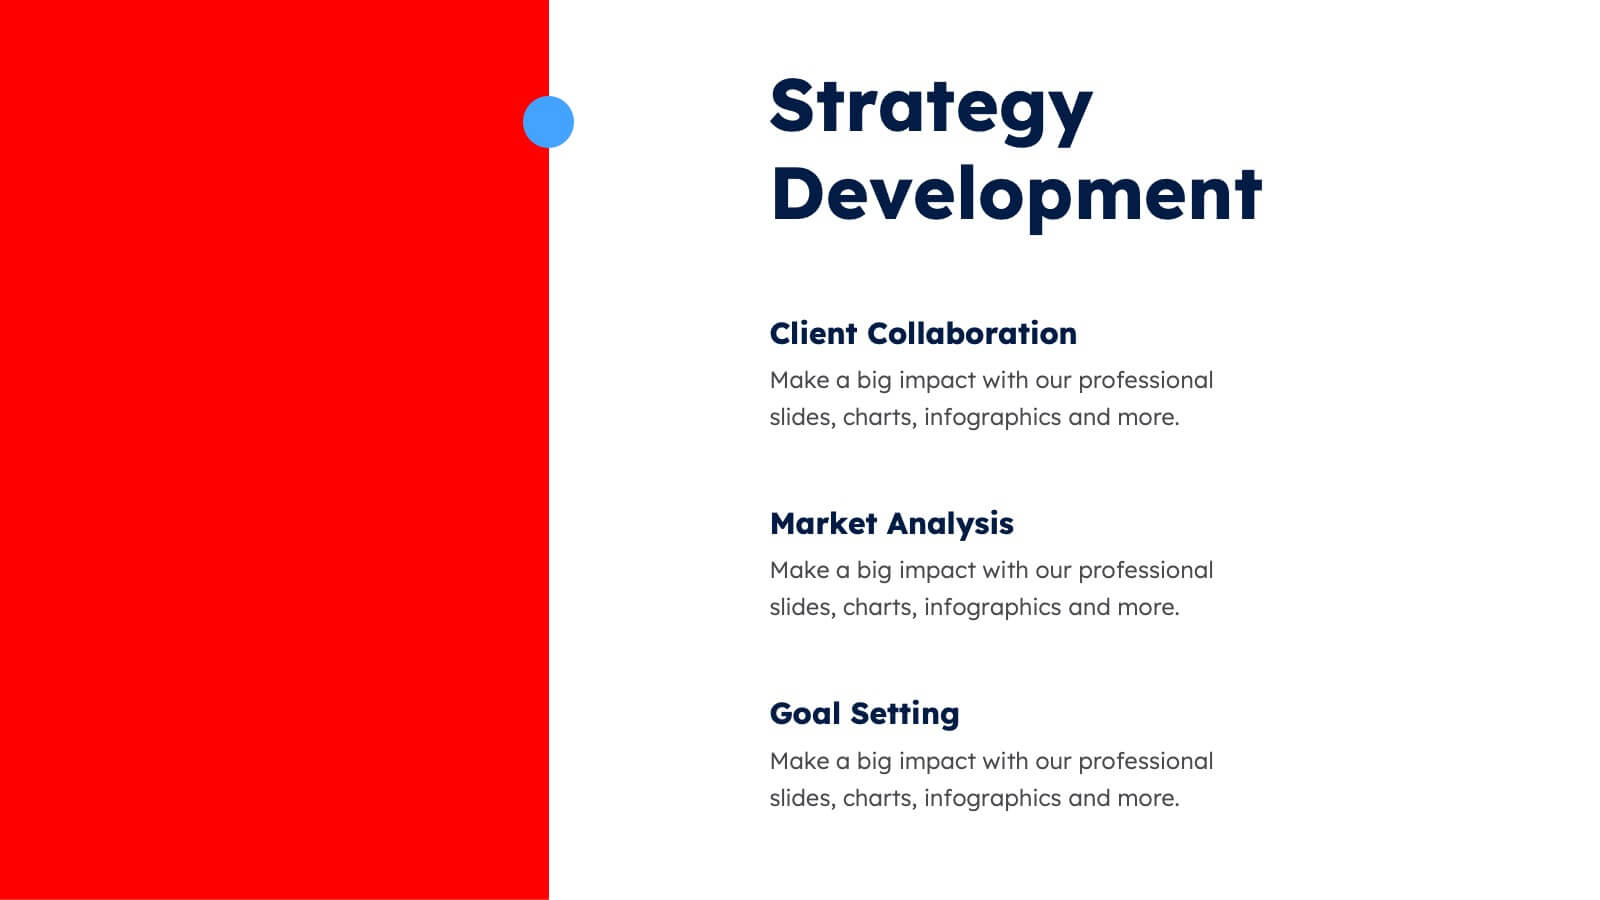
Showcase your agency's brilliance with this vibrant portfolio presentation template! Ideal for highlighting your mission, vision, case studies, and market analysis, it brings your achievements to life with colorful, engaging slides. Impress clients and partners with a well-structured, visually appealing narrative. Compatible with PowerPoint, Keynote, and Google Slides for easy use on any platform.


7 slides
Problem Solving Infographic
Transform your approach to complex challenges with our Infographic Templates, crafted to facilitate effective problem-solving. This set offers a range of designs that make it simple to map out solutions, visualize decision processes, and communicate actionable strategies. With options from hexagonal designs that interlink components to sleek, linear layouts that guide the viewer through each step of the problem-solving journey, these templates are ideal for making complex information accessible and engaging. Customize each template with your choice of colors, fonts, and text to maintain a consistent brand identity. Compatible with PowerPoint, Google Slides, and Keynote, they are perfect for business strategists, project managers, and consultants who need to present solutions clearly and persuasively. Equip yourself with these templates to drive effective problem-solving and decision-making in your presentations.


23 slides
Quest Corporate Strategy Proposal Presentation
Unlock success with this powerful corporate strategy template! Detail strategic objectives, market trends, and growth opportunities. Ideal for business leaders aiming to drive growth. Compatible with PowerPoint, Keynote, and Google Slides, this template ensures your strategy is clear, professional, and compelling. Make your vision a reality with impactful presentations.


7 slides
Enterprise Sales Infographic
Enterprise sales, often referred to as B2B (business-to-business) sales, involves selling products or services to larger organizations and enterprises. Prepare for an exhilarating journey through our sales infographic - a high-energy presentation designed to fuel your enterprise sales like never before. Illuminate the path to a seamless customer experience, leading to a galaxy of satisfaction. This infographic is fully customizable and compatible with Powerpoint, Keynote, and Google Slides. This template isn't just a sales roadmap; it's a launchpad to your unparalleled success!


6 slides
Investment Strategy Planning Presentation
The "Investment Strategy Planning Presentation" templates employ a clean and straightforward design with pentagon-shaped elements to visually represent various stages or components of investment strategies. Each template highlights key points with icons that effectively communicate the concept, making them especially useful for financial presentations where clarity and emphasis on specific financial strategies are crucial. This format supports a structured approach to presenting complex investment plans, helping to guide the audience through each phase of the strategy clearly and efficiently.


4 slides
Culinary Business Branding Deck Presentation
Visualize your culinary identity with the Culinary Business Branding Deck Presentation. Designed with a segmented chef hat illustration, this slide helps you showcase four brand pillars—perfect for restaurants, food startups, and culinary consultants. Use it to highlight your cuisine focus, customer experience, service style, and ambiance. Fully editable in PowerPoint, Keynote, Google Slides, and Canva.


5 slides
RAPID Decision-Making Model Presentation
The RAPID Decision-Making Model template simplifies complex decision processes, laying out steps from recommending to deciding in an easily digestible format. It's ideal for team leaders and managers who want to streamline decision-making. The template is designed for seamless use across PowerPoint, Keynote, and Google Slides, ensuring broad compatibility and user-friendly presentations.


5 slides
User Experience Empathy Map Strategy Presentation
Step into the user’s mindset with the User Experience Empathy Map Strategy Presentation. This template helps you visualize your audience’s thoughts, feelings, behaviors, and perceptions using a structured empathy map format. Ideal for UX workshops, customer journey analysis, or product design strategy sessions. Fully customizable in PowerPoint, Keynote, Canva, and Google Slides.


7 slides
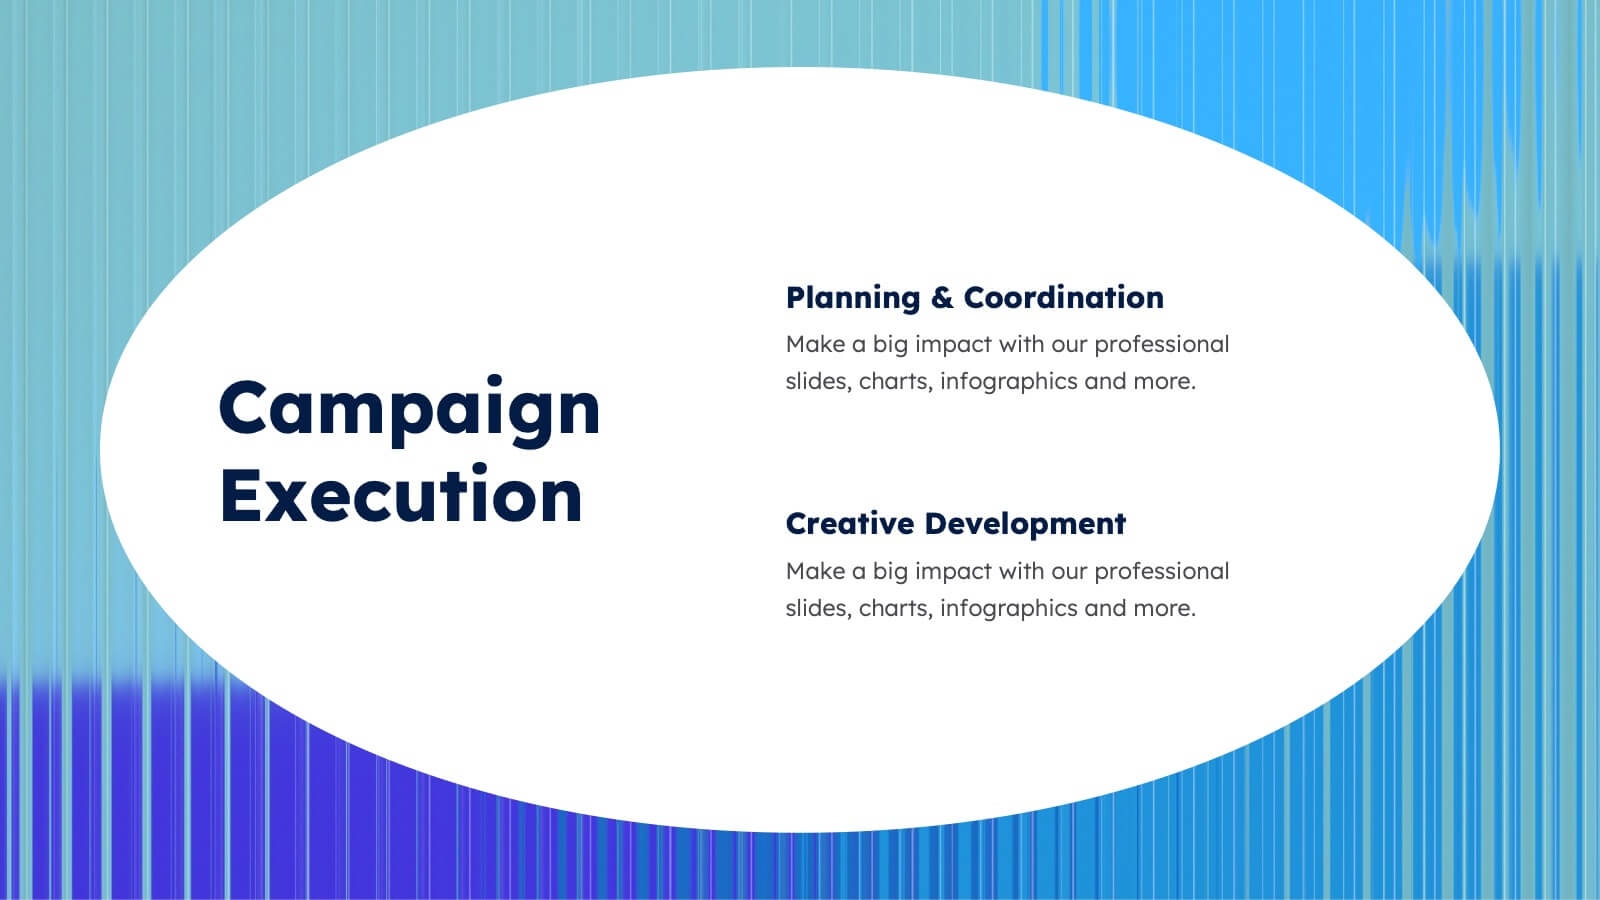
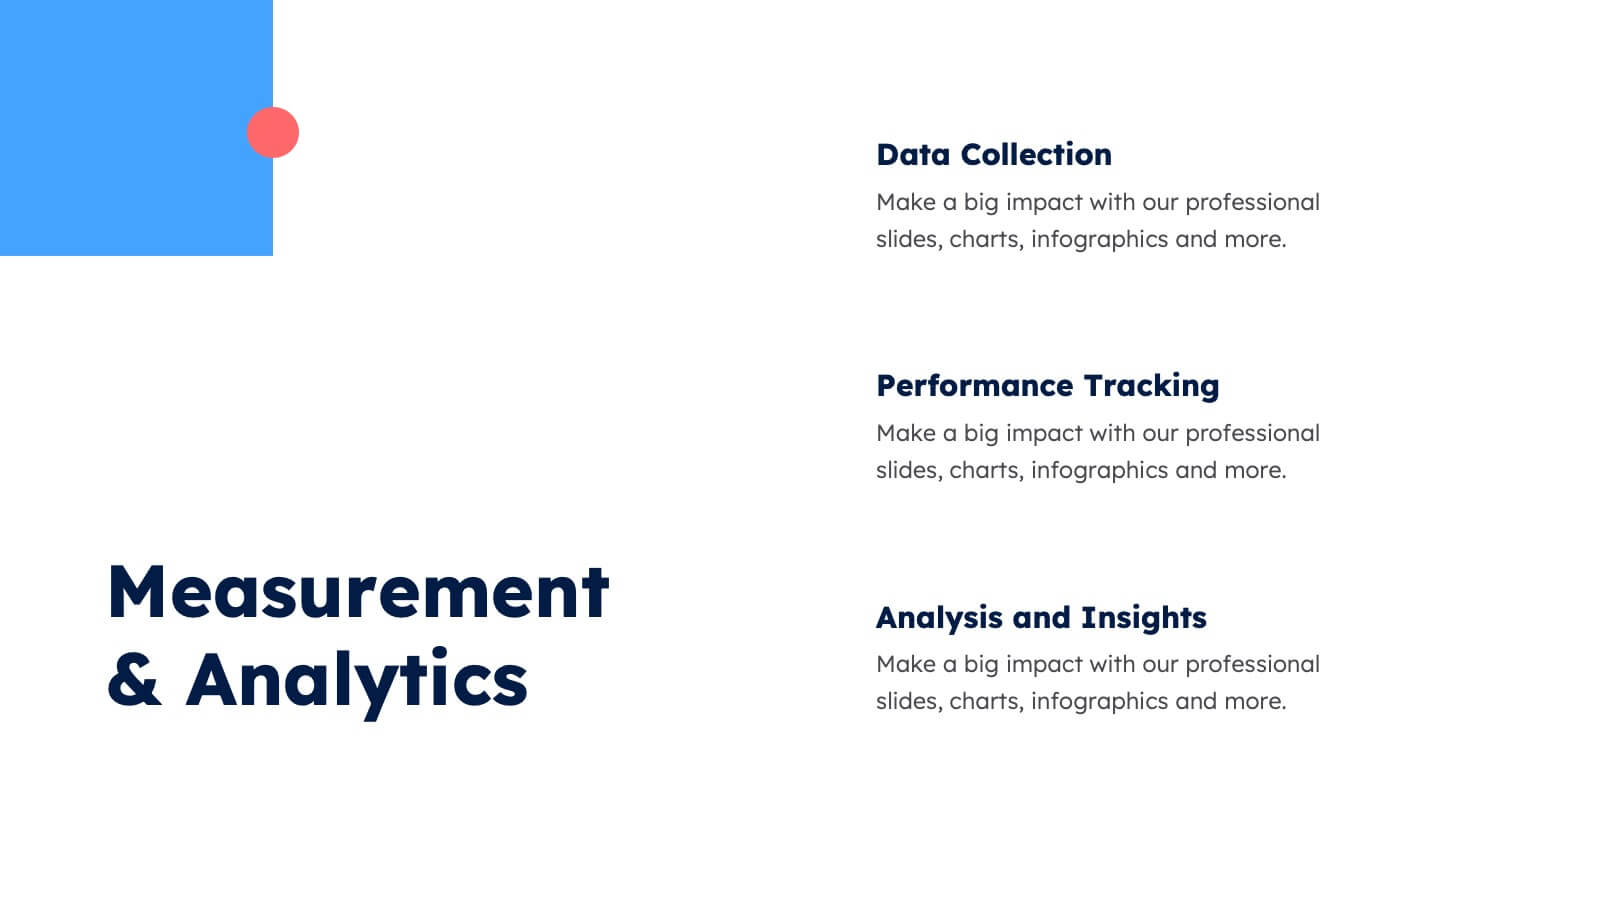
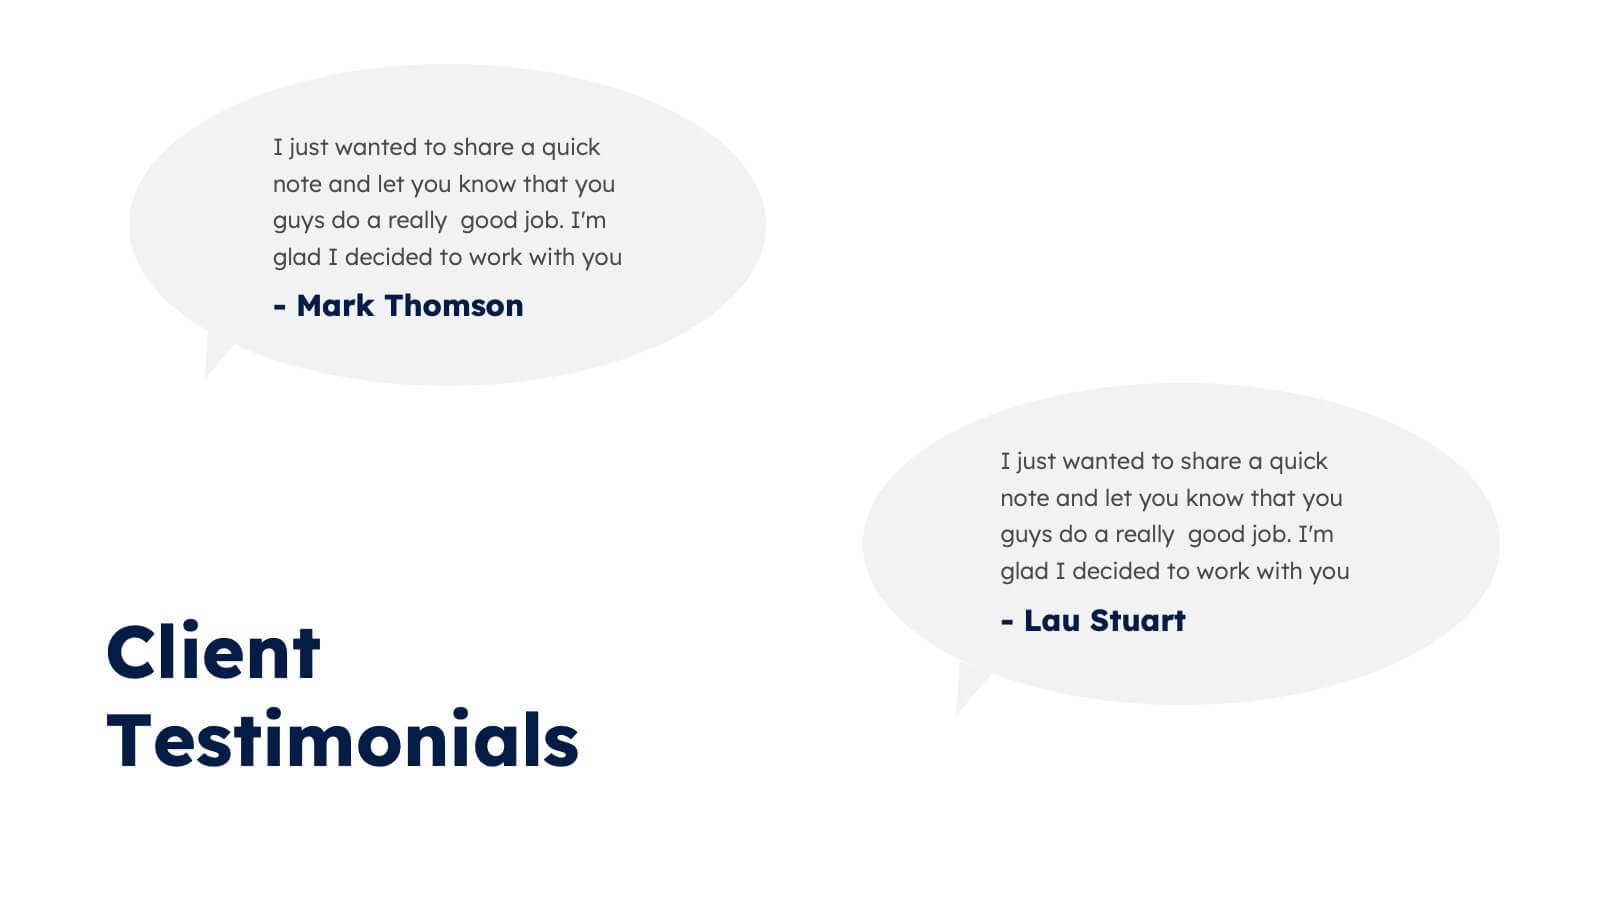
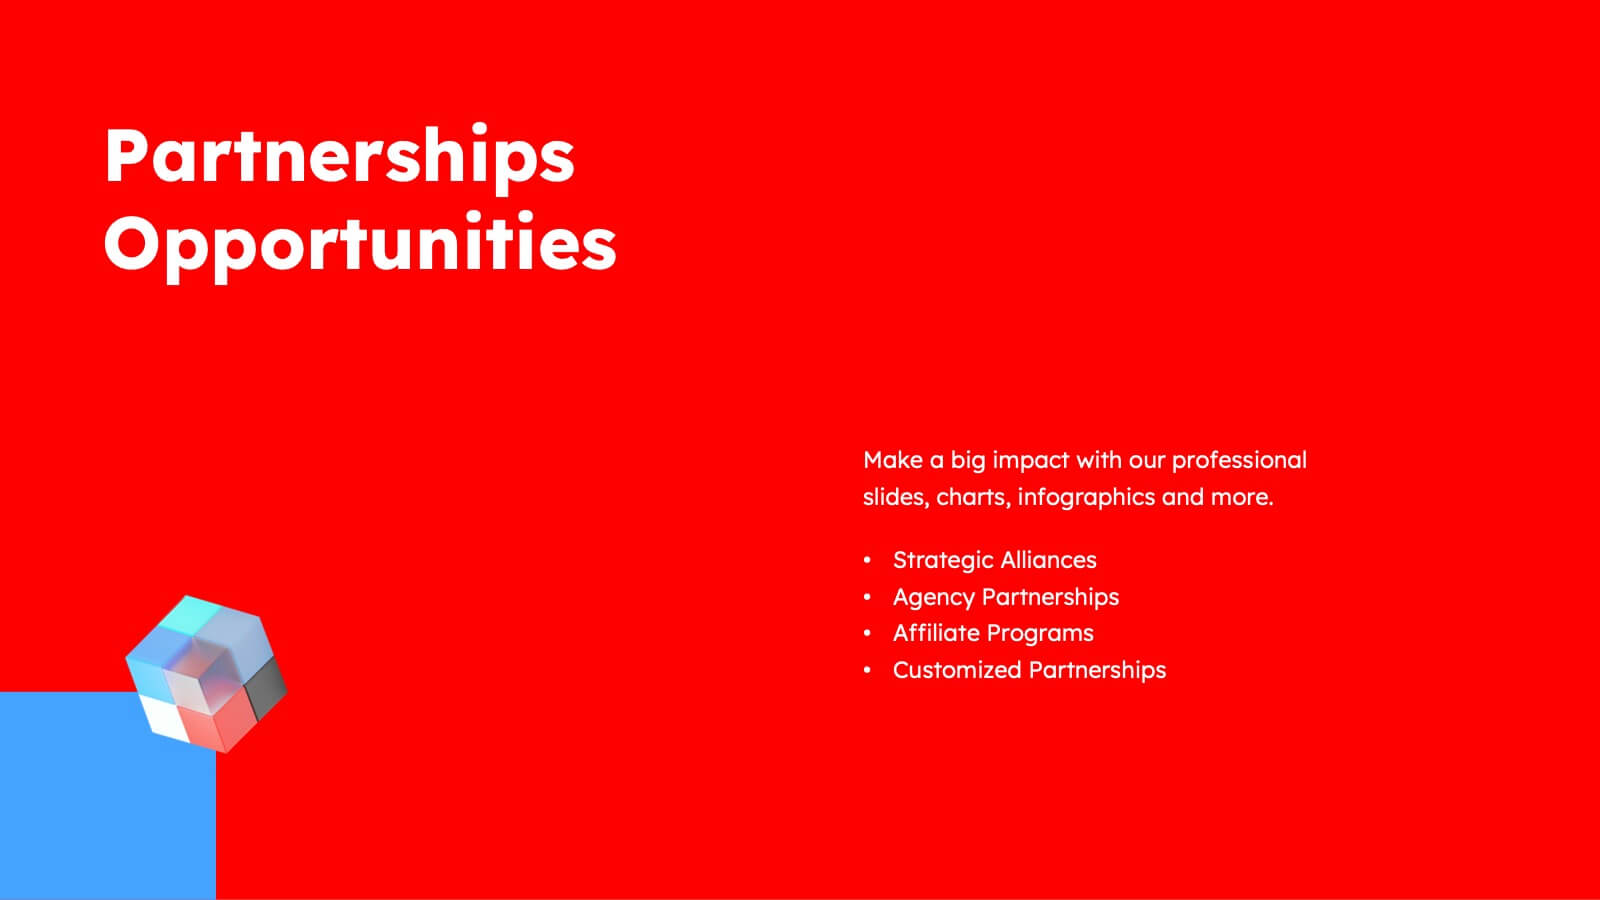
Marketing Team Infographic
This collection showcases a series of slides dedicated to optimizing marketing team operations and strategies. Each template is designed to cater to various facets of marketing planning and execution, featuring layouts that help articulate team roles, campaign timelines, budget allocations, and performance metrics. The slides incorporate diverse visual elements, such as hierarchical diagrams, flow charts, and graphs, to ensure complex information is accessible and engaging. Customizable color palettes and design elements allow for seamless integration into existing corporate branding, making these templates not only functional but also aesthetically aligned with company standards. Ideal for marketing strategy presentations, team meetings, and stakeholder briefings, these slides facilitate a comprehensive overview of marketing efforts, pinpointing achievements and areas for improvement. The adaptability of these templates makes them an essential tool for marketing professionals aiming to communicate effectively and drive results.


7 slides
SCRUM Master Infographic Presentation
A Scrum infographic provides an overview of all the key components of the Scrum framework and helps teams and individuals understand this powerful agile methodology. This Infographic template is fully editable and can be easily customized to reflect your business, company or organization. It’s a great way to present your ideas in a clear and efficient manner. Full of charts and diagrams, this template creates an impactful visual effect. The blue color scheme will help create a fresh look in your presentations. This template is designed for use in Powerpoint, Google Sheets or Keynote.


5 slides
Employee Training Needs Skills Gap Presentation
Optimize Workforce Training with a Skills Gap Analysis! The Employee Training Needs Skills Gap template helps HR teams, trainers, and managers visualize skill gaps, assess employee competencies, and align training programs with business goals. Featuring an interactive dot matrix layout, this template enables clear comparisons across skill areas, ensuring targeted and efficient upskilling strategies. Fully customizable in PowerPoint, Keynote, and Google Slides, it streamlines workforce development planning for maximum impact and growth.


6 slides
SWOT Analysis Matrix Infographic
This SWOT Analysis Matrix Infographic provides a visually compelling and straightforward framework for evaluating a company or project's Strengths, Weaknesses, Opportunities, and Threats. Its compatibility with PowerPoint, Google Slides, and Keynote ensures it is versatile for presentations. The design presents a balanced view of internal and external factors affecting decision-making and strategic planning. The template is user-friendly, allowing for easy customization to suit specific scenarios, educational purposes, or personal projects. This infographic is ideal for business analysts, students, and anyone looking to present a complete SWOT analysis in a concise and attractive format.


4 slides
Marketing SWOT Assessment Presentation
Analyze your brand’s position with this colorful Marketing SWOT Assessment layout. Clearly outline strengths, weaknesses, opportunities, and threats in a column format, perfect for client reports or strategy sessions. Fully customizable in PowerPoint, Keynote, and Google Slides—ideal for marketers seeking clarity, structure, and visual impact in every presentation.


6 slides
Business Framework Strategy Presentation
Dive into strategic planning with our Business Framework Strategy presentation template. This design brilliantly visualizes the essentials of business frameworks, guiding users through critical insights with a visually appealing, color-coded process. Ideal for strategists and planners, it offers a streamlined way to present complex information effectively. Compatible with PowerPoint, Keynote, and Google Slides, this template is a versatile tool for delivering impactful business strategies.


21 slides
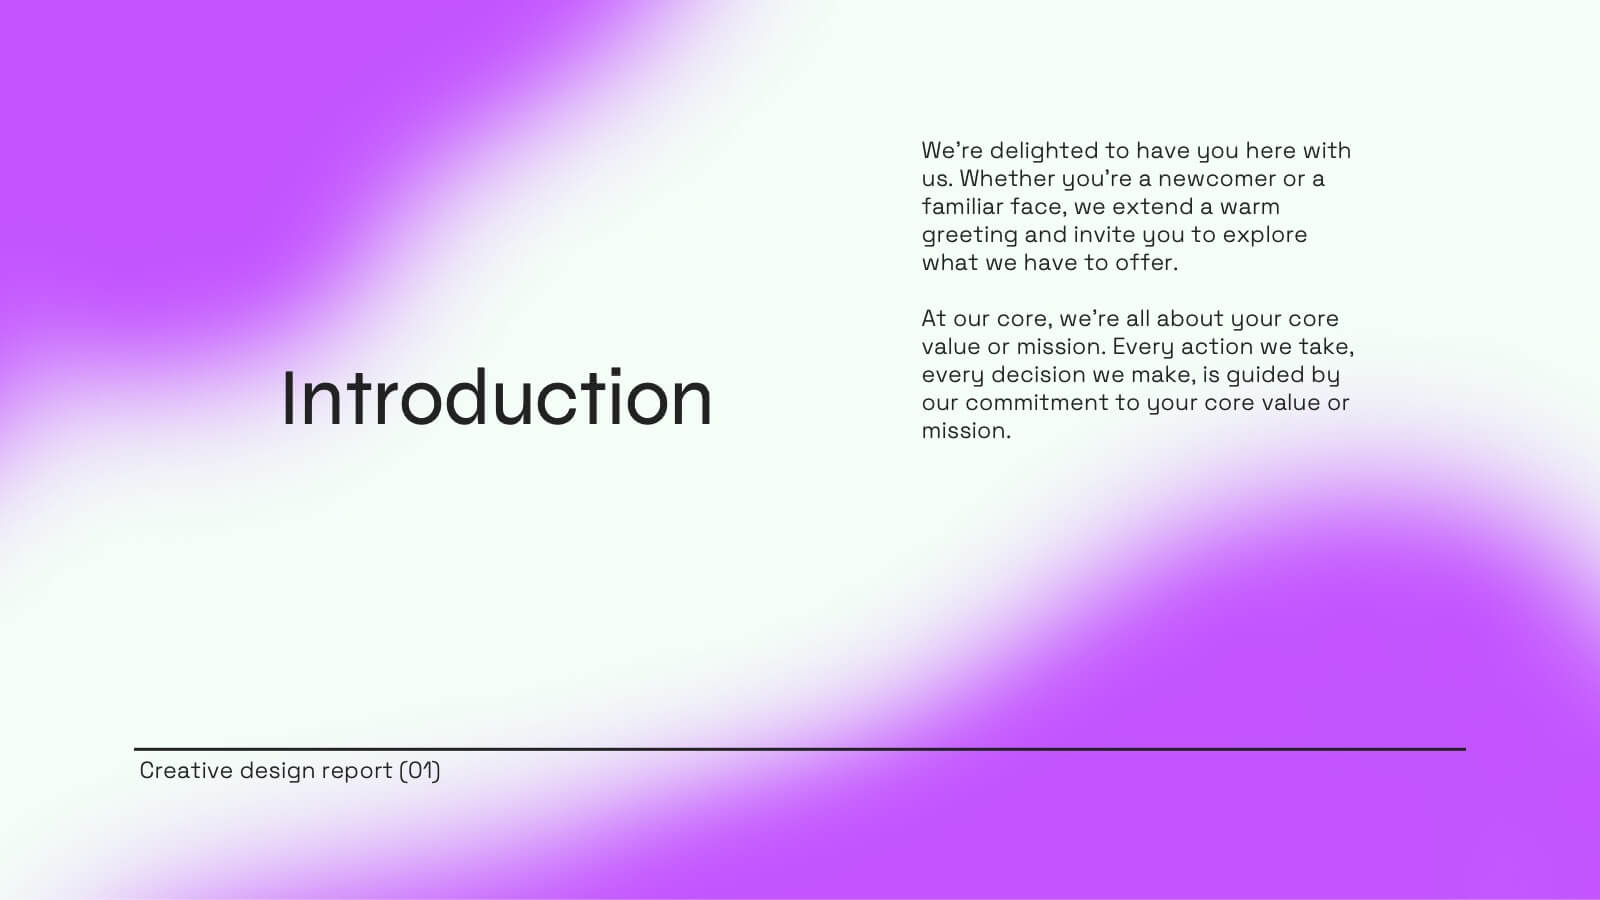
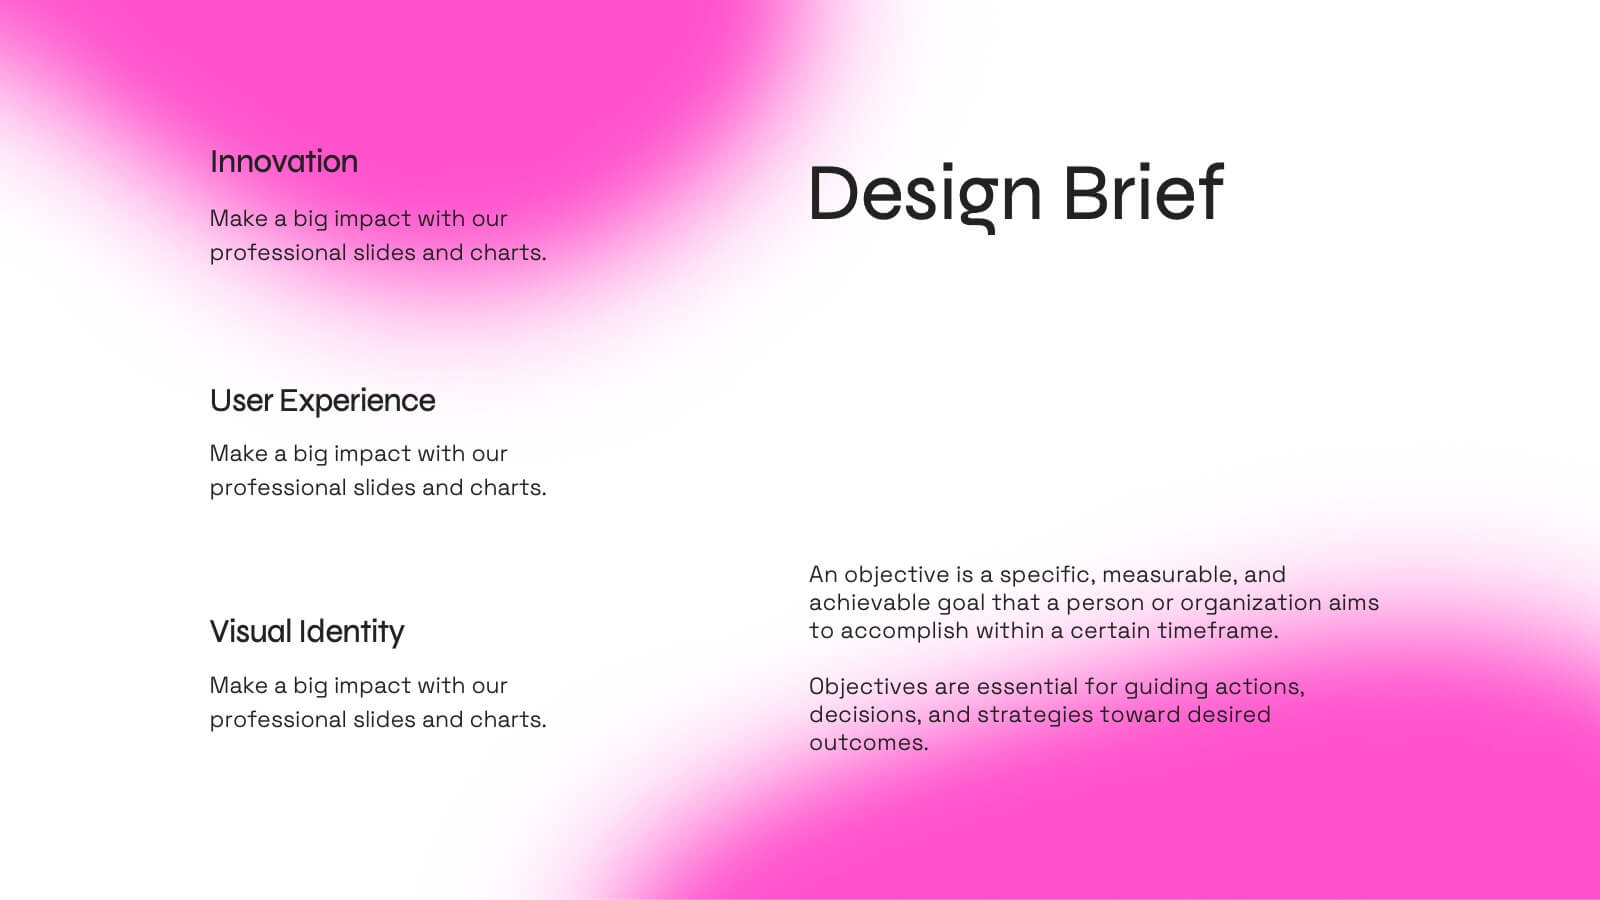
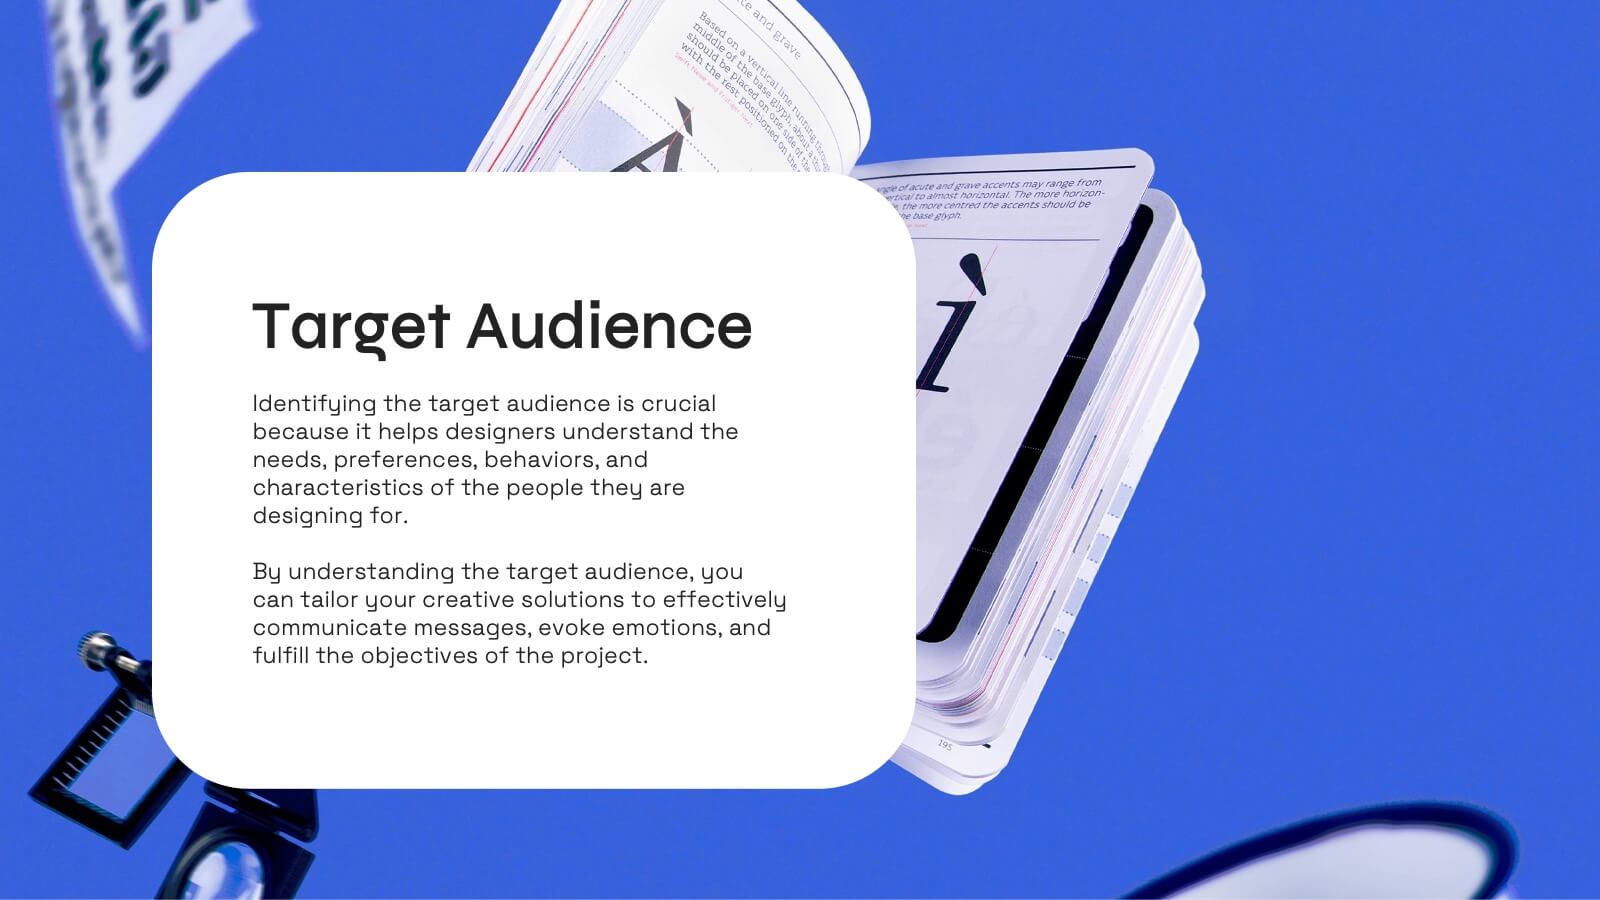
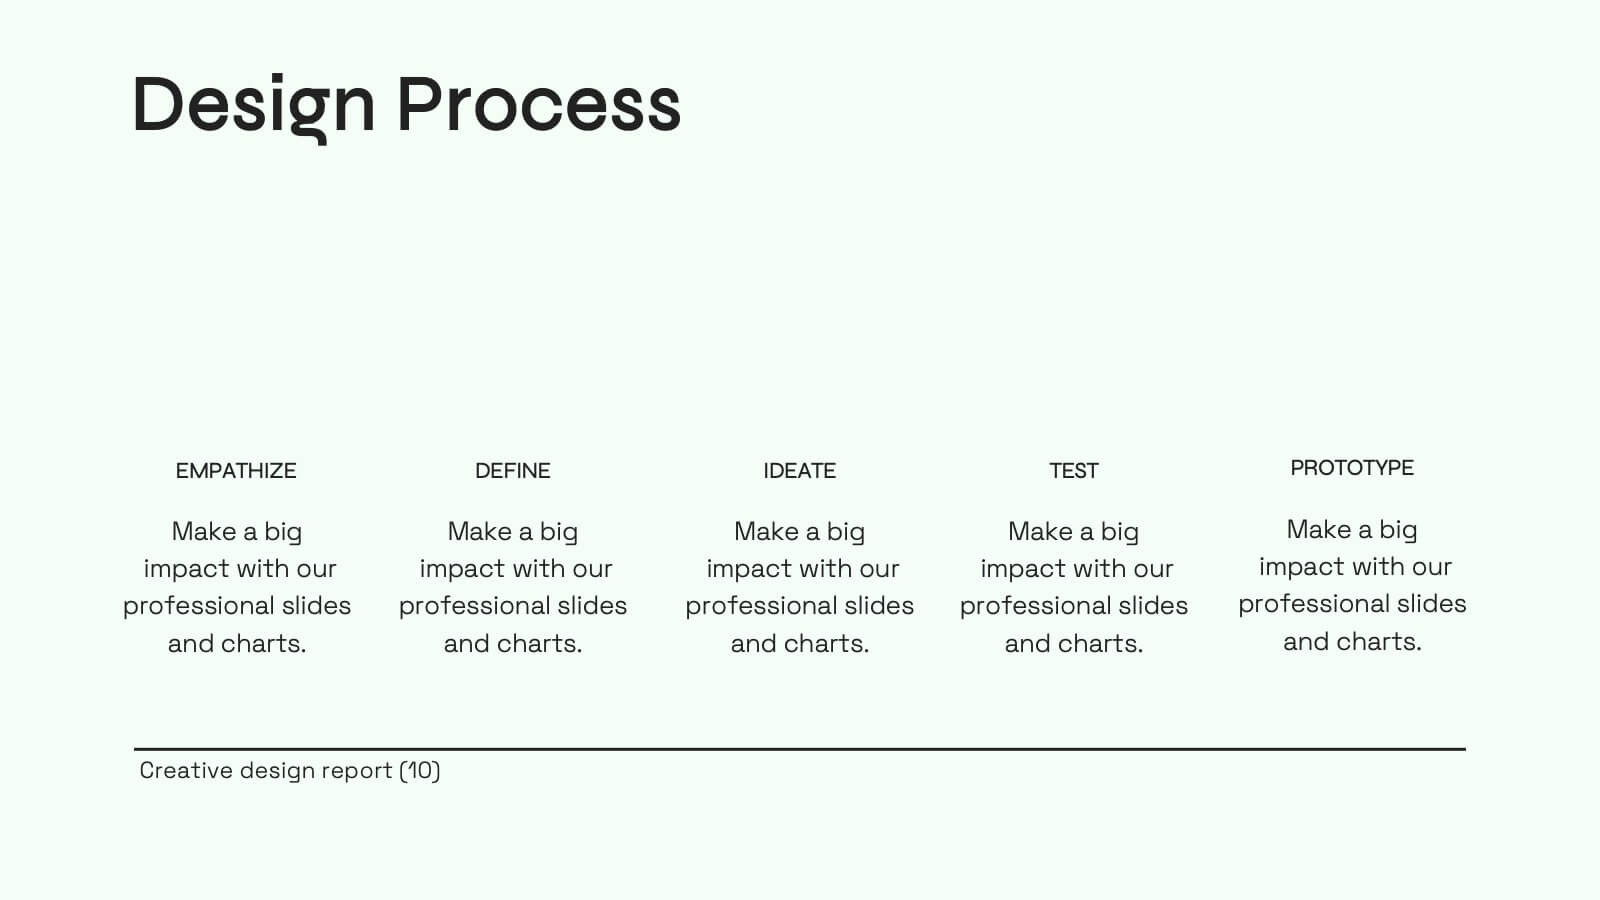
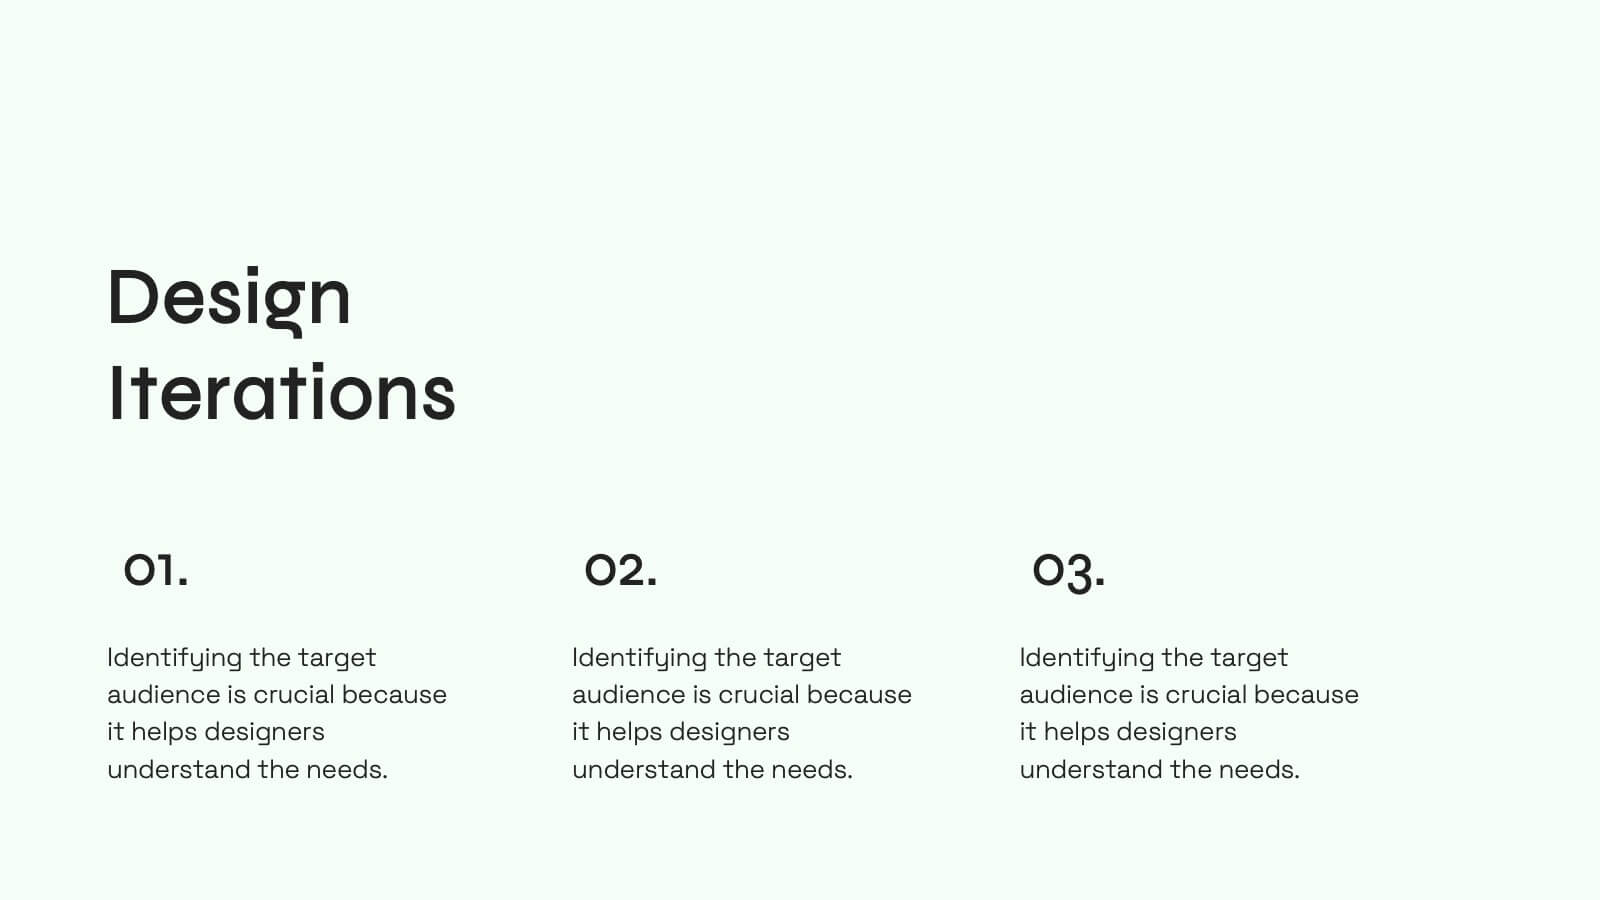
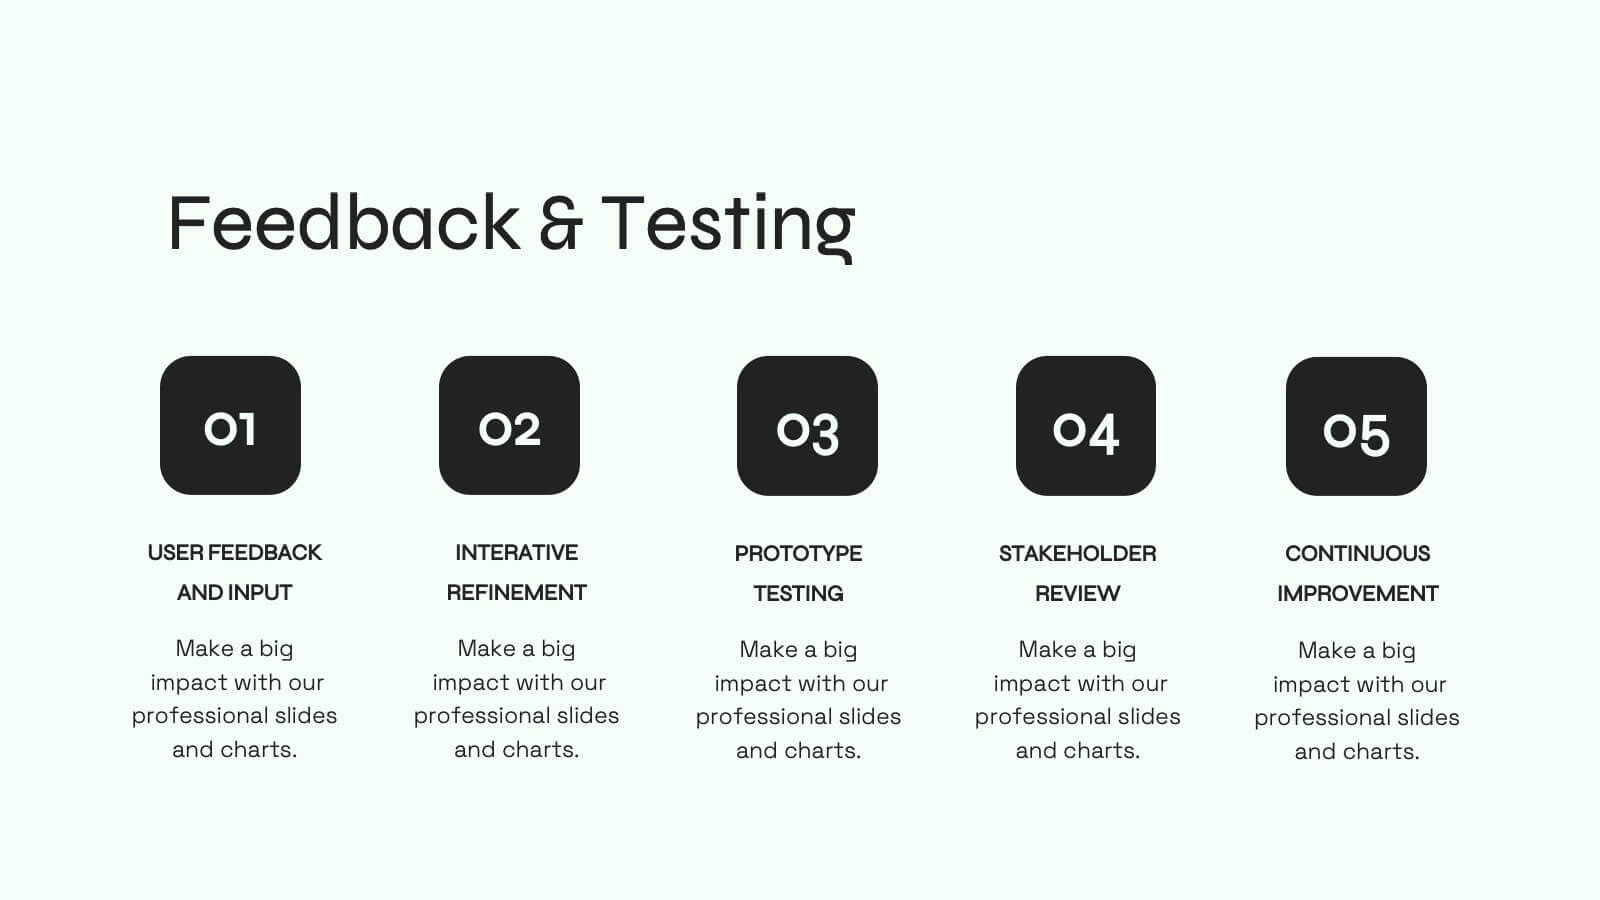
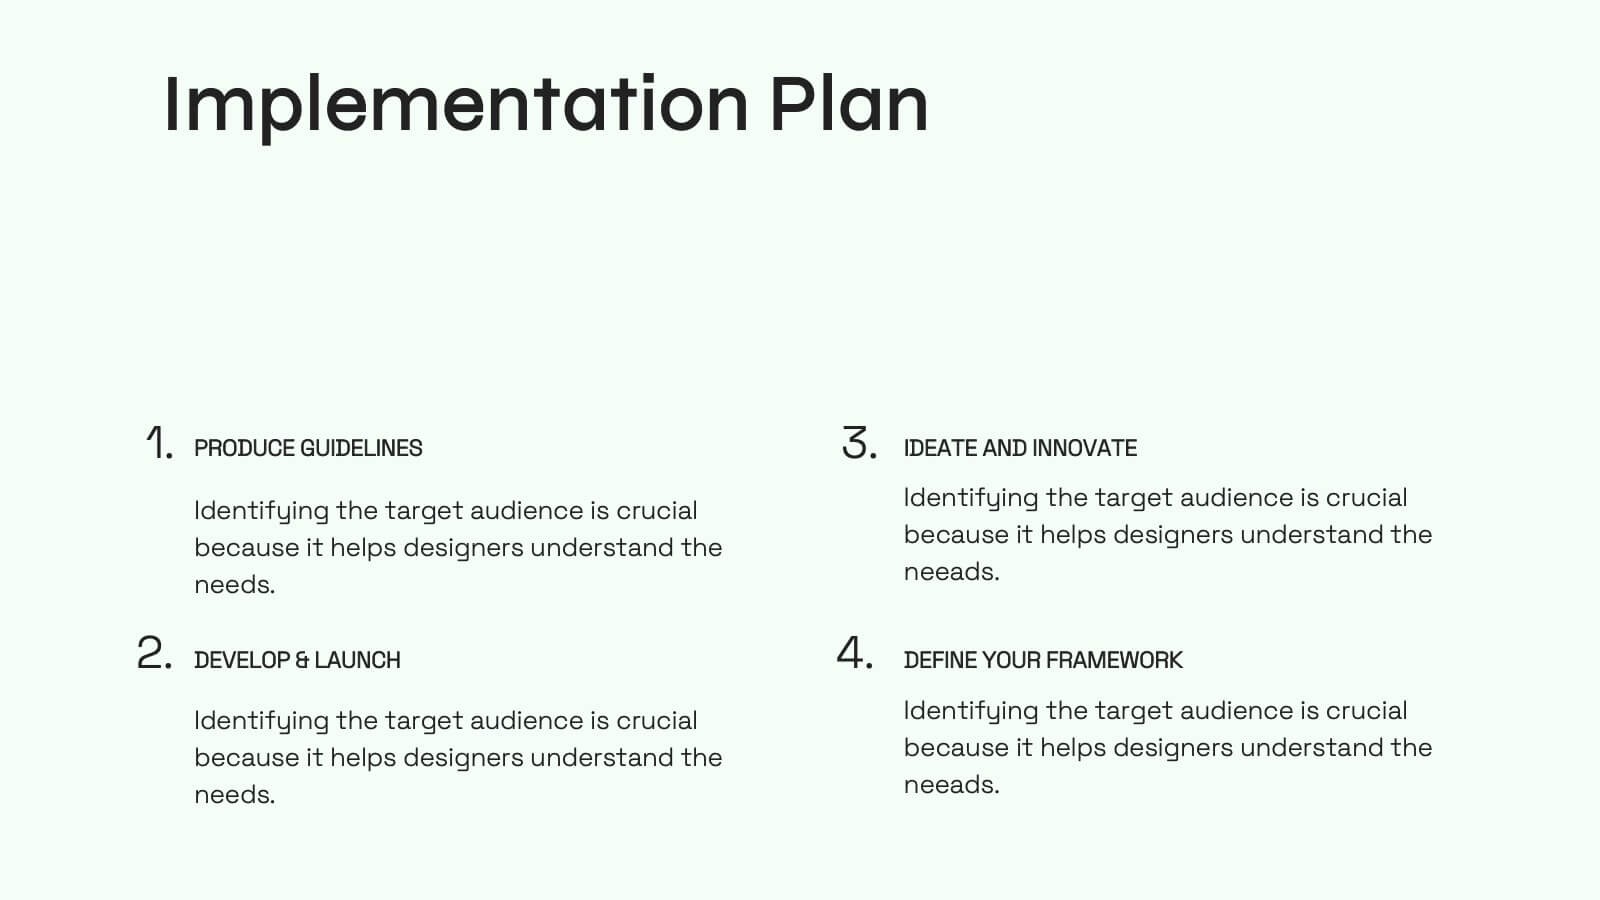
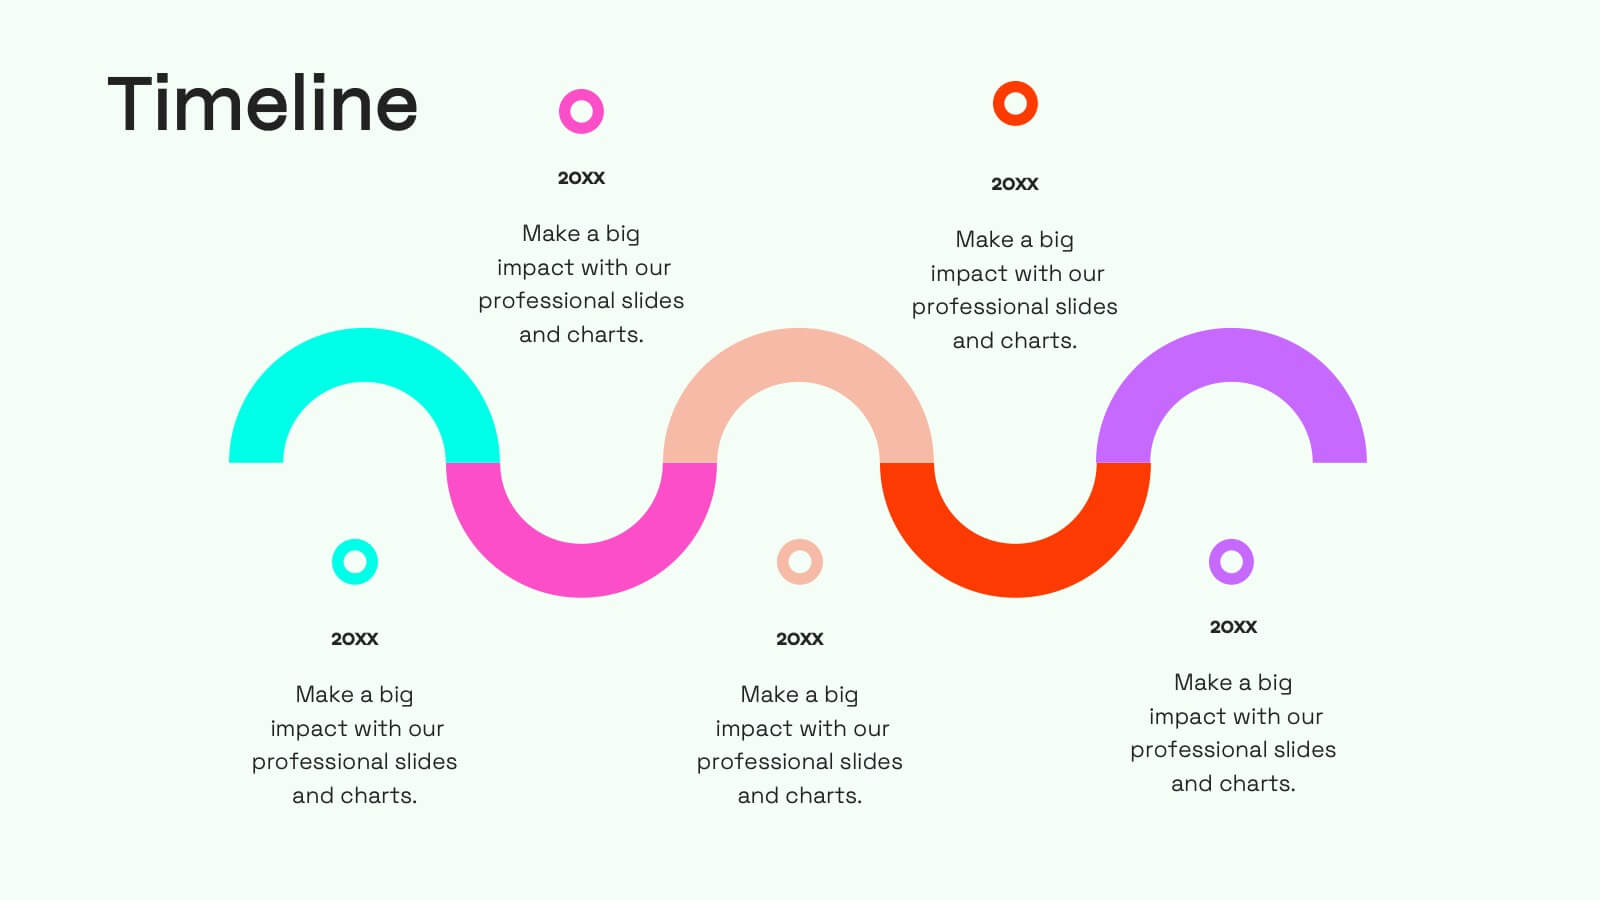
Jade Creative Design Report Presentation
Transform your design report into a captivating visual experience with this elegant jade-themed presentation template! Ideal for showcasing your creative projects, it effectively highlights key concepts, methodologies, and outcomes in a polished format. With its striking design, your work will impress clients and stakeholders alike. Compatible with PowerPoint, Keynote, and Google Slides.