


Features
- 5 Unique slides
- Fully editable and easy to edit in Microsoft Powerpoint, Keynote and Google Slides
- 16:9 widescreen layout
- Clean and professional designs
- Export to JPG, PDF or send by email


Do you have any questions?
Recommend


5 slides
User Experience Survey Findings Presentation
Present key insights from your user research in a clean and impactful way with this survey findings slide. Designed to highlight percentages and categories clearly, it helps your audience quickly understand what users value most. Ideal for UX reports and product feedback reviews. Fully compatible with PowerPoint, Keynote, and Google Slides.


6 slides
Strategic Planning with OKRs
Align your business strategy with measurable outcomes using this OKR-based planning slide. Highlight objectives, key activities, and results alongside a clear problem-solution structure. Perfect for strategy sessions and team planning meetings. Fully editable in PowerPoint, Keynote, and Google Slides.


6 slides
Oceania Language Map Infographic
Oceania encompasses the entirety of the Pacific Ocean and its islands. Embark on an enlightening journey through the linguistic tapestry of Oceania with our captivating Oceania Language Map Infographic. This template is your guide to understanding the rich array of languages spoken across this diverse and cultural region. Compatible with Powerpoint, Keynote, and Google Slides. This allows you to incorporate a vibrant and culturally symbolic color palette reflecting the diversity of Oceania. Utilize icons representing different languages for a visually appealing representation.


20 slides
Victoria Design Strategy Proposal Presentation
This design strategy proposal template, crafted with a soft, modern aesthetic, offers a comprehensive layout for presenting design elements, processes, and deliverables. Each slide provides a clean, structured approach to showcase your brand’s design brief, target audience, color palette, typography, mood board, and project timeline. Perfect for designers and agencies, it supports PowerPoint, Keynote, and Google Slides for versatile use.


7 slides
Blue Ocean Summary Infographic
Blue Ocean Strategy encourages businesses to innovate in ways that stand out in the market, often by challenging traditional assumptions and industry norms. This infographic template is a bold, dynamic visual tool designed to chart unexplored territories and navigate the strategic depths of blue ocean thinking. Dive into this infographic to discover a world of untapped opportunities and unlock the keys to innovation and market success. Compatible with Powerpoint, Keynote, and Google Slides. Prepare to conquer new market territories, leave competition in your wake, and sail towards uncharted success with our Blue Ocean Summary Infographic.

20 slides
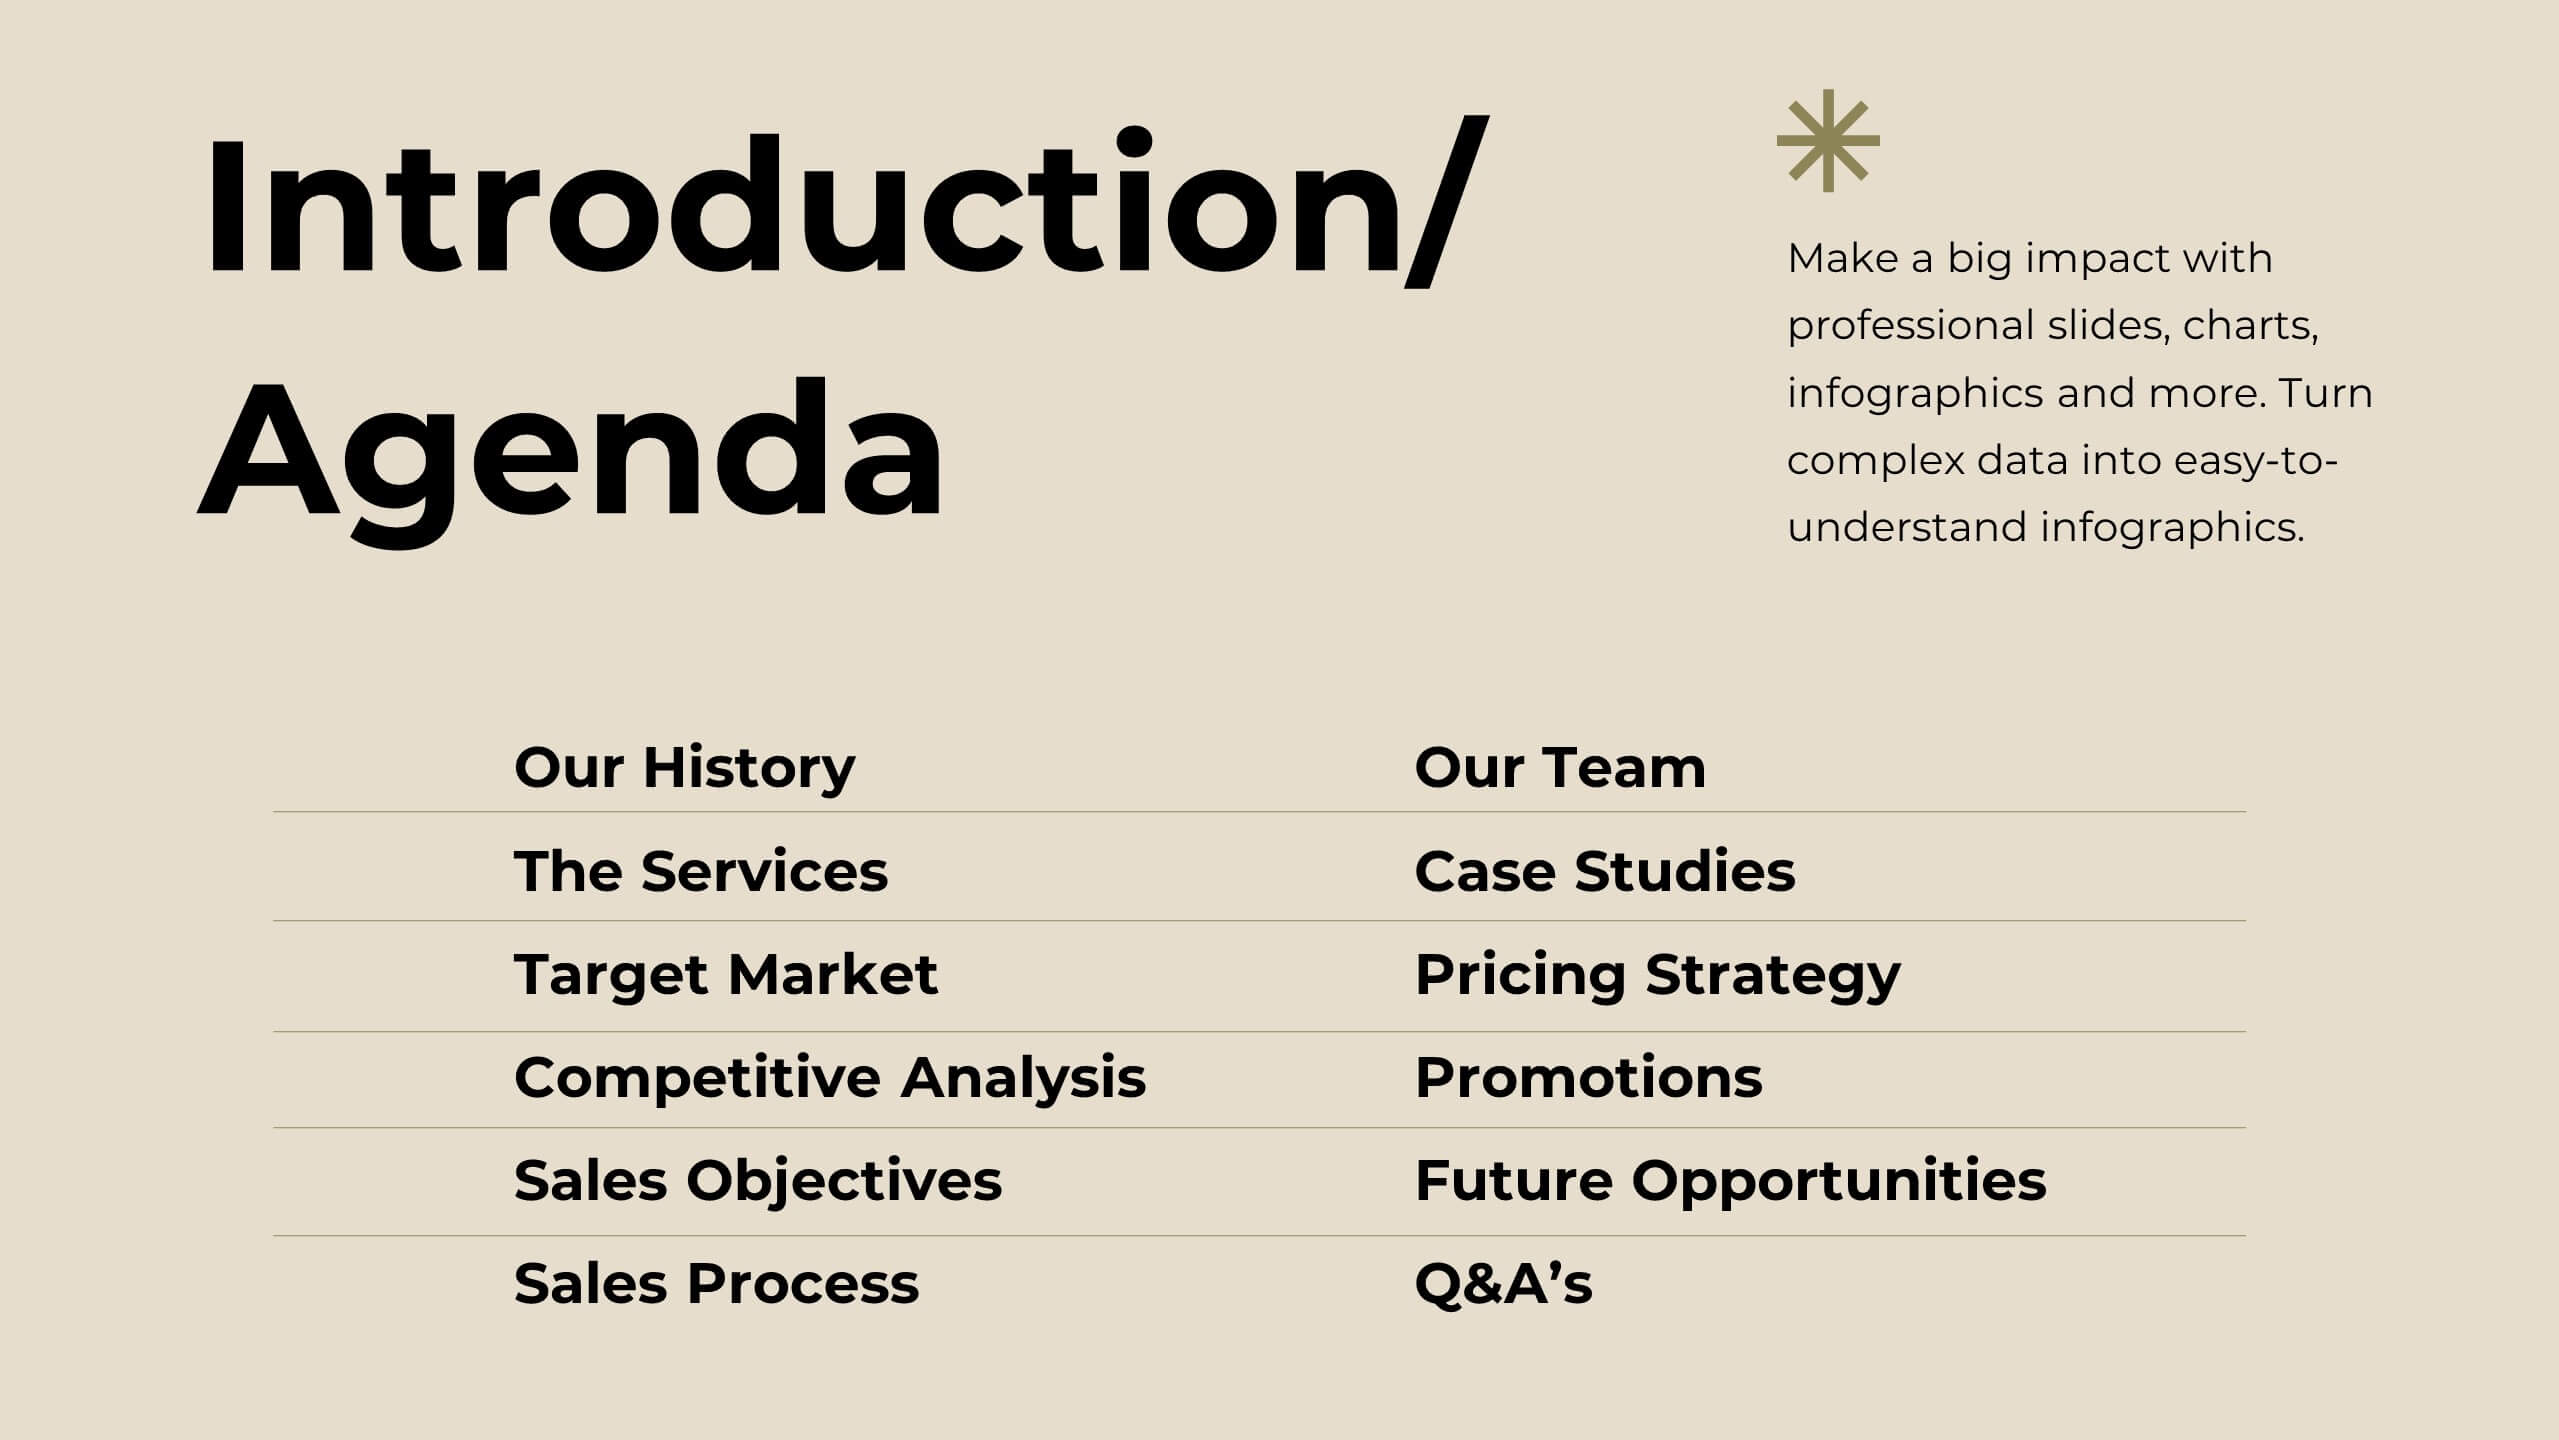
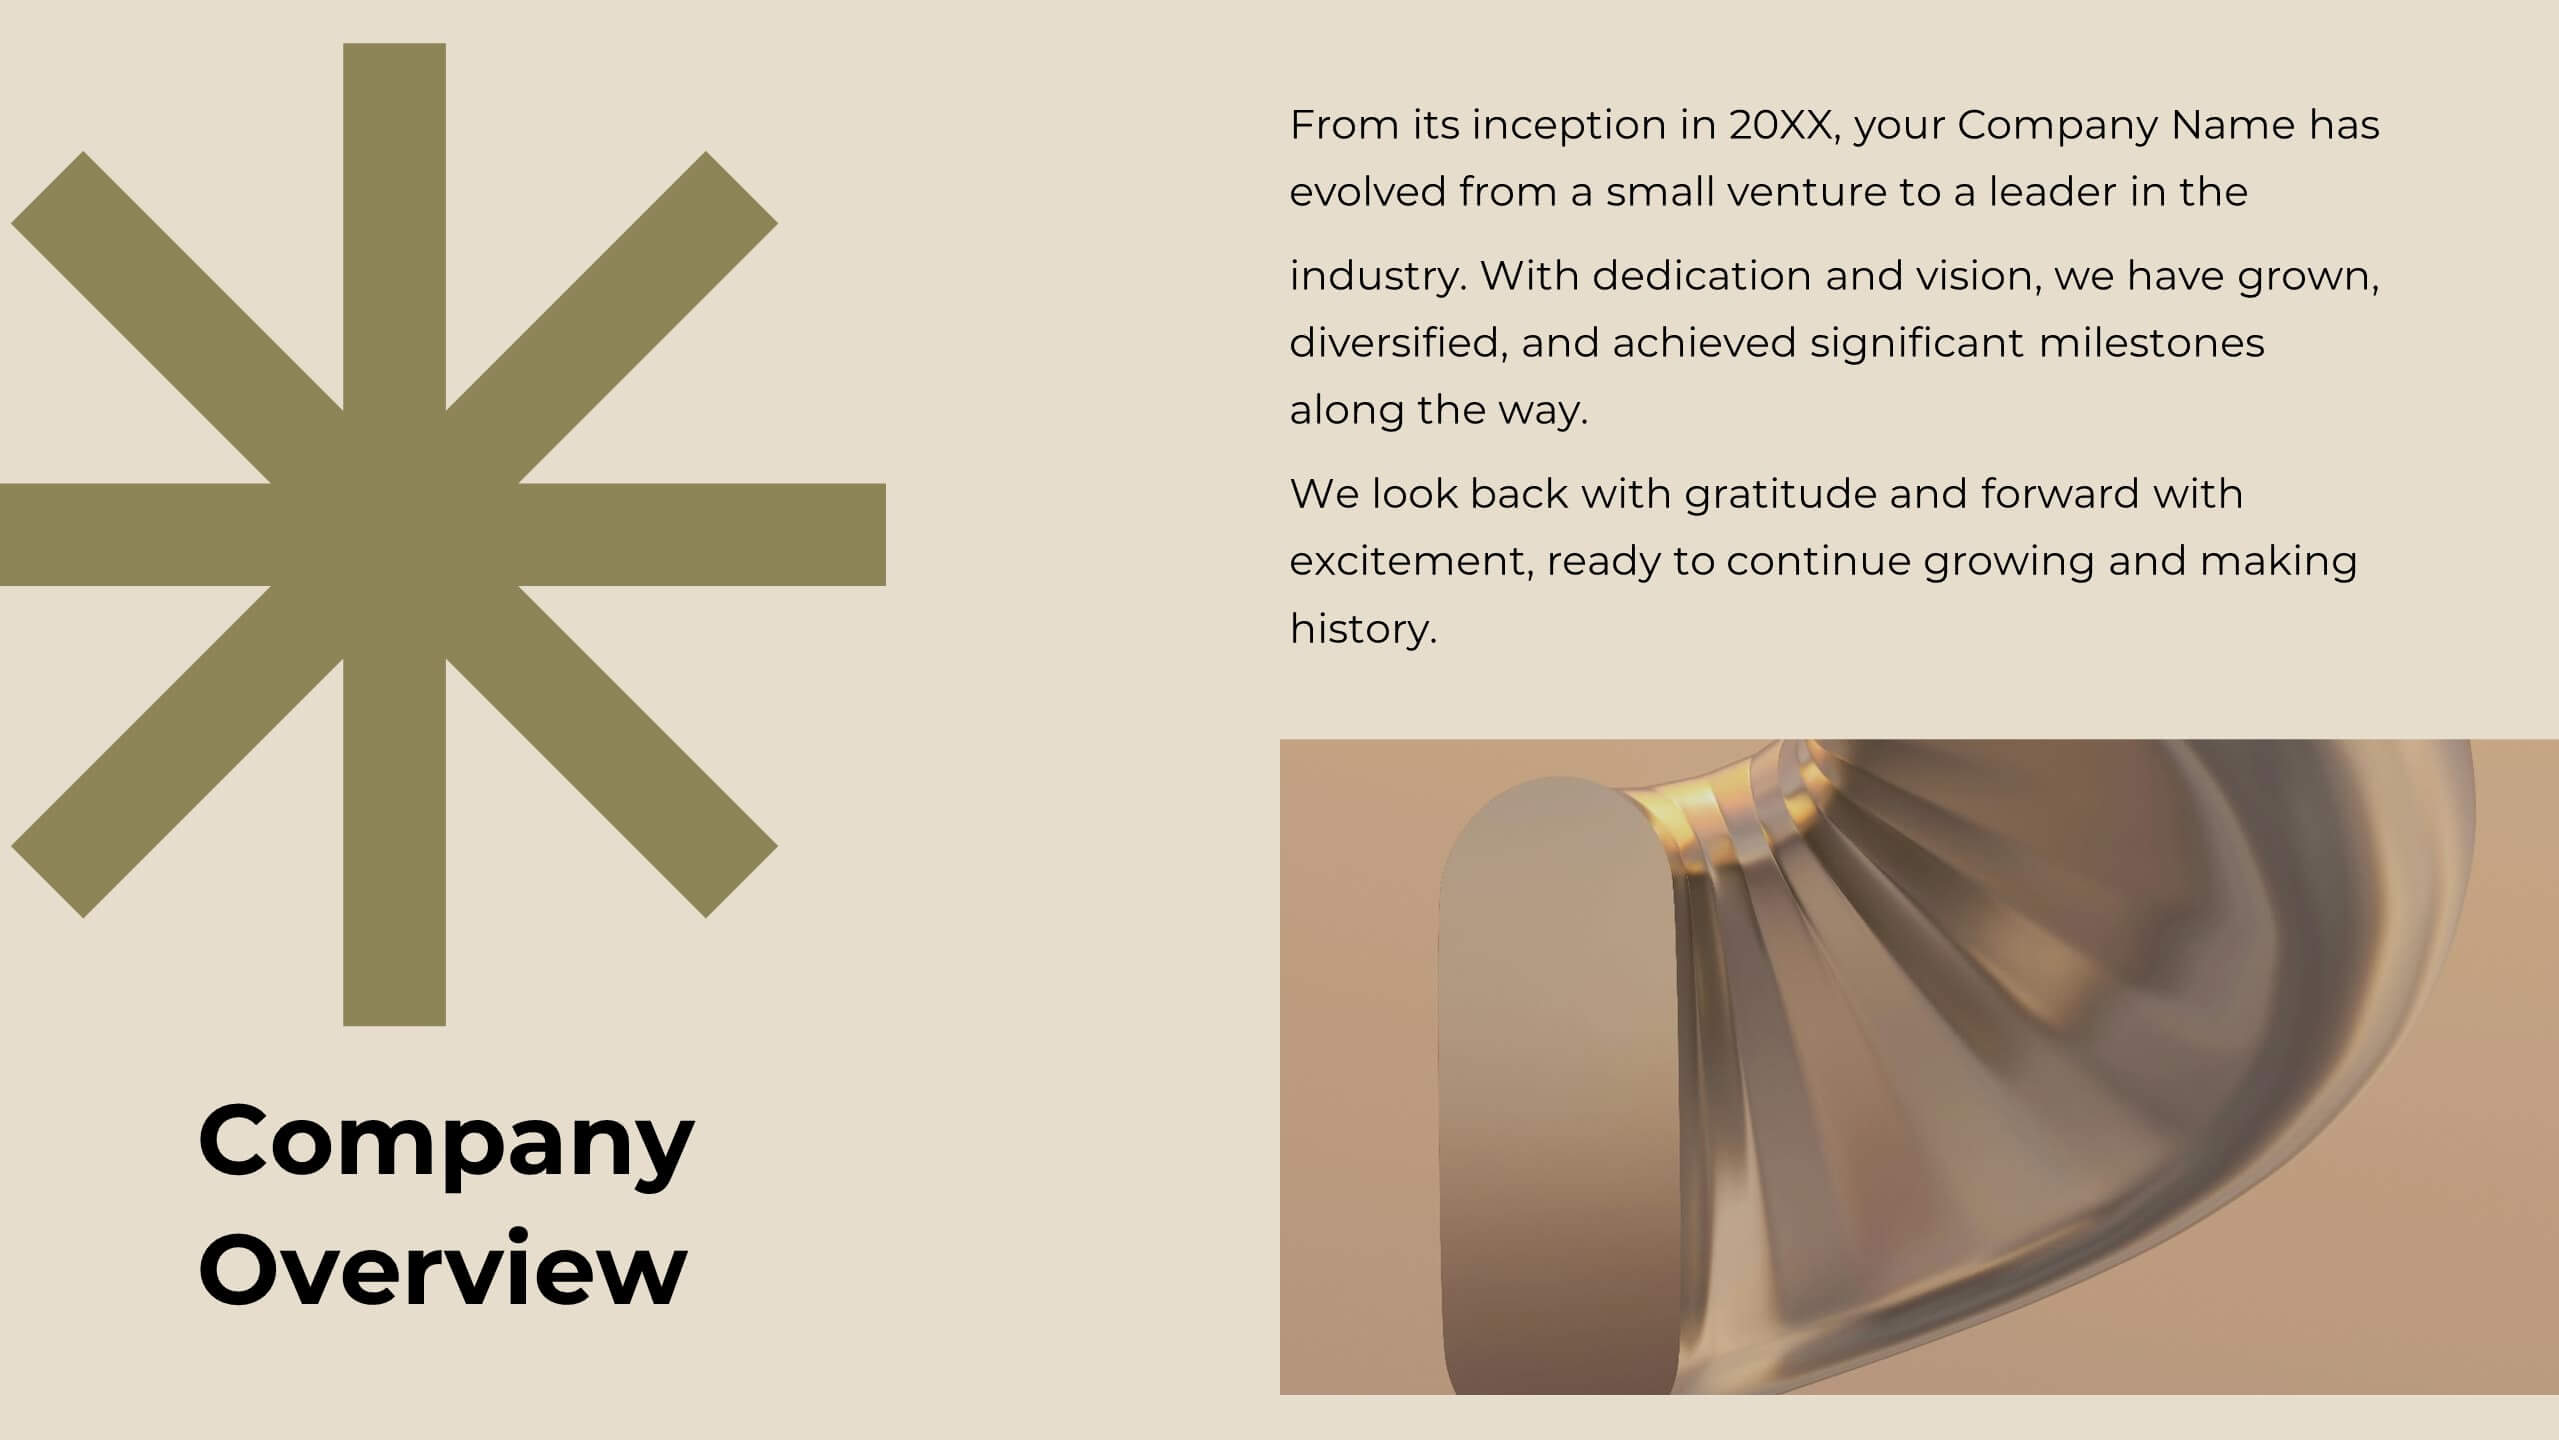
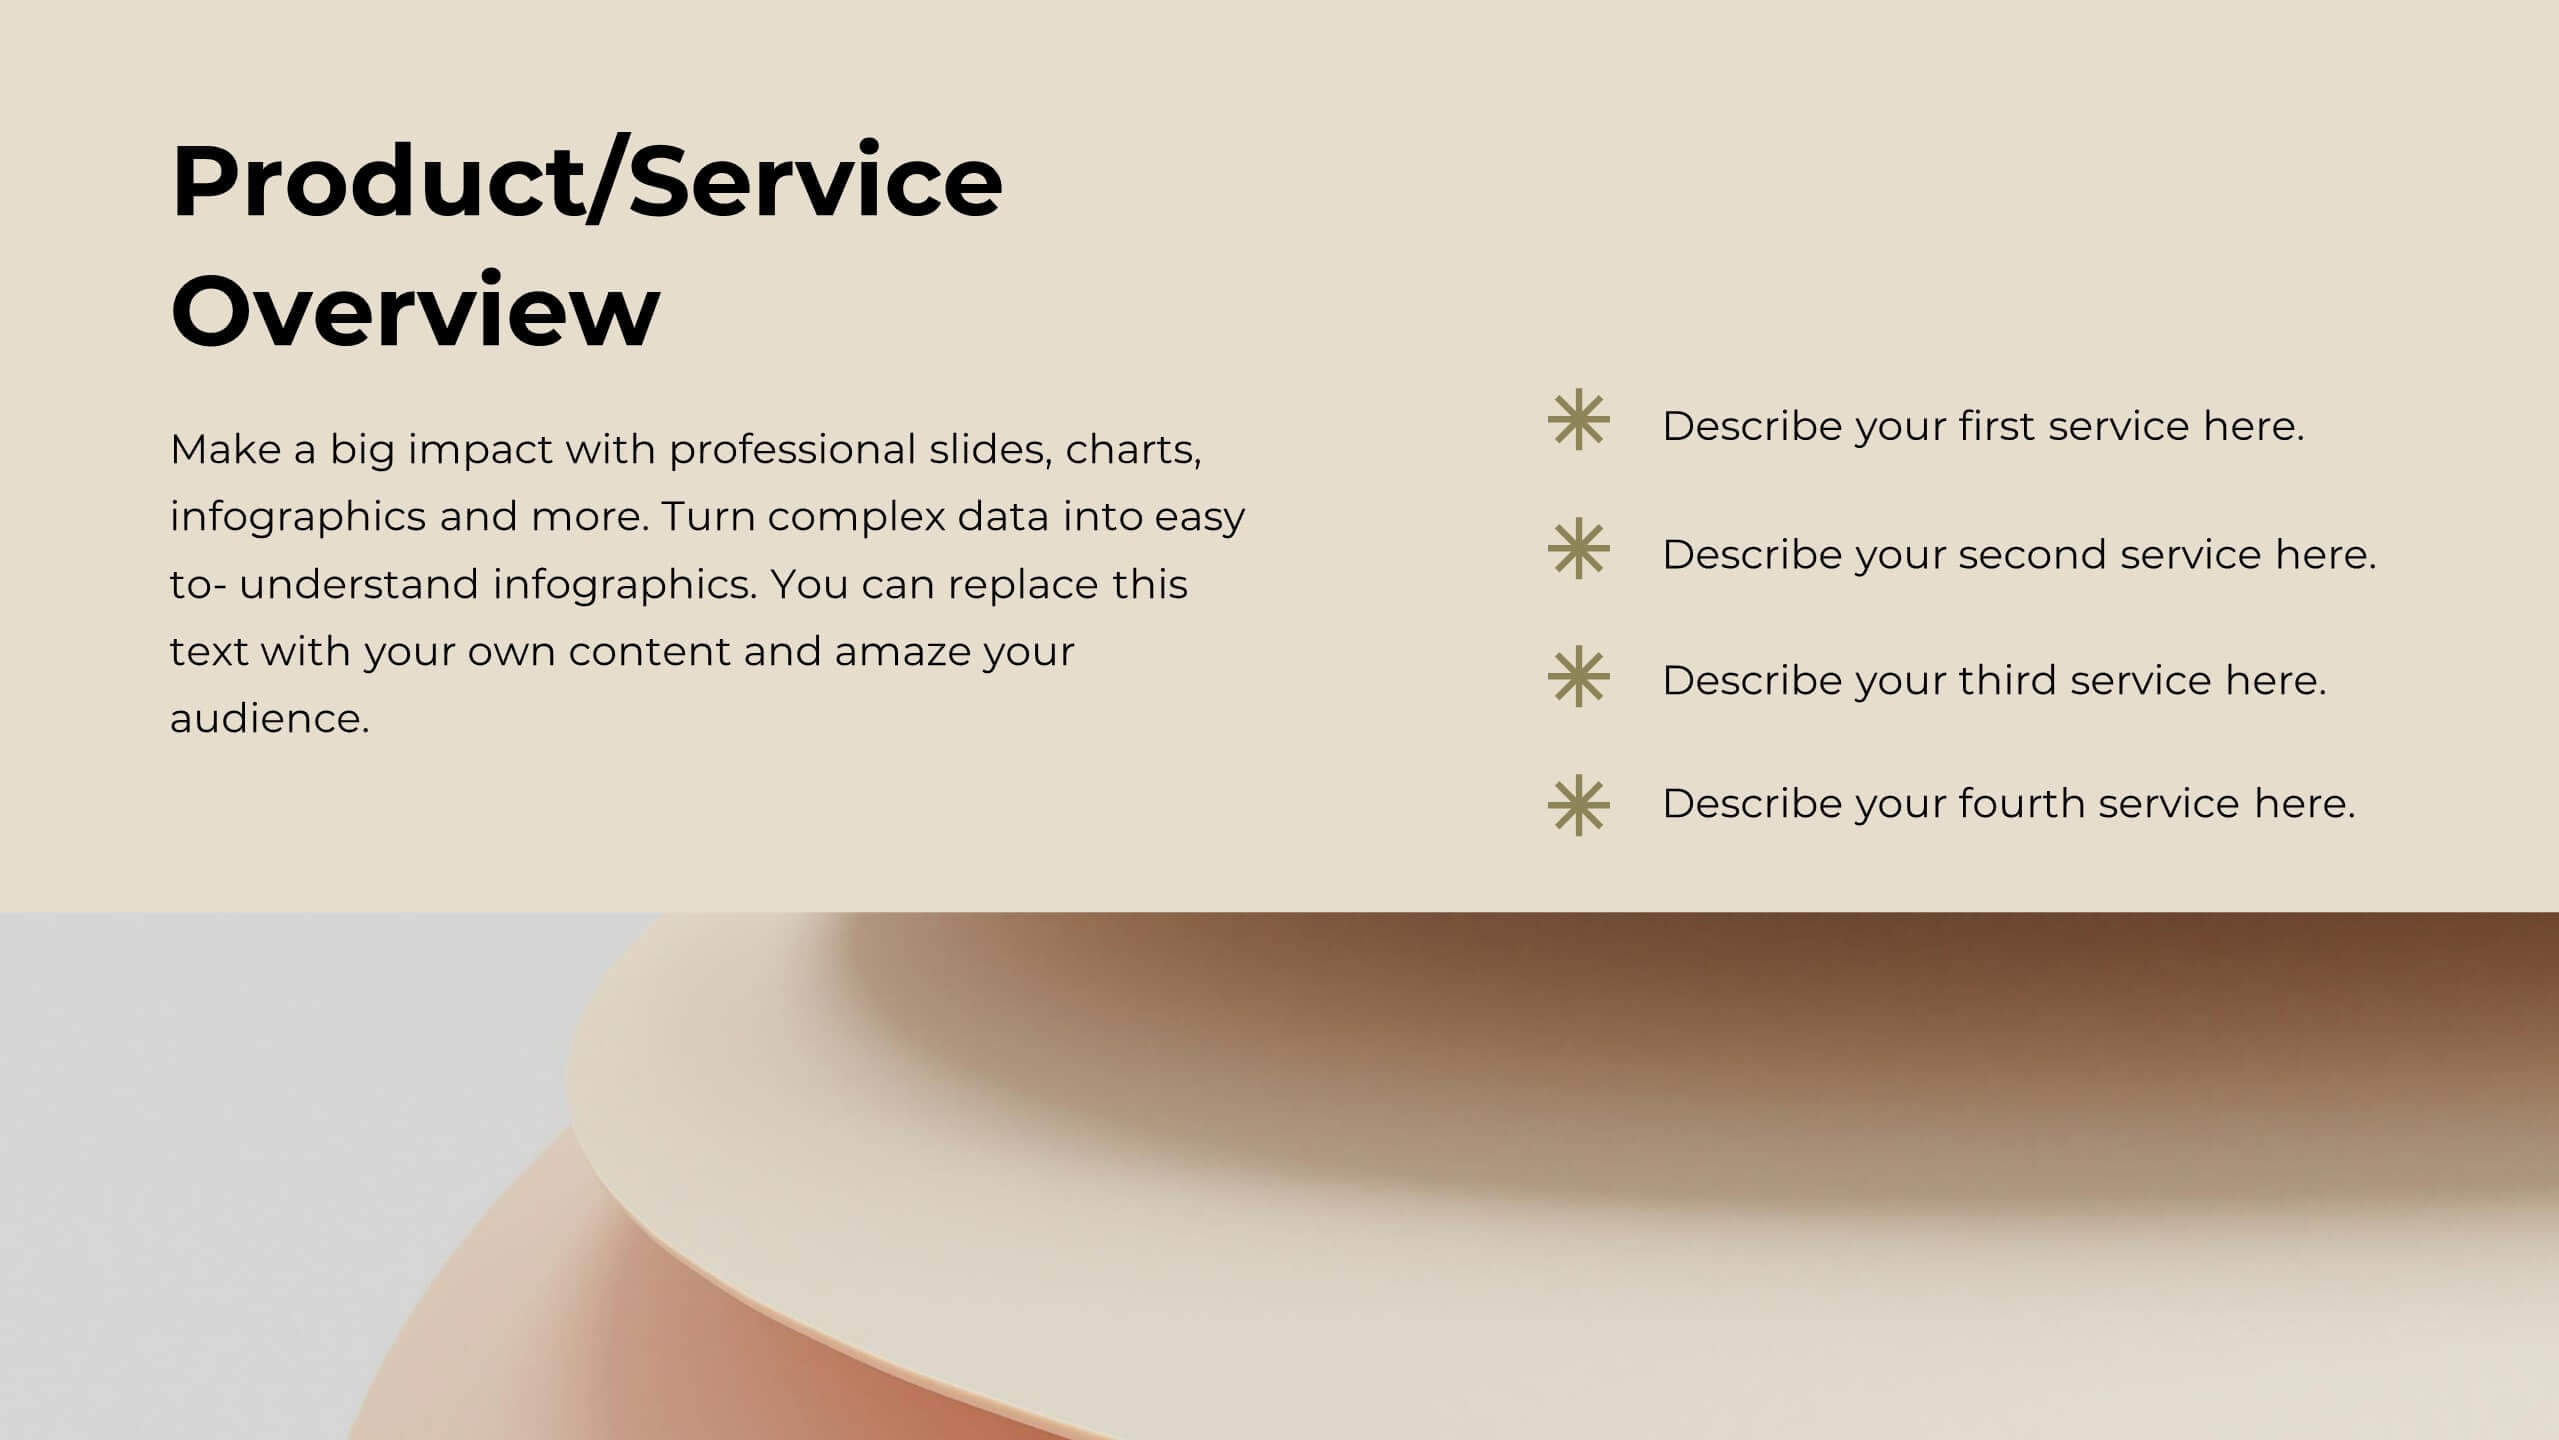
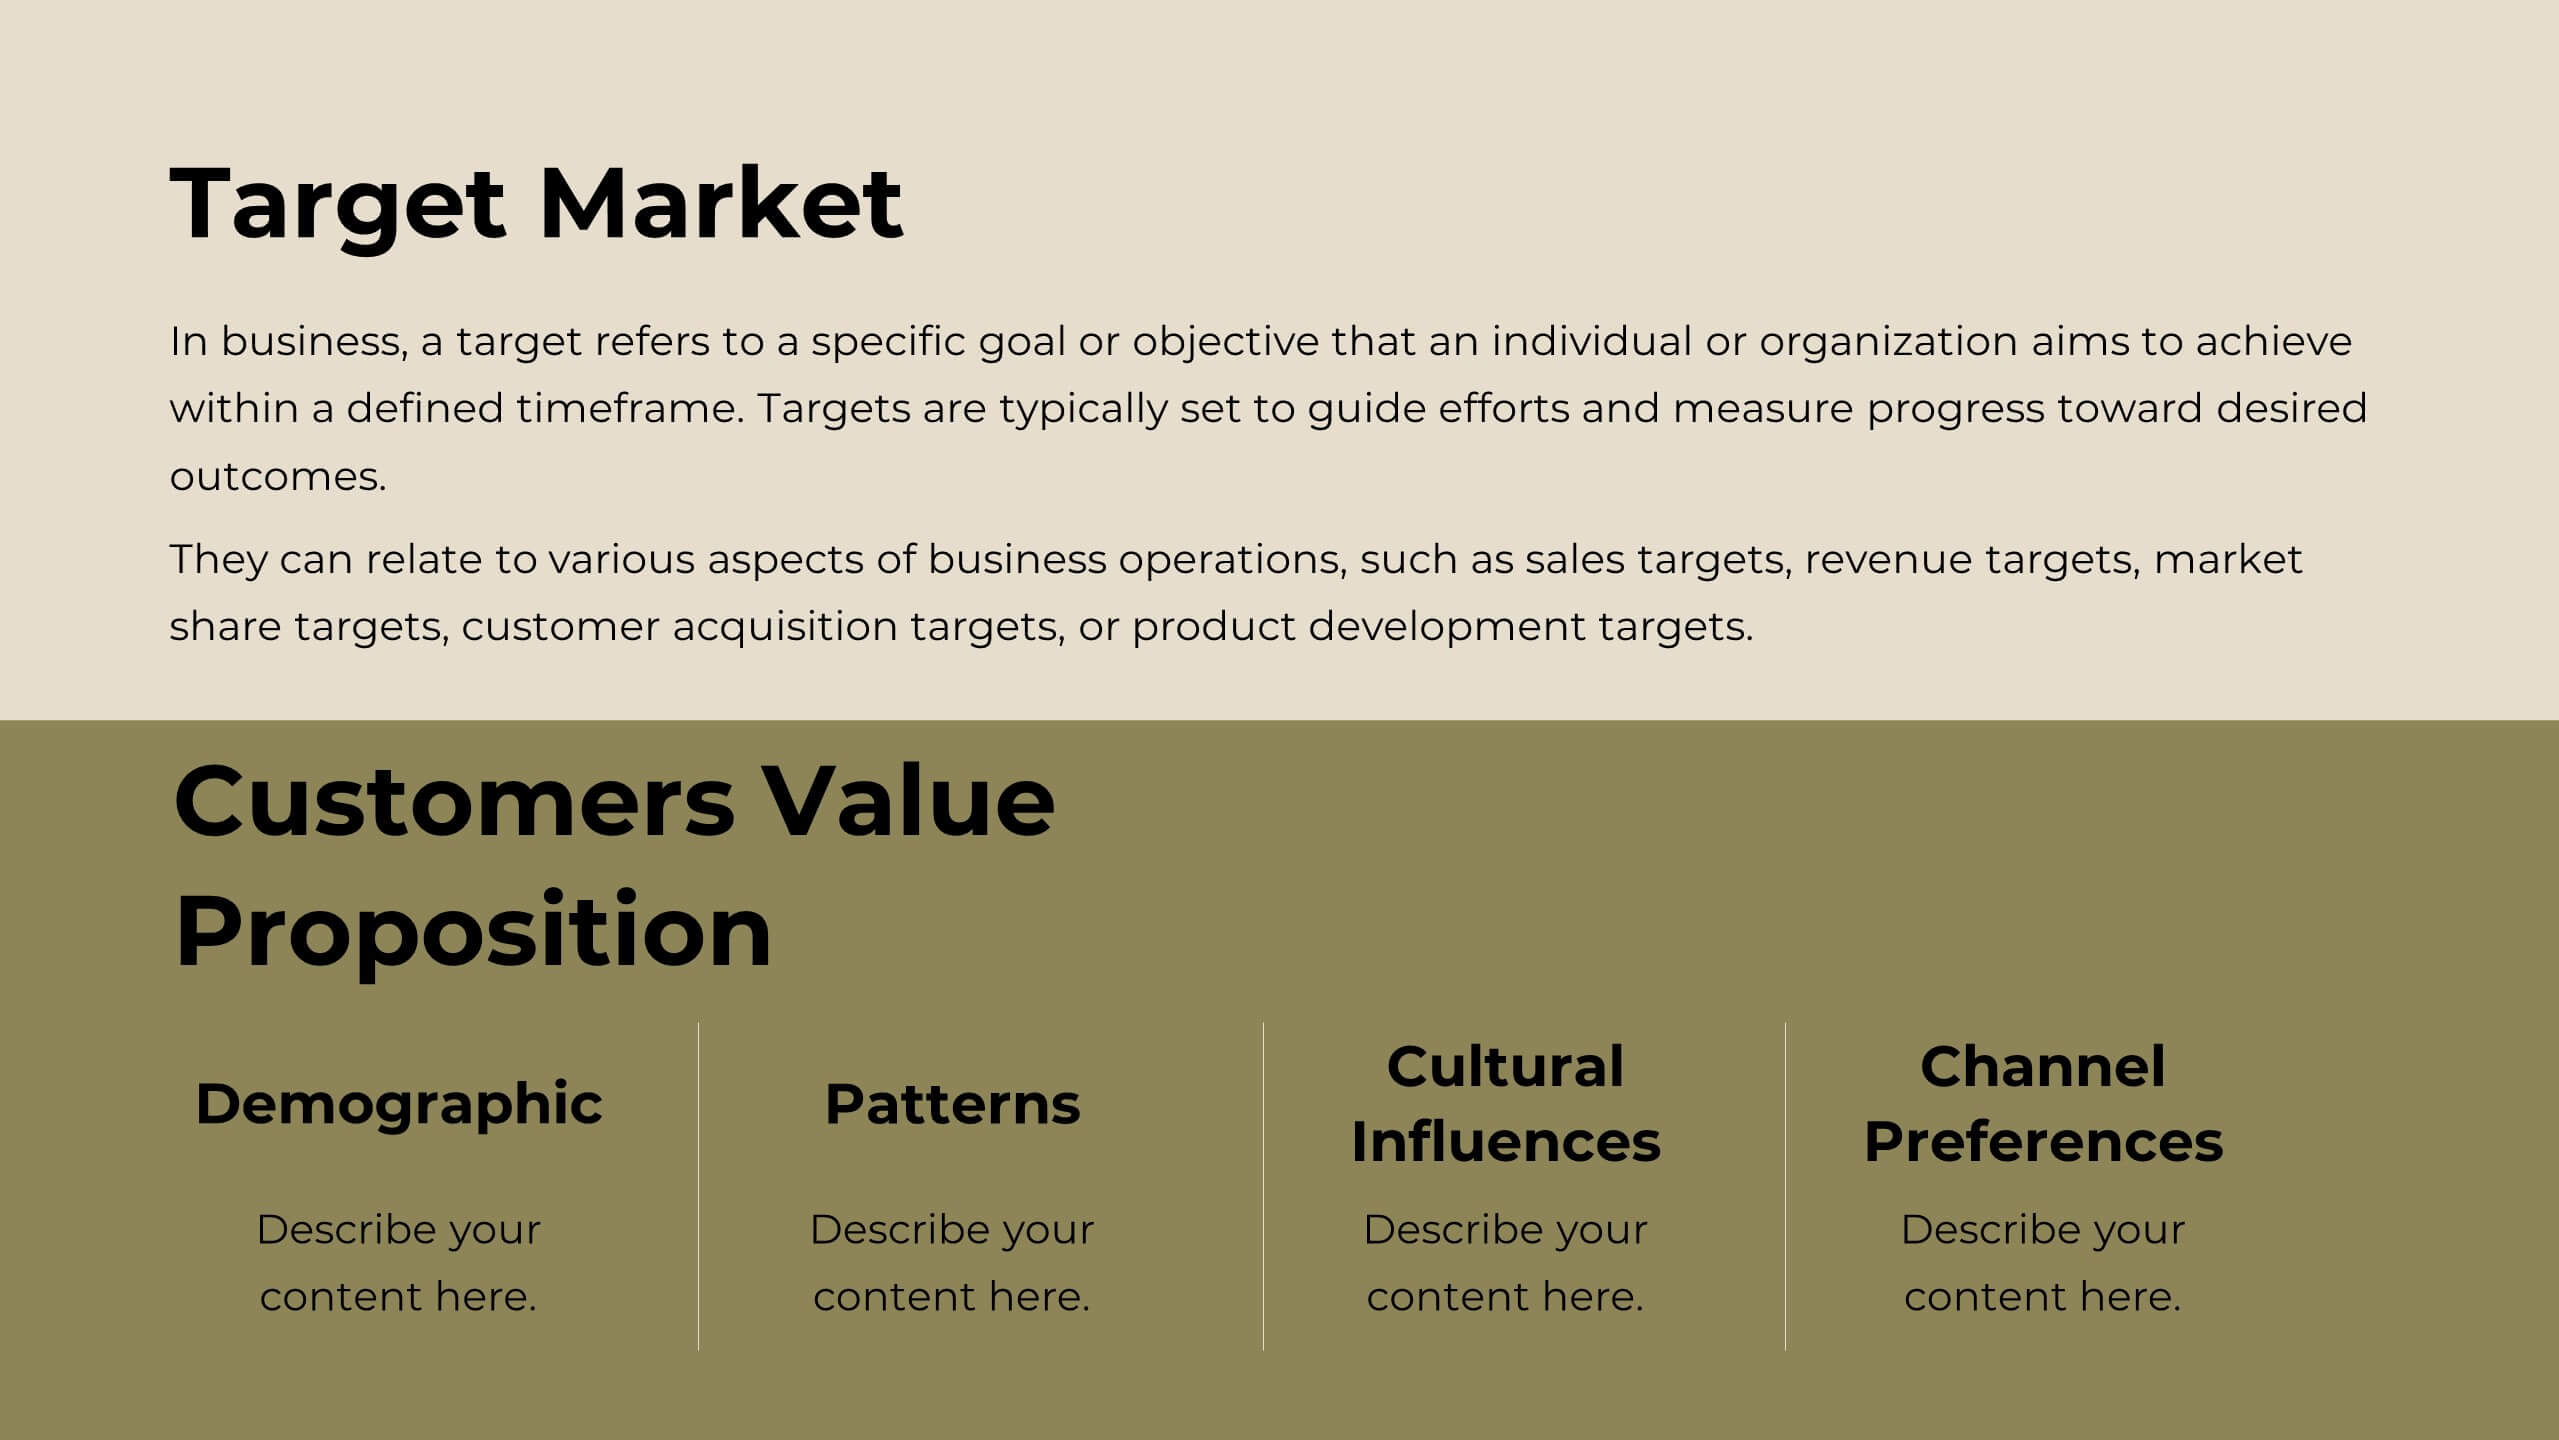
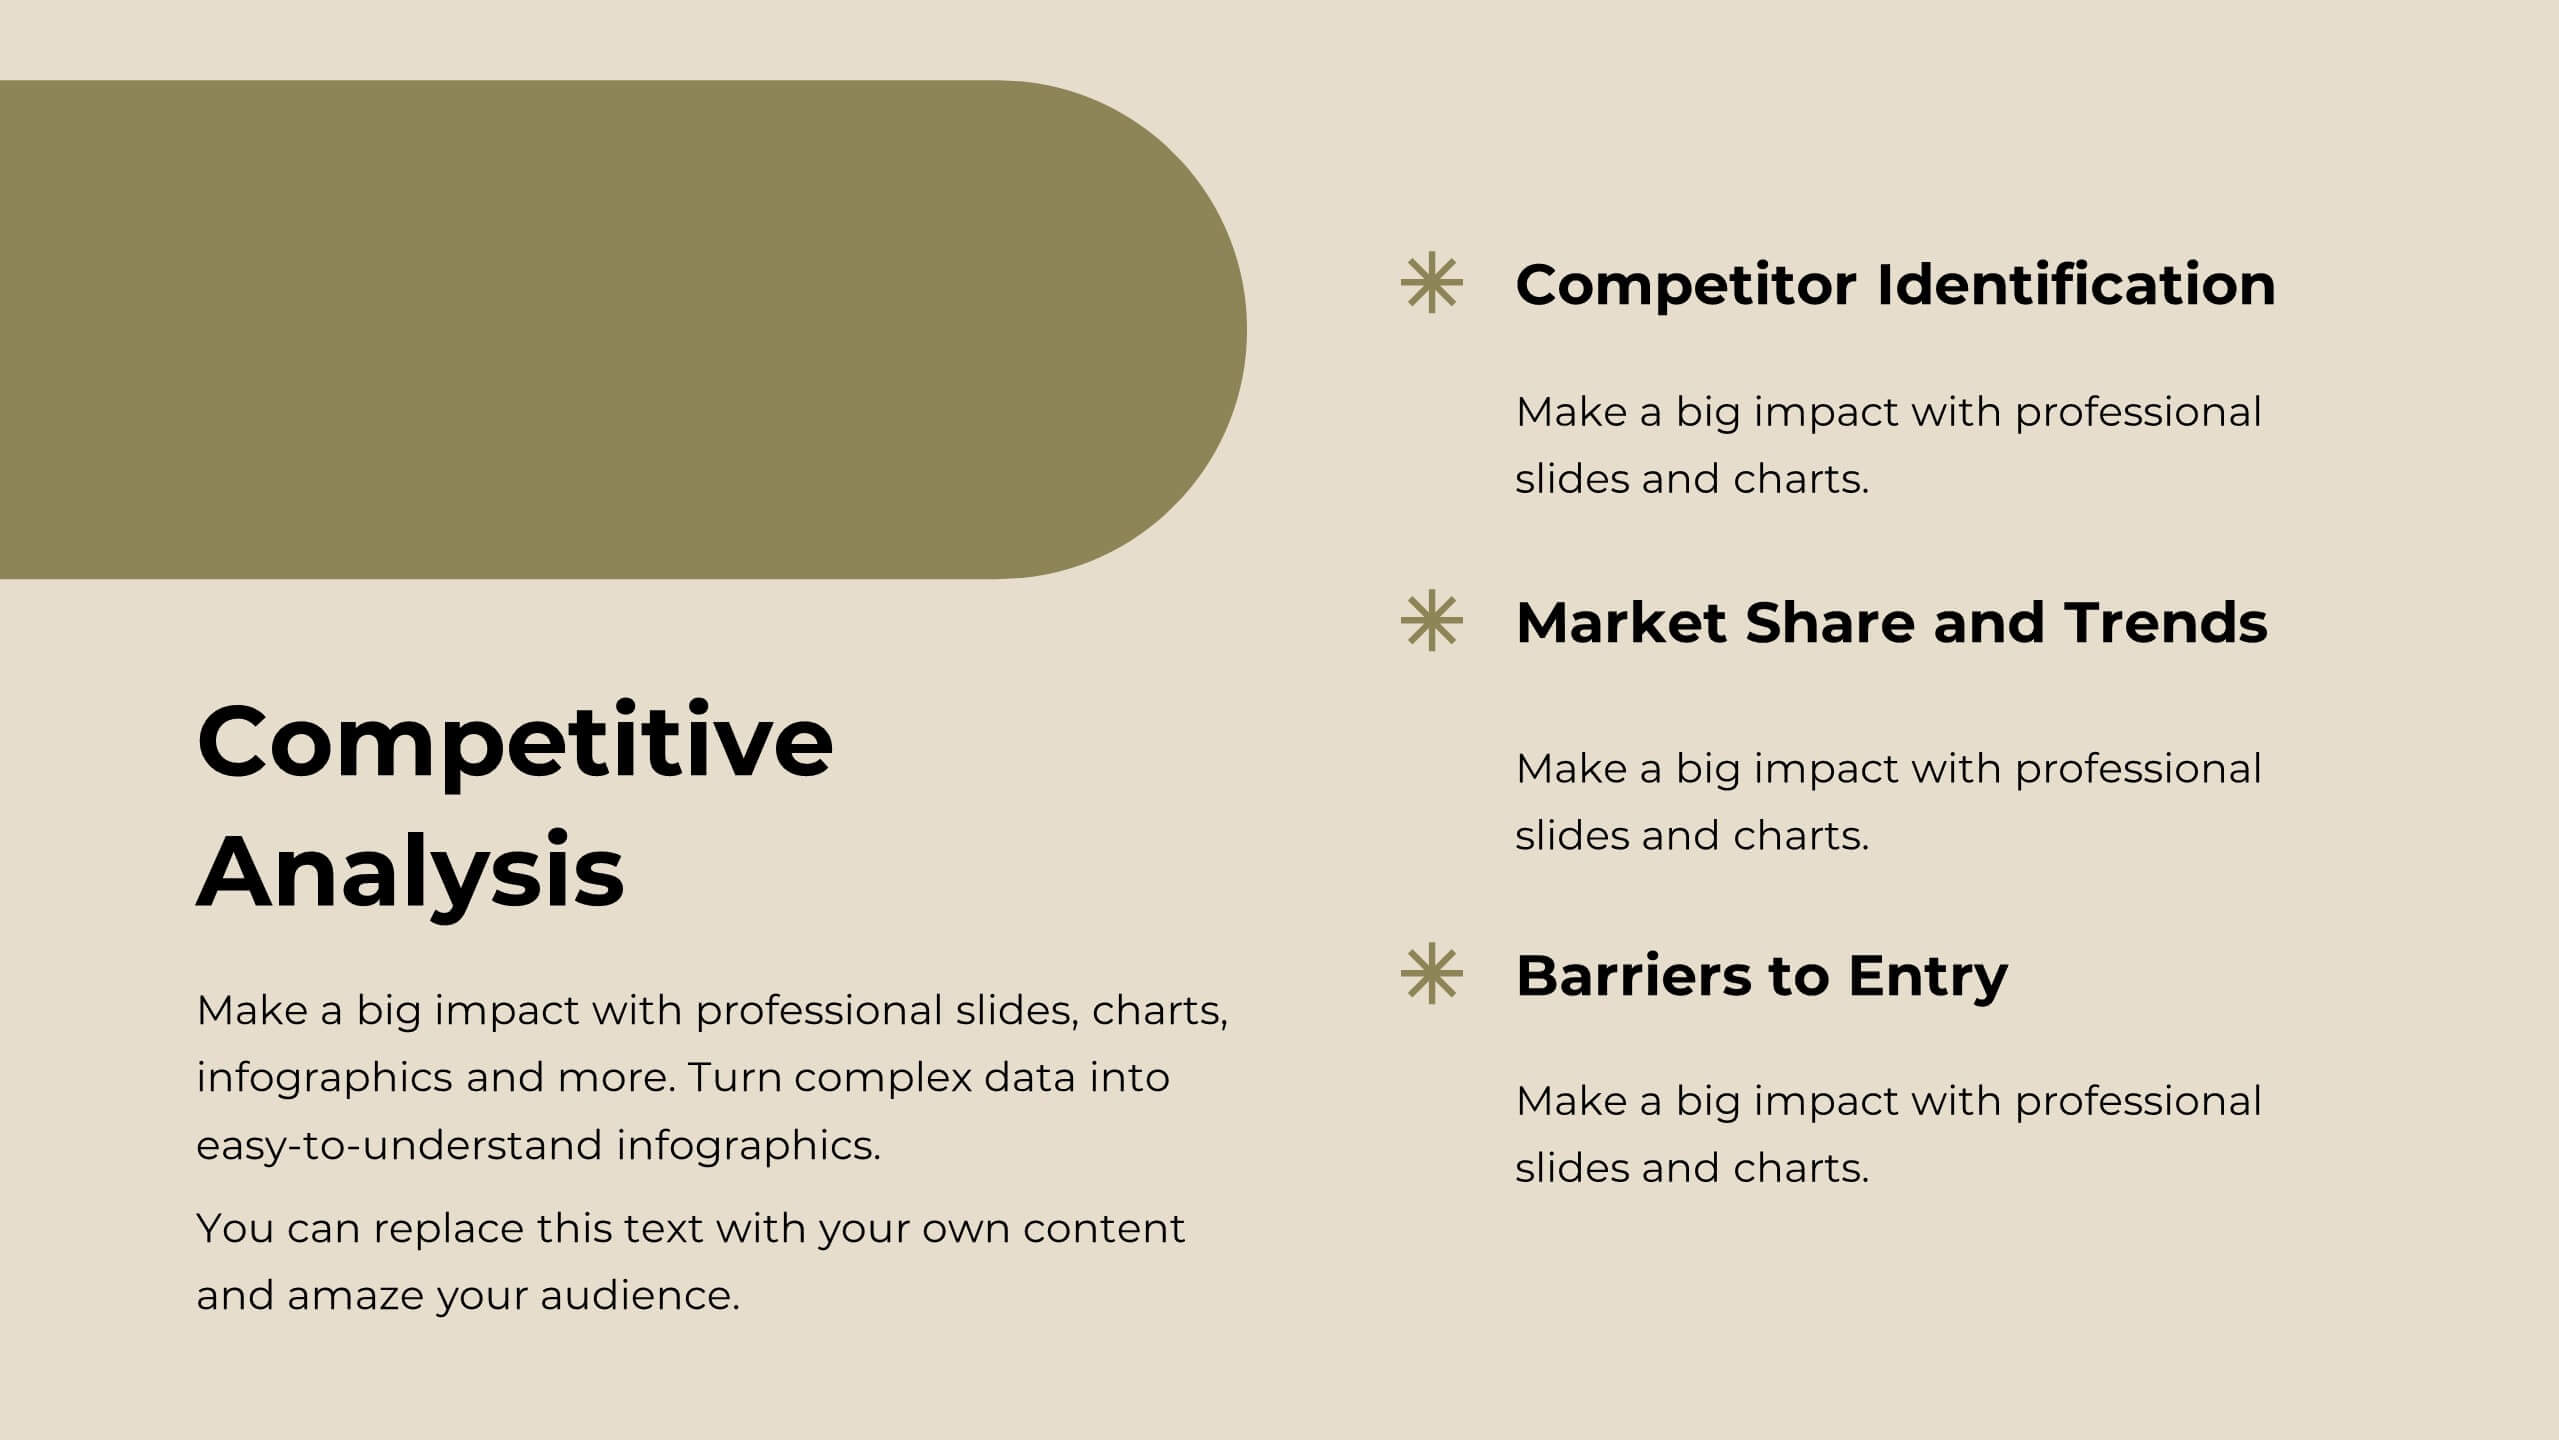
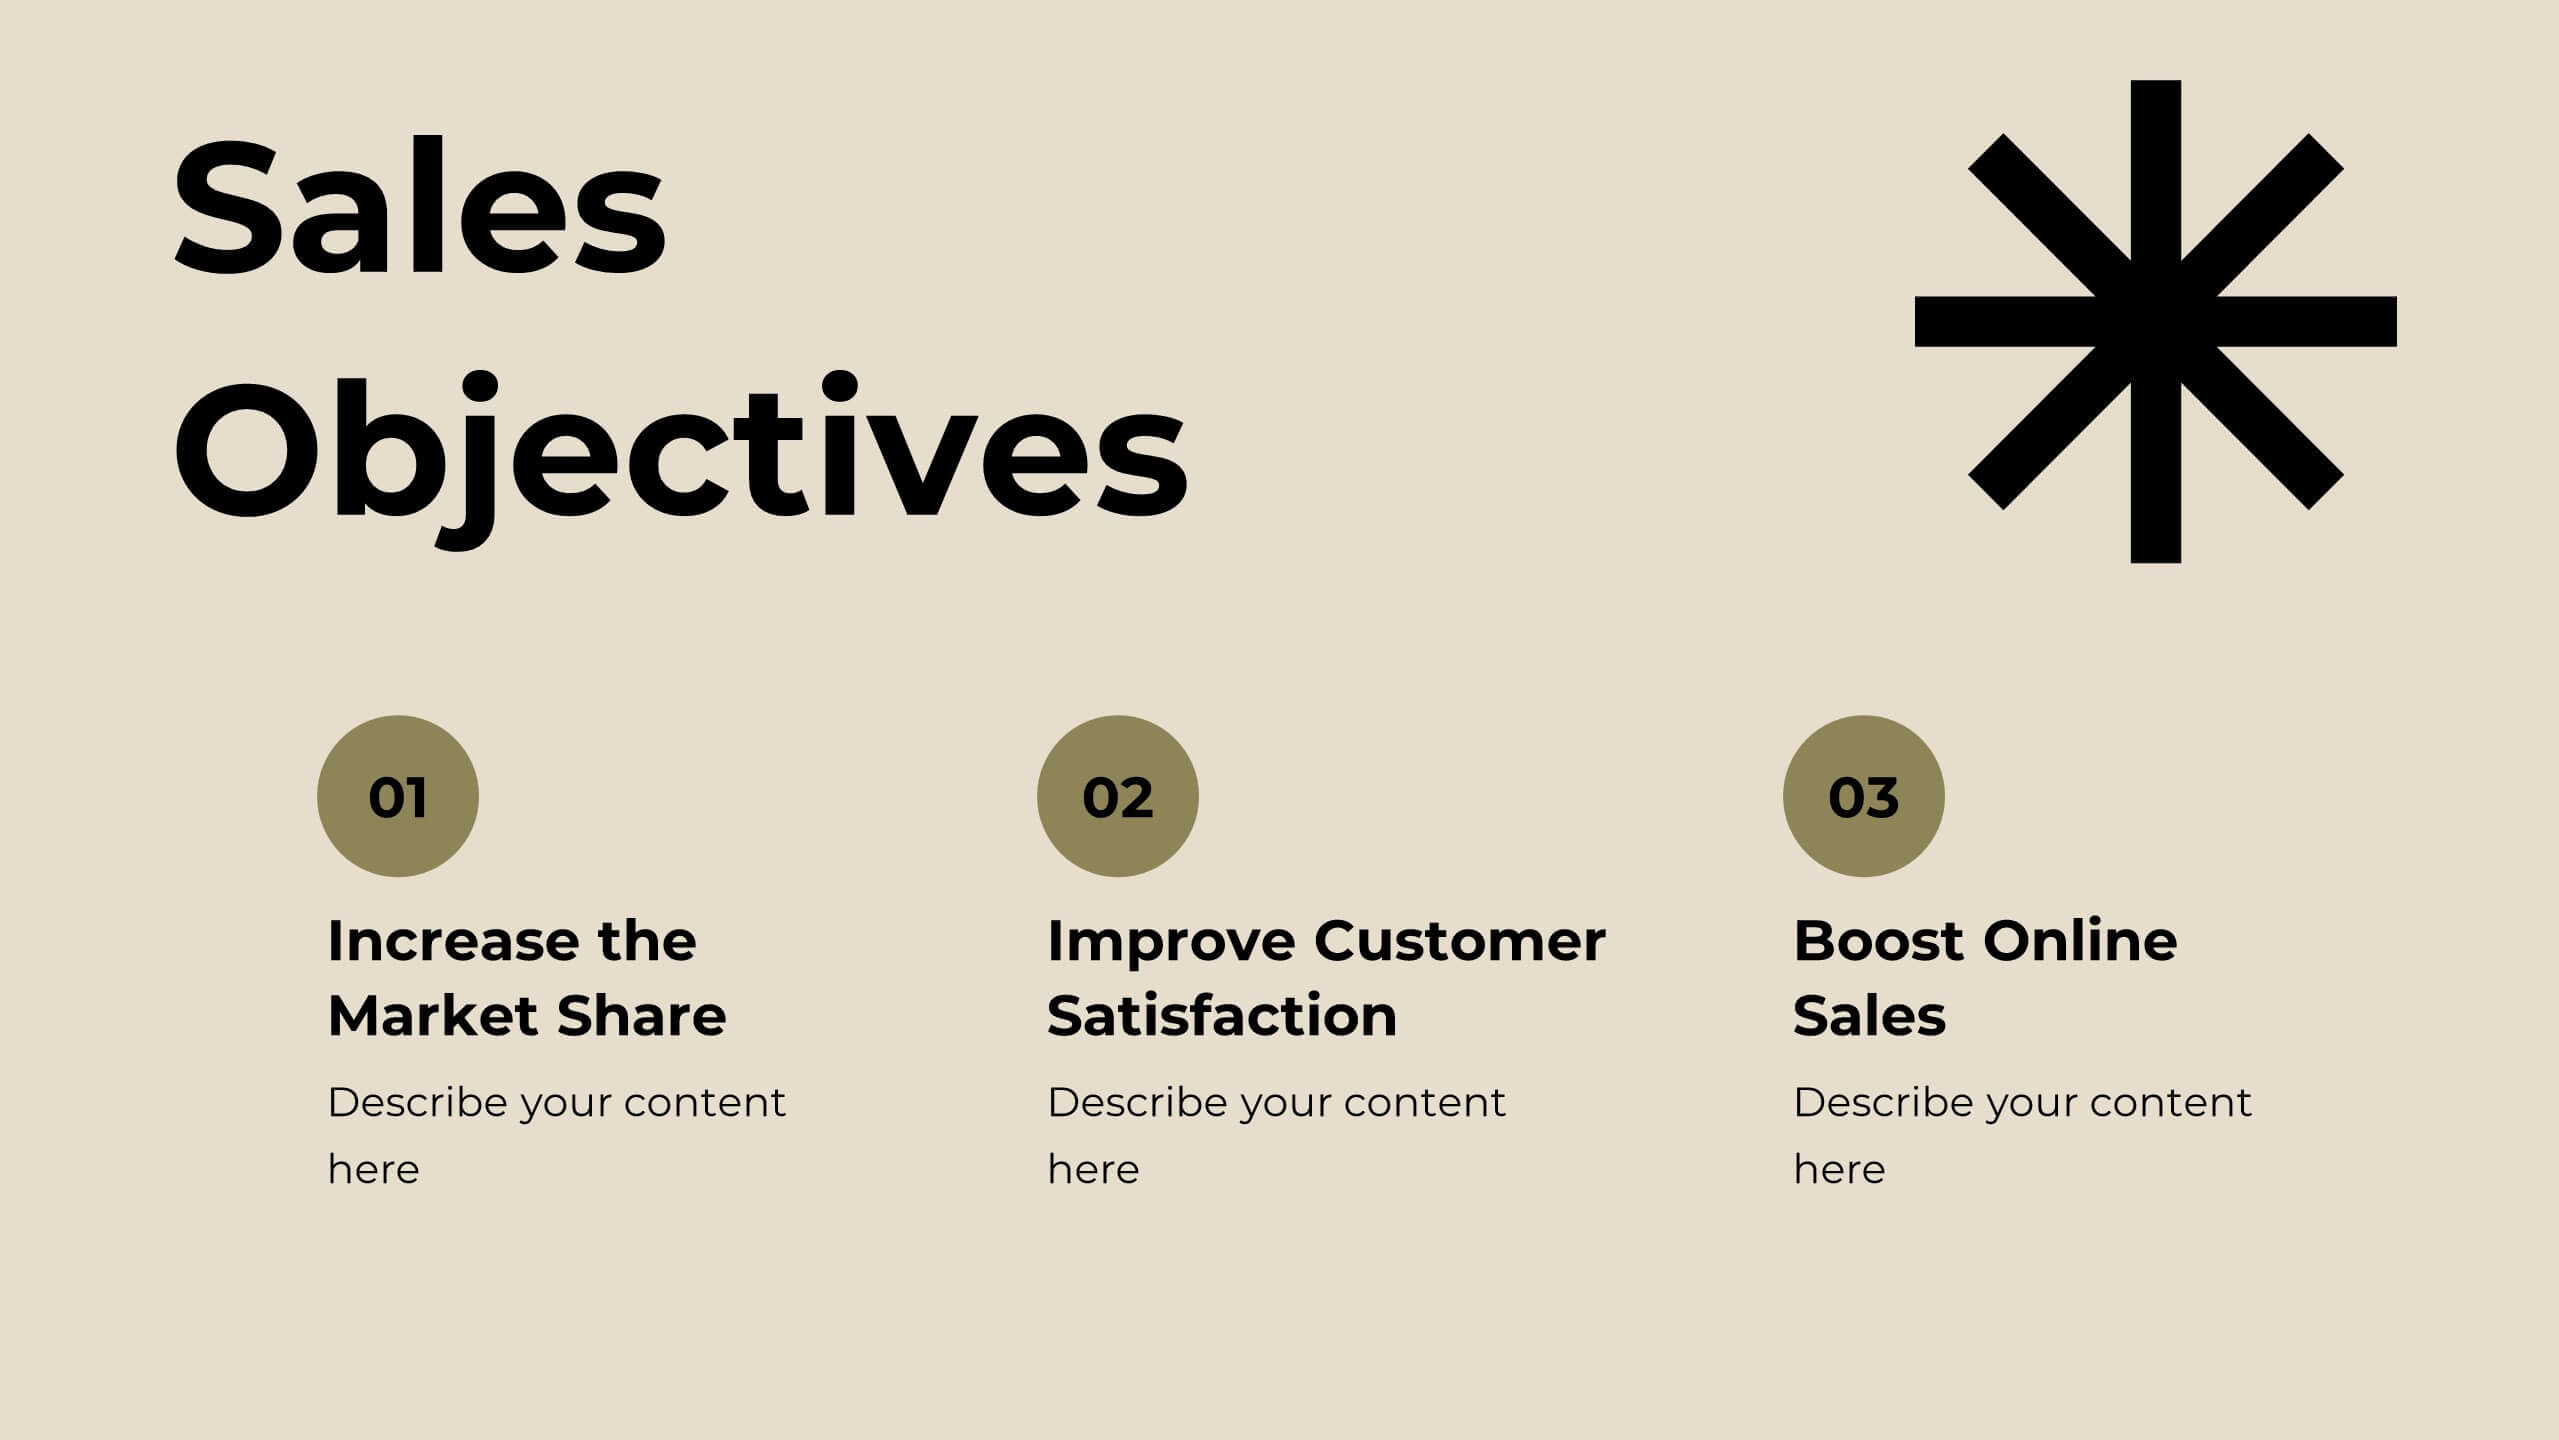
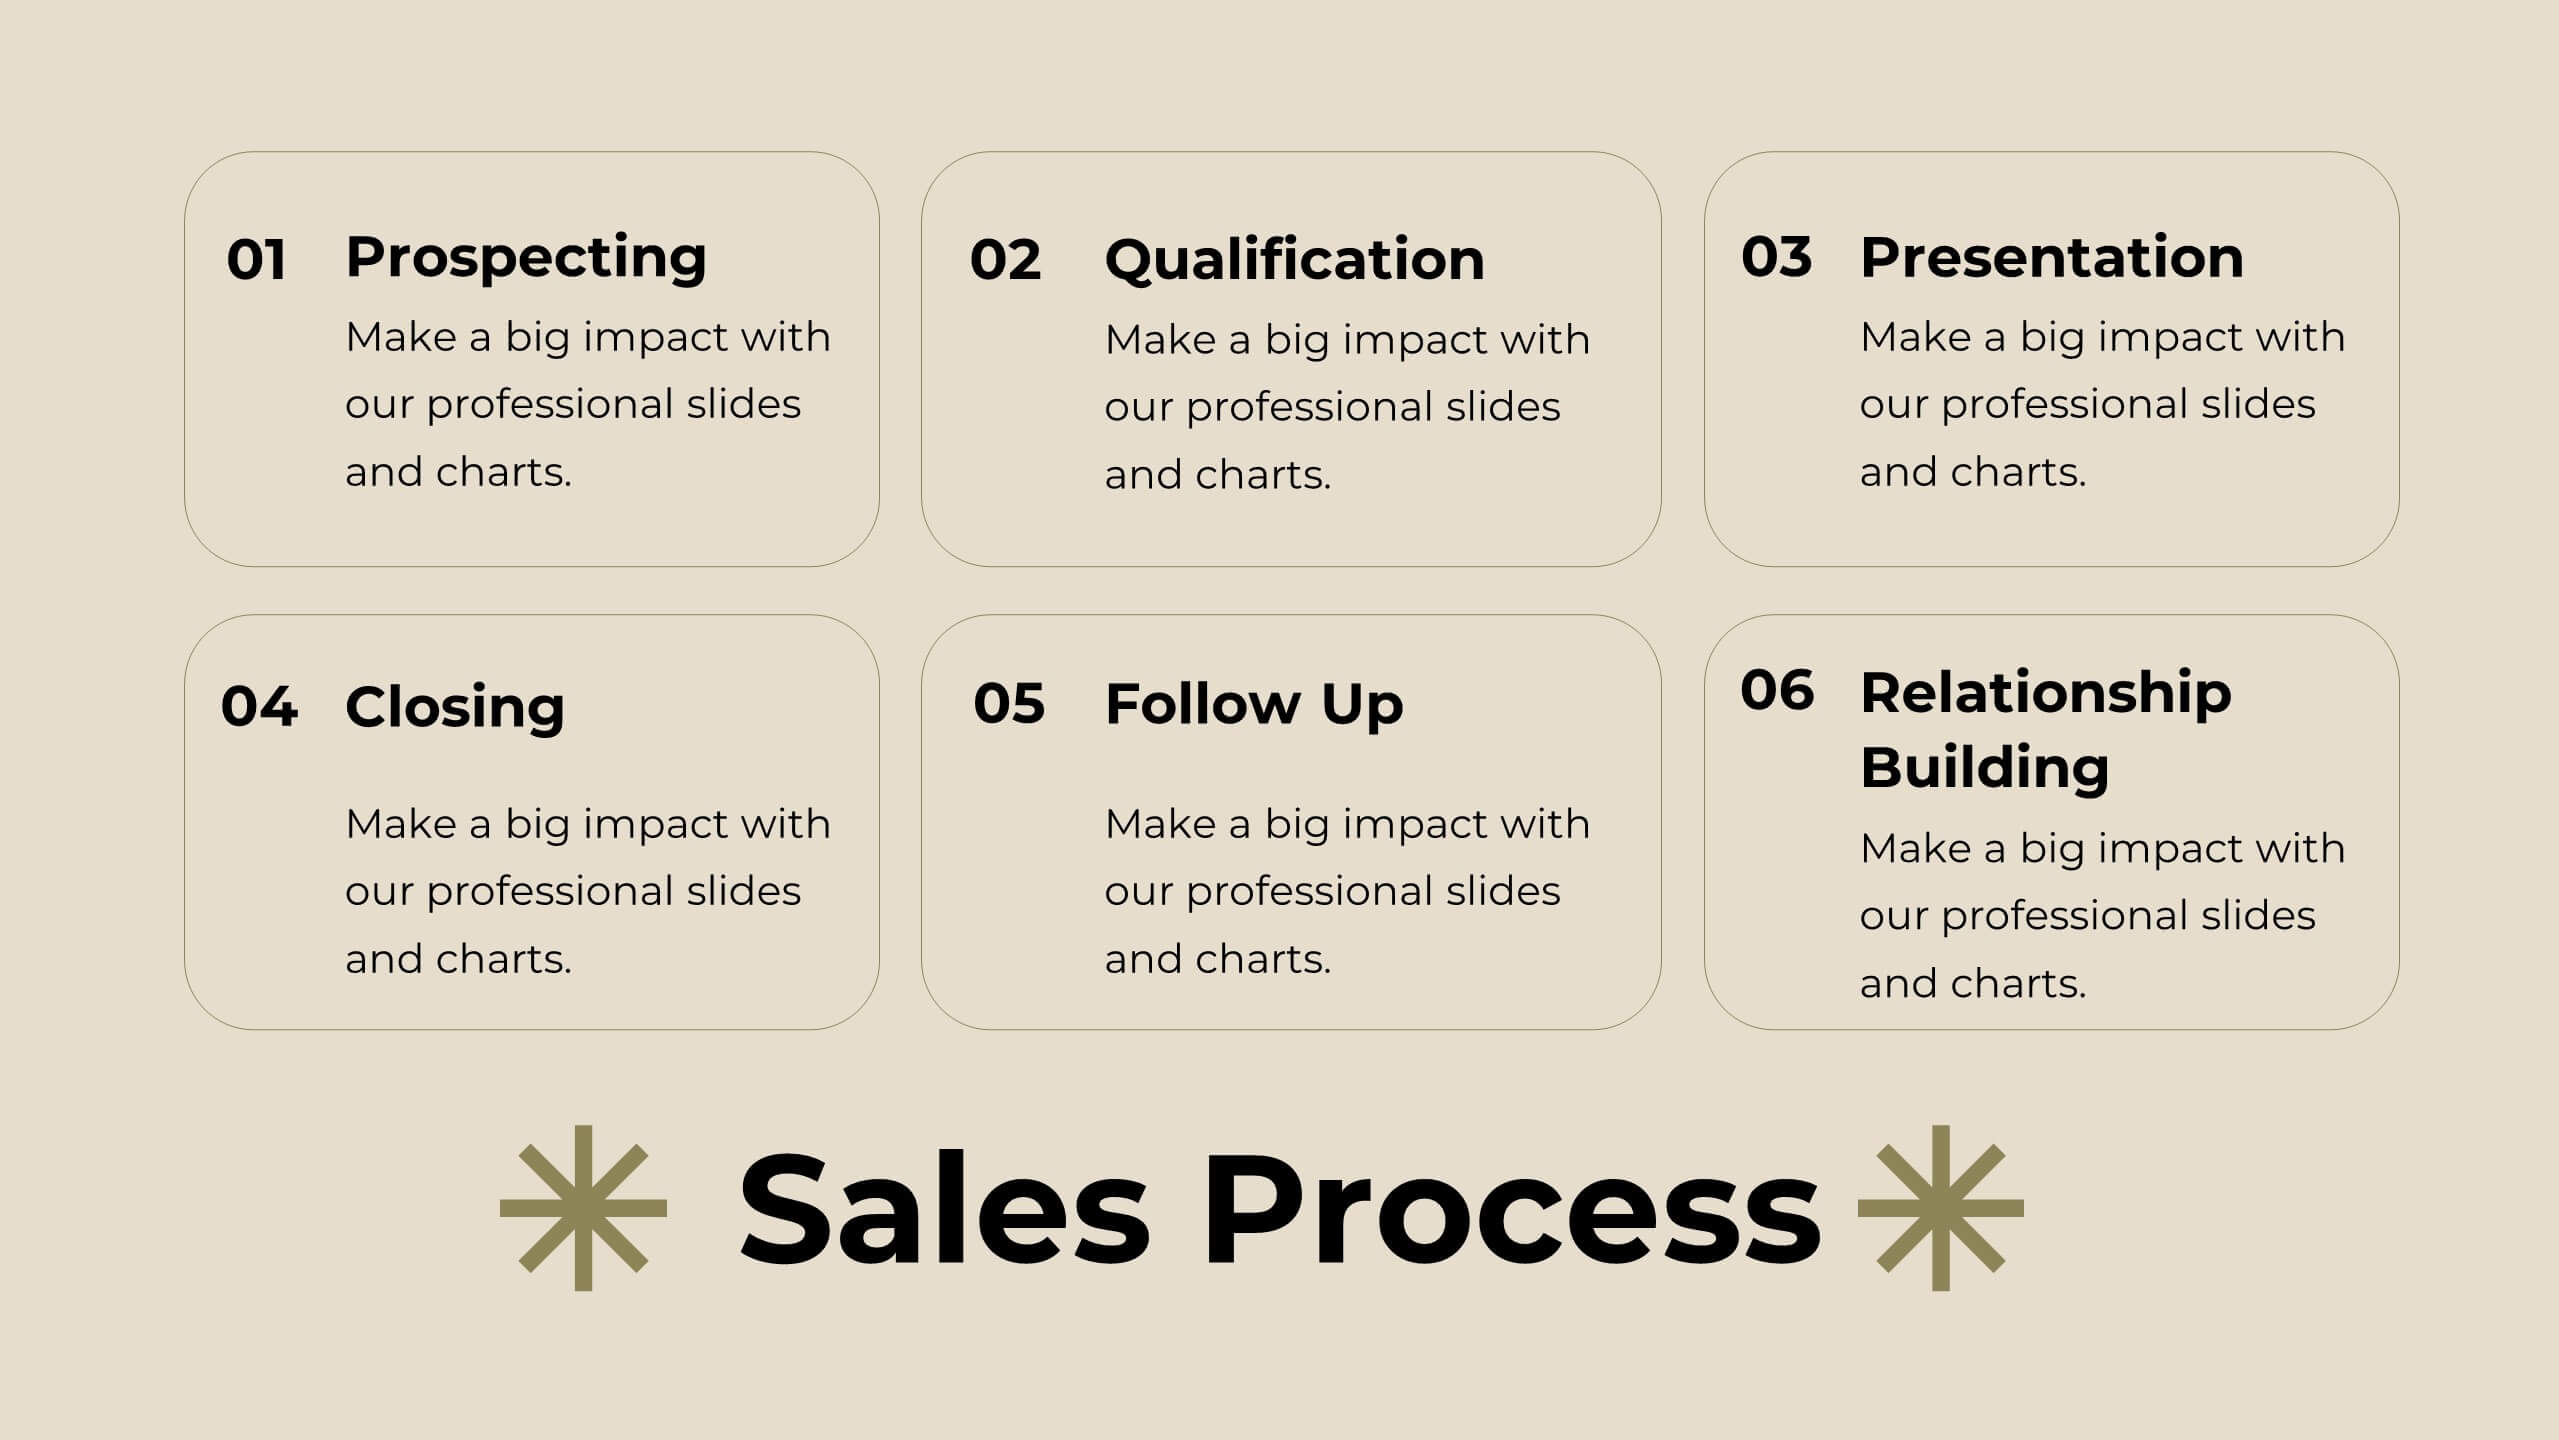
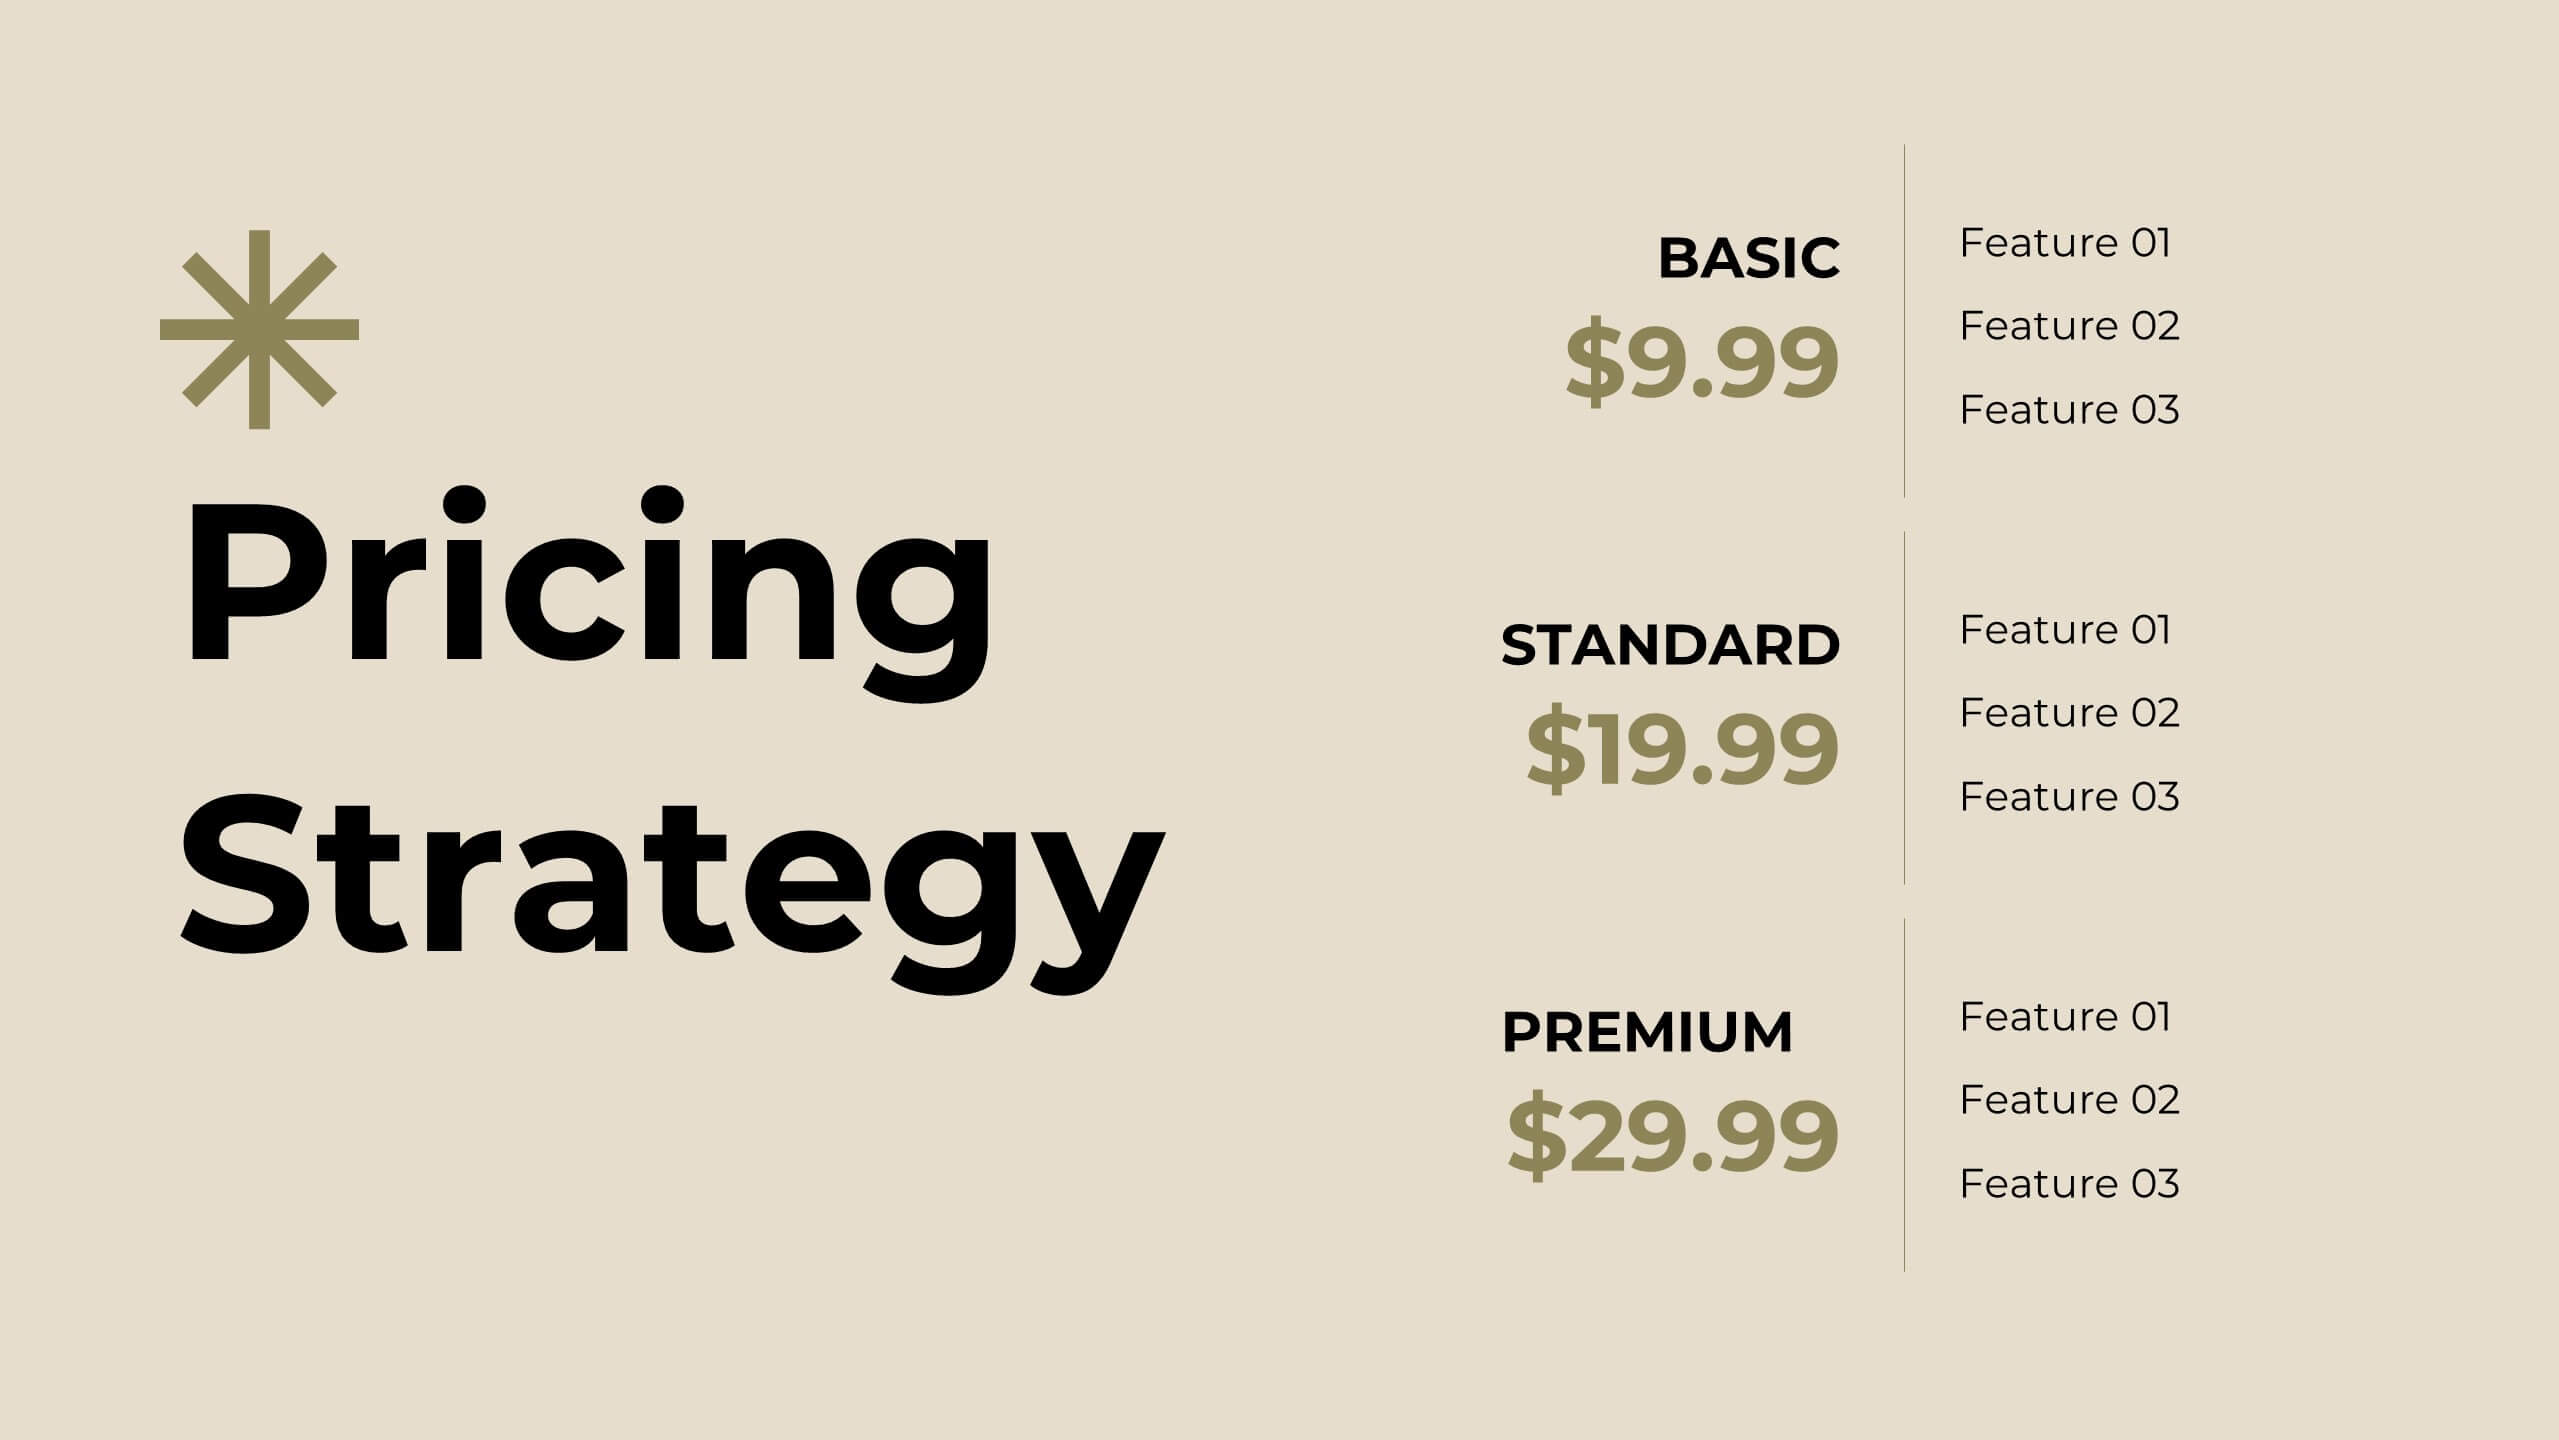
Opal Sales Pitch Deck Presentation
Boost your sales strategy with this sleek pitch deck template! Perfect for detailing your company overview, sales objectives, and pricing strategy, it includes slides for competitive analysis and customer testimonials. Engage your audience with clear, professional visuals and structured content. Compatible with PowerPoint, Keynote, and Google Slides for seamless presentations on any platform.


7 slides
Mental Agility Training Infographic
Embark on the enlightening path of training with our intricately designed mental agility training infographic. Illuminated by the motivation of yellow, the growth of green, and the depth of blue, our template effectively outlines training methodologies and outcomes. Adorned with precision-focused infographics, intuitive icons, and adaptable image placeholders, it renders complex training data into an easily digestible format. Expertly sculpted for Powerpoint, Keynote, or Google Slides. A quintessential tool for trainers, HR professionals, or any organization aiming to elevate its training regimen. Enlighten your audience; let every slide be a step towards mastery.


6 slides
Market Differentiation with Blue Ocean Strategy Presentation
Set your brand apart with our Market Differentiation with Blue Ocean Strategy template. This visually compelling tool helps you chart a course through uncharted business waters, emphasizing innovation in cost management, value creation, and buyer engagement. Compatible with PowerPoint, Keynote, and Google Slides, it’s perfect for presenting strategic insights that escape the competitive red ocean into the clear, blue waters of uncontested market space.


6 slides
Innovative Treatments in Medical Practice Presentation
Showcase cutting-edge healthcare strategies with this creative medical infographic featuring a pressure gauge illustration. Ideal for presenting treatment timelines, research insights, or innovation pathways. Fully editable in PowerPoint, Keynote, and Google Slides, this design suits health startups, medical researchers, and professionals looking to communicate modern medical approaches with clarity.


6 slides
Business Advancement Metrics Presentation
Get ready to visualize your wins! This presentation template brings clarity to your metrics, helping you showcase business growth and performance benchmarks with sleek, stacked visuals. Perfect for tracking KPIs, performance analysis, or advancement trends. Fully compatible with PowerPoint, Keynote, and Google Slides for easy editing and seamless presentation delivery.


20 slides
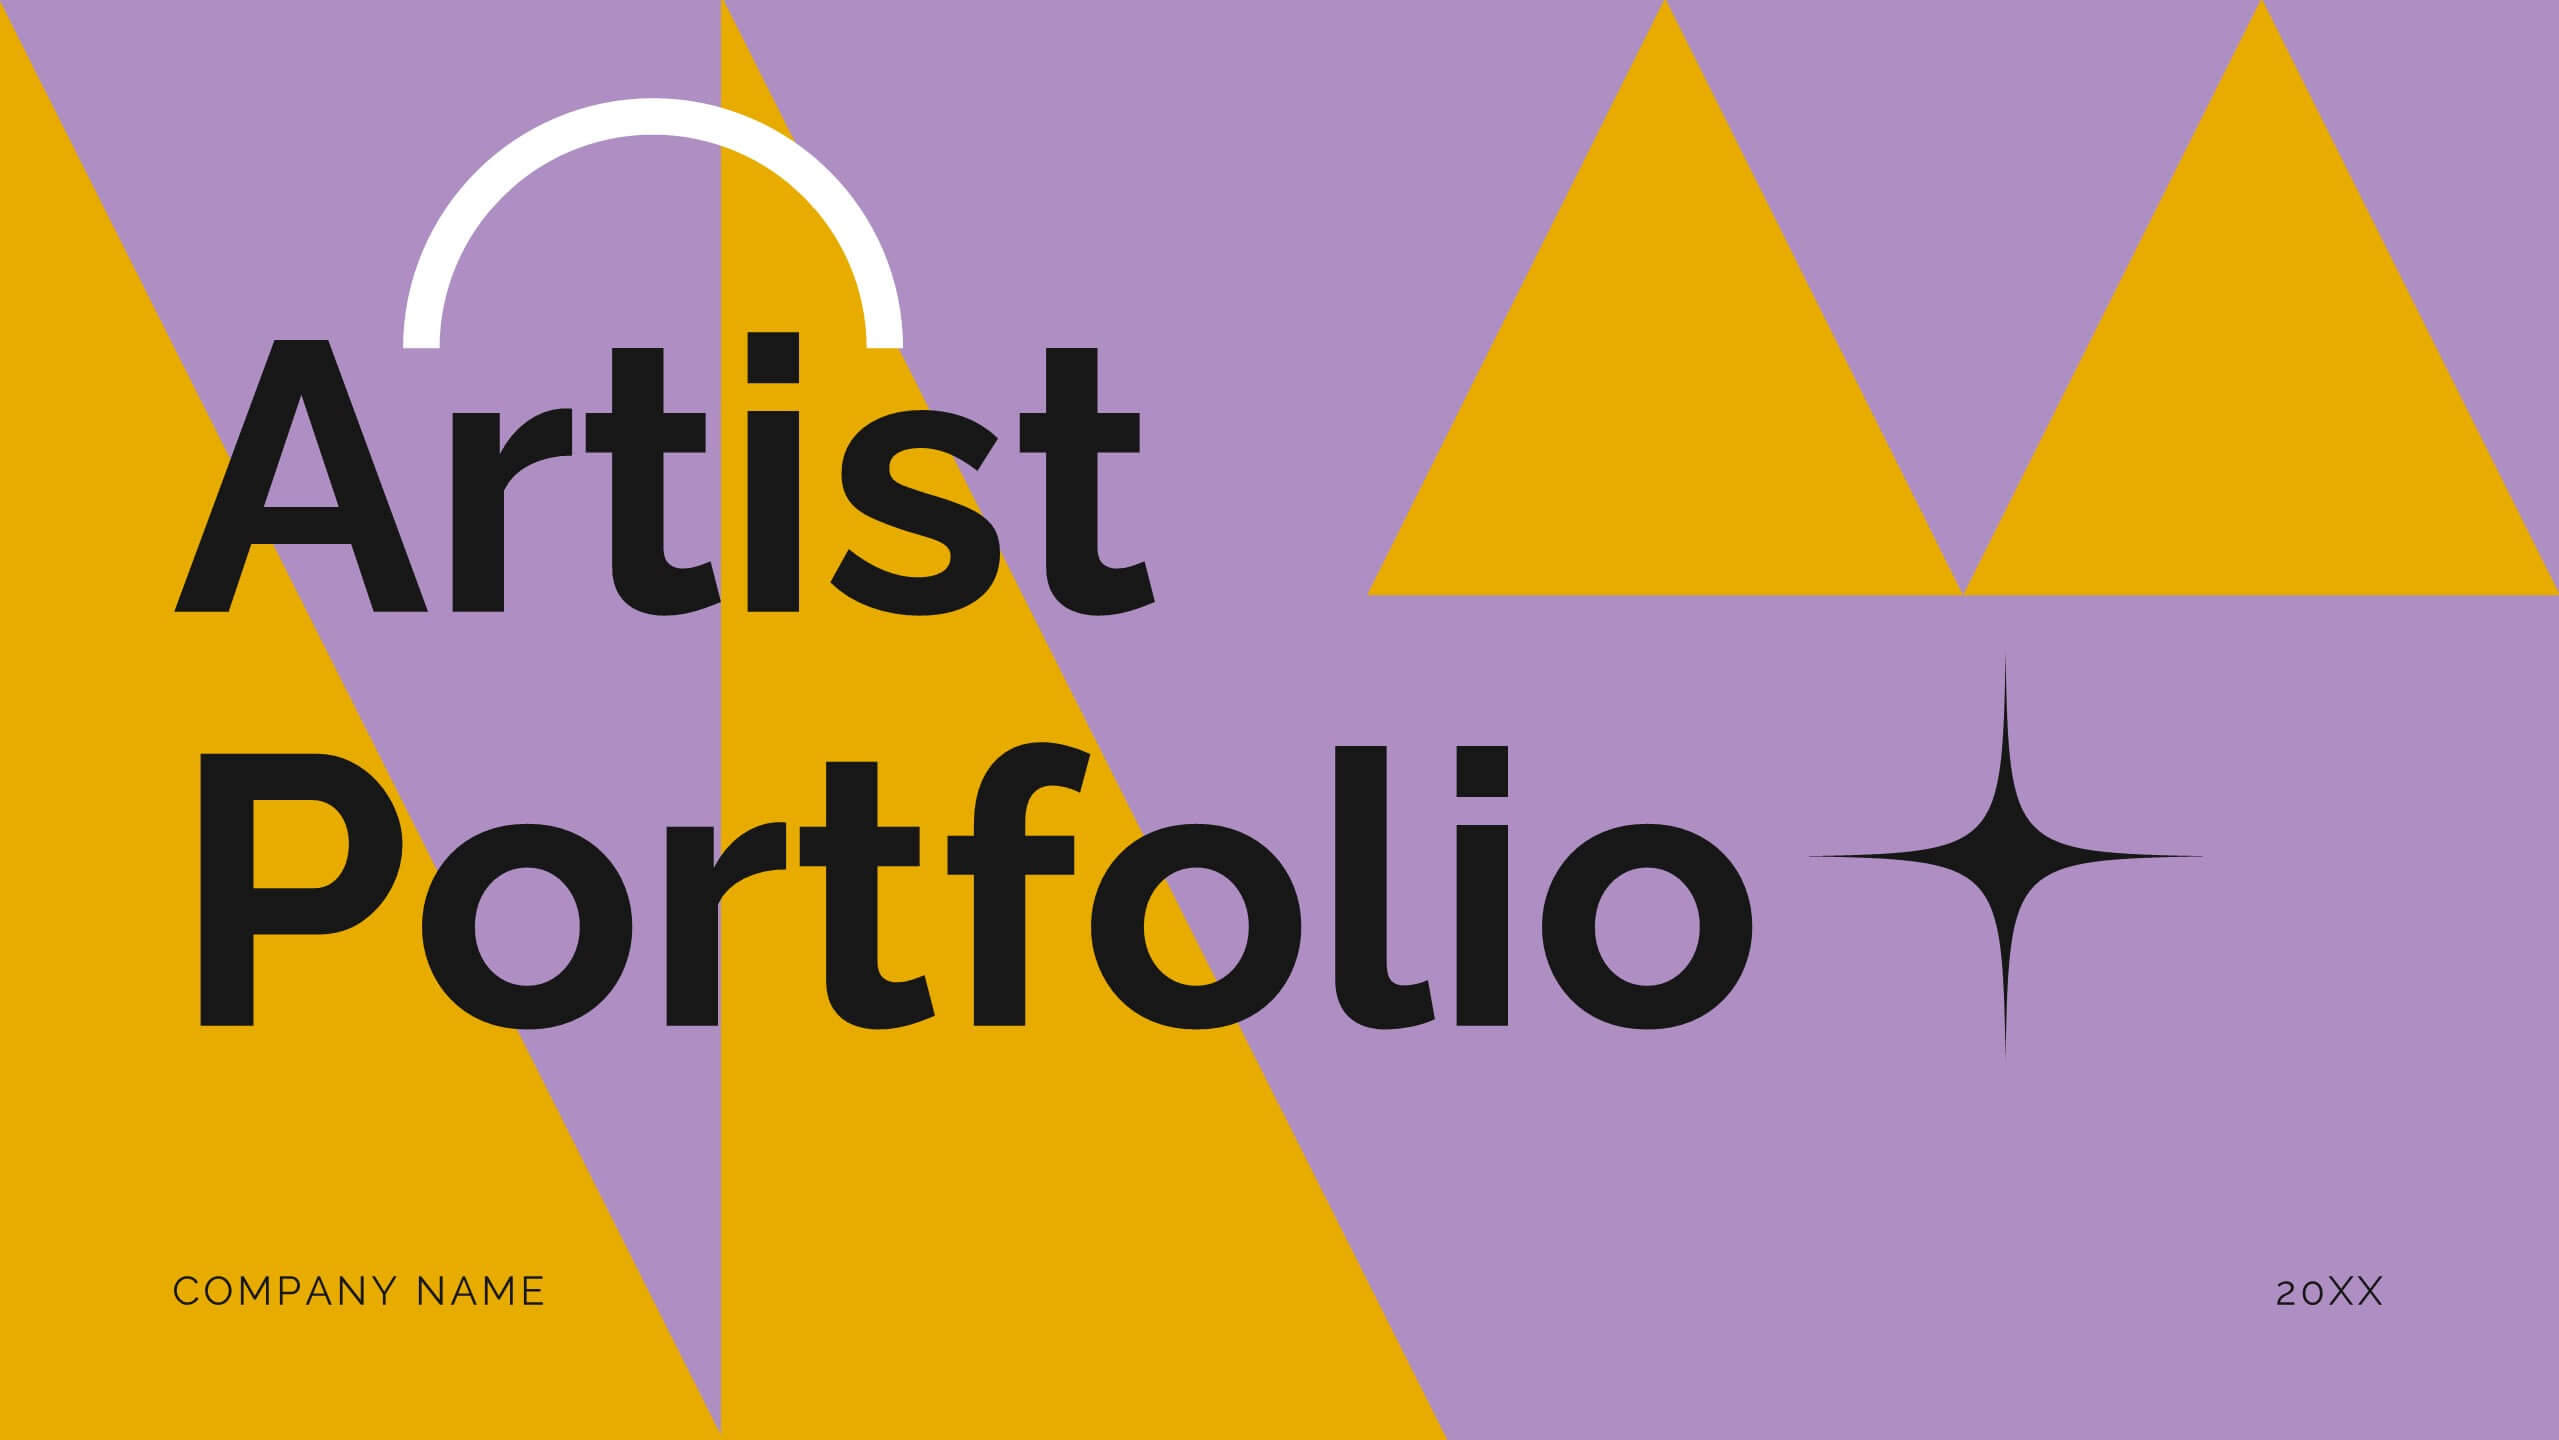
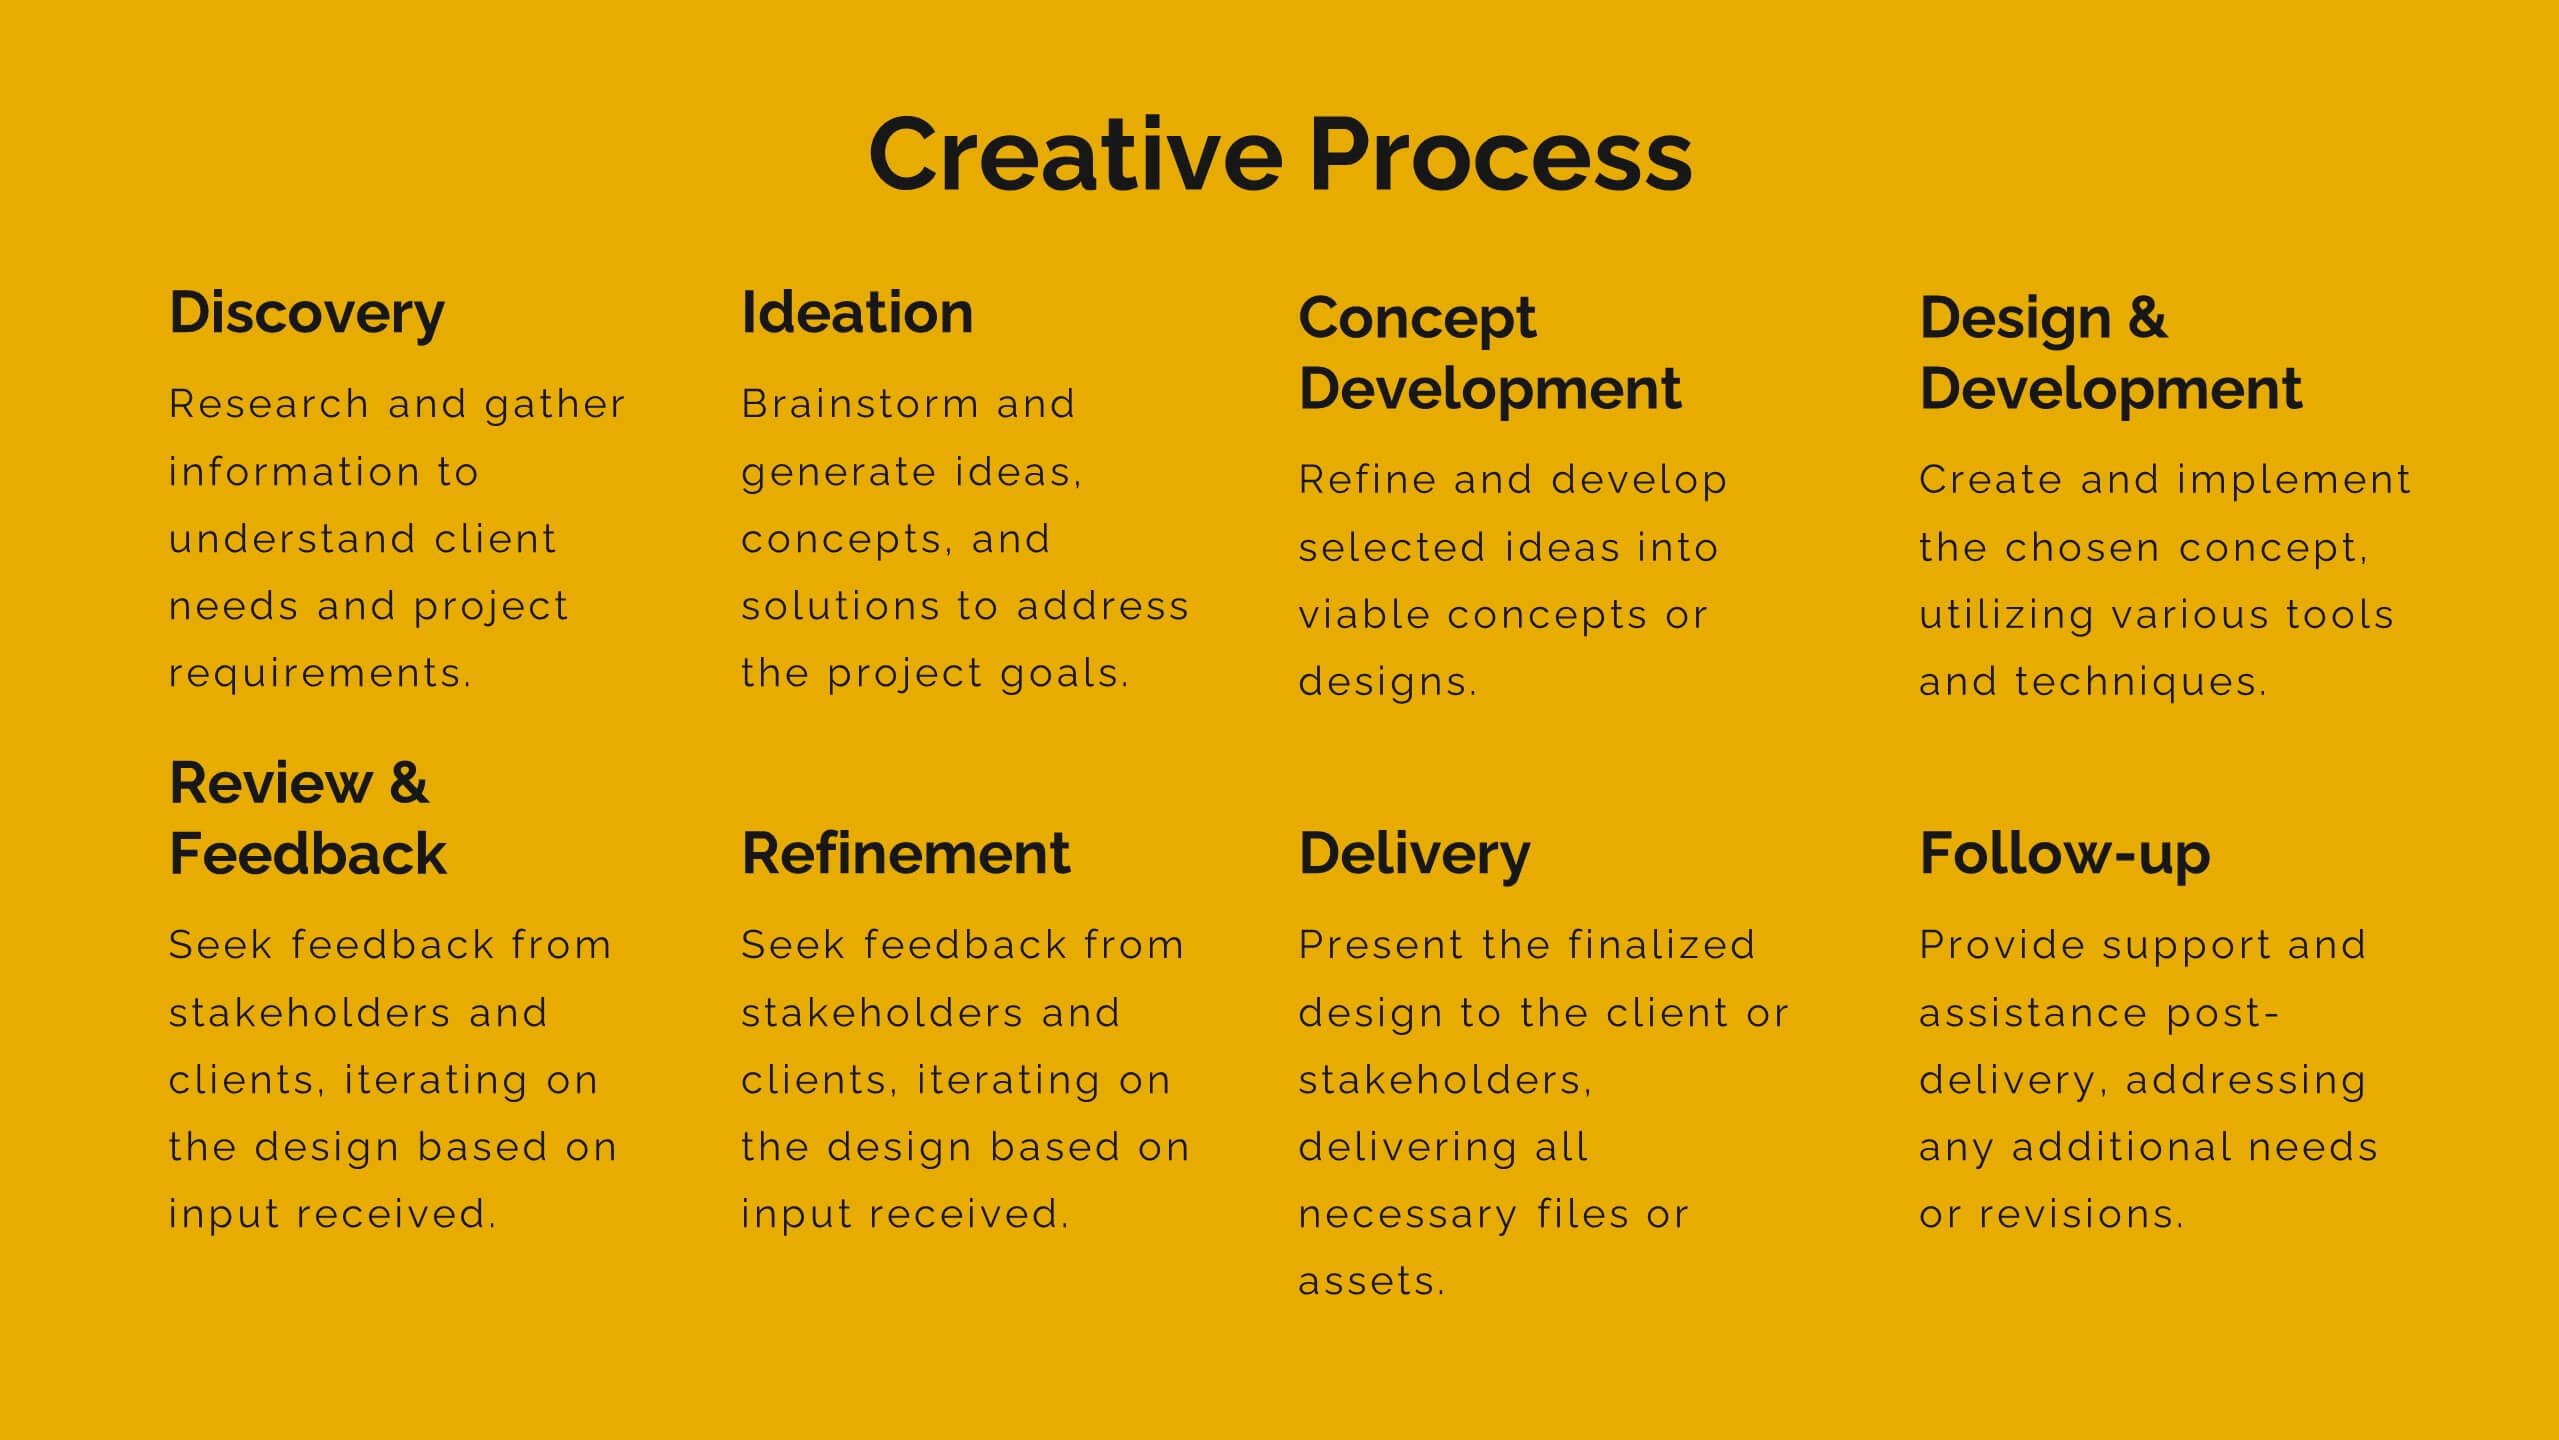
Vortex Artist Portfolio Template Presentation
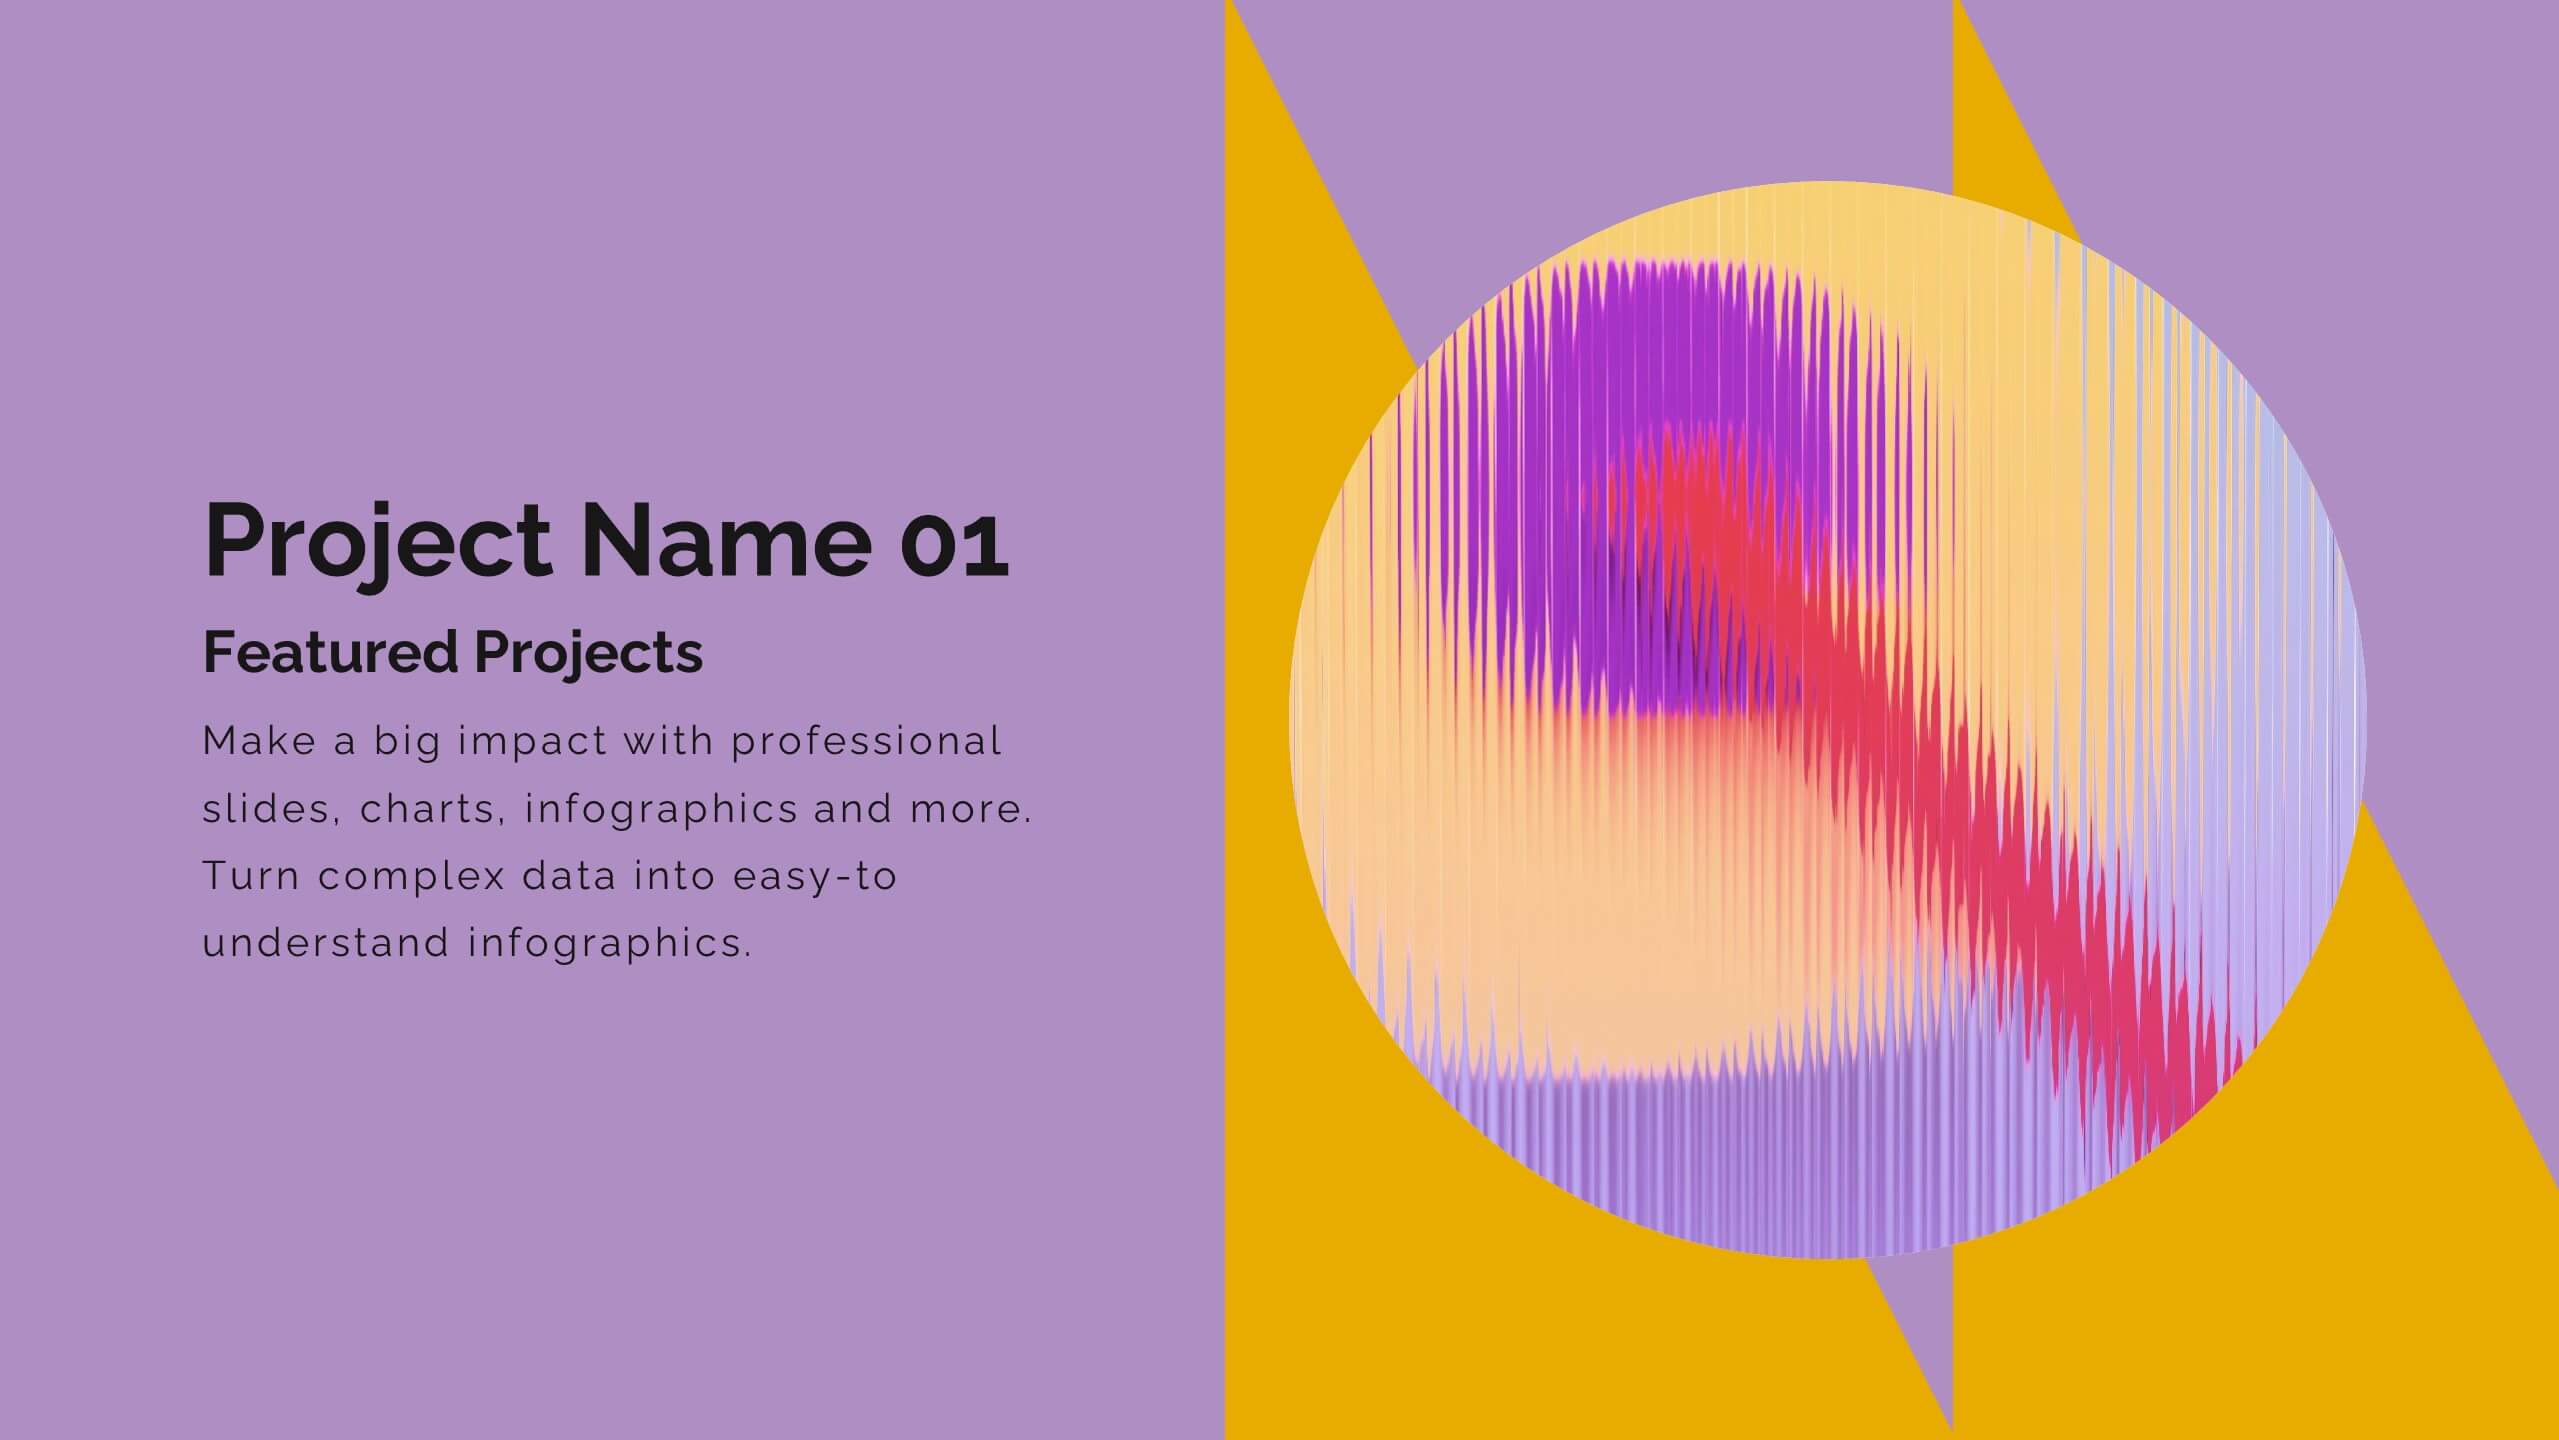
Showcase your artistic brilliance with this eye-catching portfolio presentation template! Perfect for highlighting your projects, creative process, and awards, it features vibrant slides for your philosophy, collaborations, and client testimonials. Impress potential clients and collaborators with a stunning, well-organized portfolio. Compatible with PowerPoint, Keynote, and Google Slides for seamless presentations on any platform.


21 slides
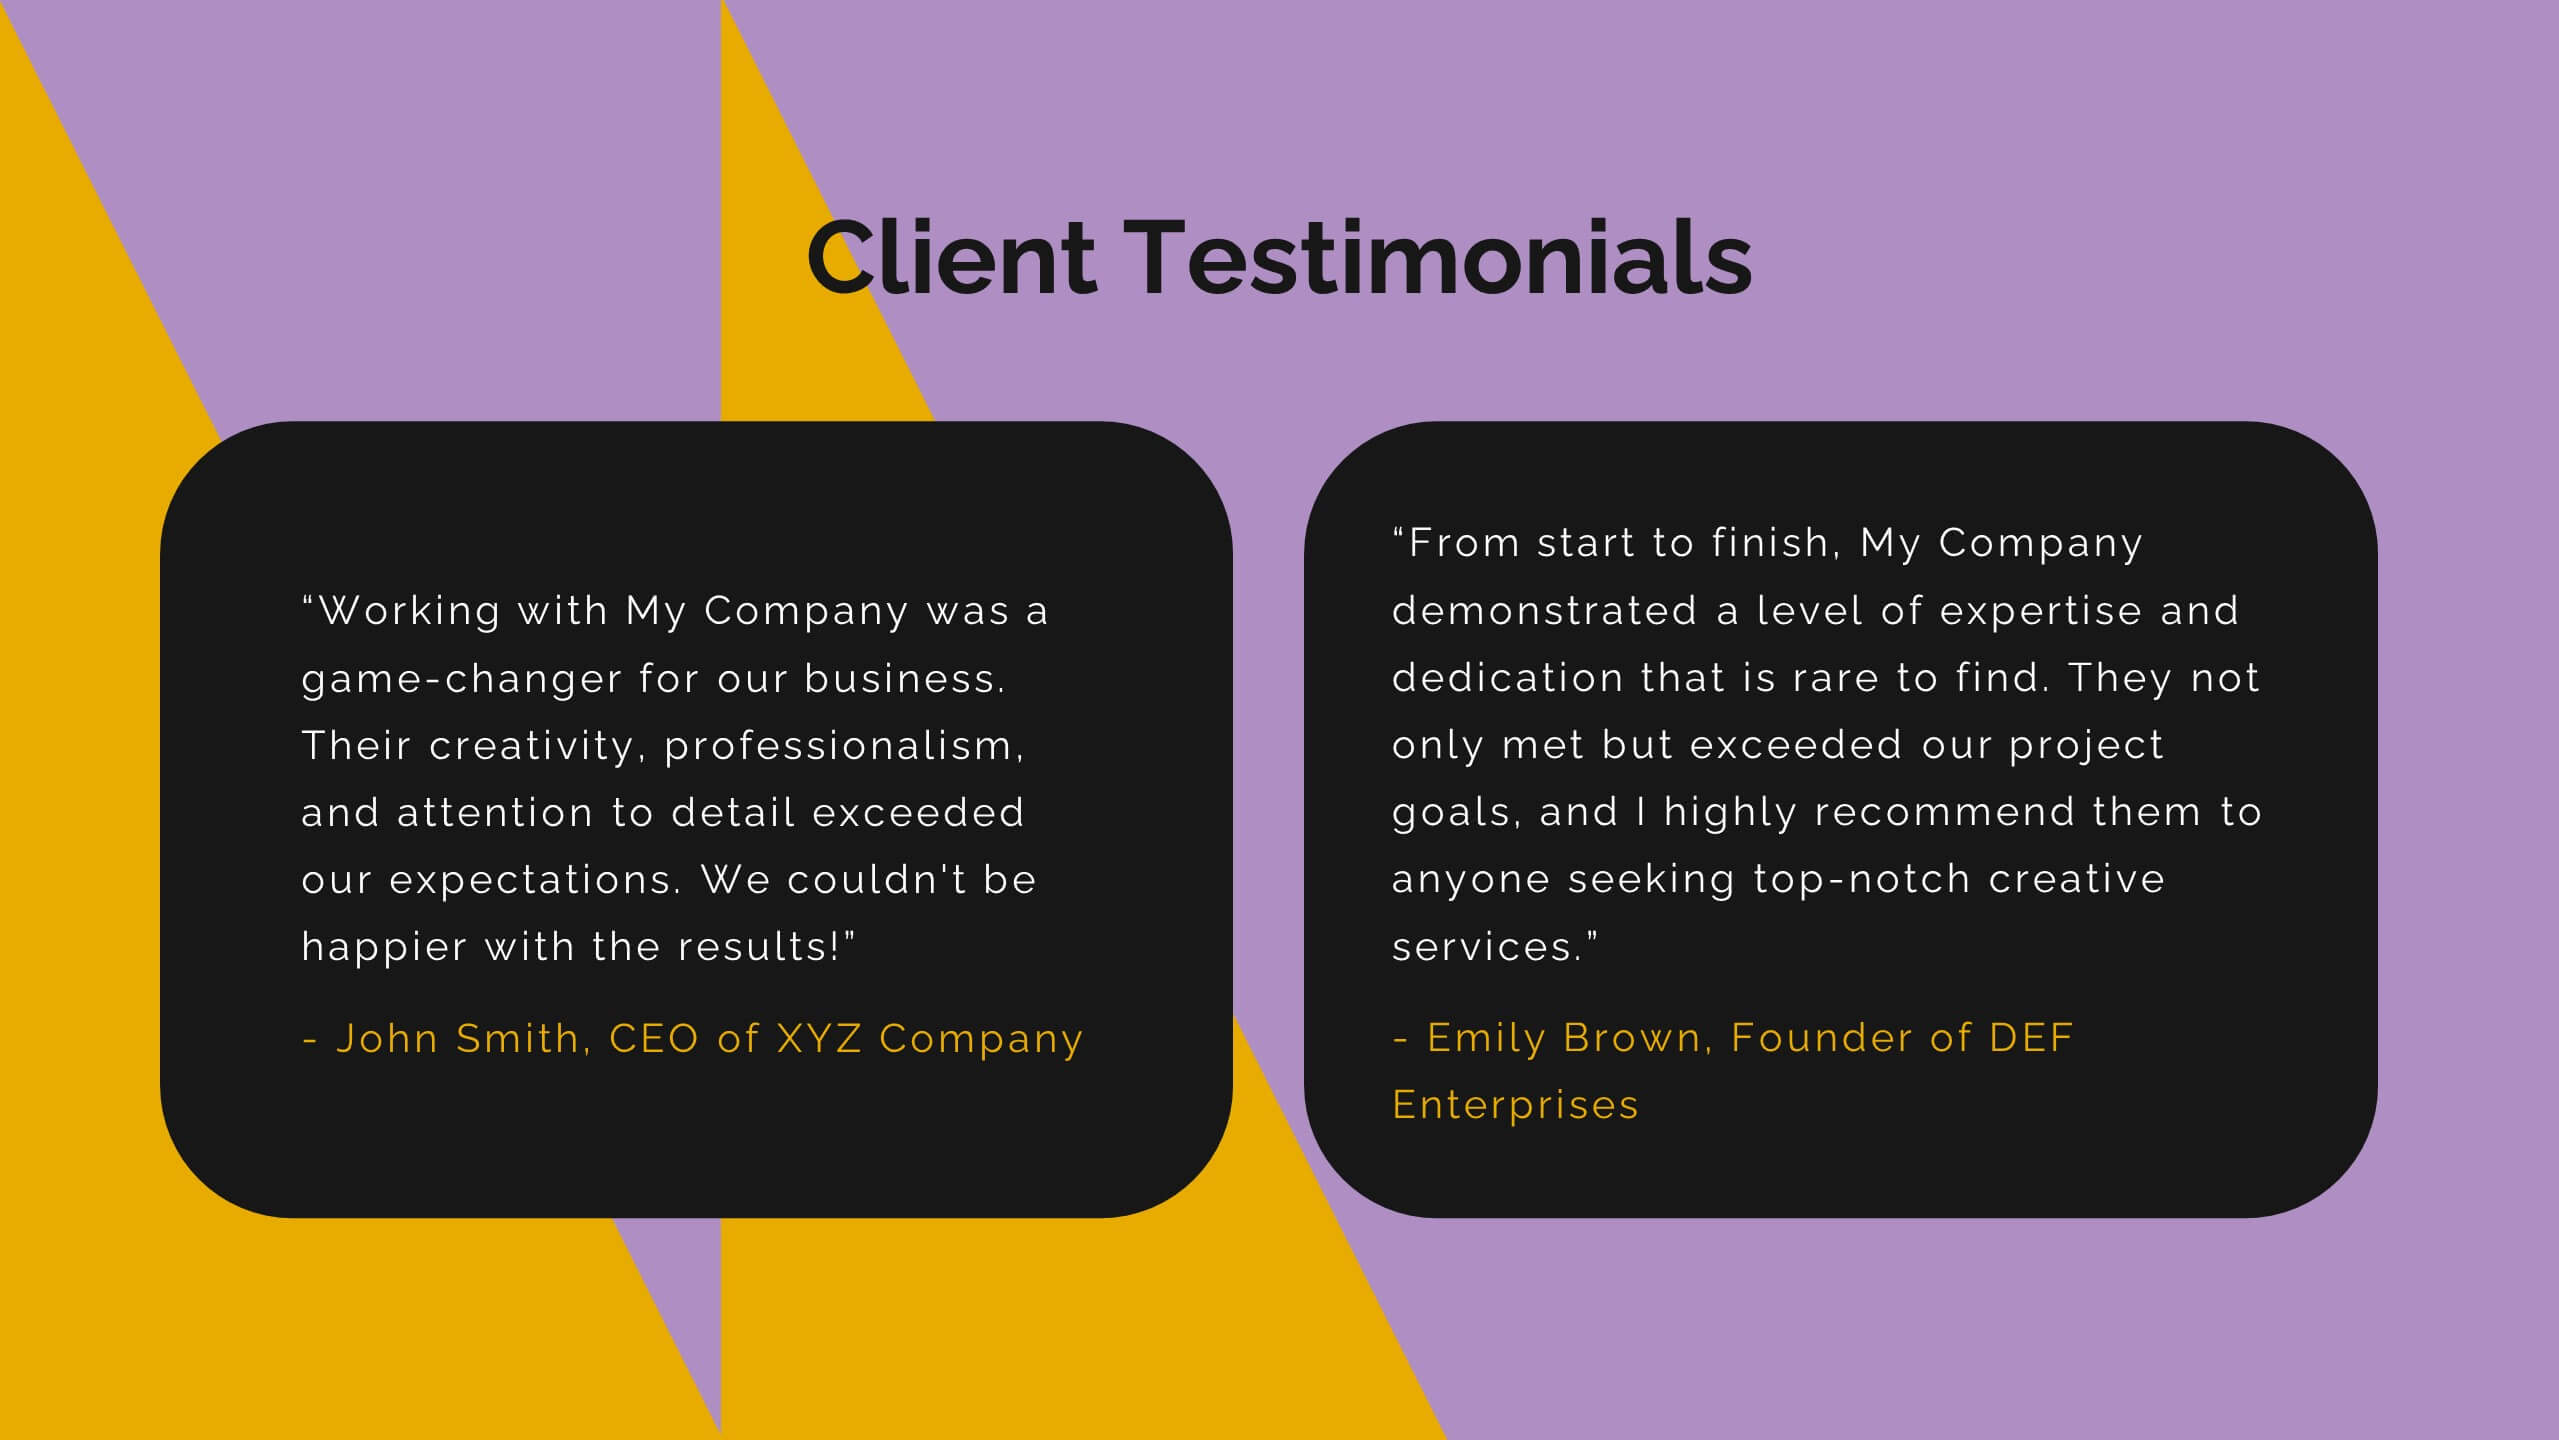
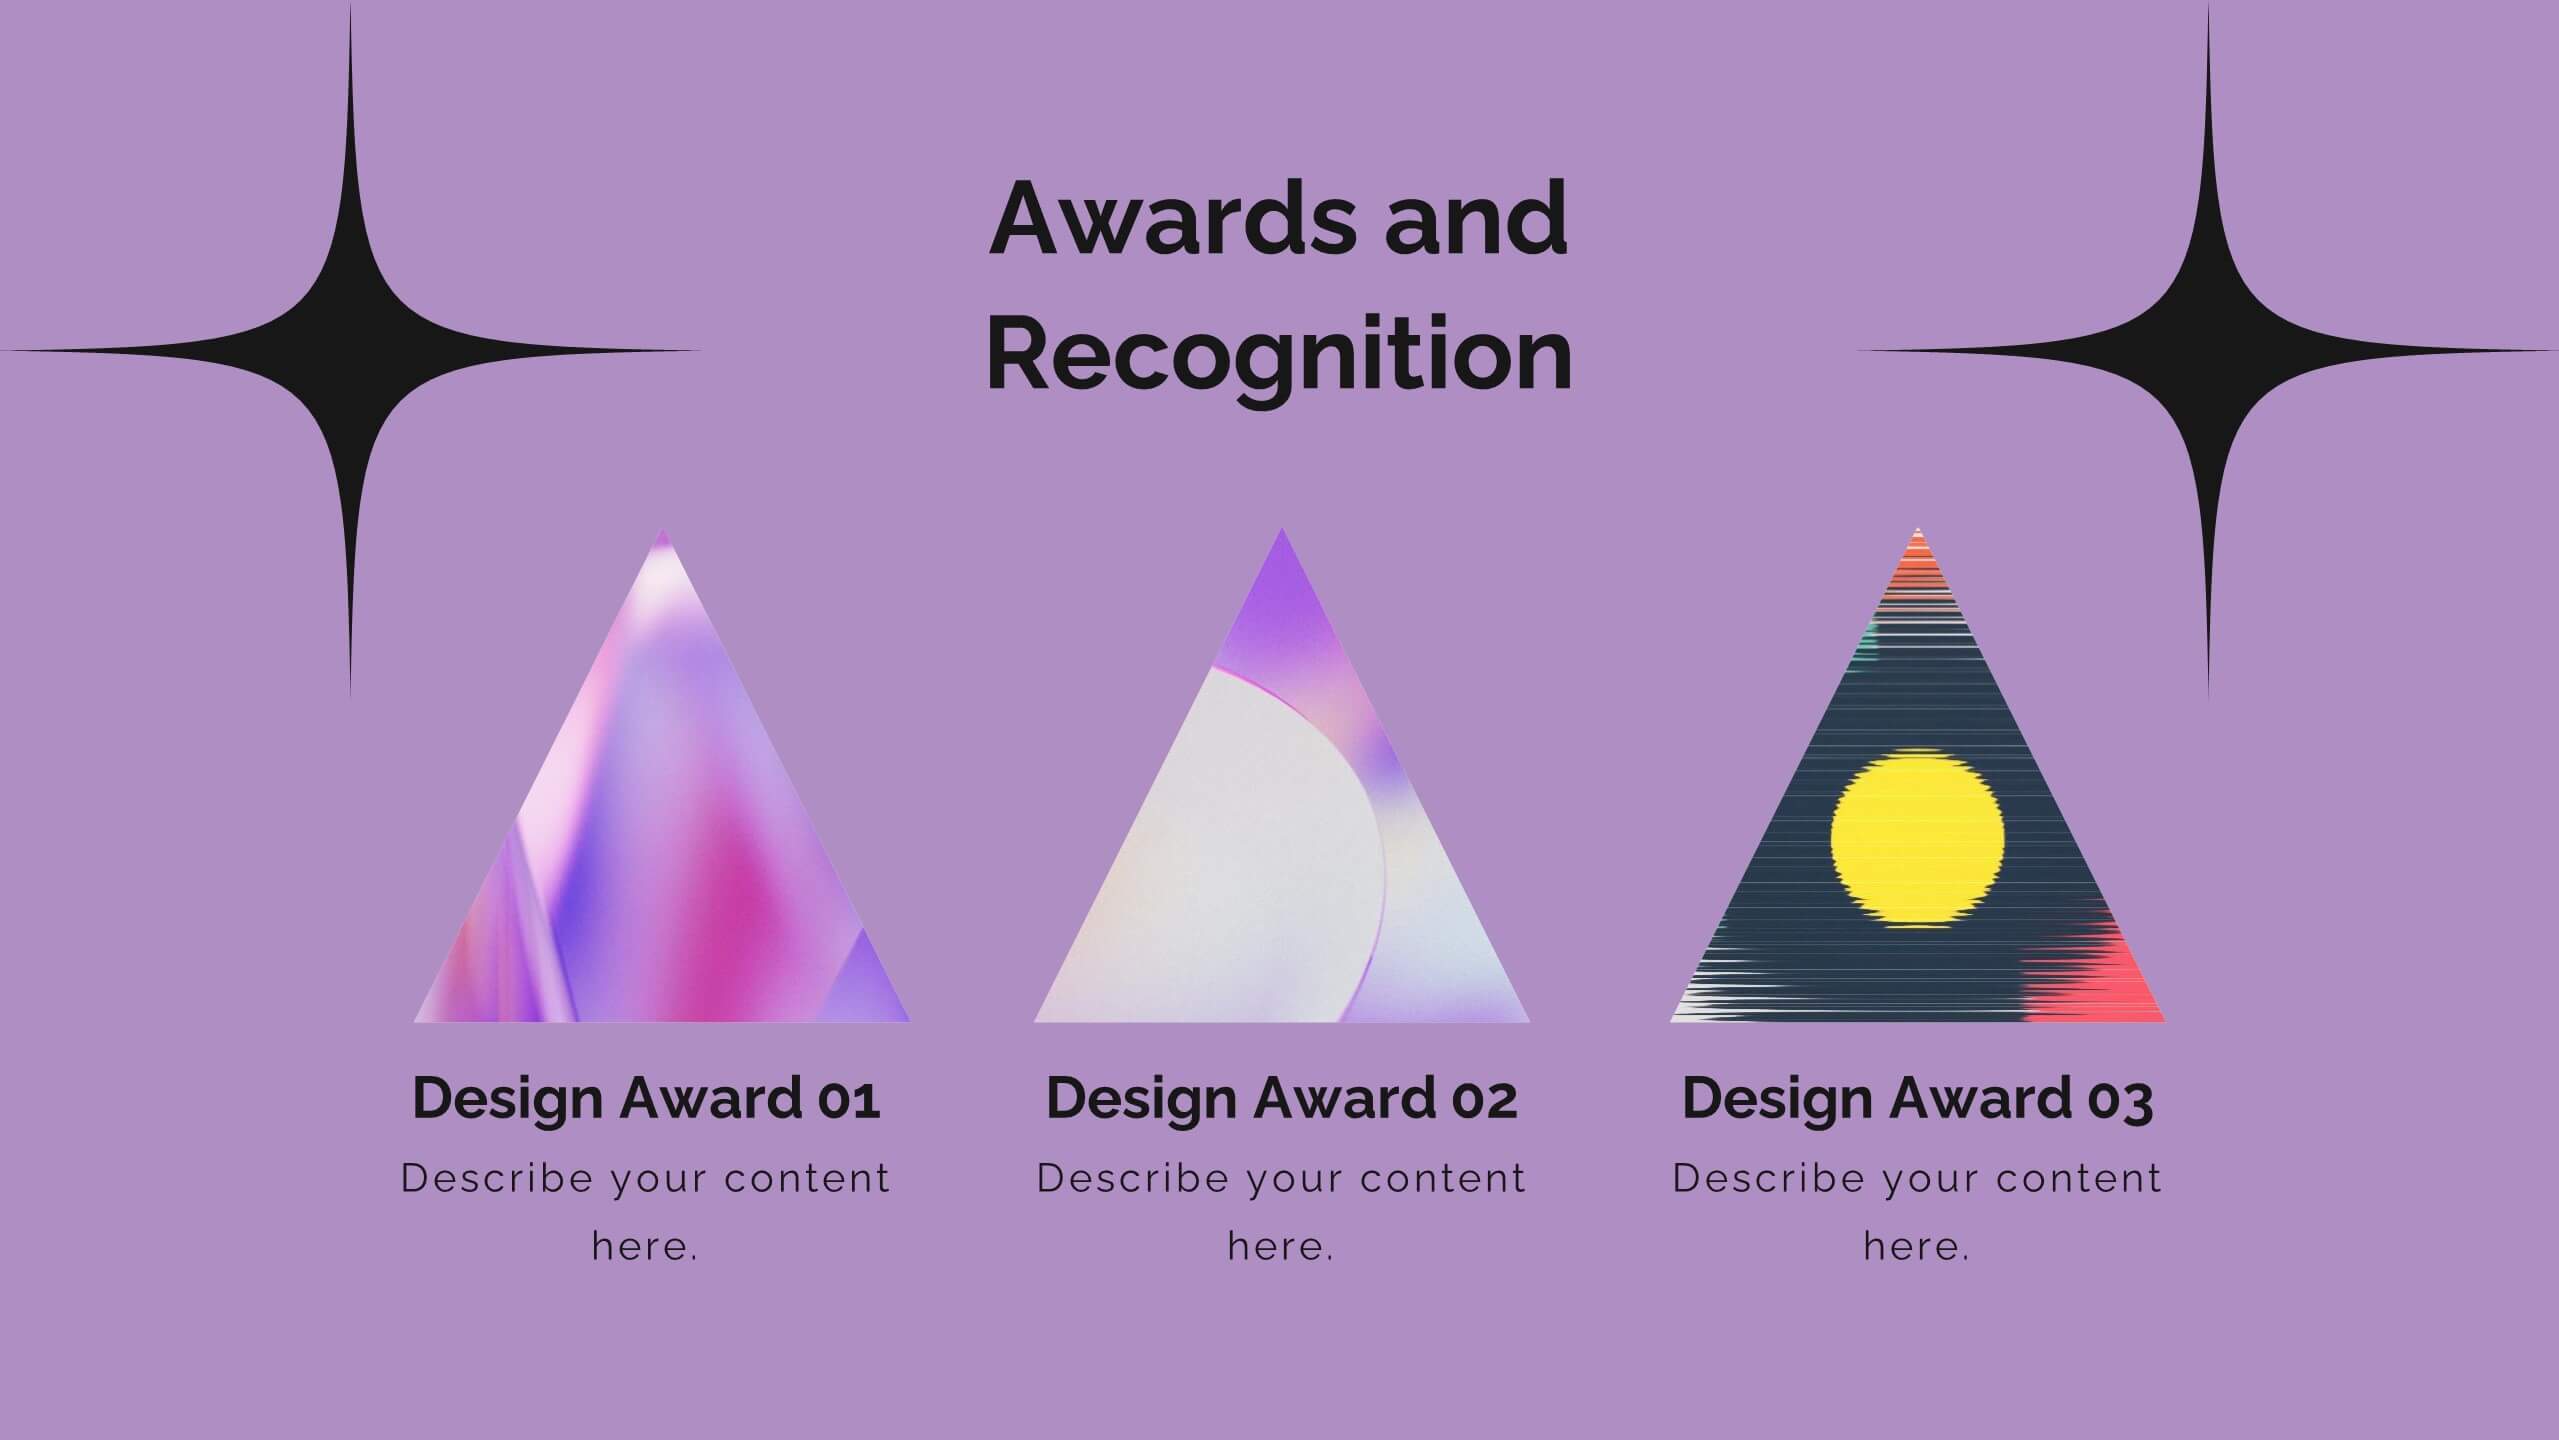
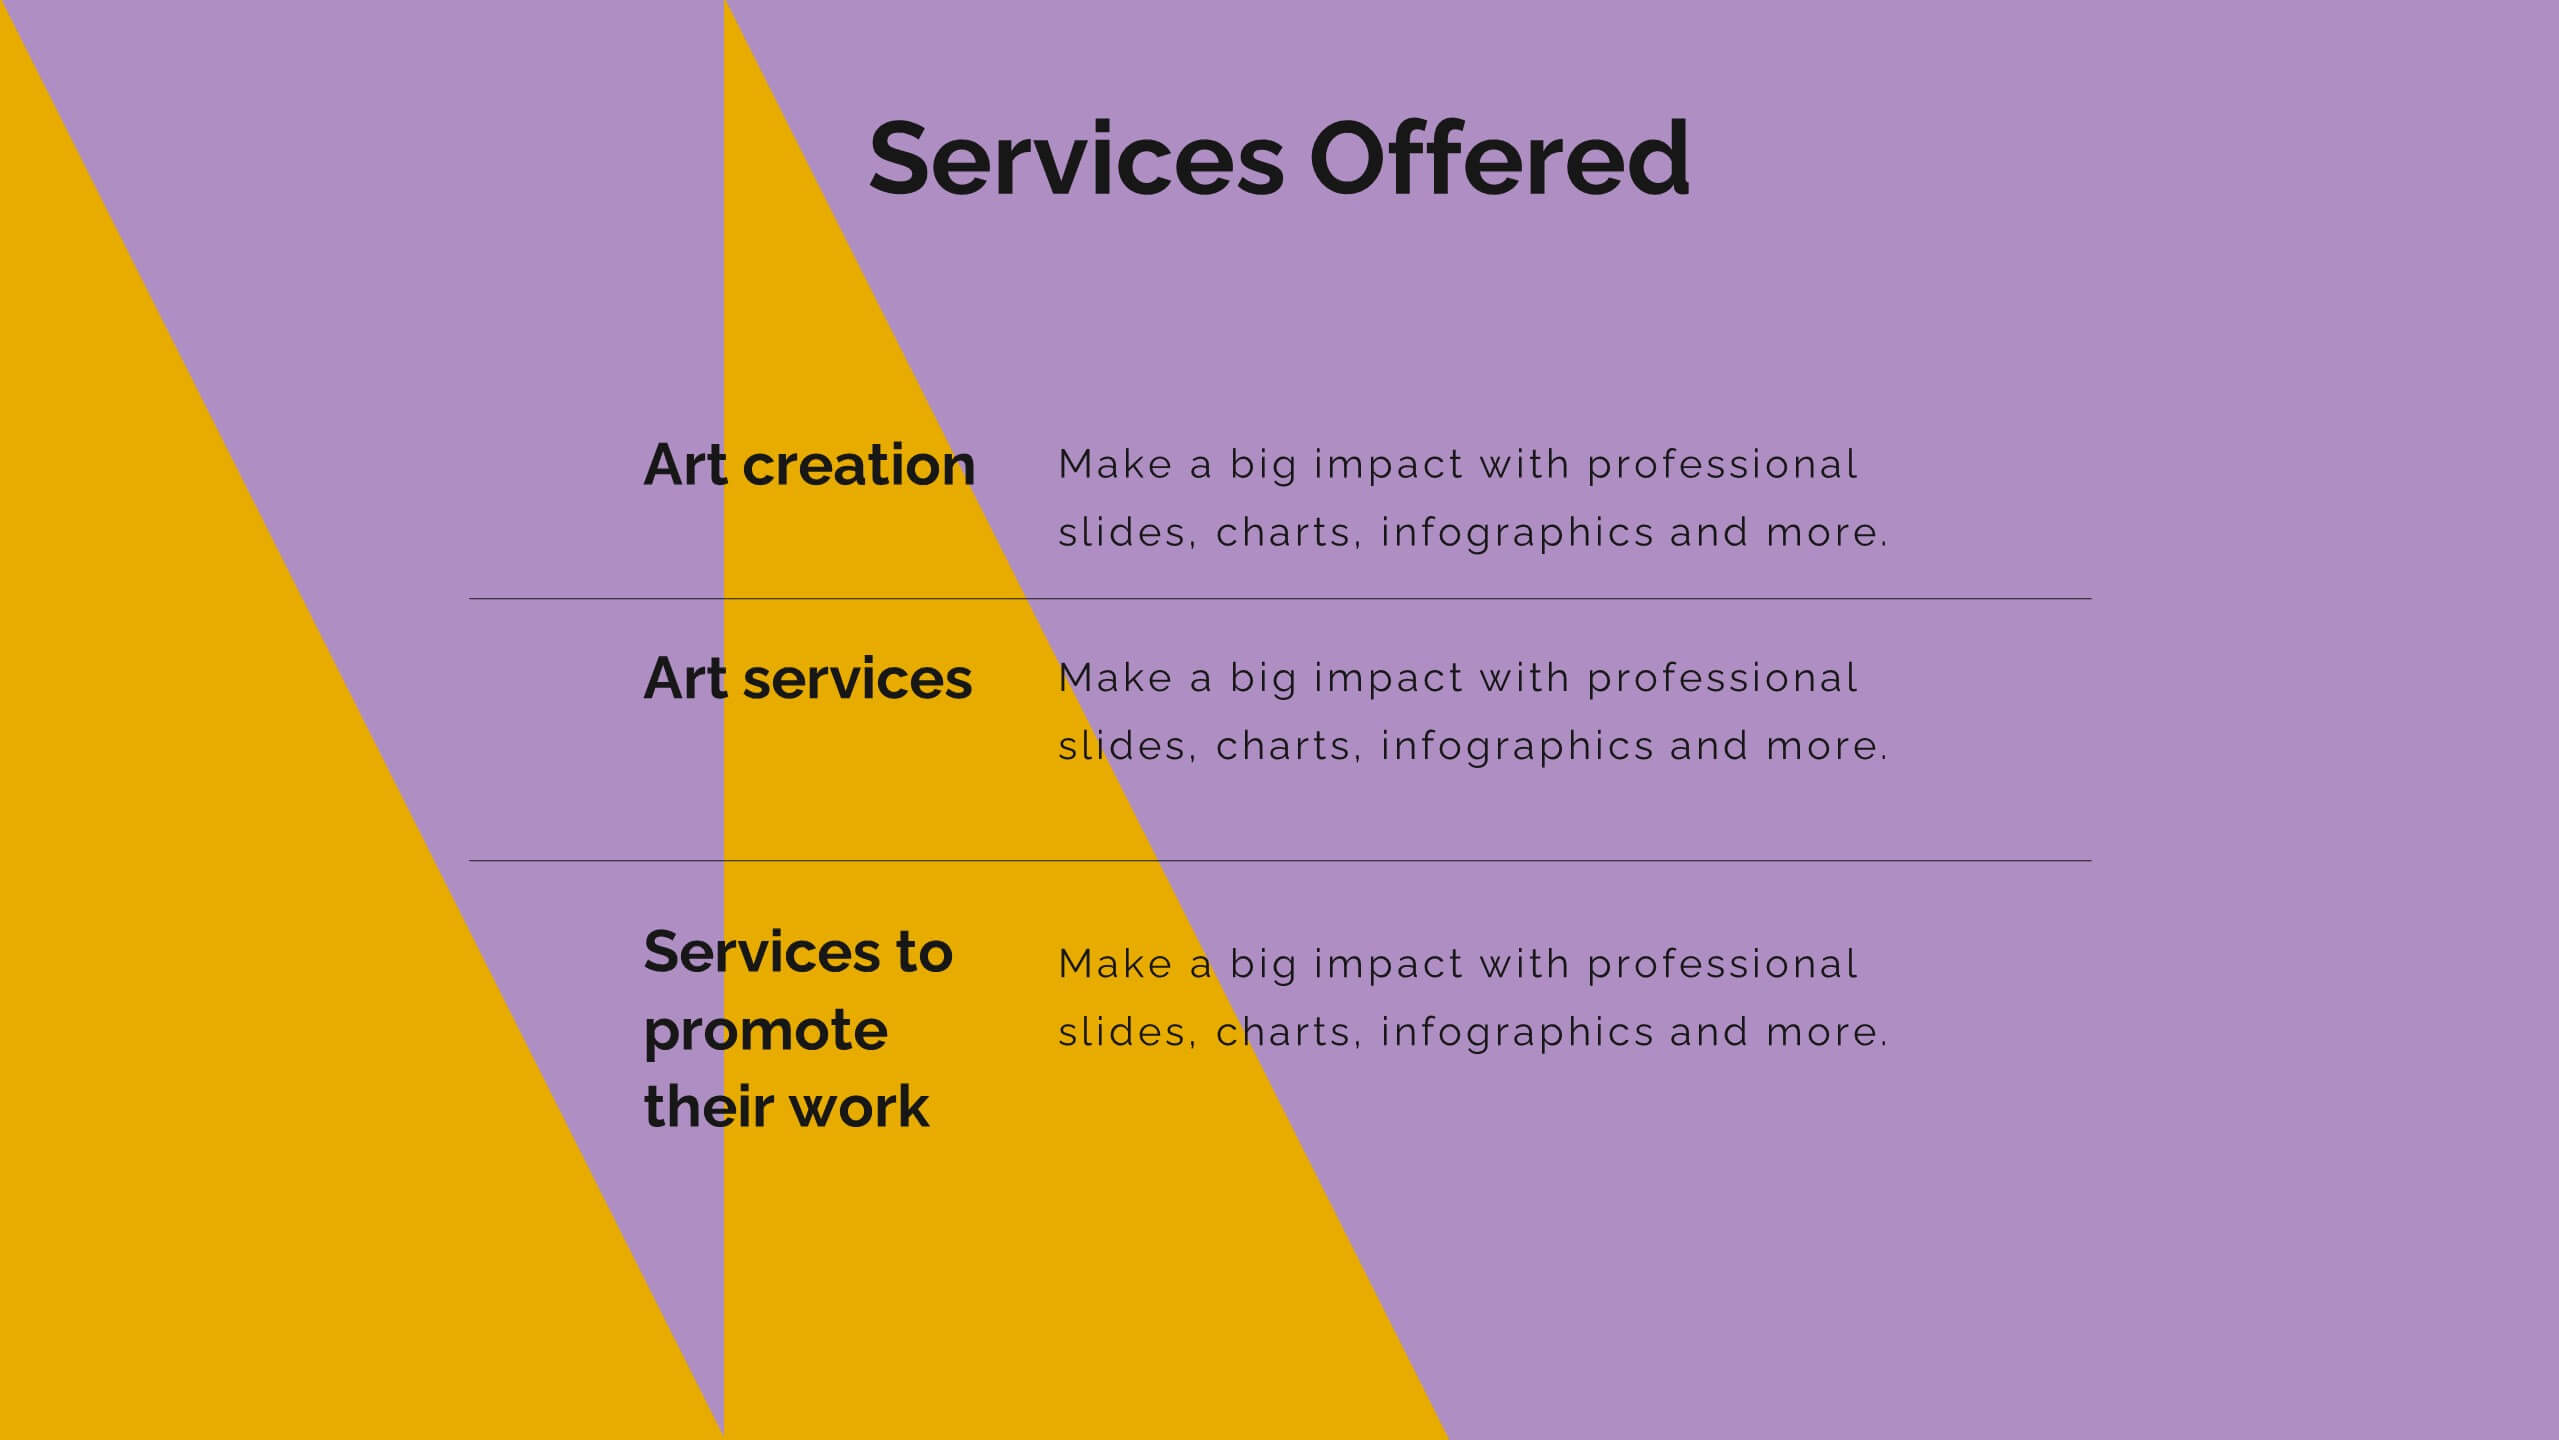
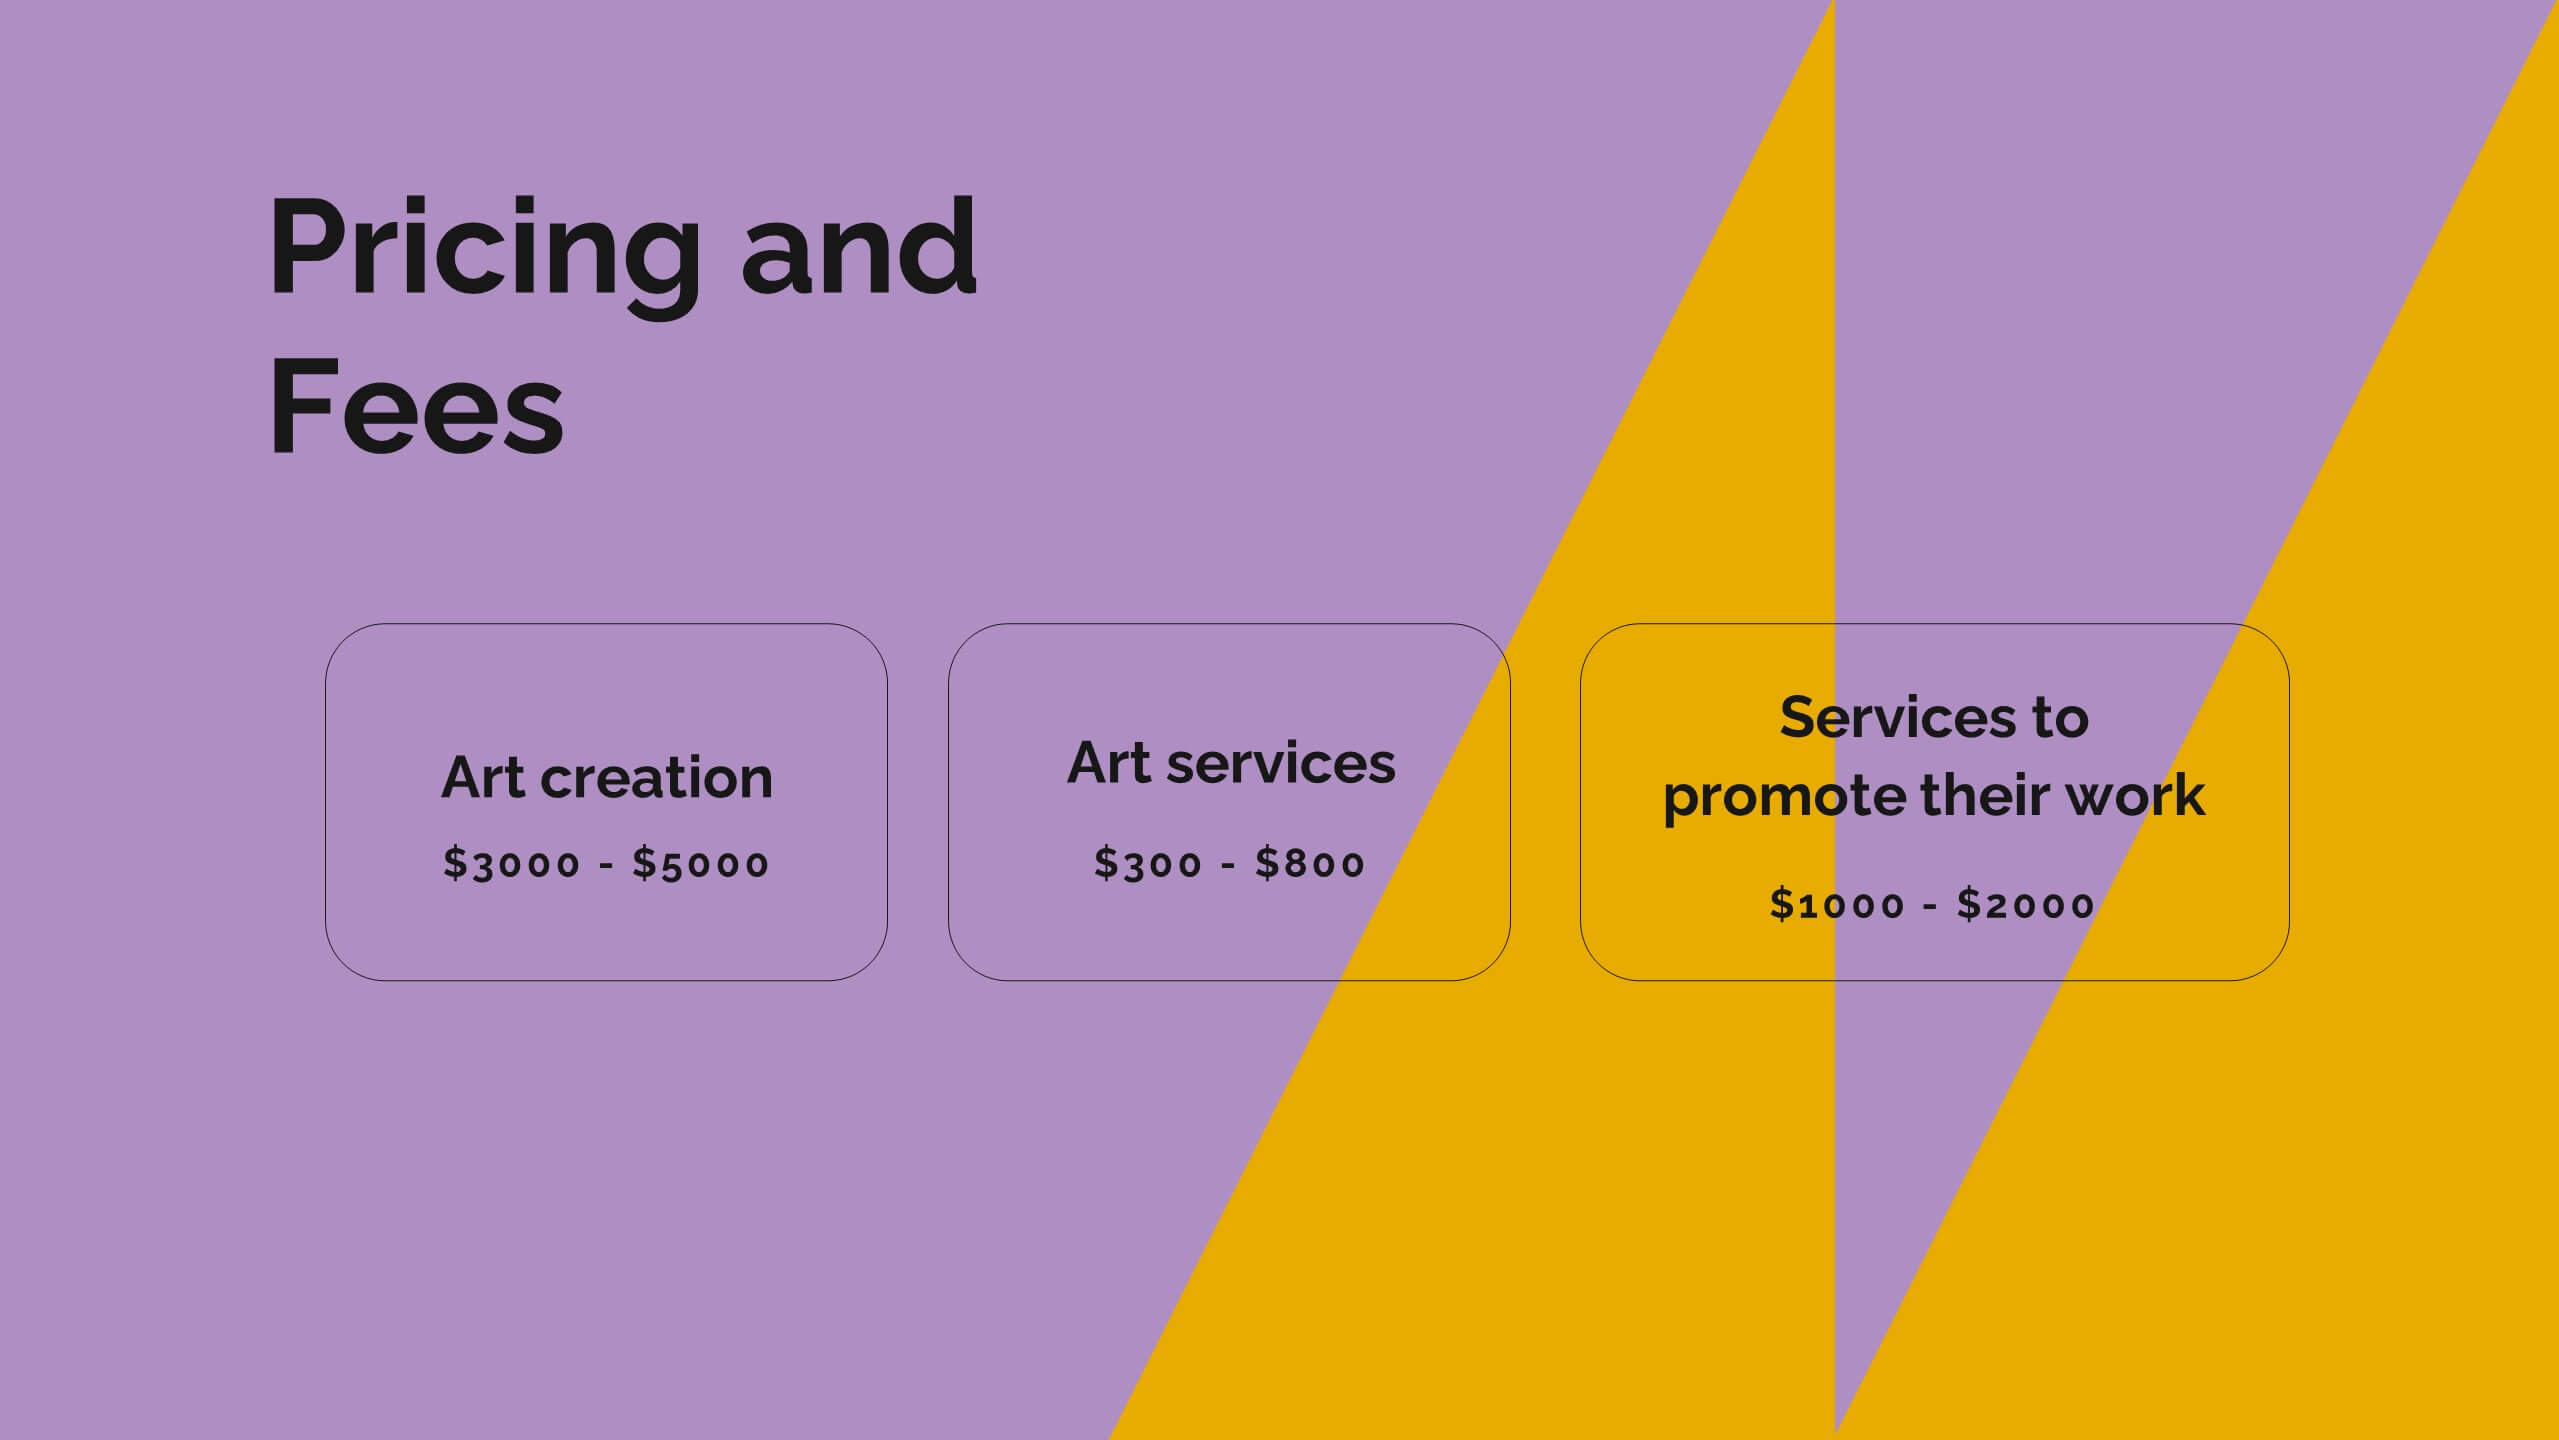
Goldenshadow Professional Portfolio Showcase Presentation
A refined portfolio presentation template crafted to highlight professional achievements and expertise. Showcase featured projects, collaborations, and client testimonials with a sleek, modern design. Includes sections for services offered, awards, pricing, and contact information. Fully customizable and compatible with PowerPoint, Keynote, and Google Slides for impactful portfolio presentations.


6 slides
Africa Population Map Infographics
Discover the flexibility of our Africa Population Map infographic template, a dynamic tool for illustrating population distribution across the African continent. This template is compatible with widely used presentation software like PowerPoint, Keynote, and Google Slides, allowing you to effortlessly customize it according to your specific requirements. The Africa Population Map infographic template provides a solid foundation for visualizing population data, highlighting densely populated areas, urban centers, and demographic trends. Whether you're an educator, researcher, or simply curious about Africa's demographics, this template offers a user-friendly platform to create engaging presentations and informative materials. Impress your audience with this SEO-optimized Africa Population Map infographic template, thoughtfully designed for clarity and ease of use. Tailor it to showcase population variations, growth patterns, and regional insights, making it a valuable asset for your projects and presentations. Start crafting your personalized infographic today!


2 slides
Modern Title Slide for Presentation
Make a strong first impression with this Modern Title Slide design. Its bold typography, dual-tone layout, and customizable accent icons create a clean, contemporary aesthetic. Perfect for professional and creative presentations alike. Editable in PowerPoint, Keynote, and Google Slides.


6 slides
Blue Ocean Trade Infographic
The Blue Ocean strategy is a concept that focuses on creating uncontested market spaces rather than competing in existing market segments. This captivating infographic template showcases the concept of blue ocean trade and its impact on business growth and innovation. It provides an engaging and informative overview of the blue ocean strategy, highlighting its key principles and benefits for businesses. This template provides a comprehensive overview of blue ocean trade and serves as an inspiring resource for those seeking innovative business strategies. Fully compatible with Powerpoint, keynote, and Google Slides.


20 slides
Aether Marketing Research Report Presentation
The Marketing Research Report Presentation Template offers a sleek design with 20 fully customizable slides, ideal for presenting in-depth marketing insights. This template features sections for industry analysis, consumer behavior, emerging technologies, and marketing trends like SEO, social media, and influencer strategies. It also highlights e-commerce trends, personalization, sustainability, and storytelling techniques. The modern black-and-gold gradient aesthetic adds sophistication, making it perfect for professional reports. Compatible with PowerPoint, Keynote, and Google Slides, this template ensures a polished and engaging presentation experience.


7 slides
Business People Management Infographic
Business people refer to individuals involved in the world of commerce and trade, encompassing various roles within the business landscape. This Infographic is an illuminating and dynamic template designed to guide you through the art and science of managing human capital within the business sphere. Explore the key aspects of effective people management and elevate your organizational success by harnessing the power of your workforce. Compatible with Powerpoint, Keynote, and Google Slides. Discover the art of leading and engaging your team, and witness the transformation as your organization excels and grows, driven by the power of effective people management!