


Features
- 4 Unique slides
- Fully editable and easy to edit in Microsoft Powerpoint, Keynote and Google Slides
- 16:9 widescreen layout
- Clean and professional designs
- Export to JPG, PDF or send by email


Do you have any questions?
Recommend


22 slides
Arcflare Digital Agency Strategy Plan Presentation
Create a powerful strategy with this digital agency plan presentation! It features key sections like market analysis, industry trends, campaign execution, and client testimonials, helping you communicate your approach clearly. Perfect for strategy meetings or client pitches, this template is fully compatible with PowerPoint, Keynote, and Google Slides.


12 slides
Compliance and Policy Management Presentation
Visualize your compliance ecosystem with the Compliance and Policy Management Presentation. Designed around a planetary orbit concept, this slide maps core policies at the center with surrounding regulations and enforcement layers. Each orbit can represent levels of governance, department roles, or regulatory zones—making it ideal for risk teams, auditors, and legal advisors. Fully customizable in PowerPoint, Keynote, and Google Slides for seamless use.


4 slides
Leadership Training Framework Presentation
Inspire growth and guide your team toward success with this clear and modern presentation layout. Designed to illustrate leadership principles, development stages, and coaching strategies, it helps communicate training goals with professionalism and ease. Fully customizable and compatible with PowerPoint, Keynote, and Google Slides for seamless use across platforms.


7 slides
Agenda for Change Infographic
Our agenda slides for change initiatives are meticulously designed to support organizations in outlining and managing transformational meetings. Each slide is crafted to guide discussion and decision-making processes that are essential for successful change management. These templates feature structured layouts to help you present the steps of the change process, from inception to execution. With elements like timelines, checklists, and progress bars, these slides make it easy to communicate the sequence of activities, key milestones, and responsibilities. The use of clean lines, subtle colors, and modern typography ensures that the information is presented in an organized and professional manner, facilitating clear communication and effective engagement. Fully customizable, these agenda slides can be adapted to reflect your organizational branding and specific change management frameworks. They are ideal for use in strategic planning sessions, workshops, or regular team meetings where managing change is the agenda.


6 slides
Weekly Task Schedule Presentation
Stay on top of your week with this clean and efficient layout designed to organize daily priorities and action plans. Perfect for tracking goals, meetings, or team deliverables, it keeps productivity front and center. Fully customizable and compatible with PowerPoint, Keynote, and Google Slides for easy professional presentation use.


6 slides
Training Center Infographic
A training center is a facility or institution dedicated to providing education, skills development, and training to individuals or groups in various fields. This infographic provides a visual overview of the training programs, courses, and facilities offered by a training center. This template highlights the key information that potential learners or clients need to know. This infographic is fully customizable and compatible with Powerpoint, Keynote, and Google Slides. Allowing you to ensure that the colors, fonts, and graphics used align with your training center's branding.


4 slides
Insurance Market Trends
Track and present evolving market dynamics with this Insurance Market Trends presentation. Featuring clean, multi-point visual elements, this slide set is perfect for analysts, consultants, and insurance professionals aiming to highlight growth segments, percentages, or trend categories. Fully editable in PowerPoint, Keynote, and Google Slides.

23 slides
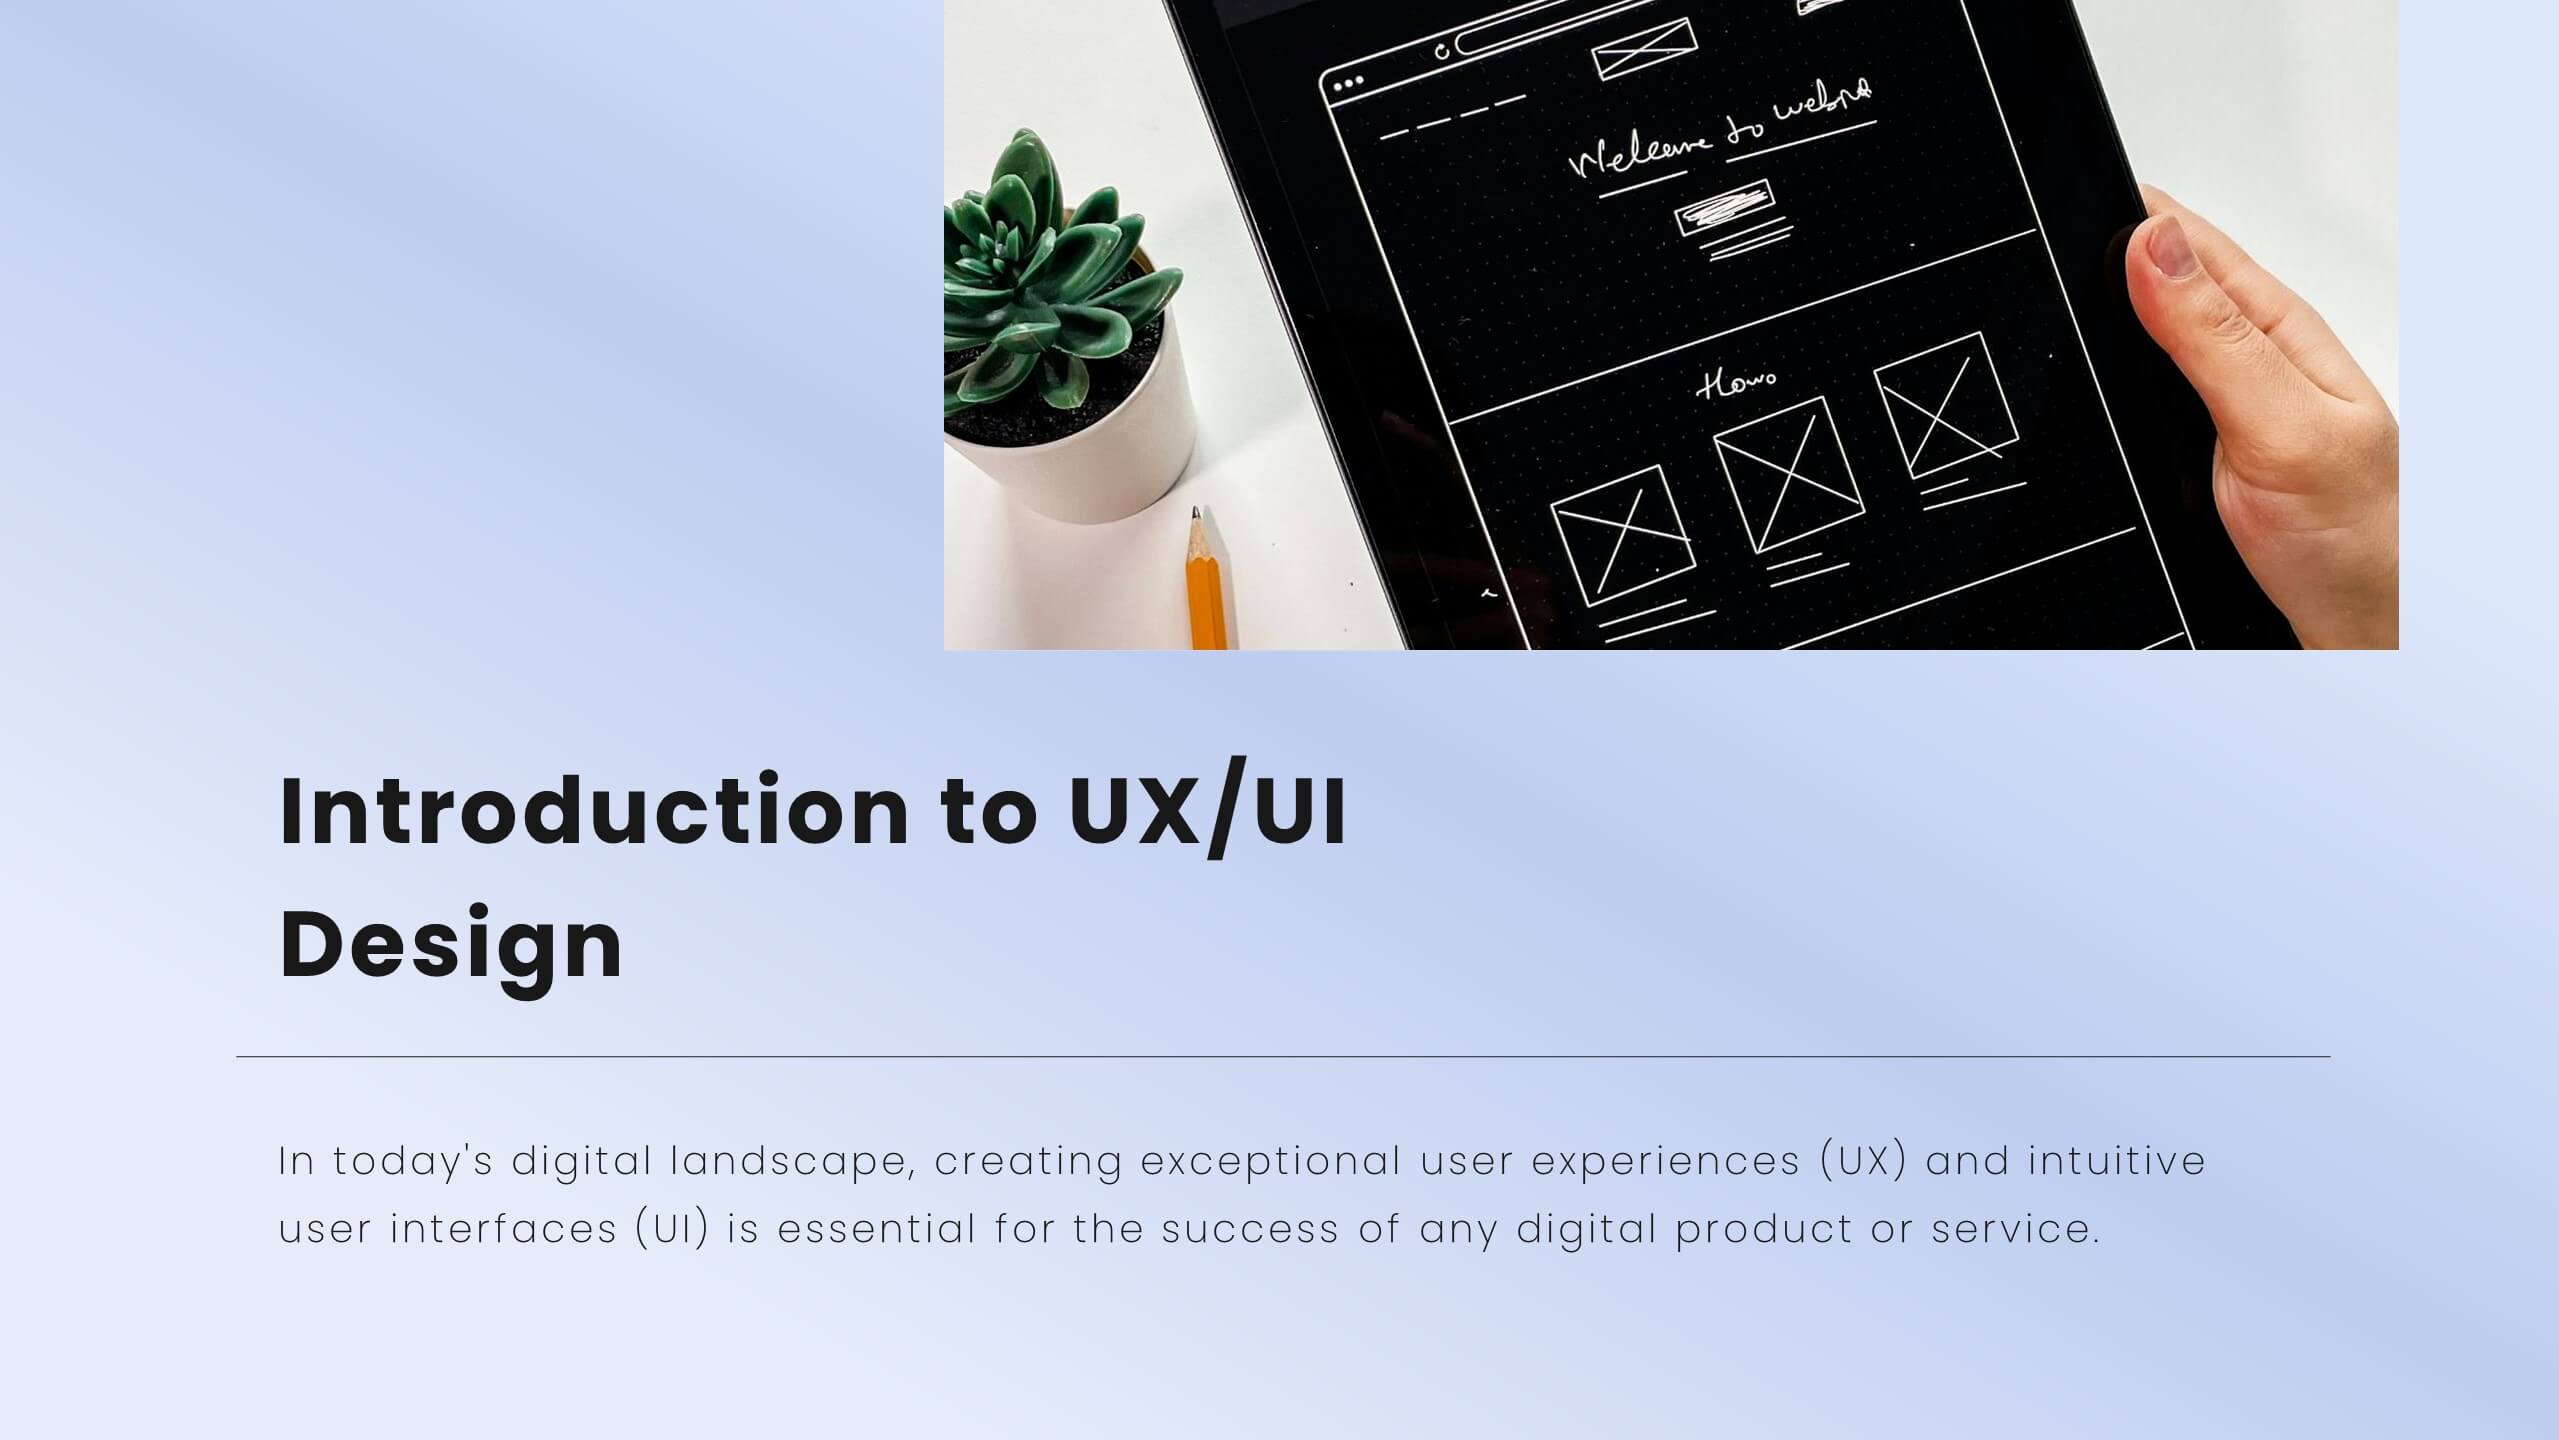
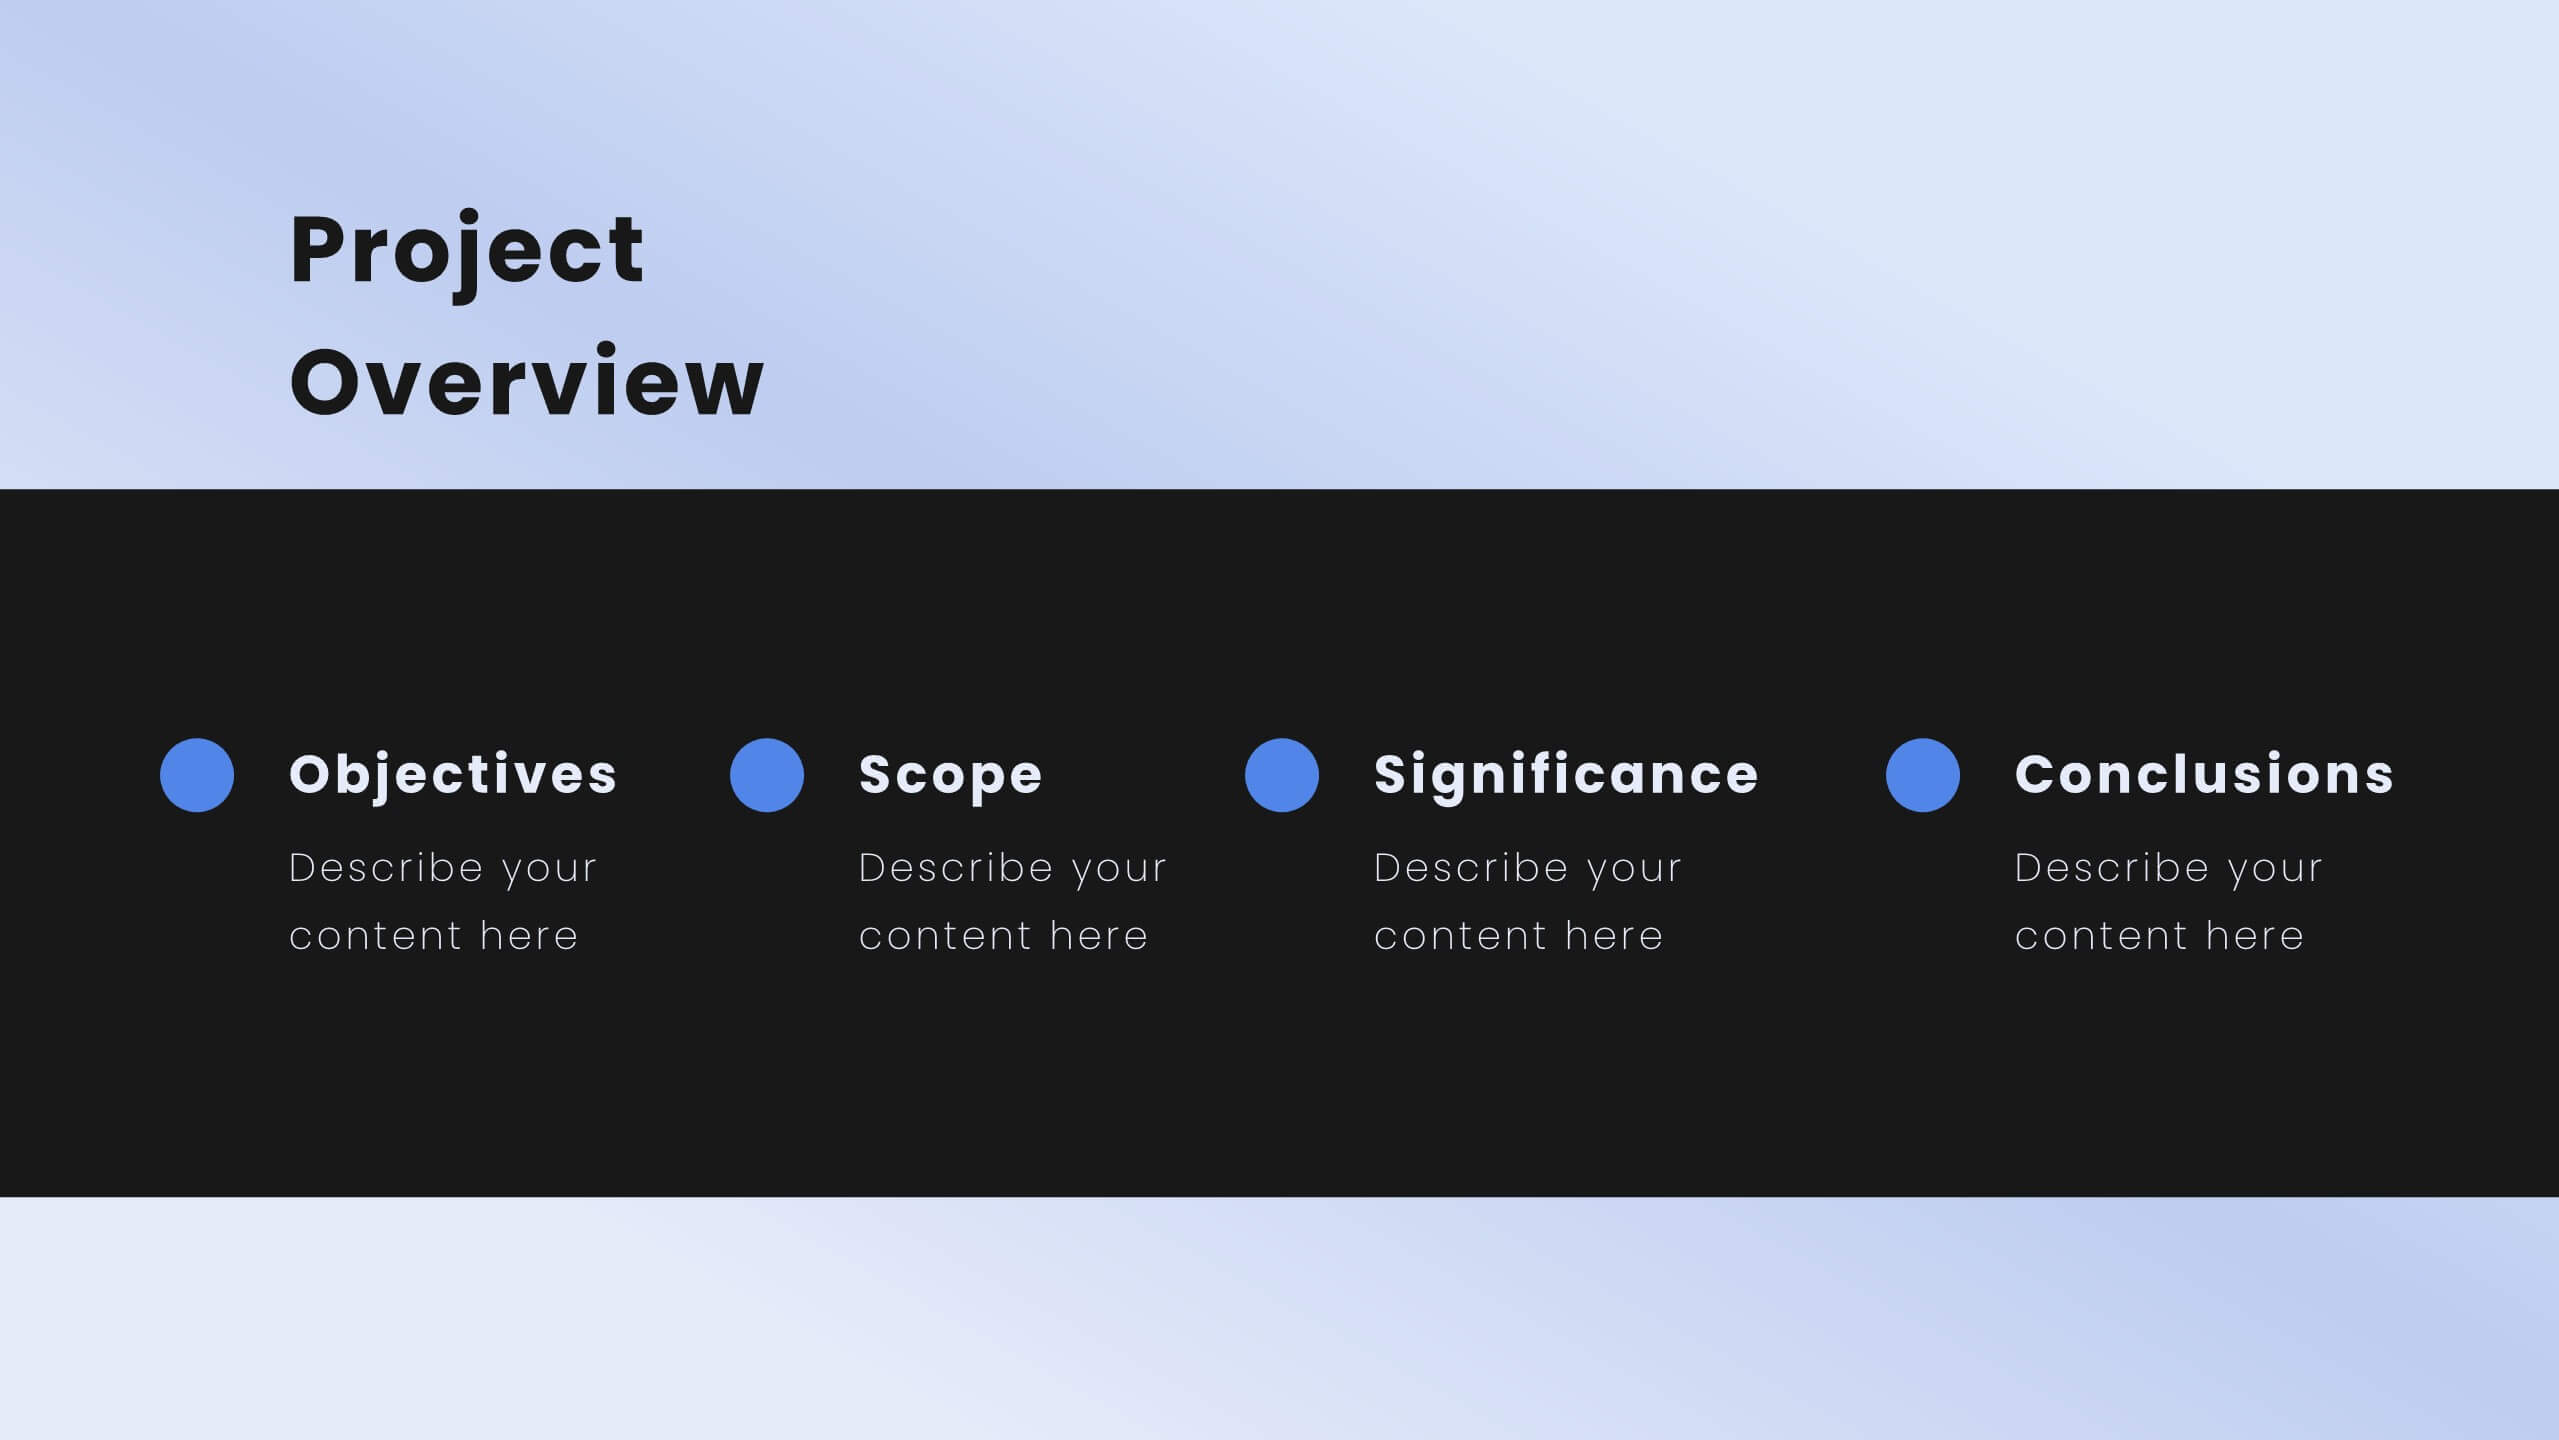
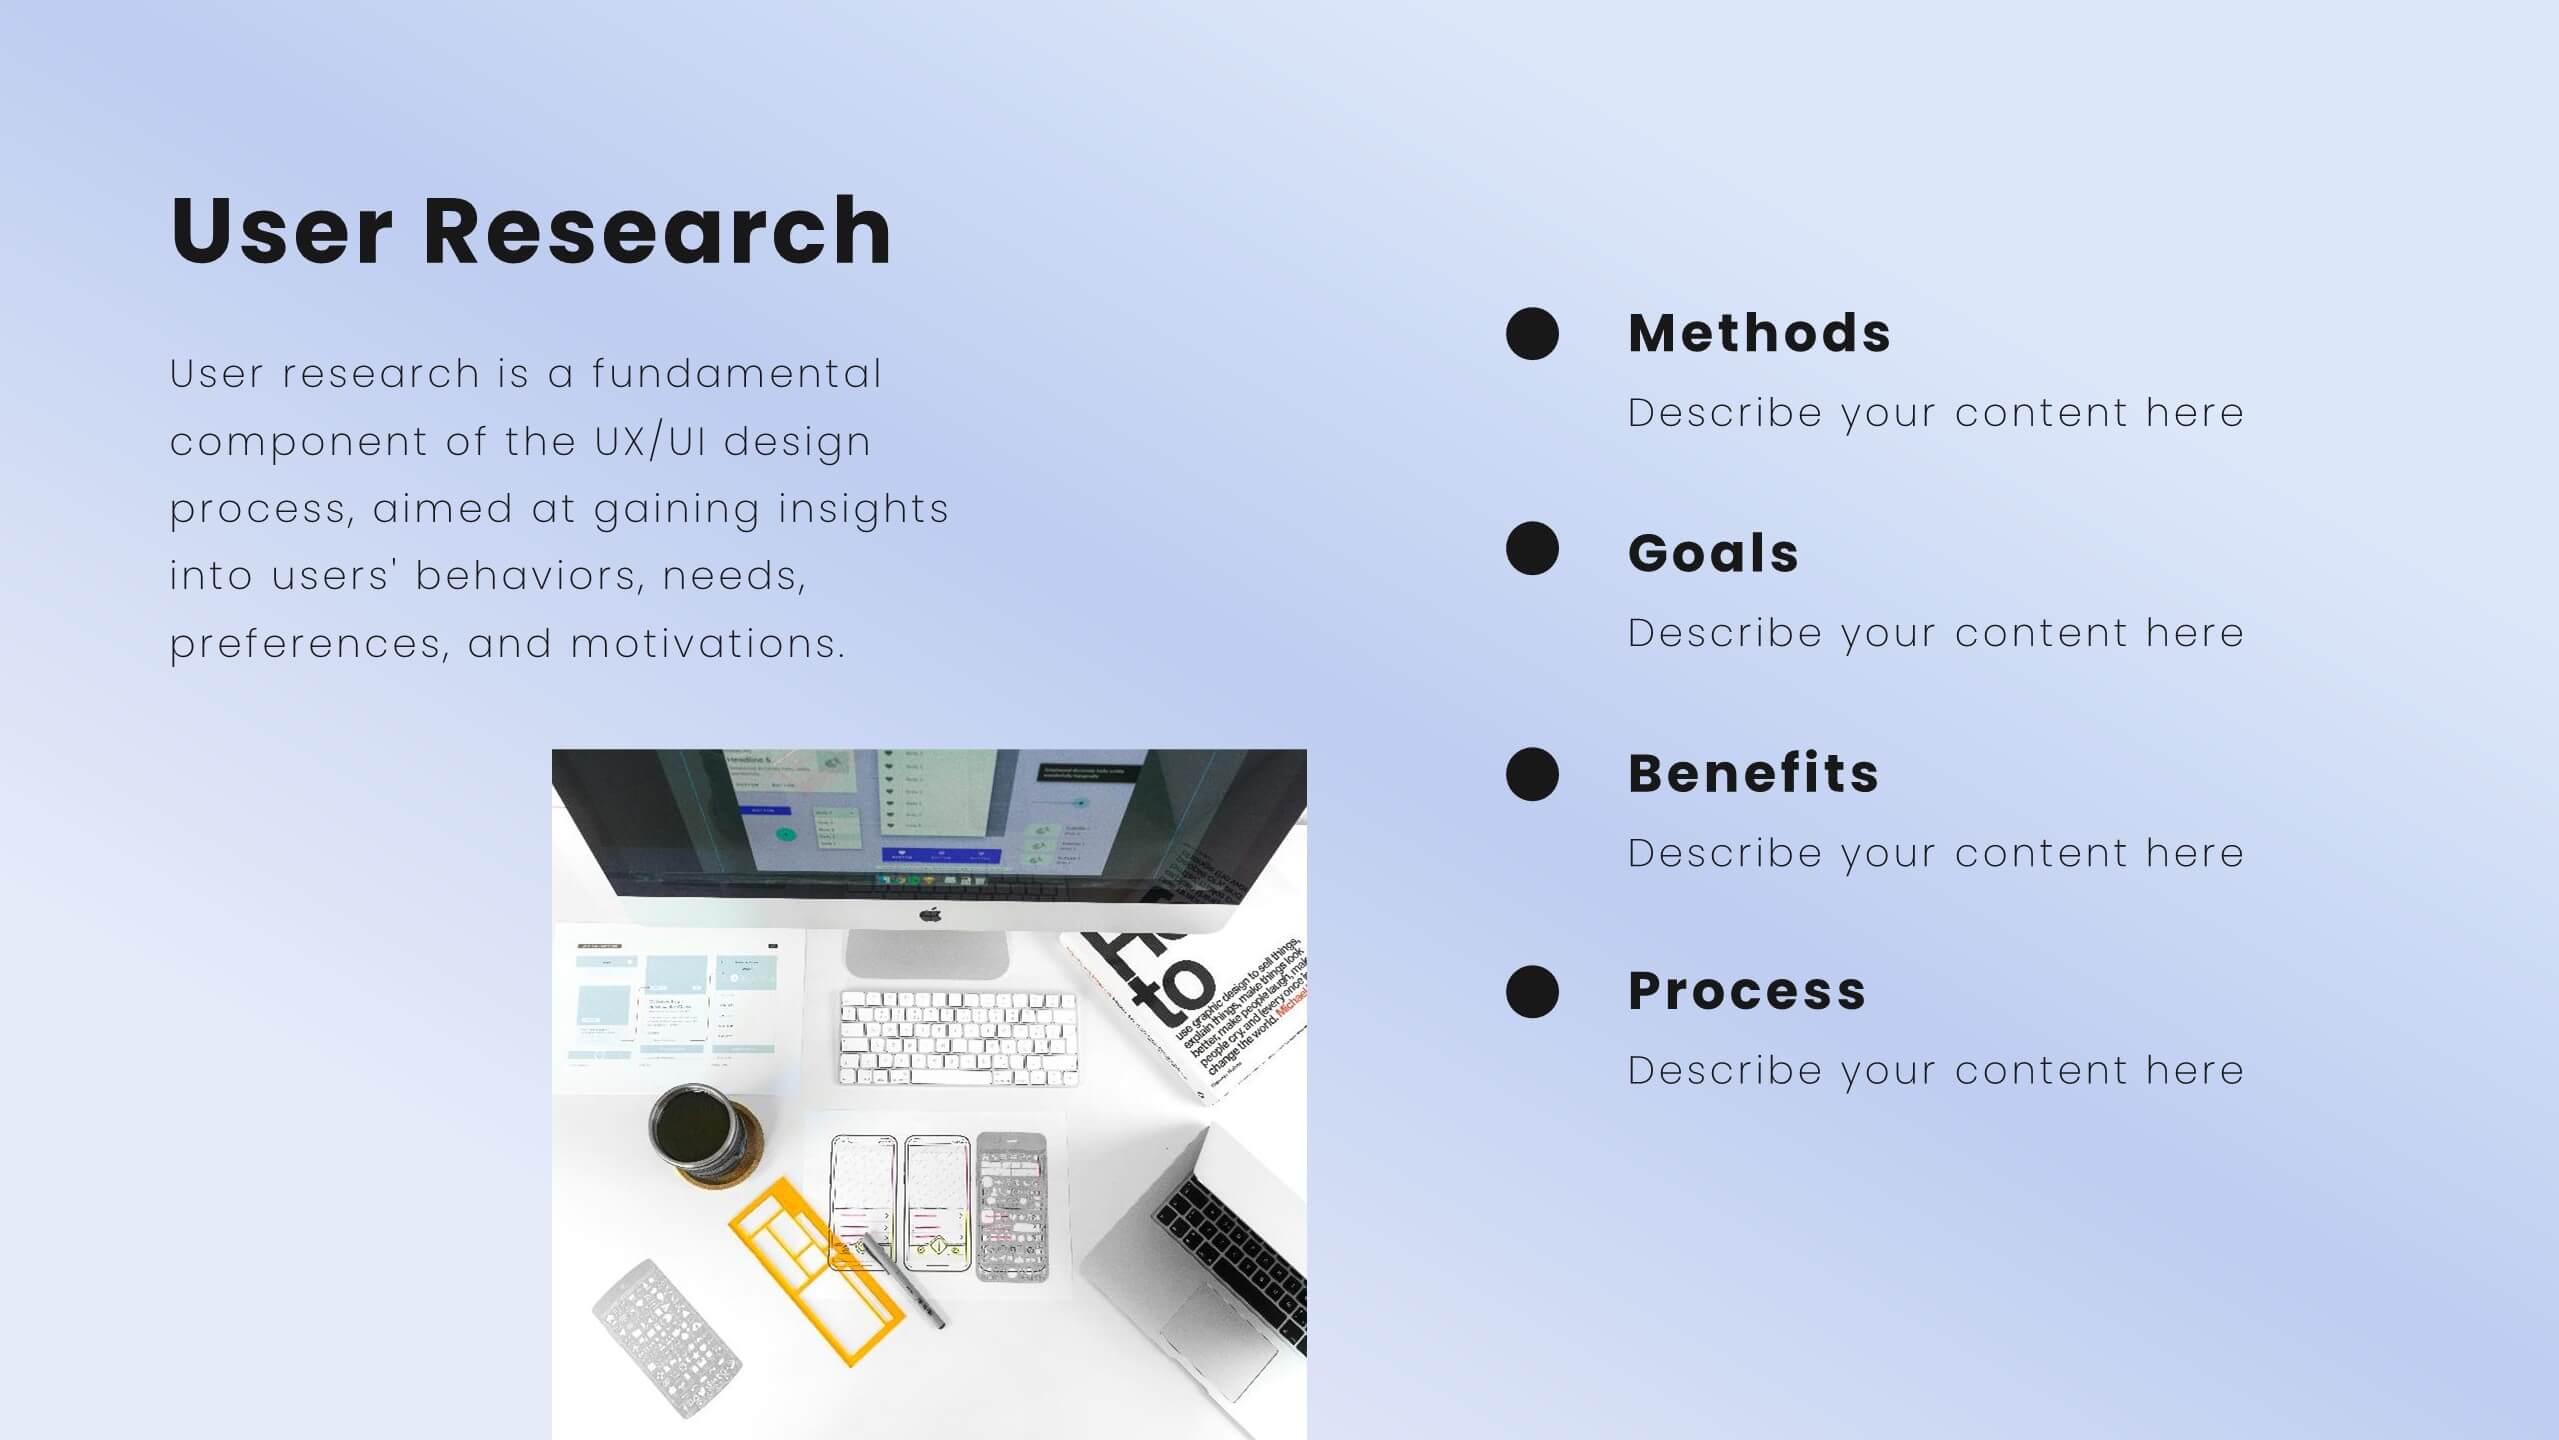
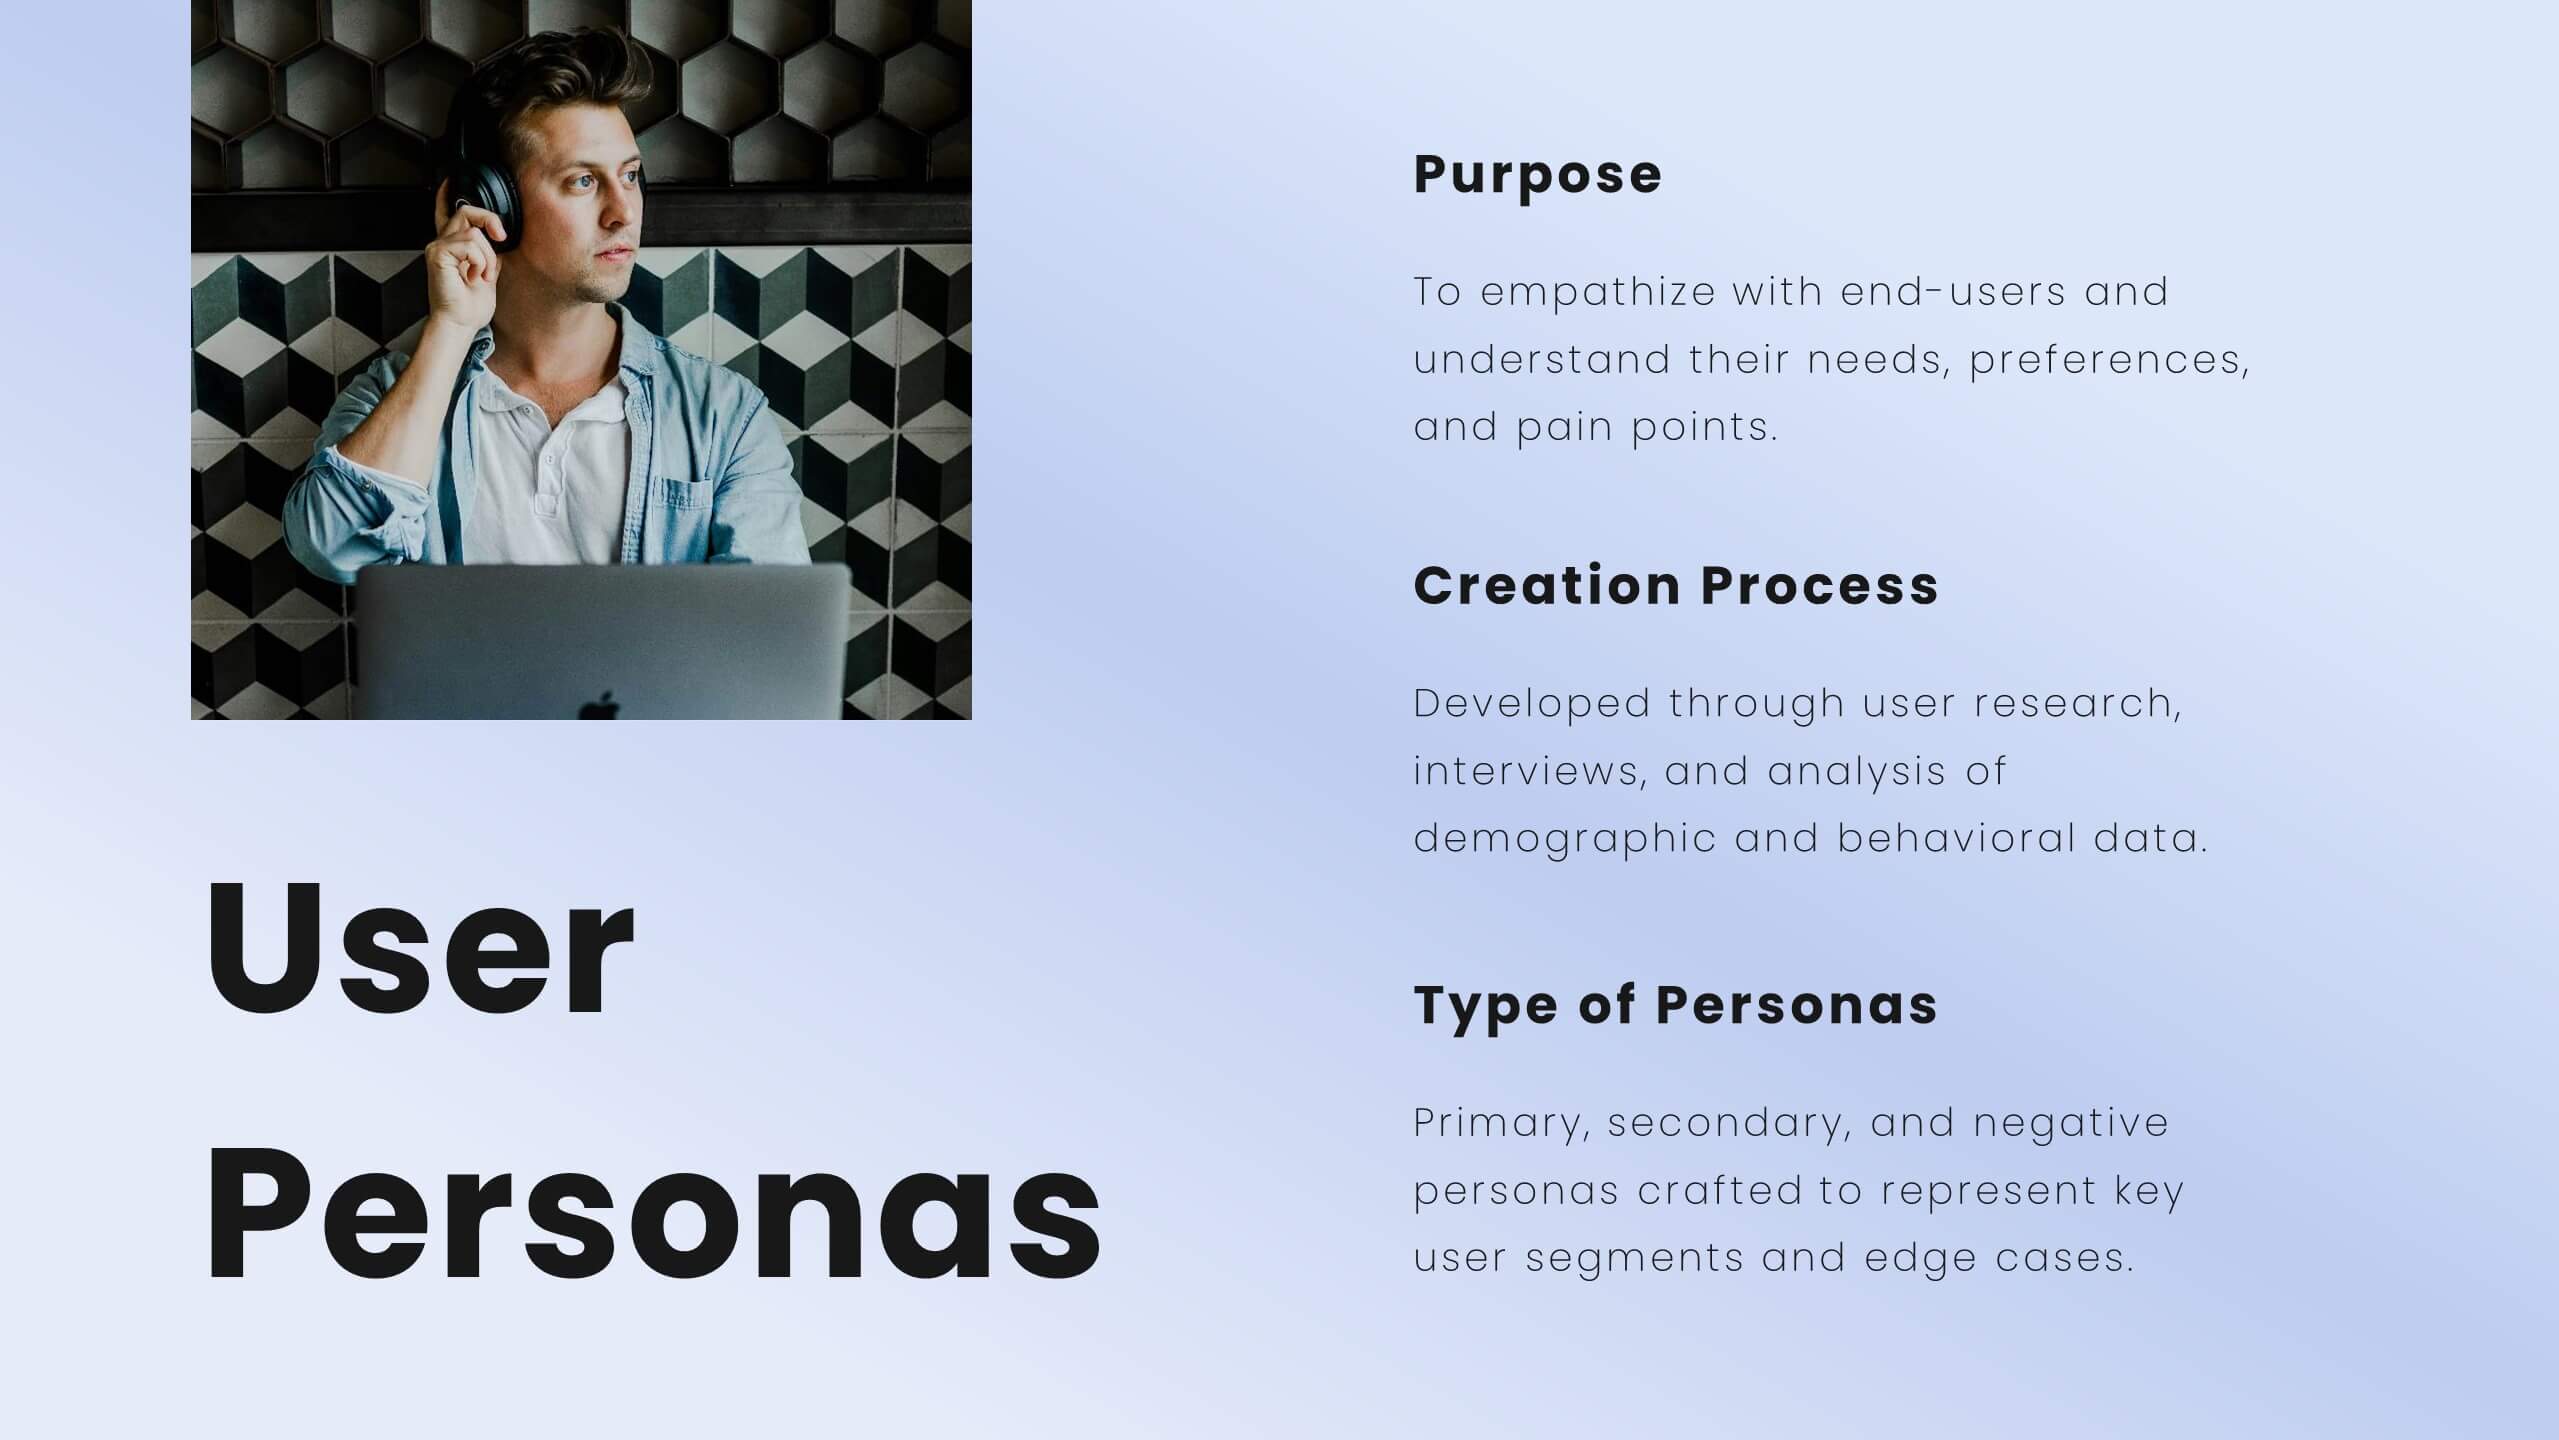
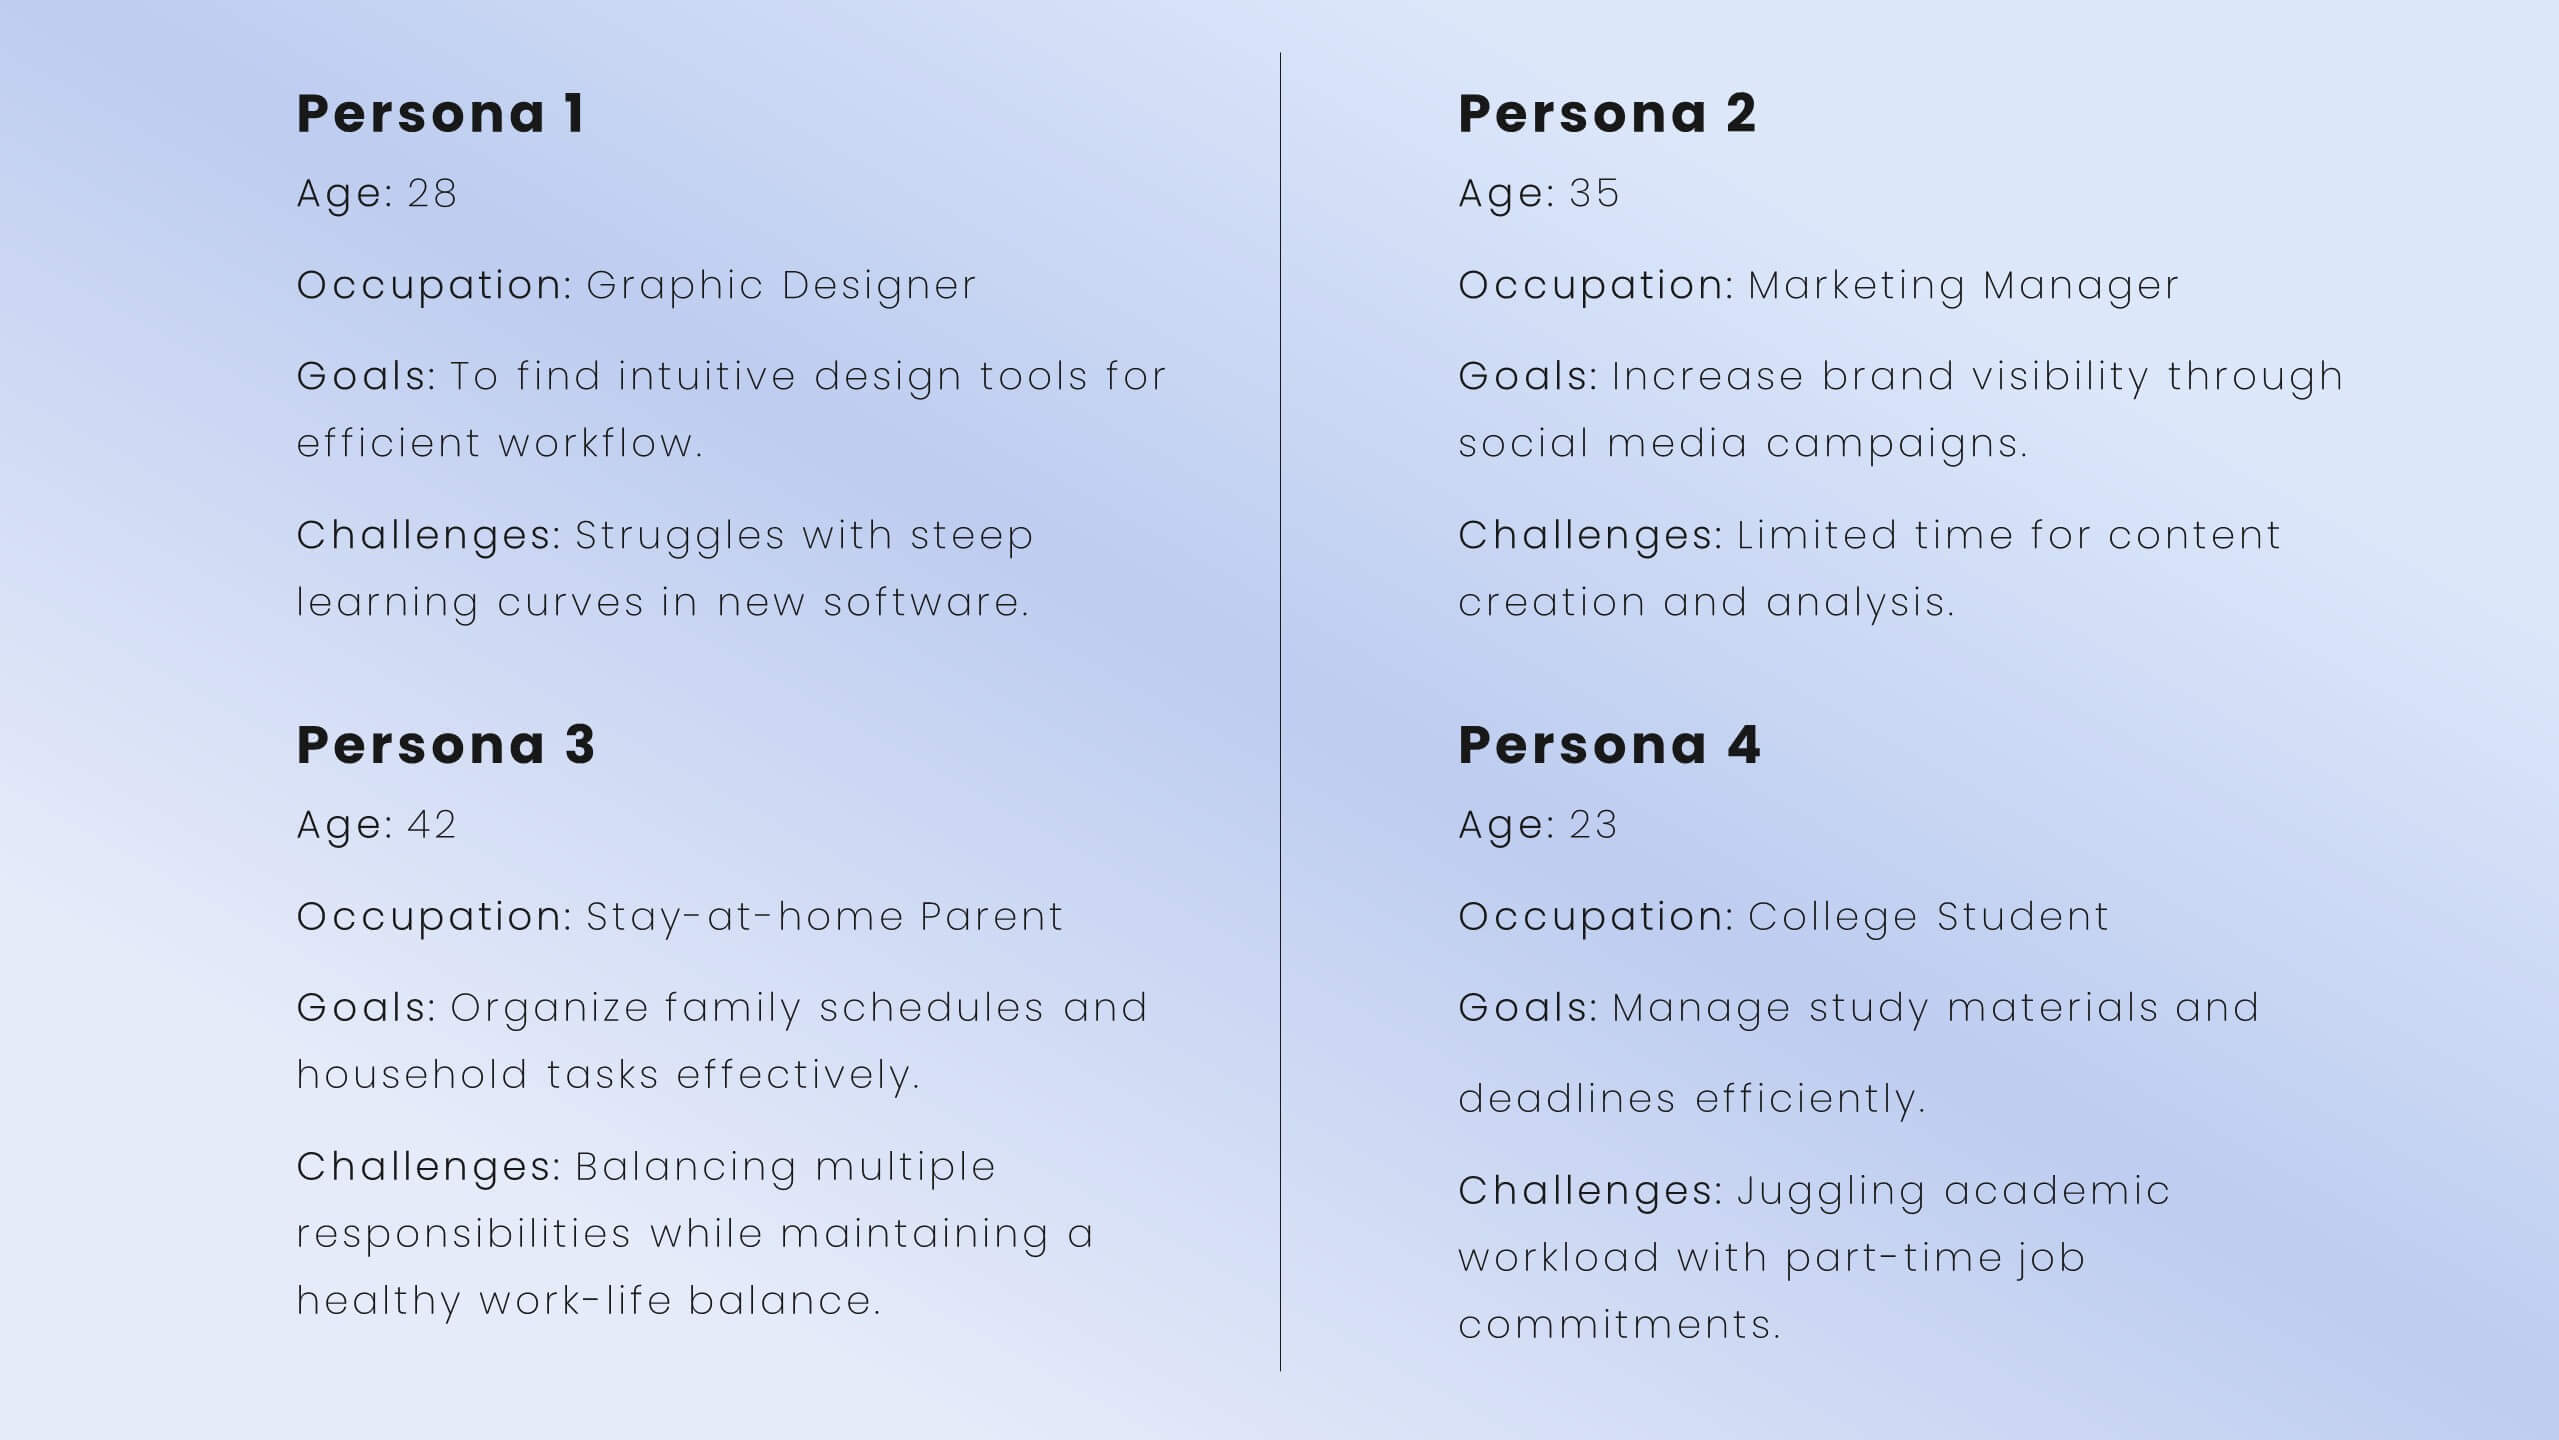
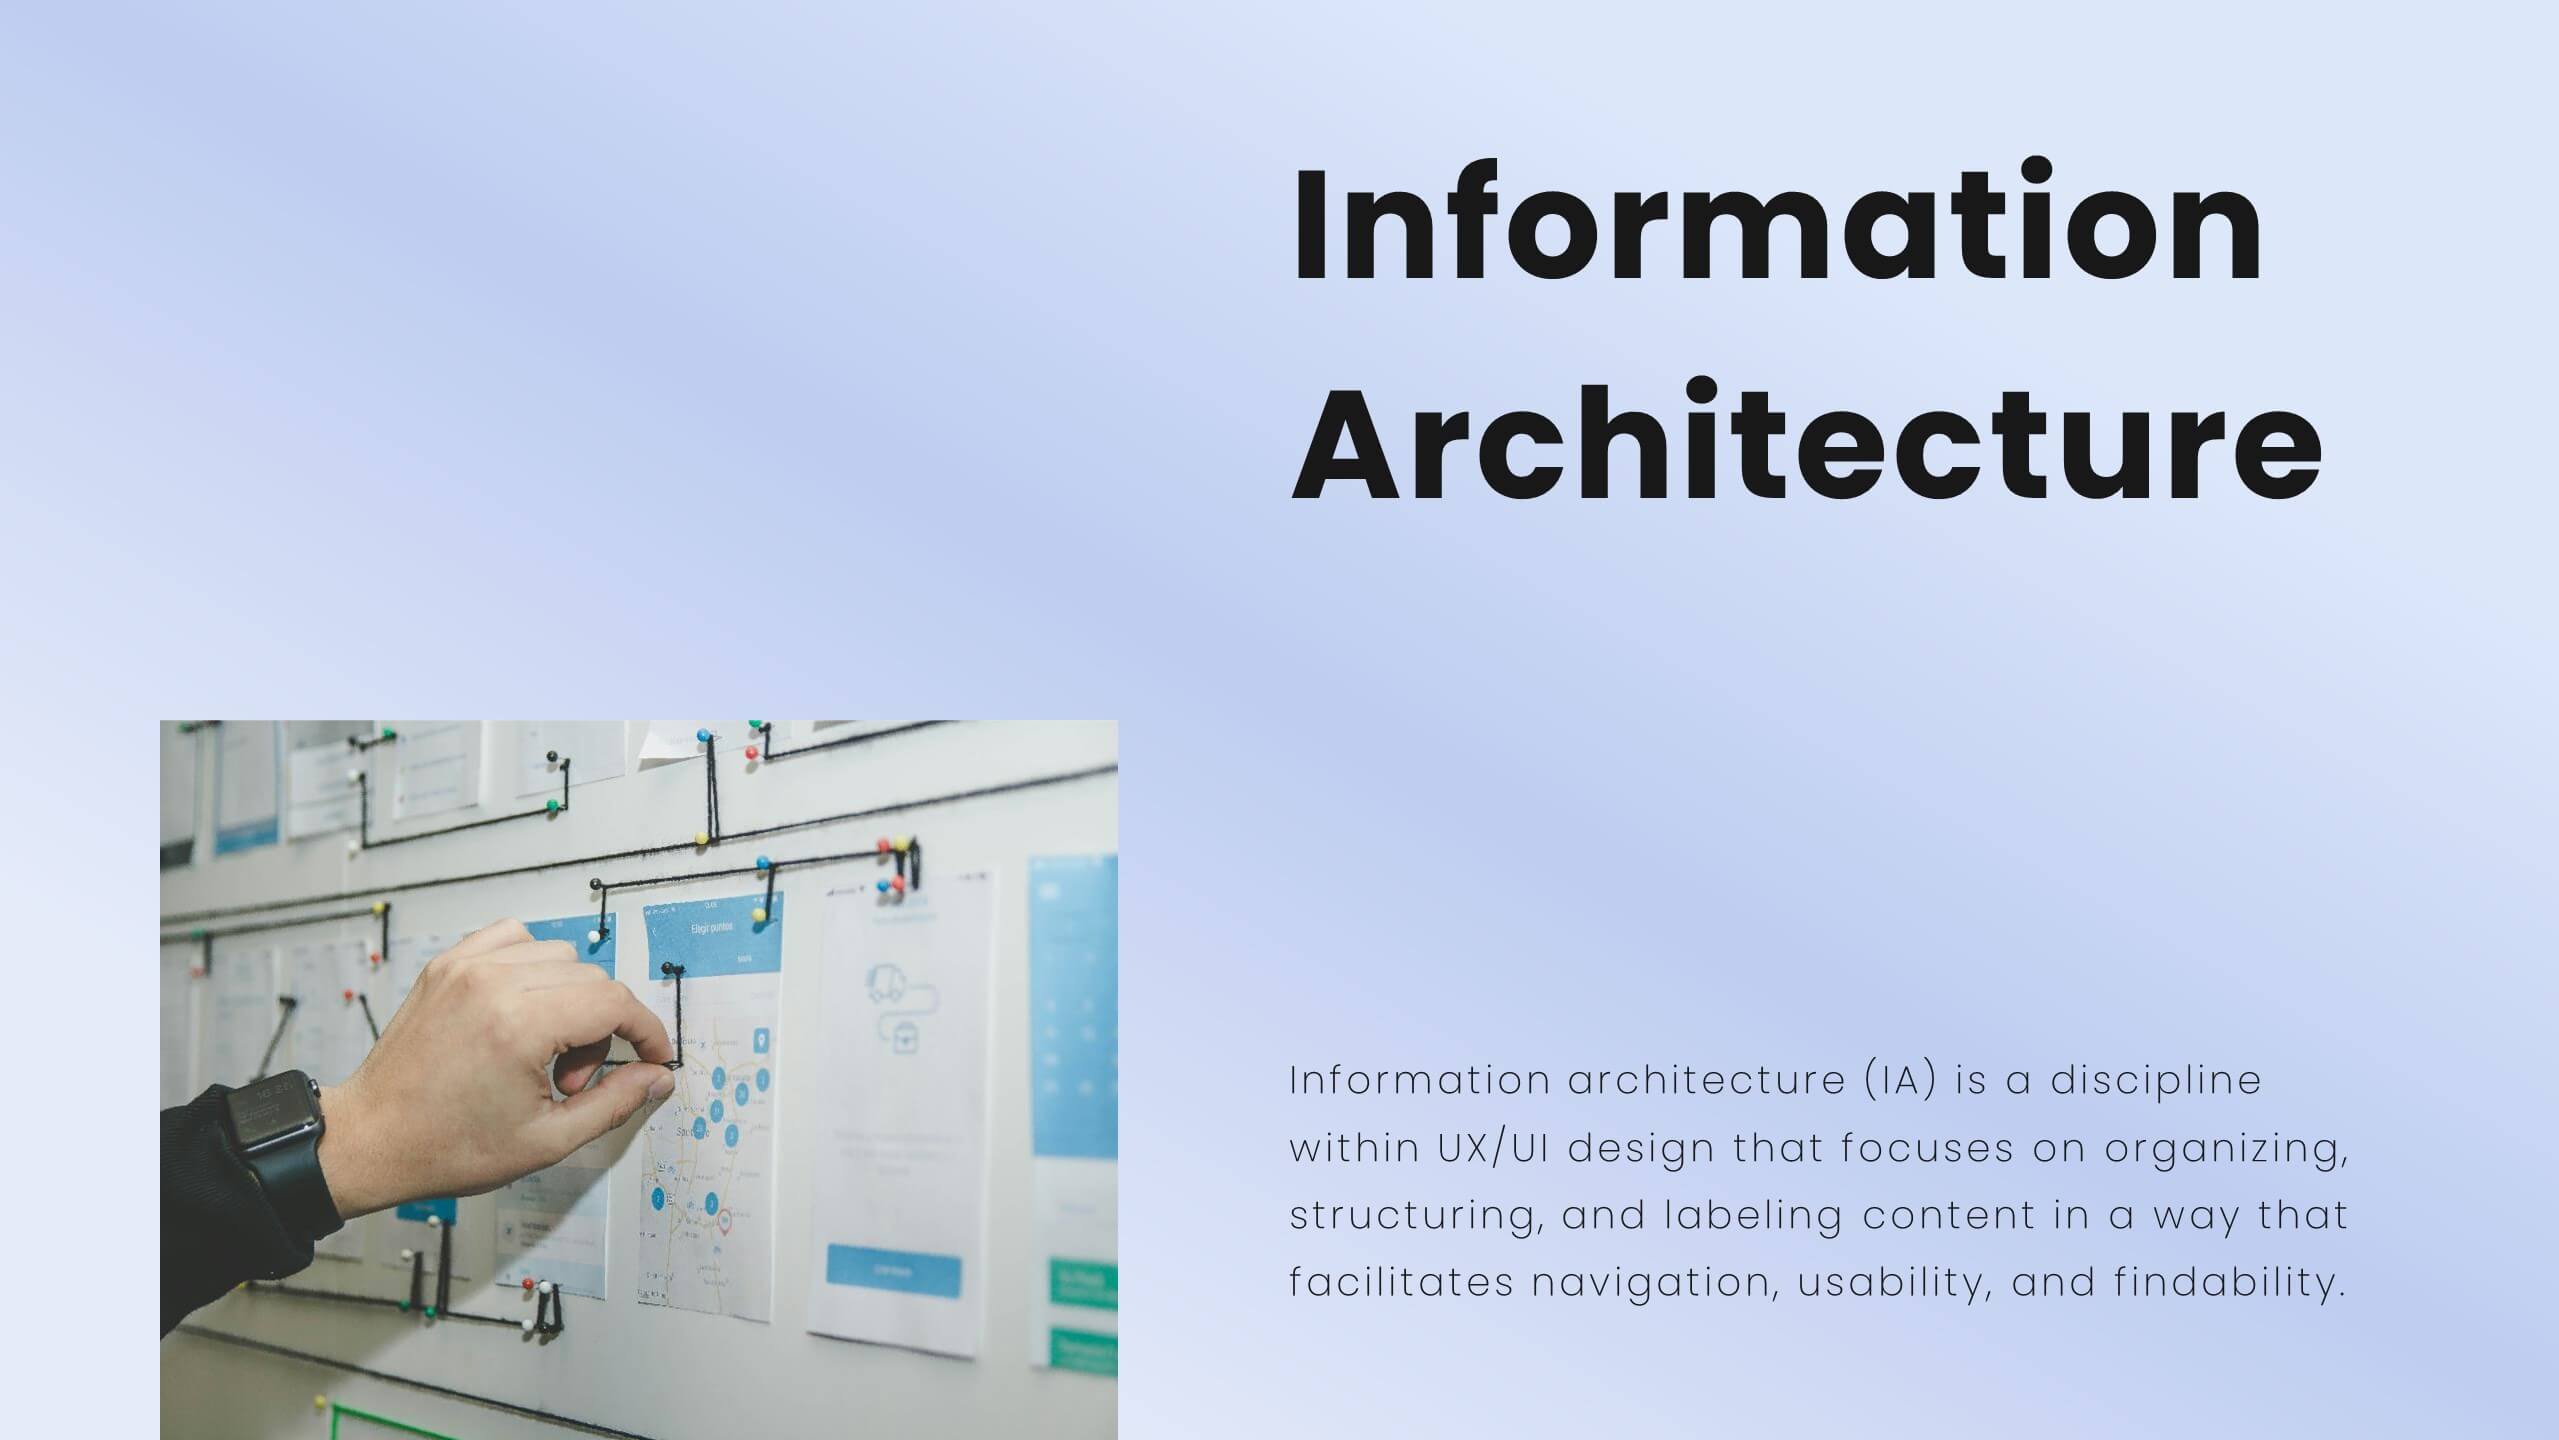
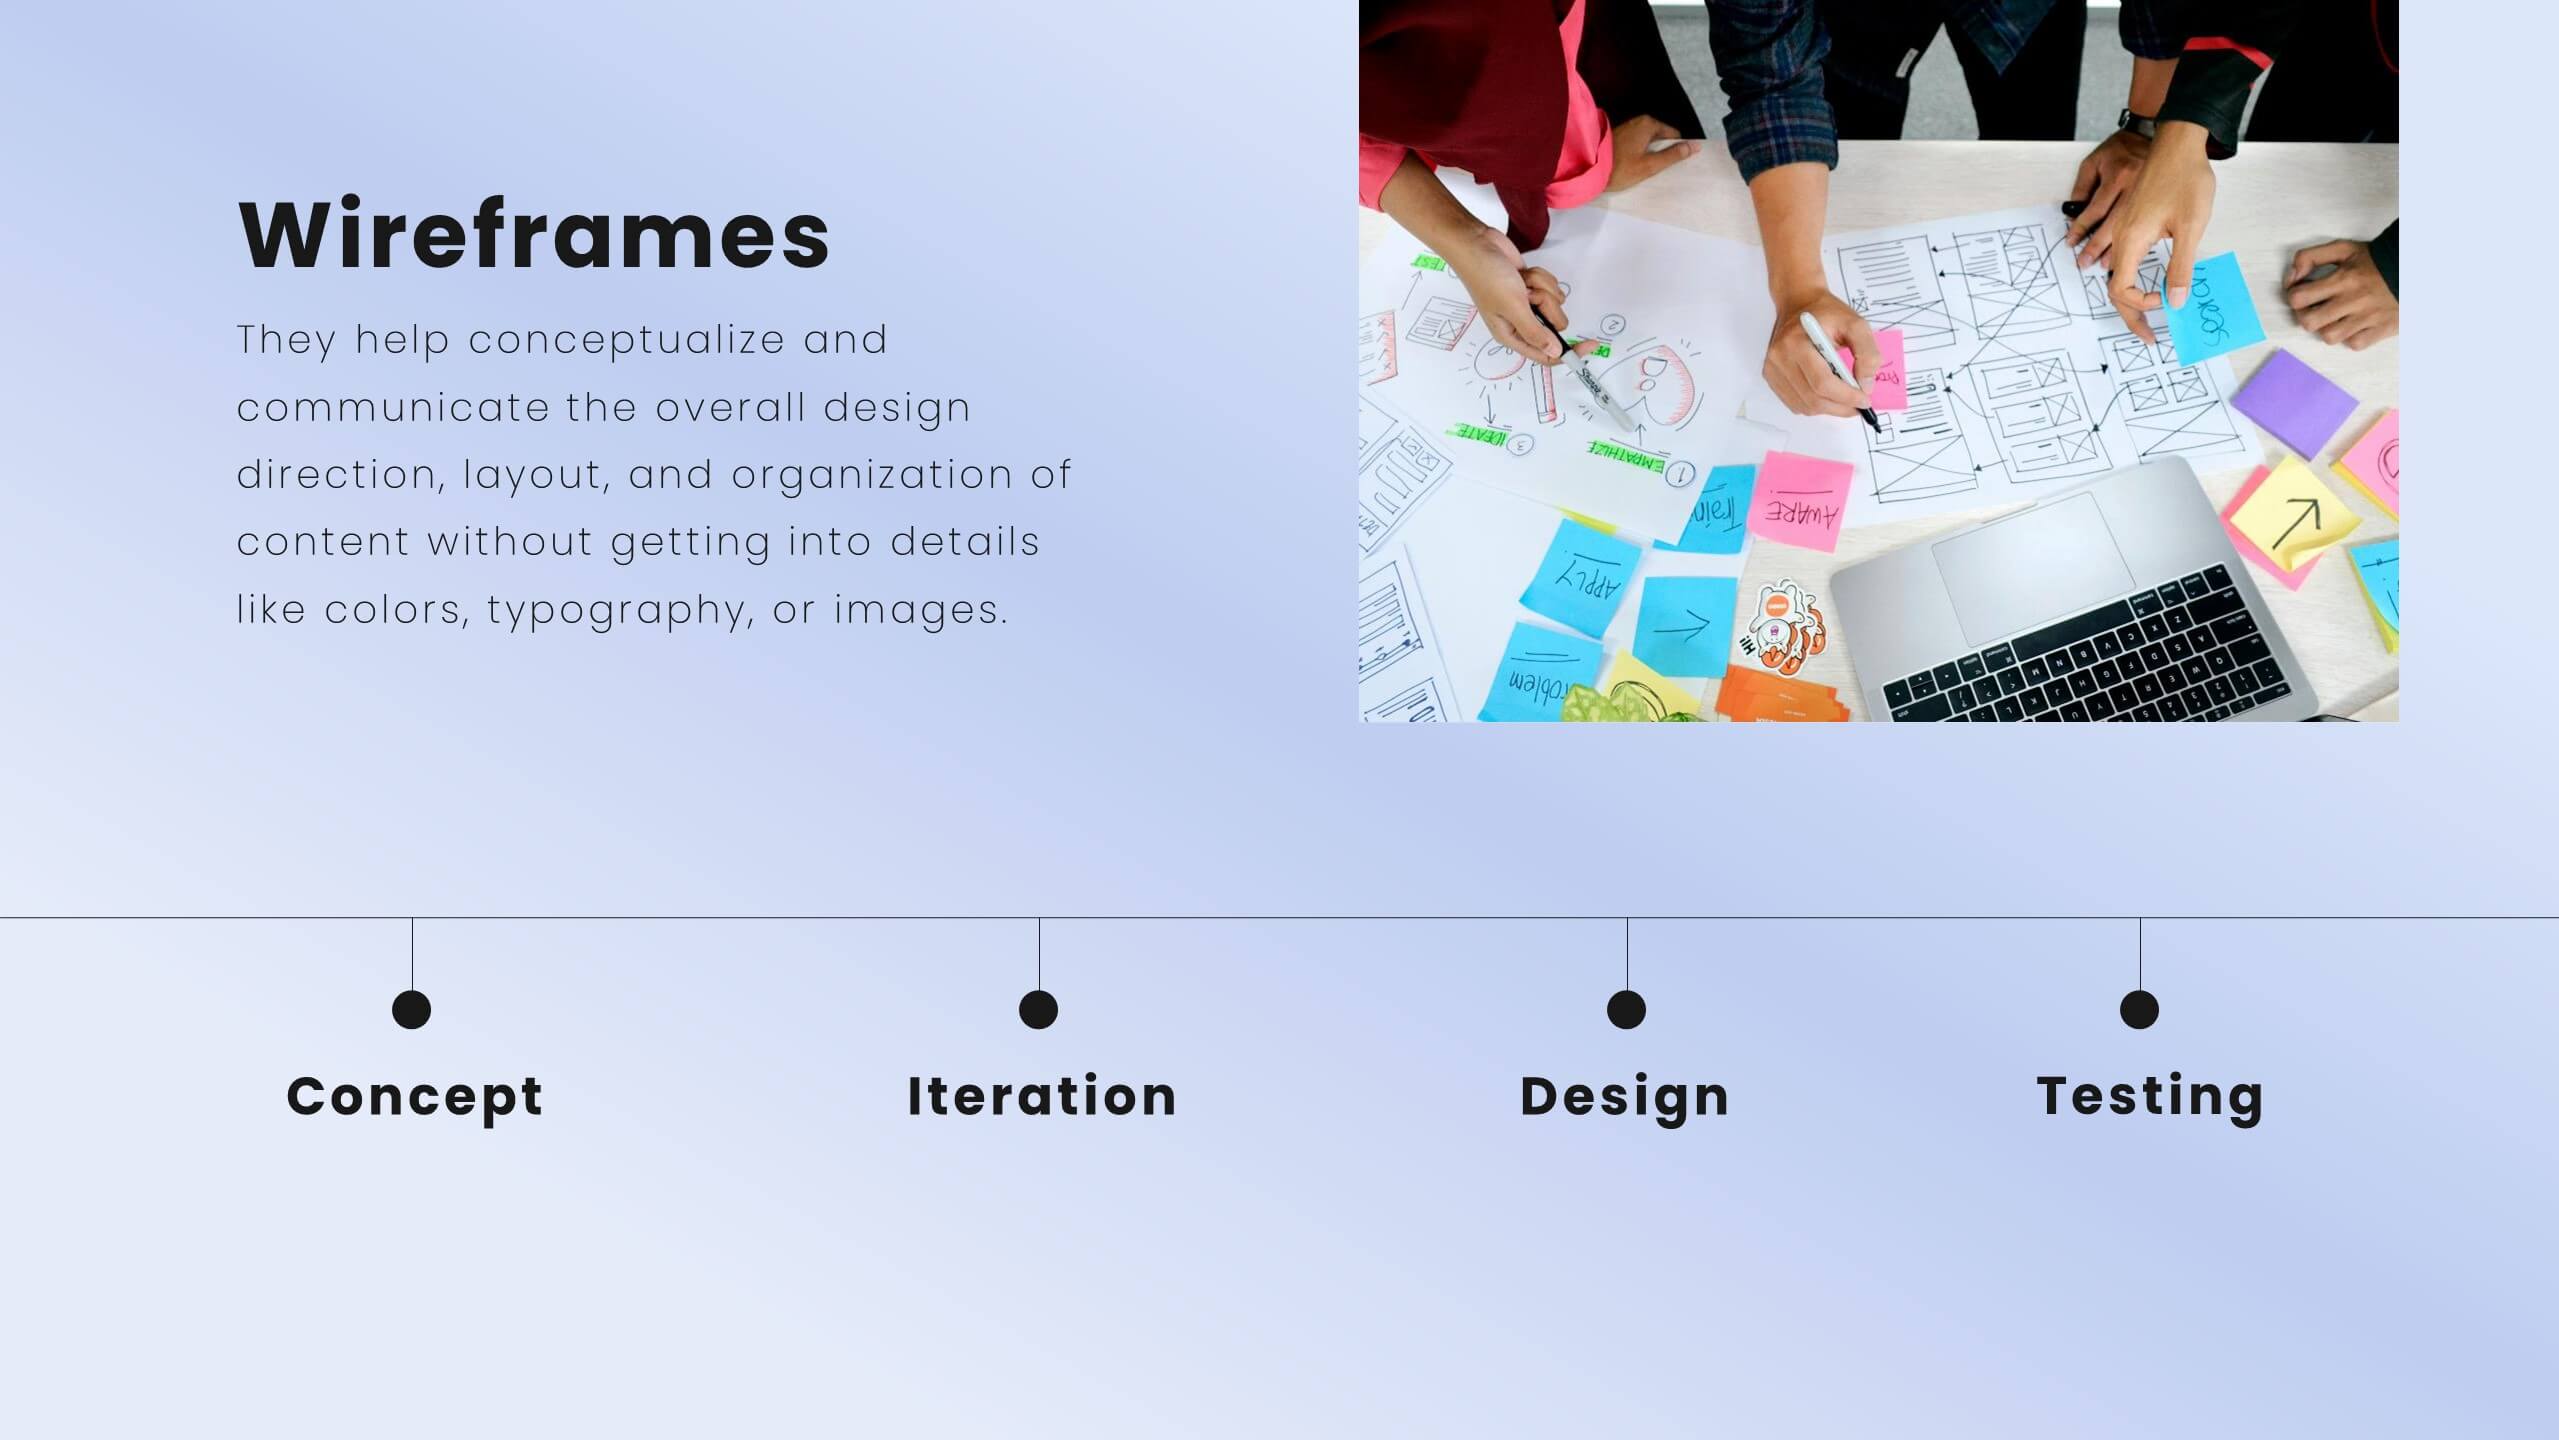
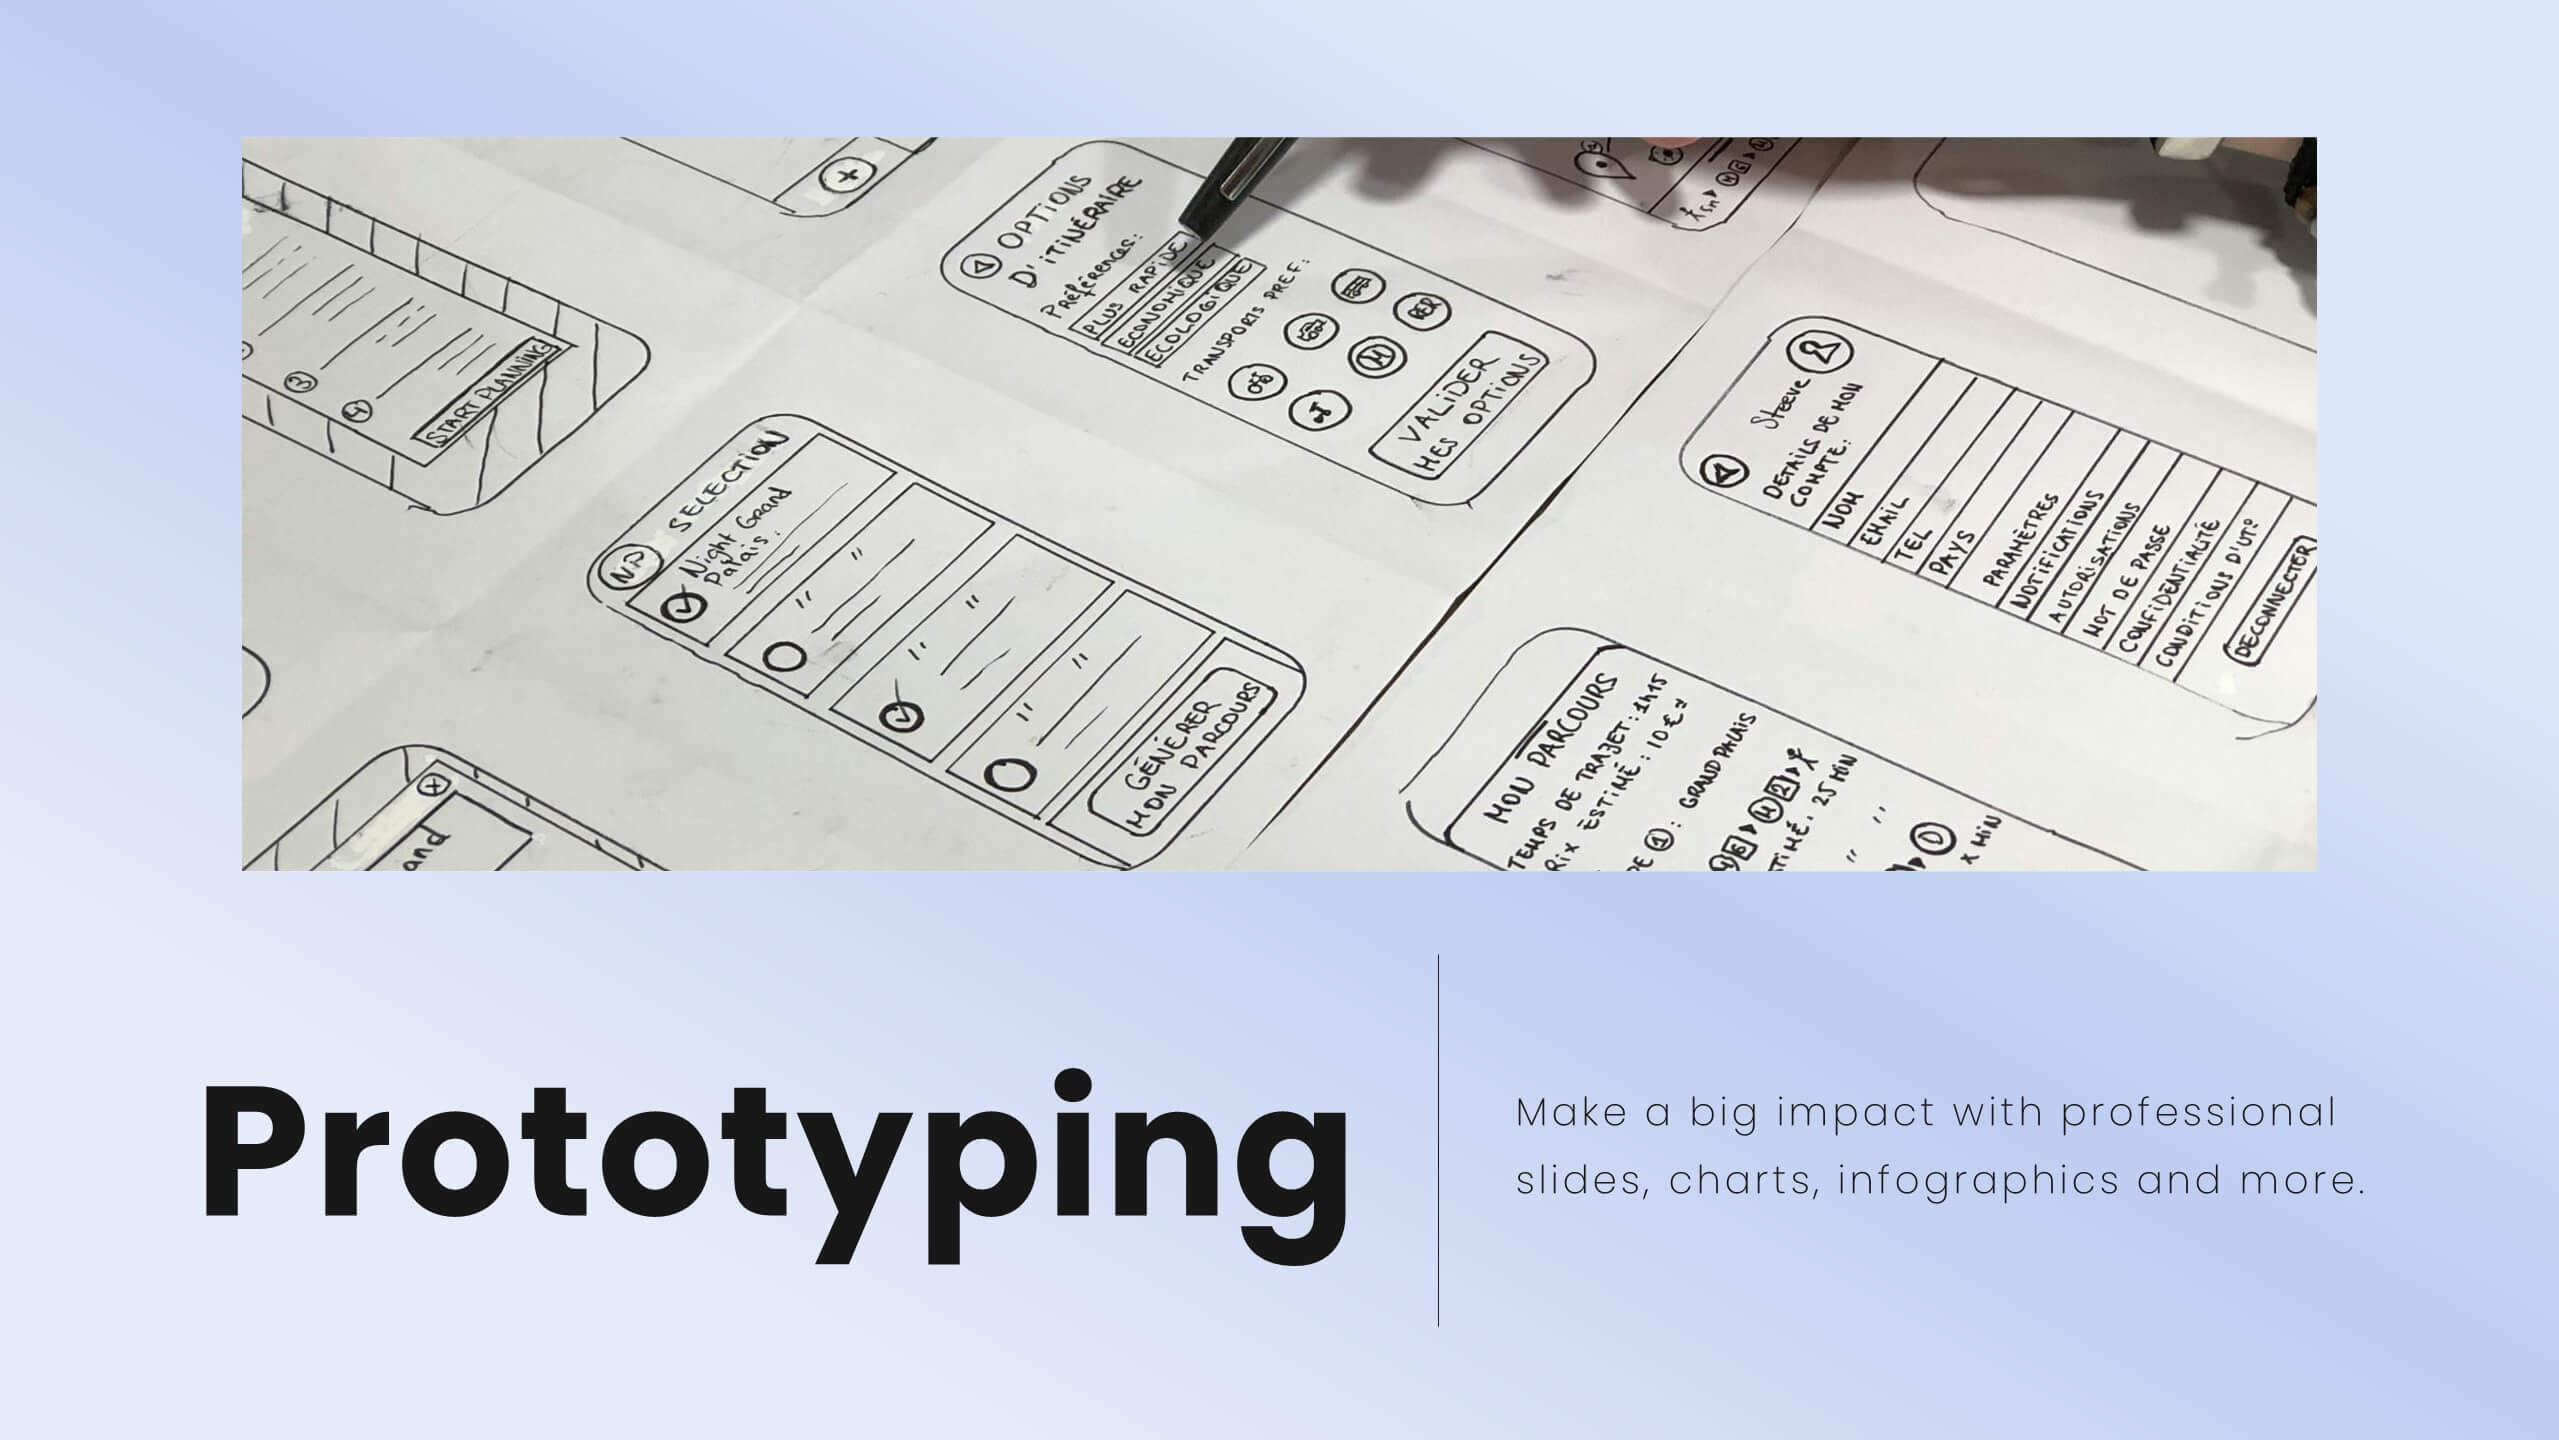
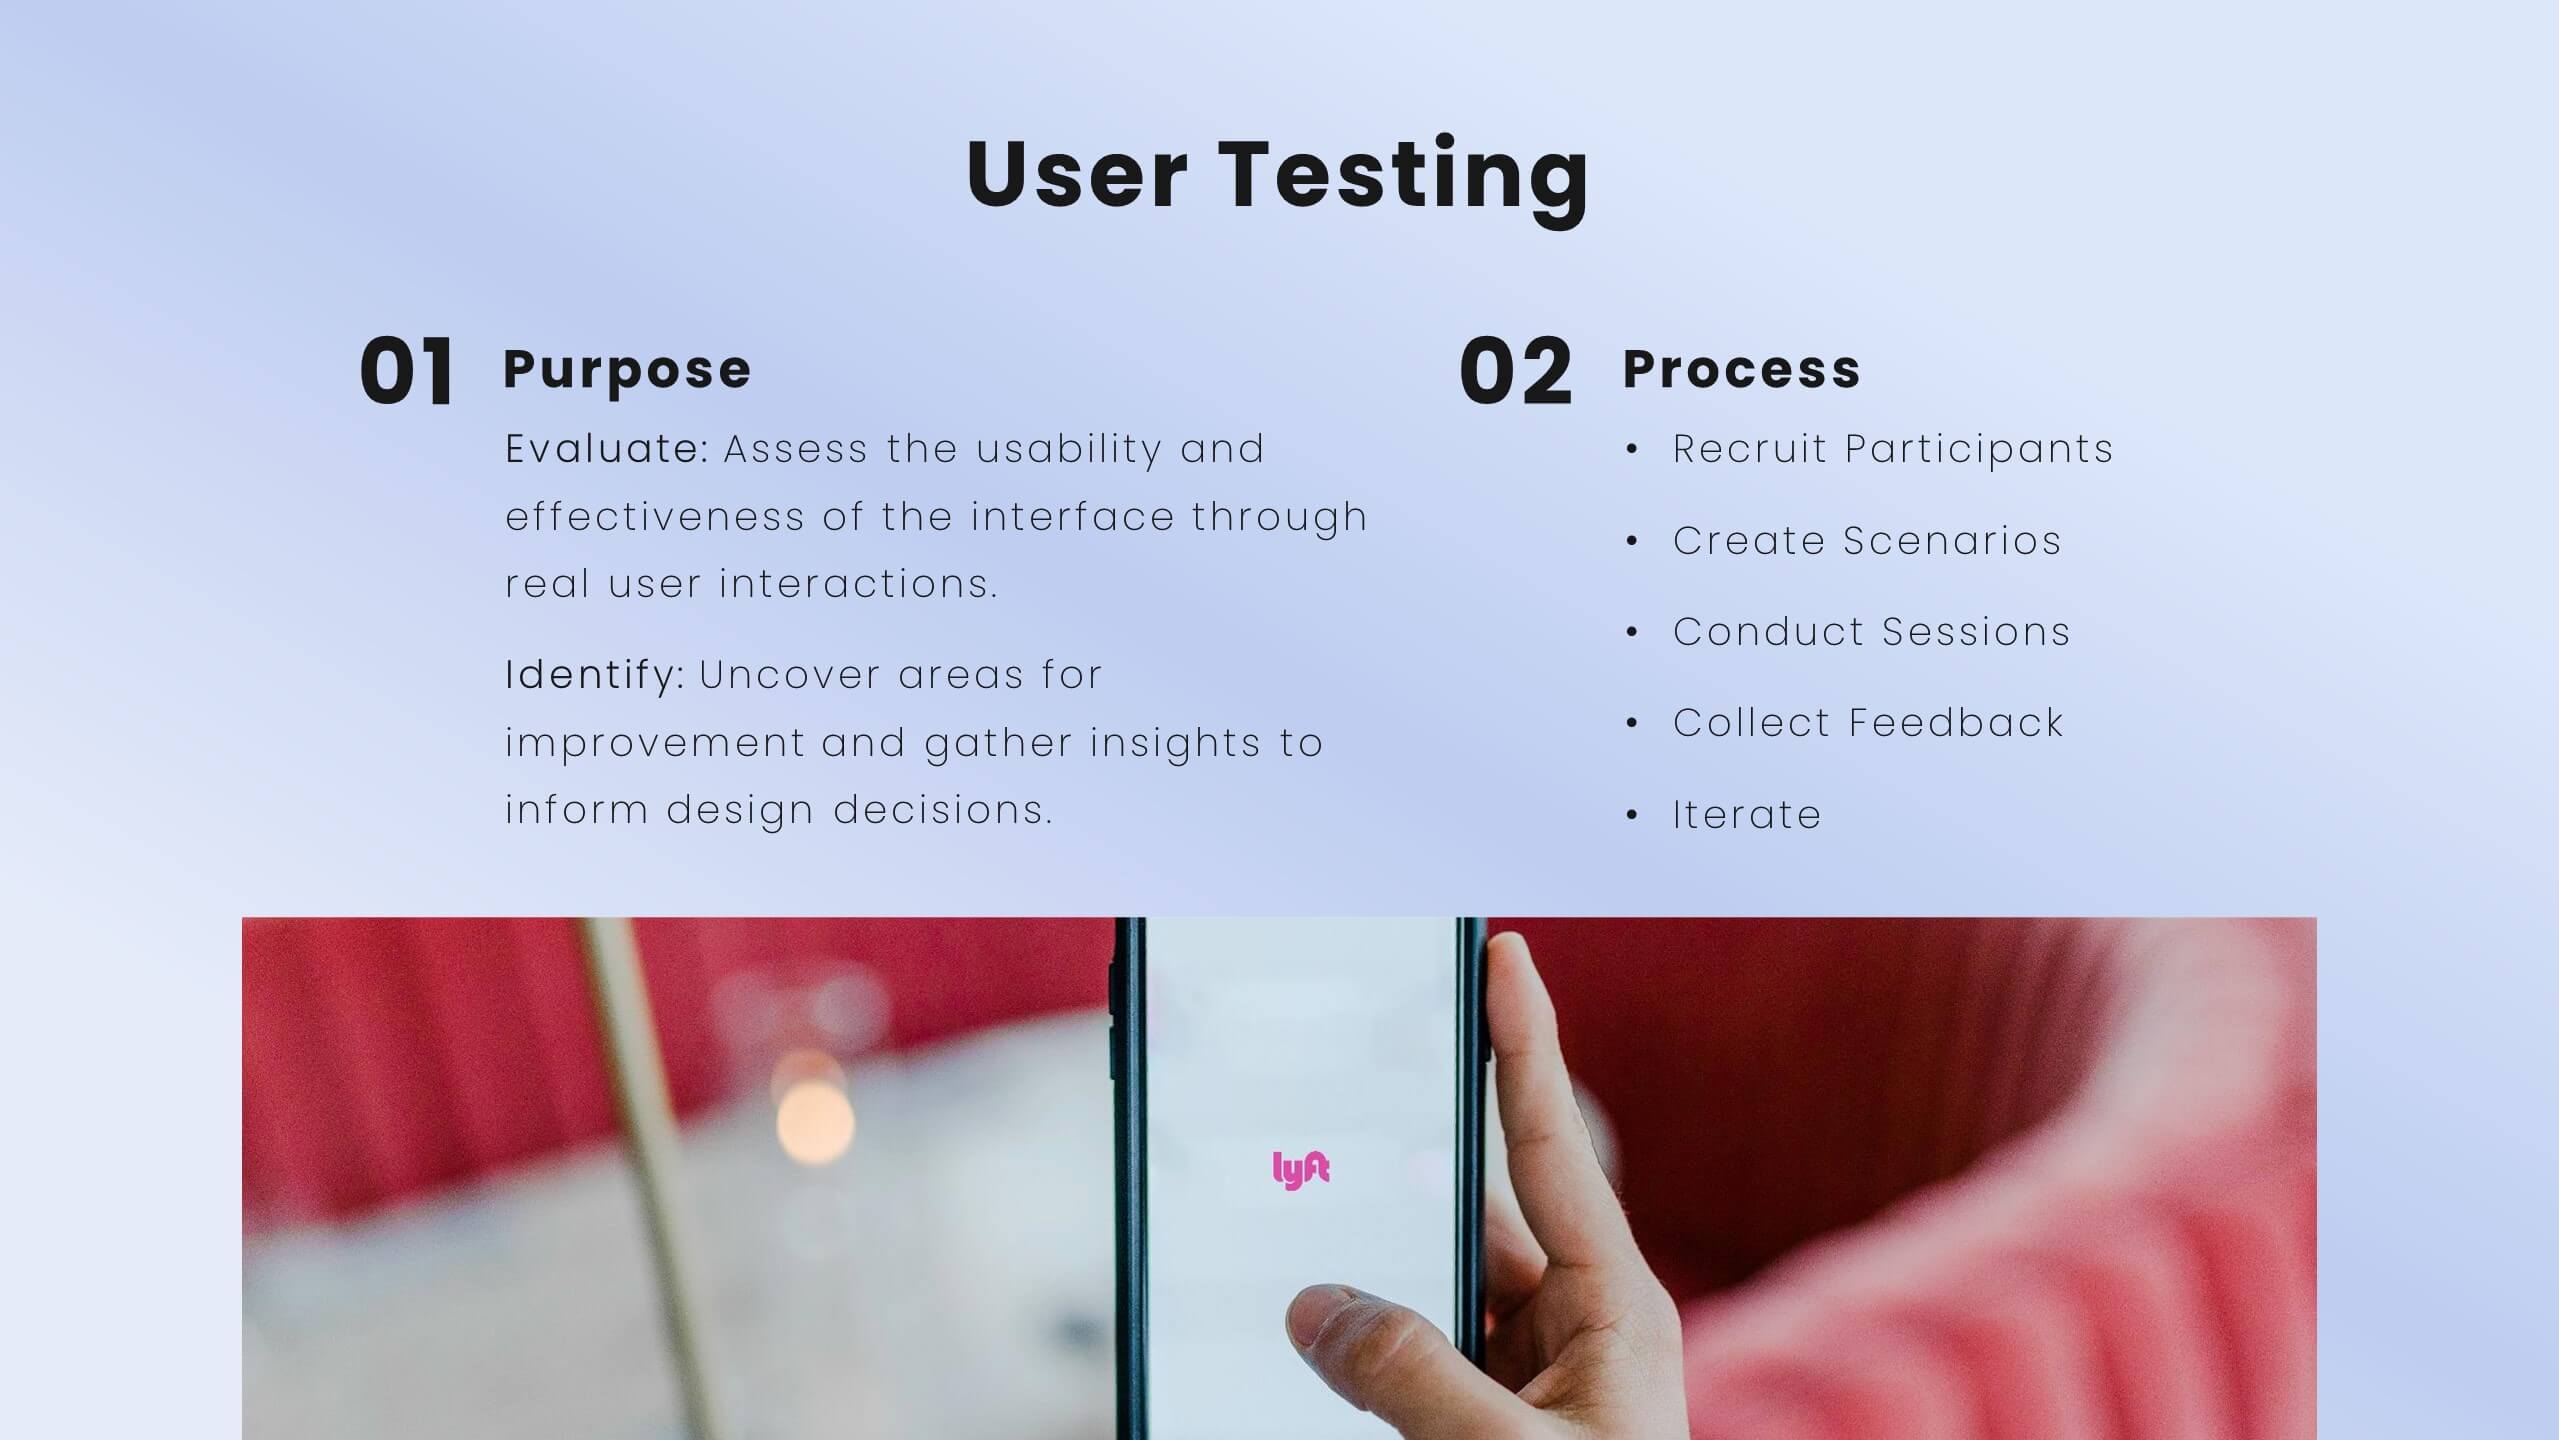
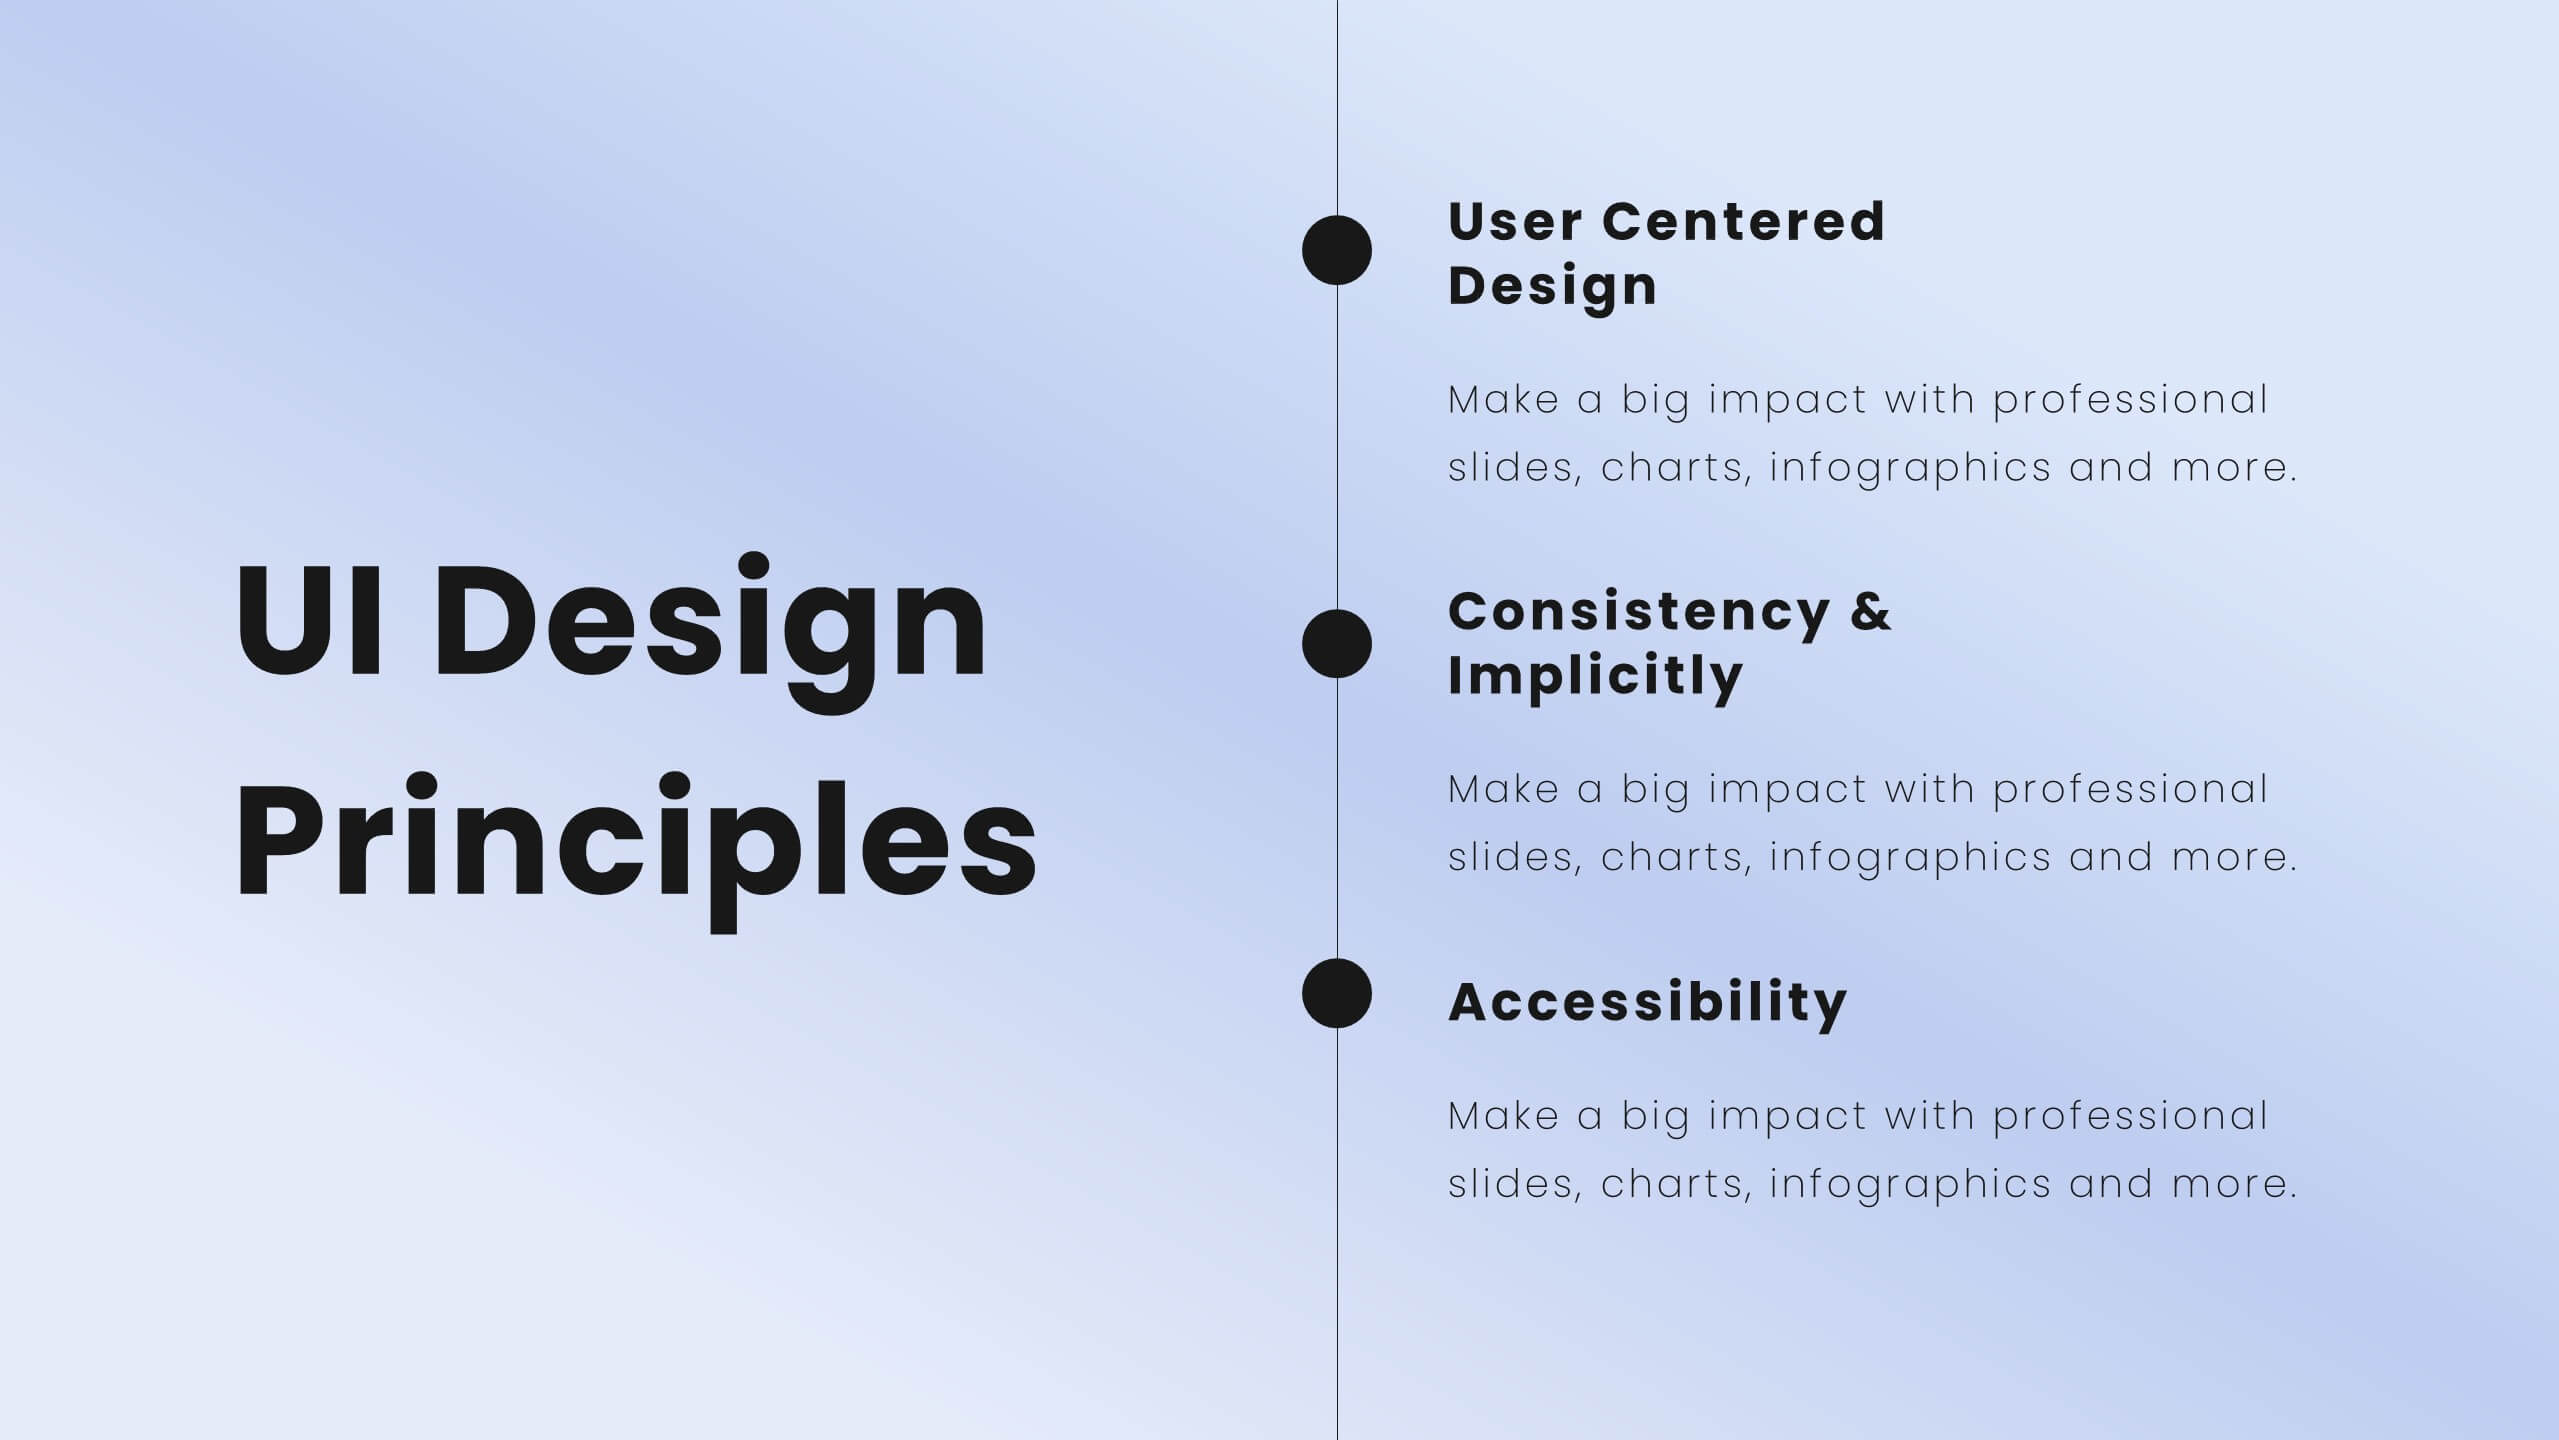
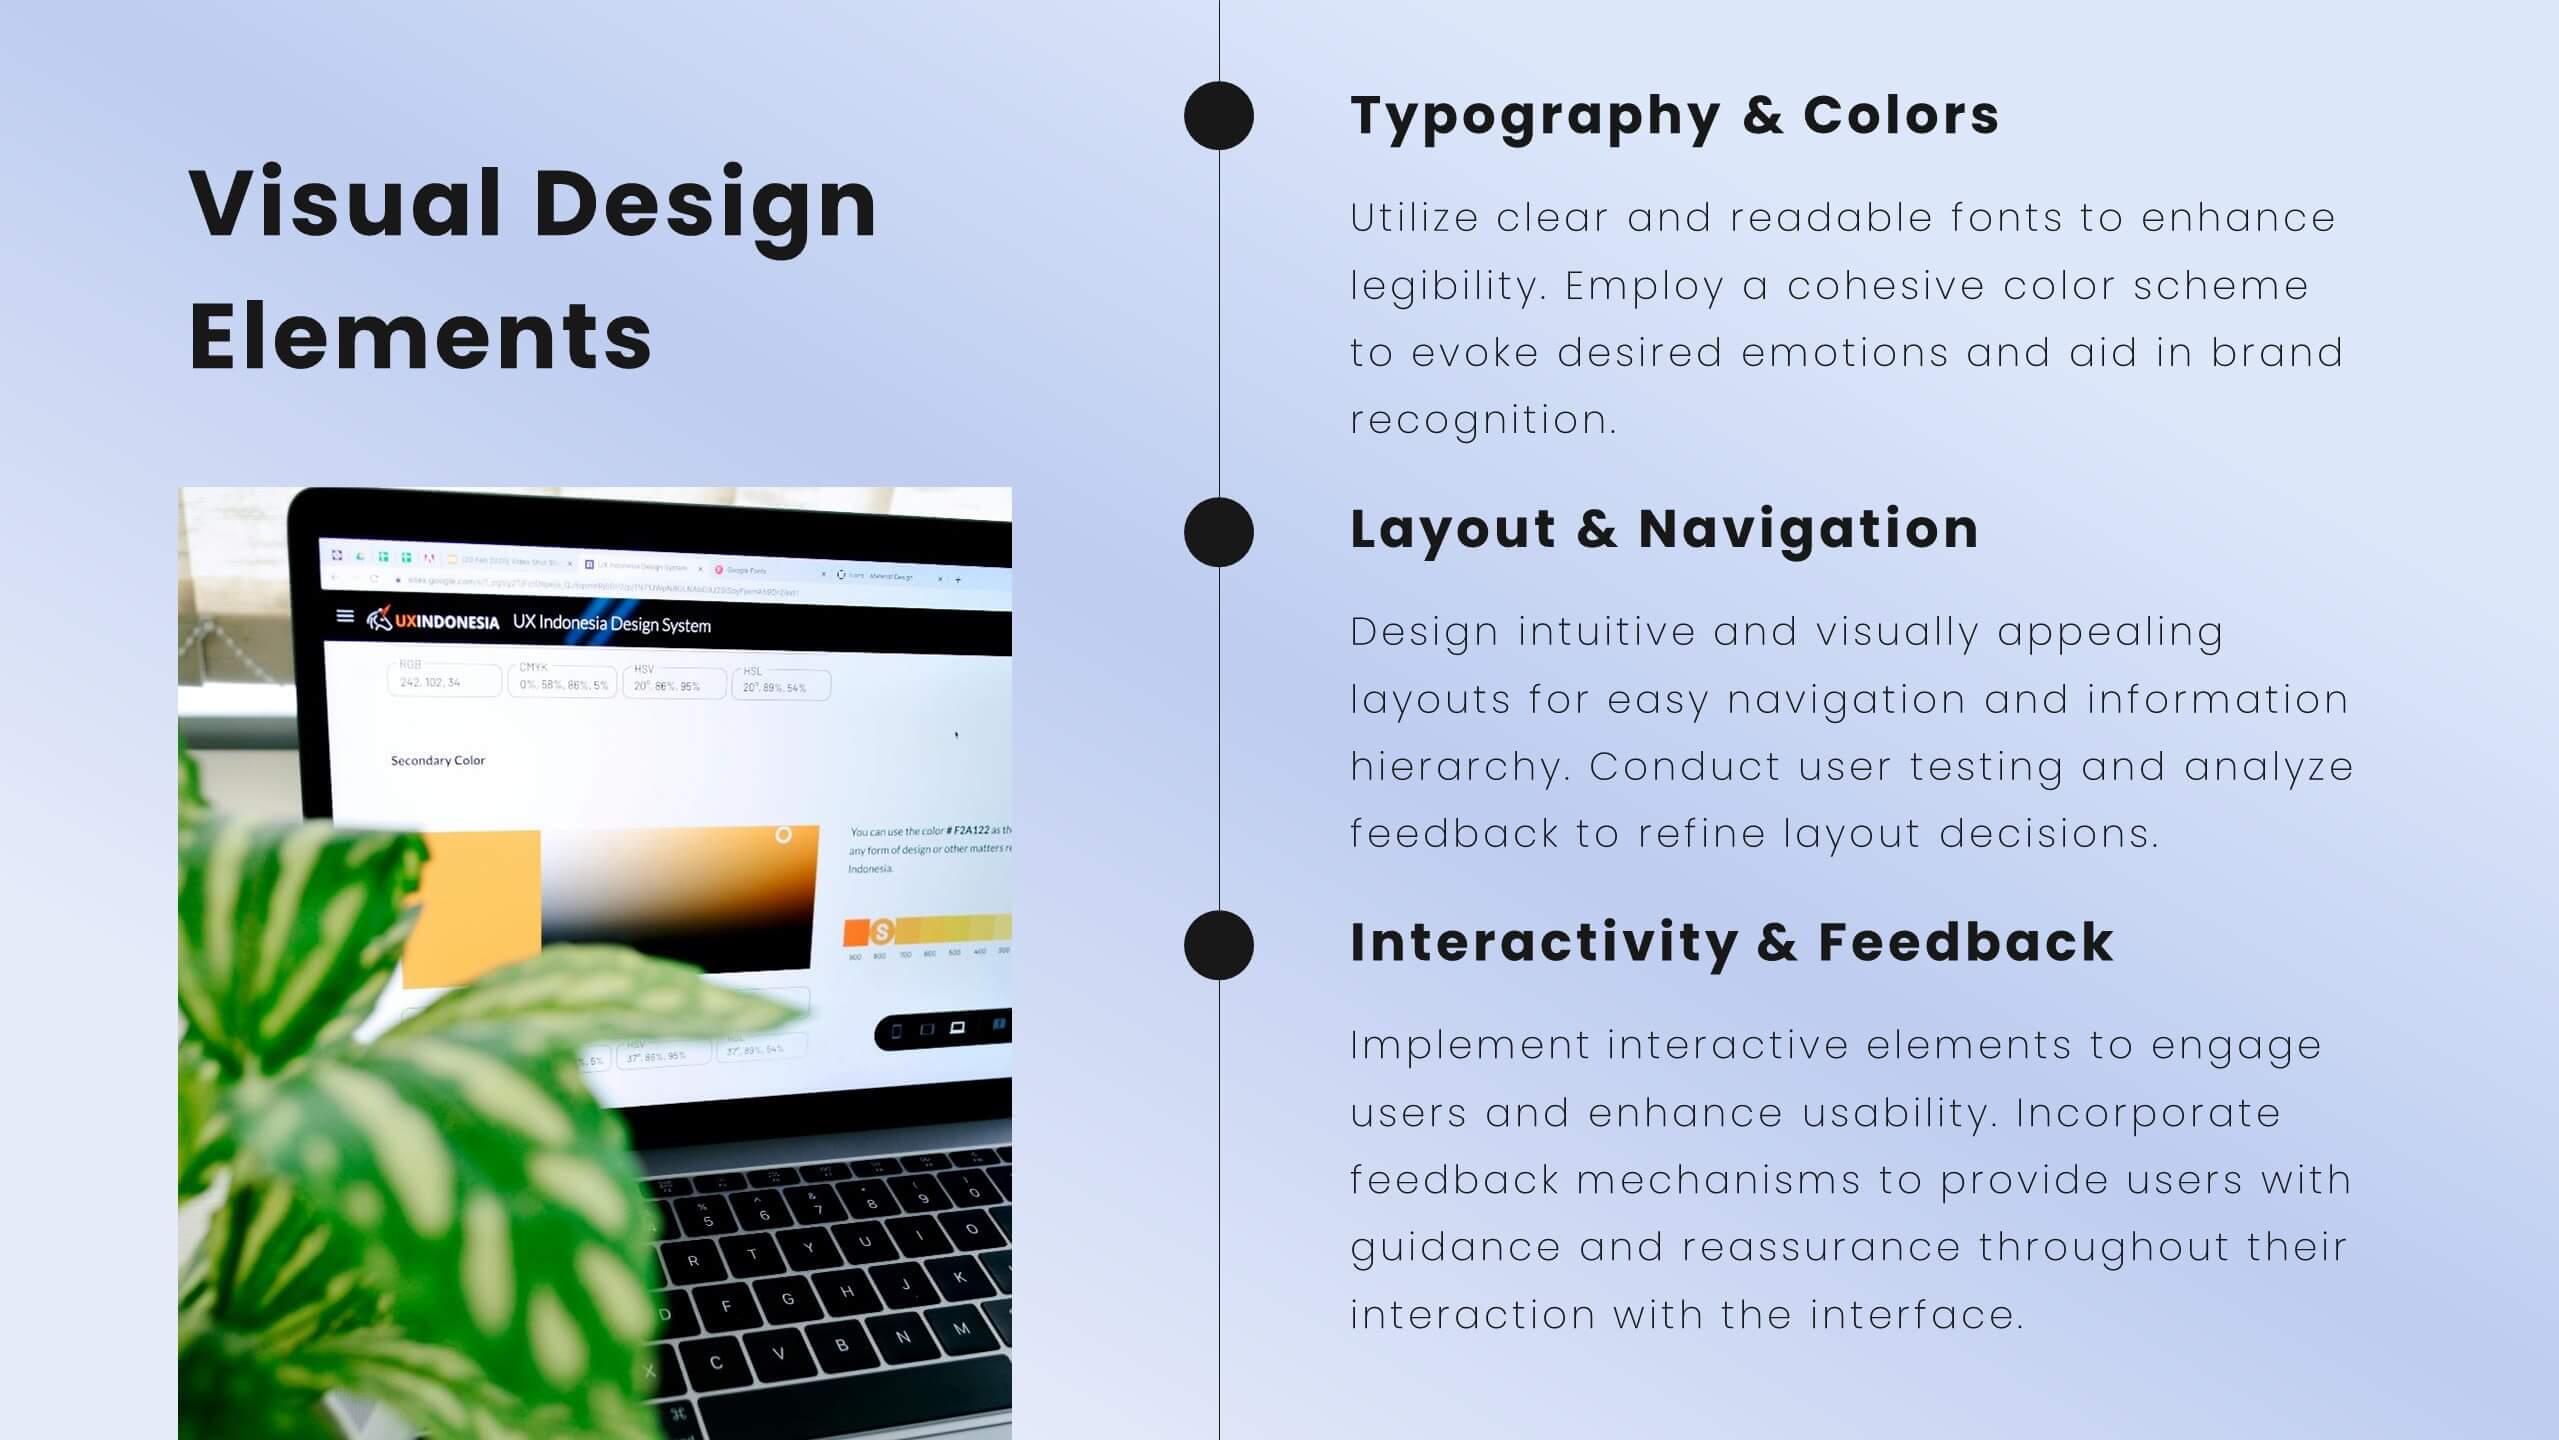
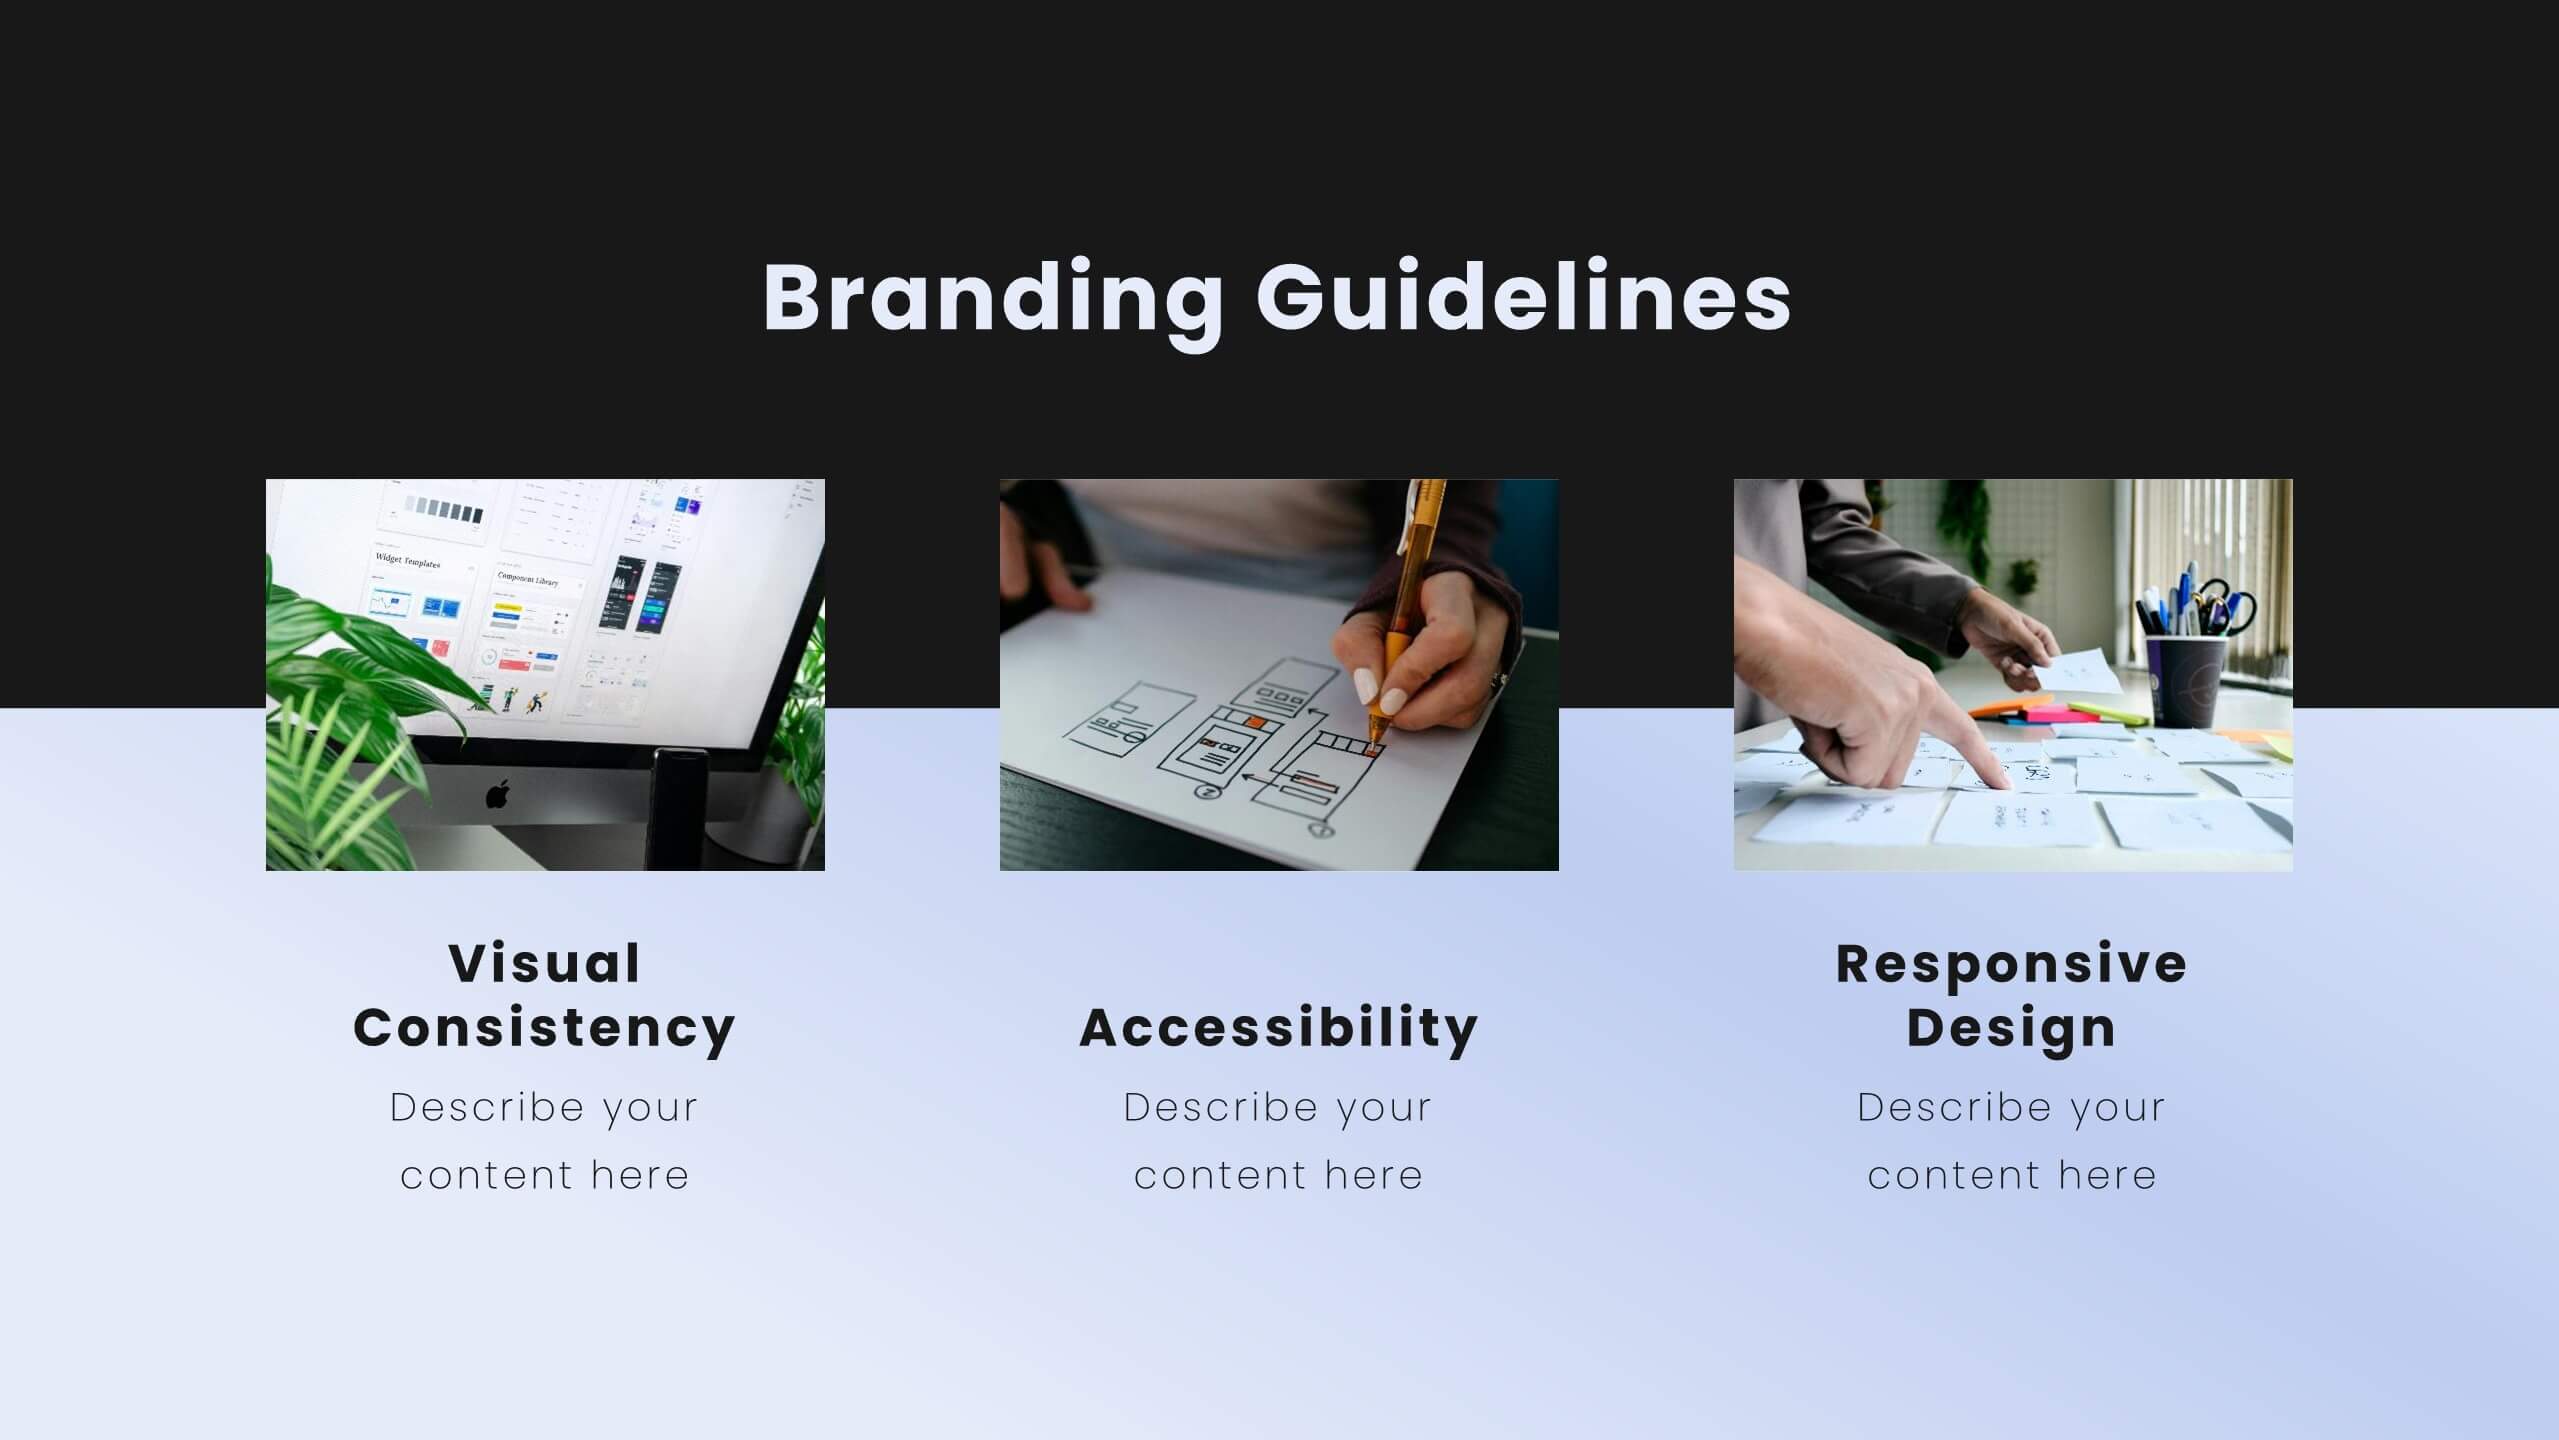
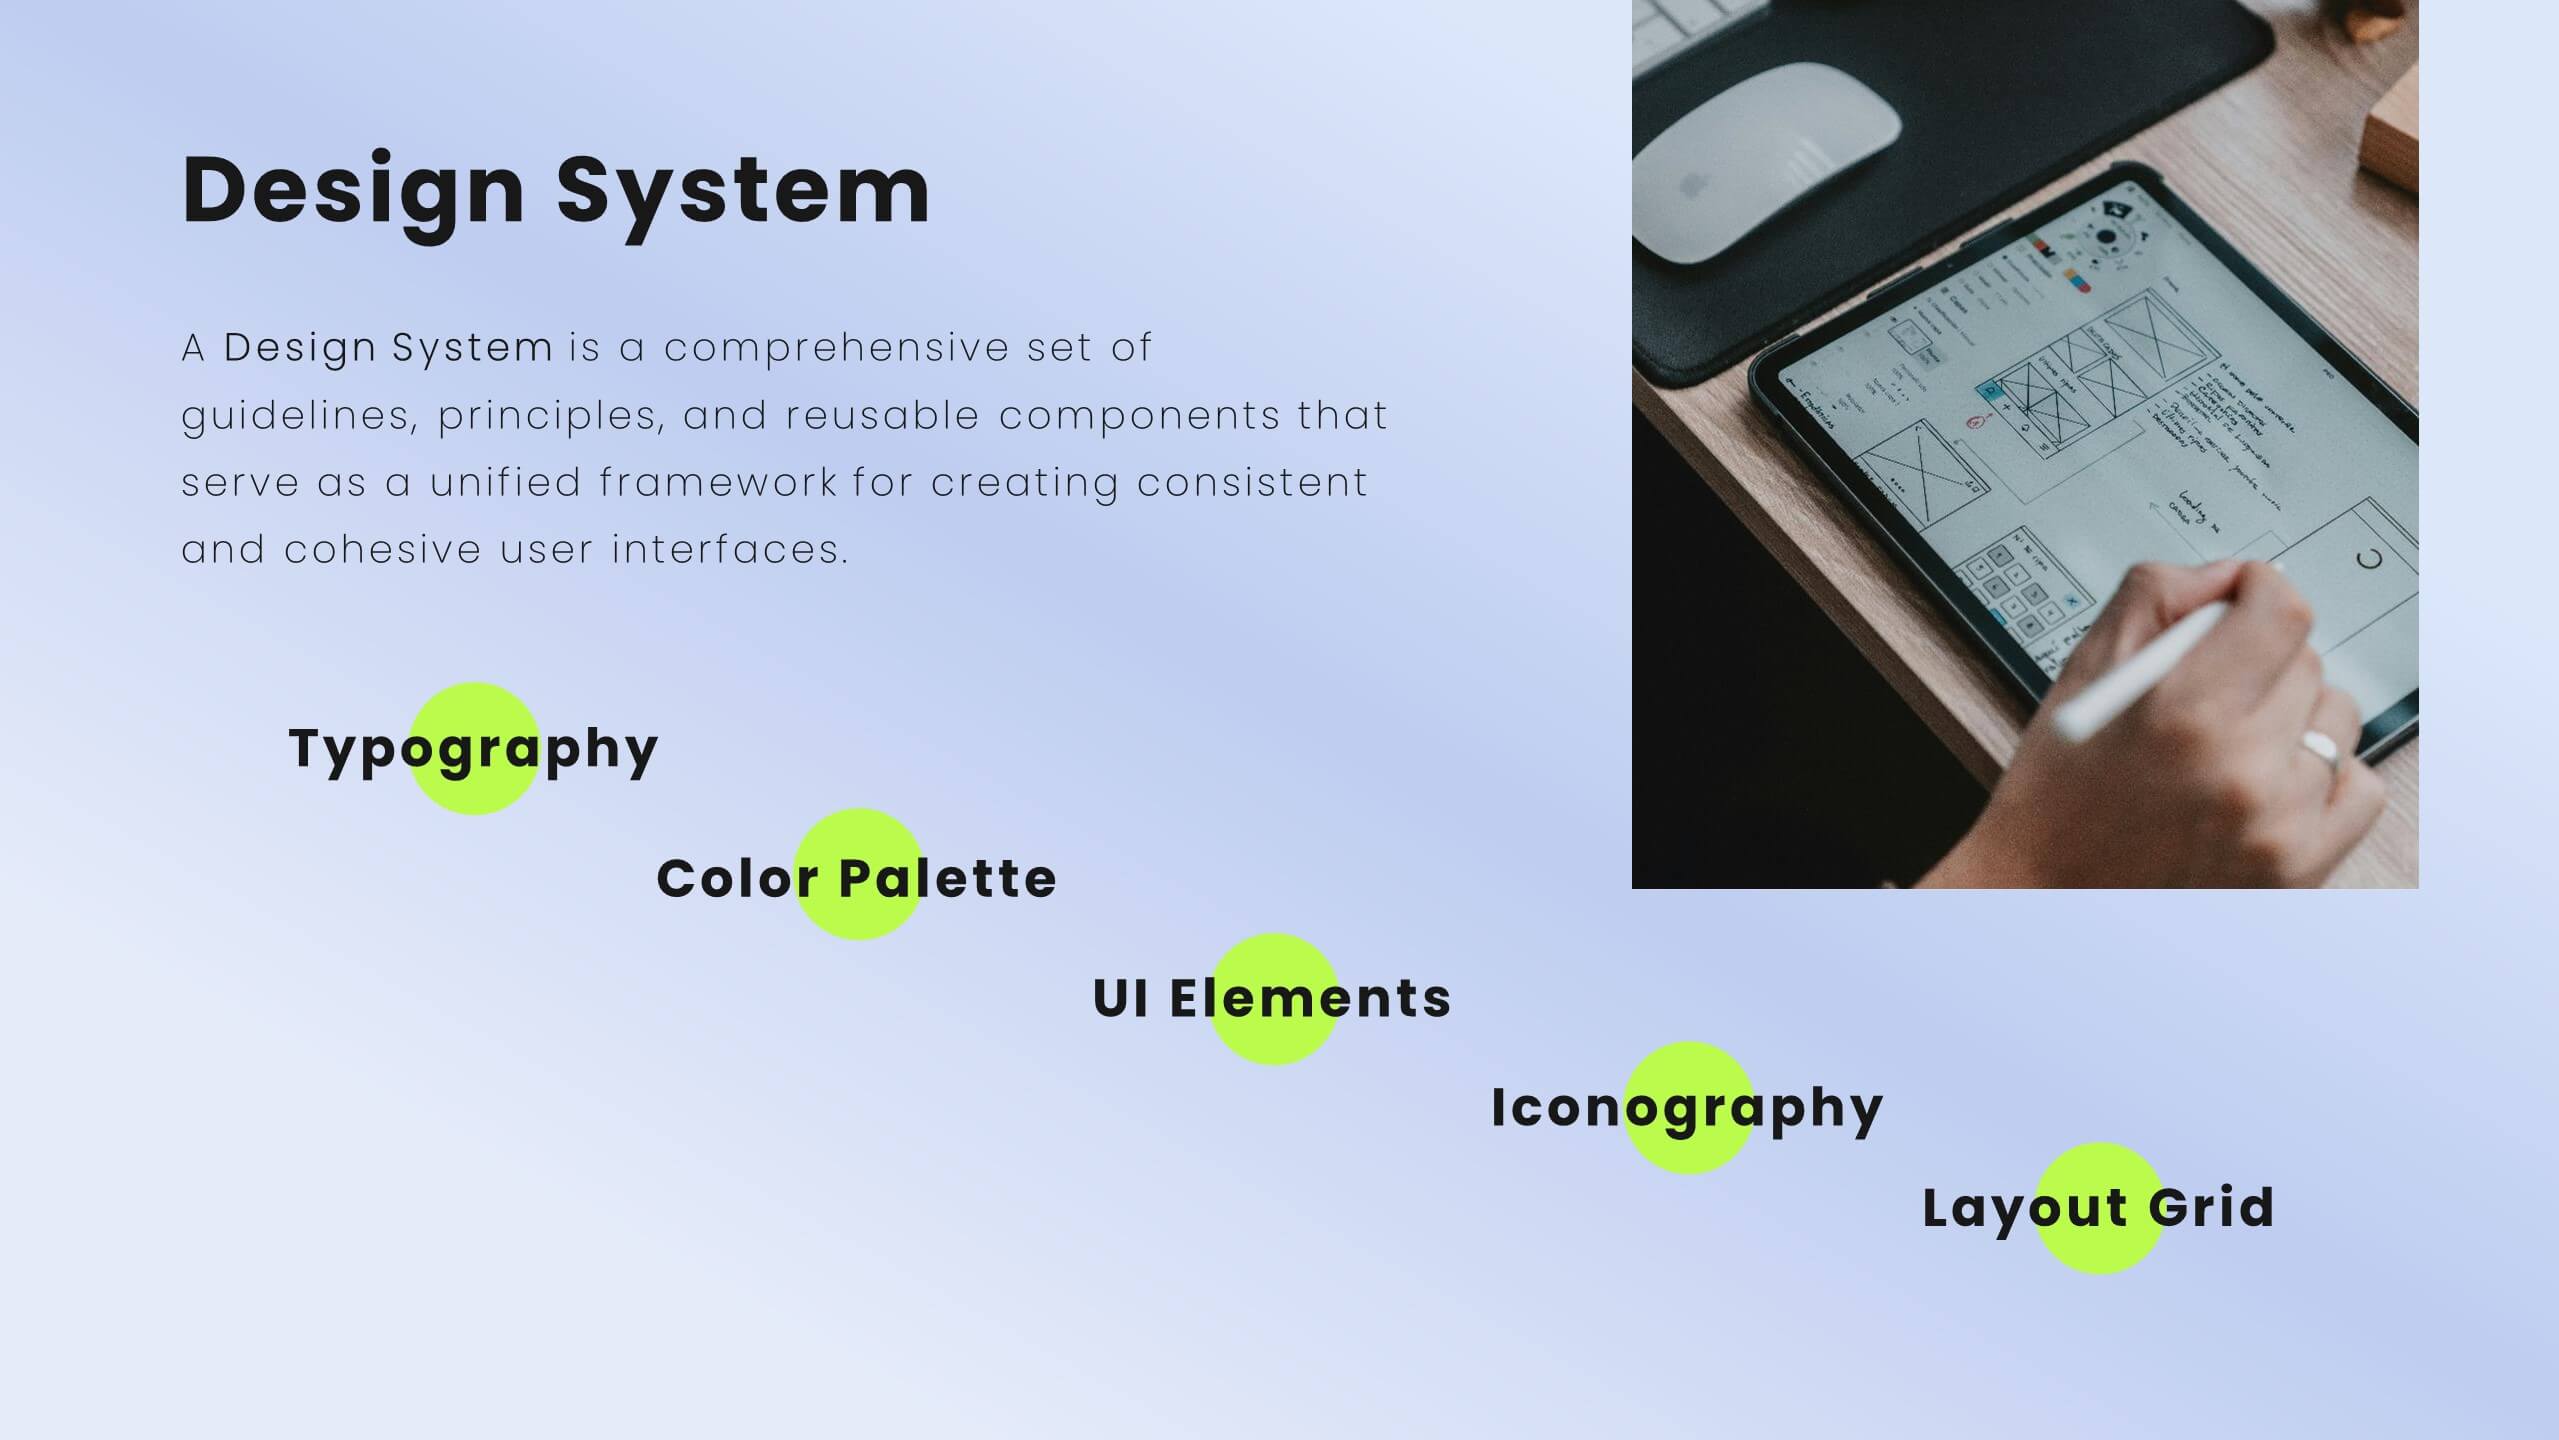
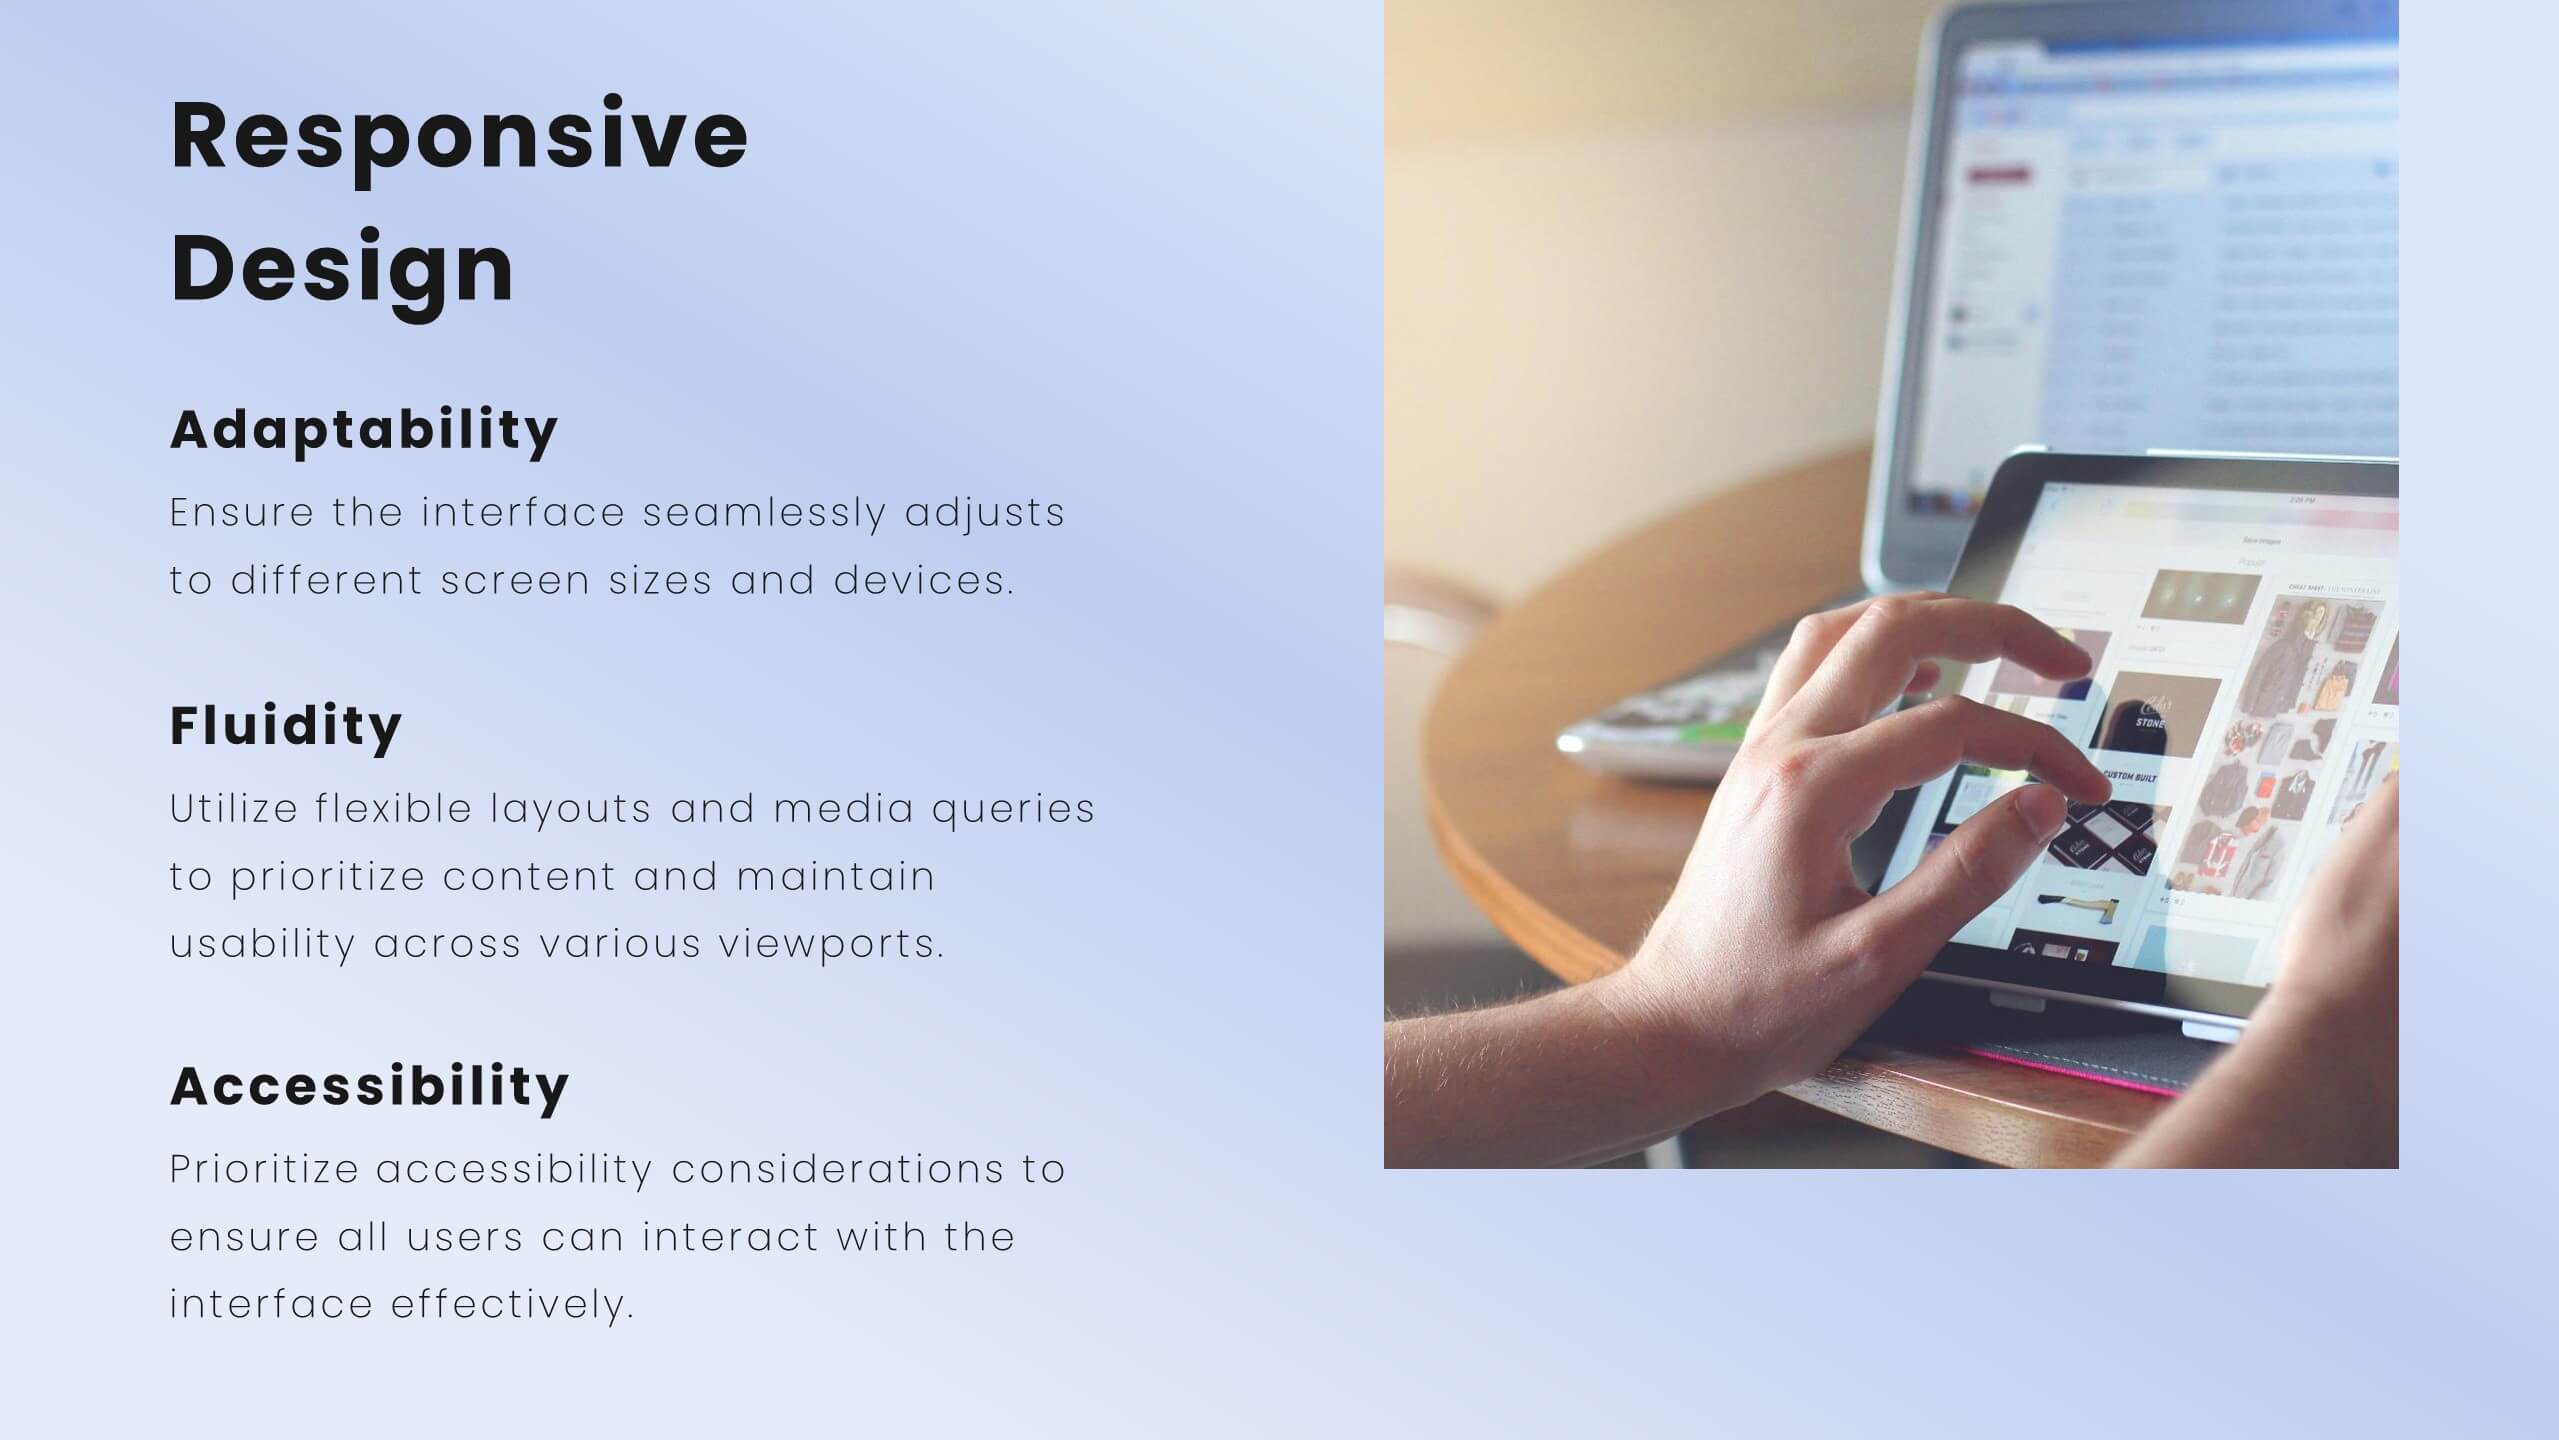
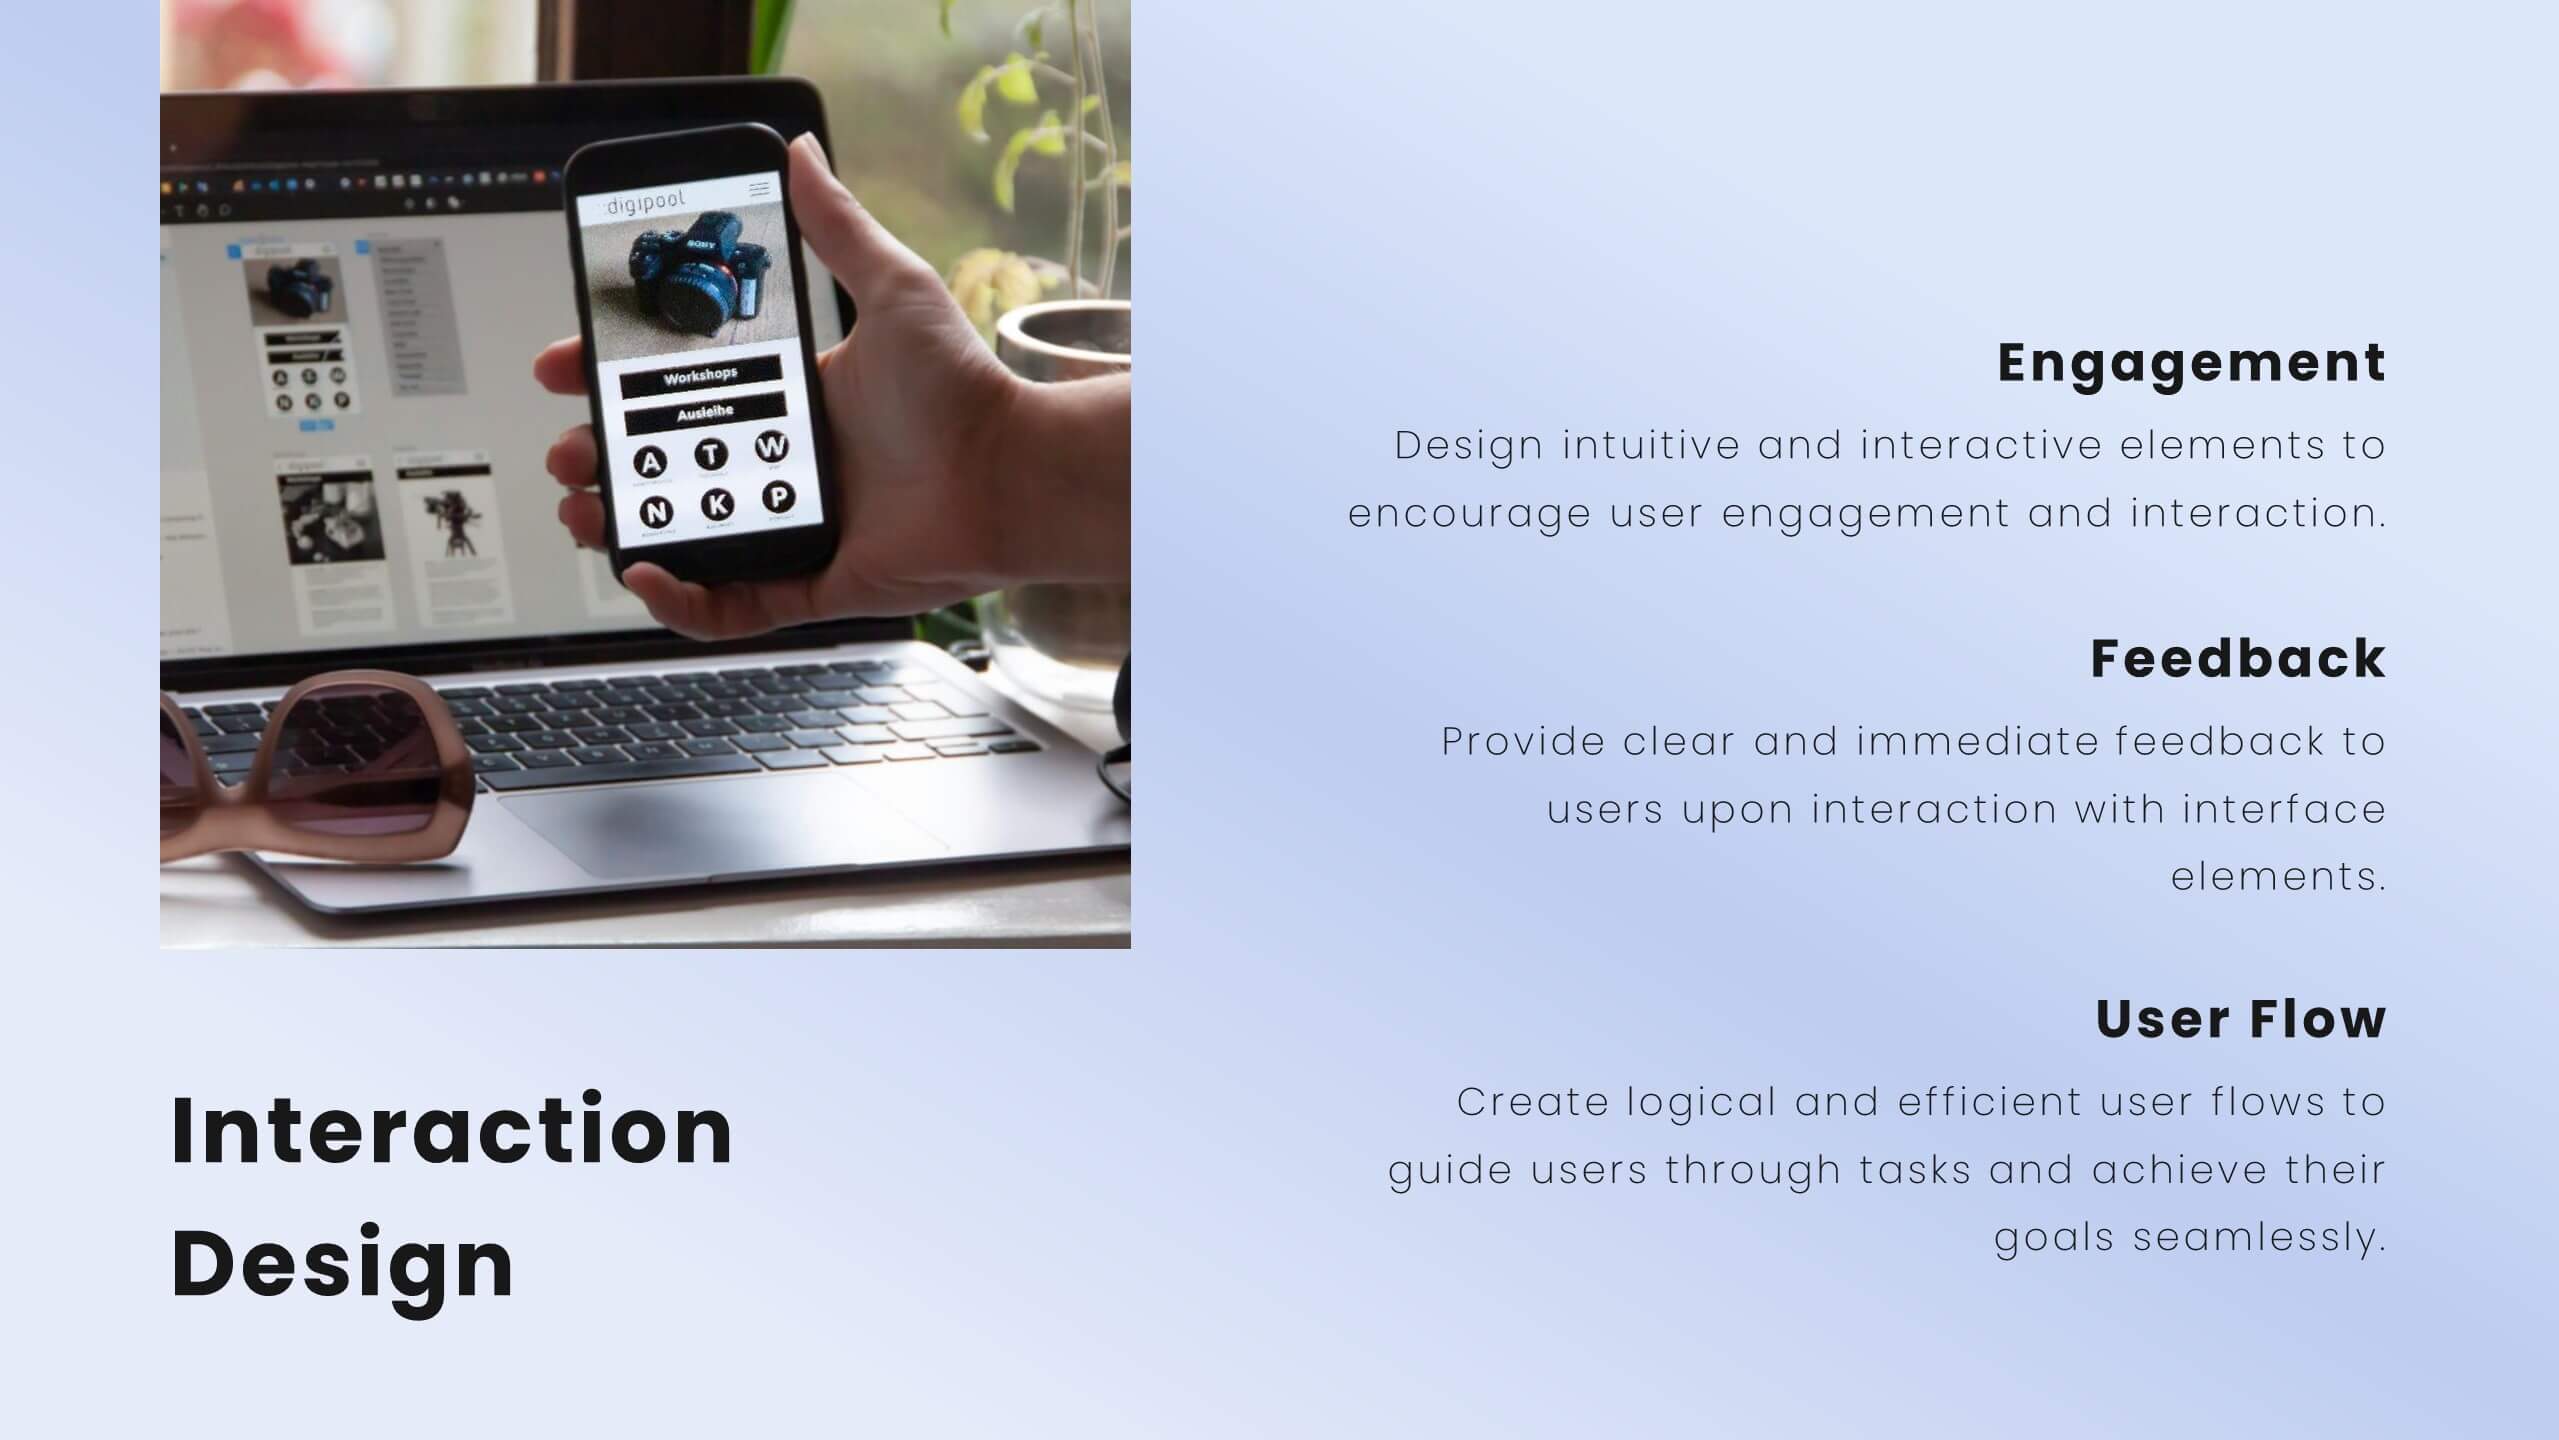
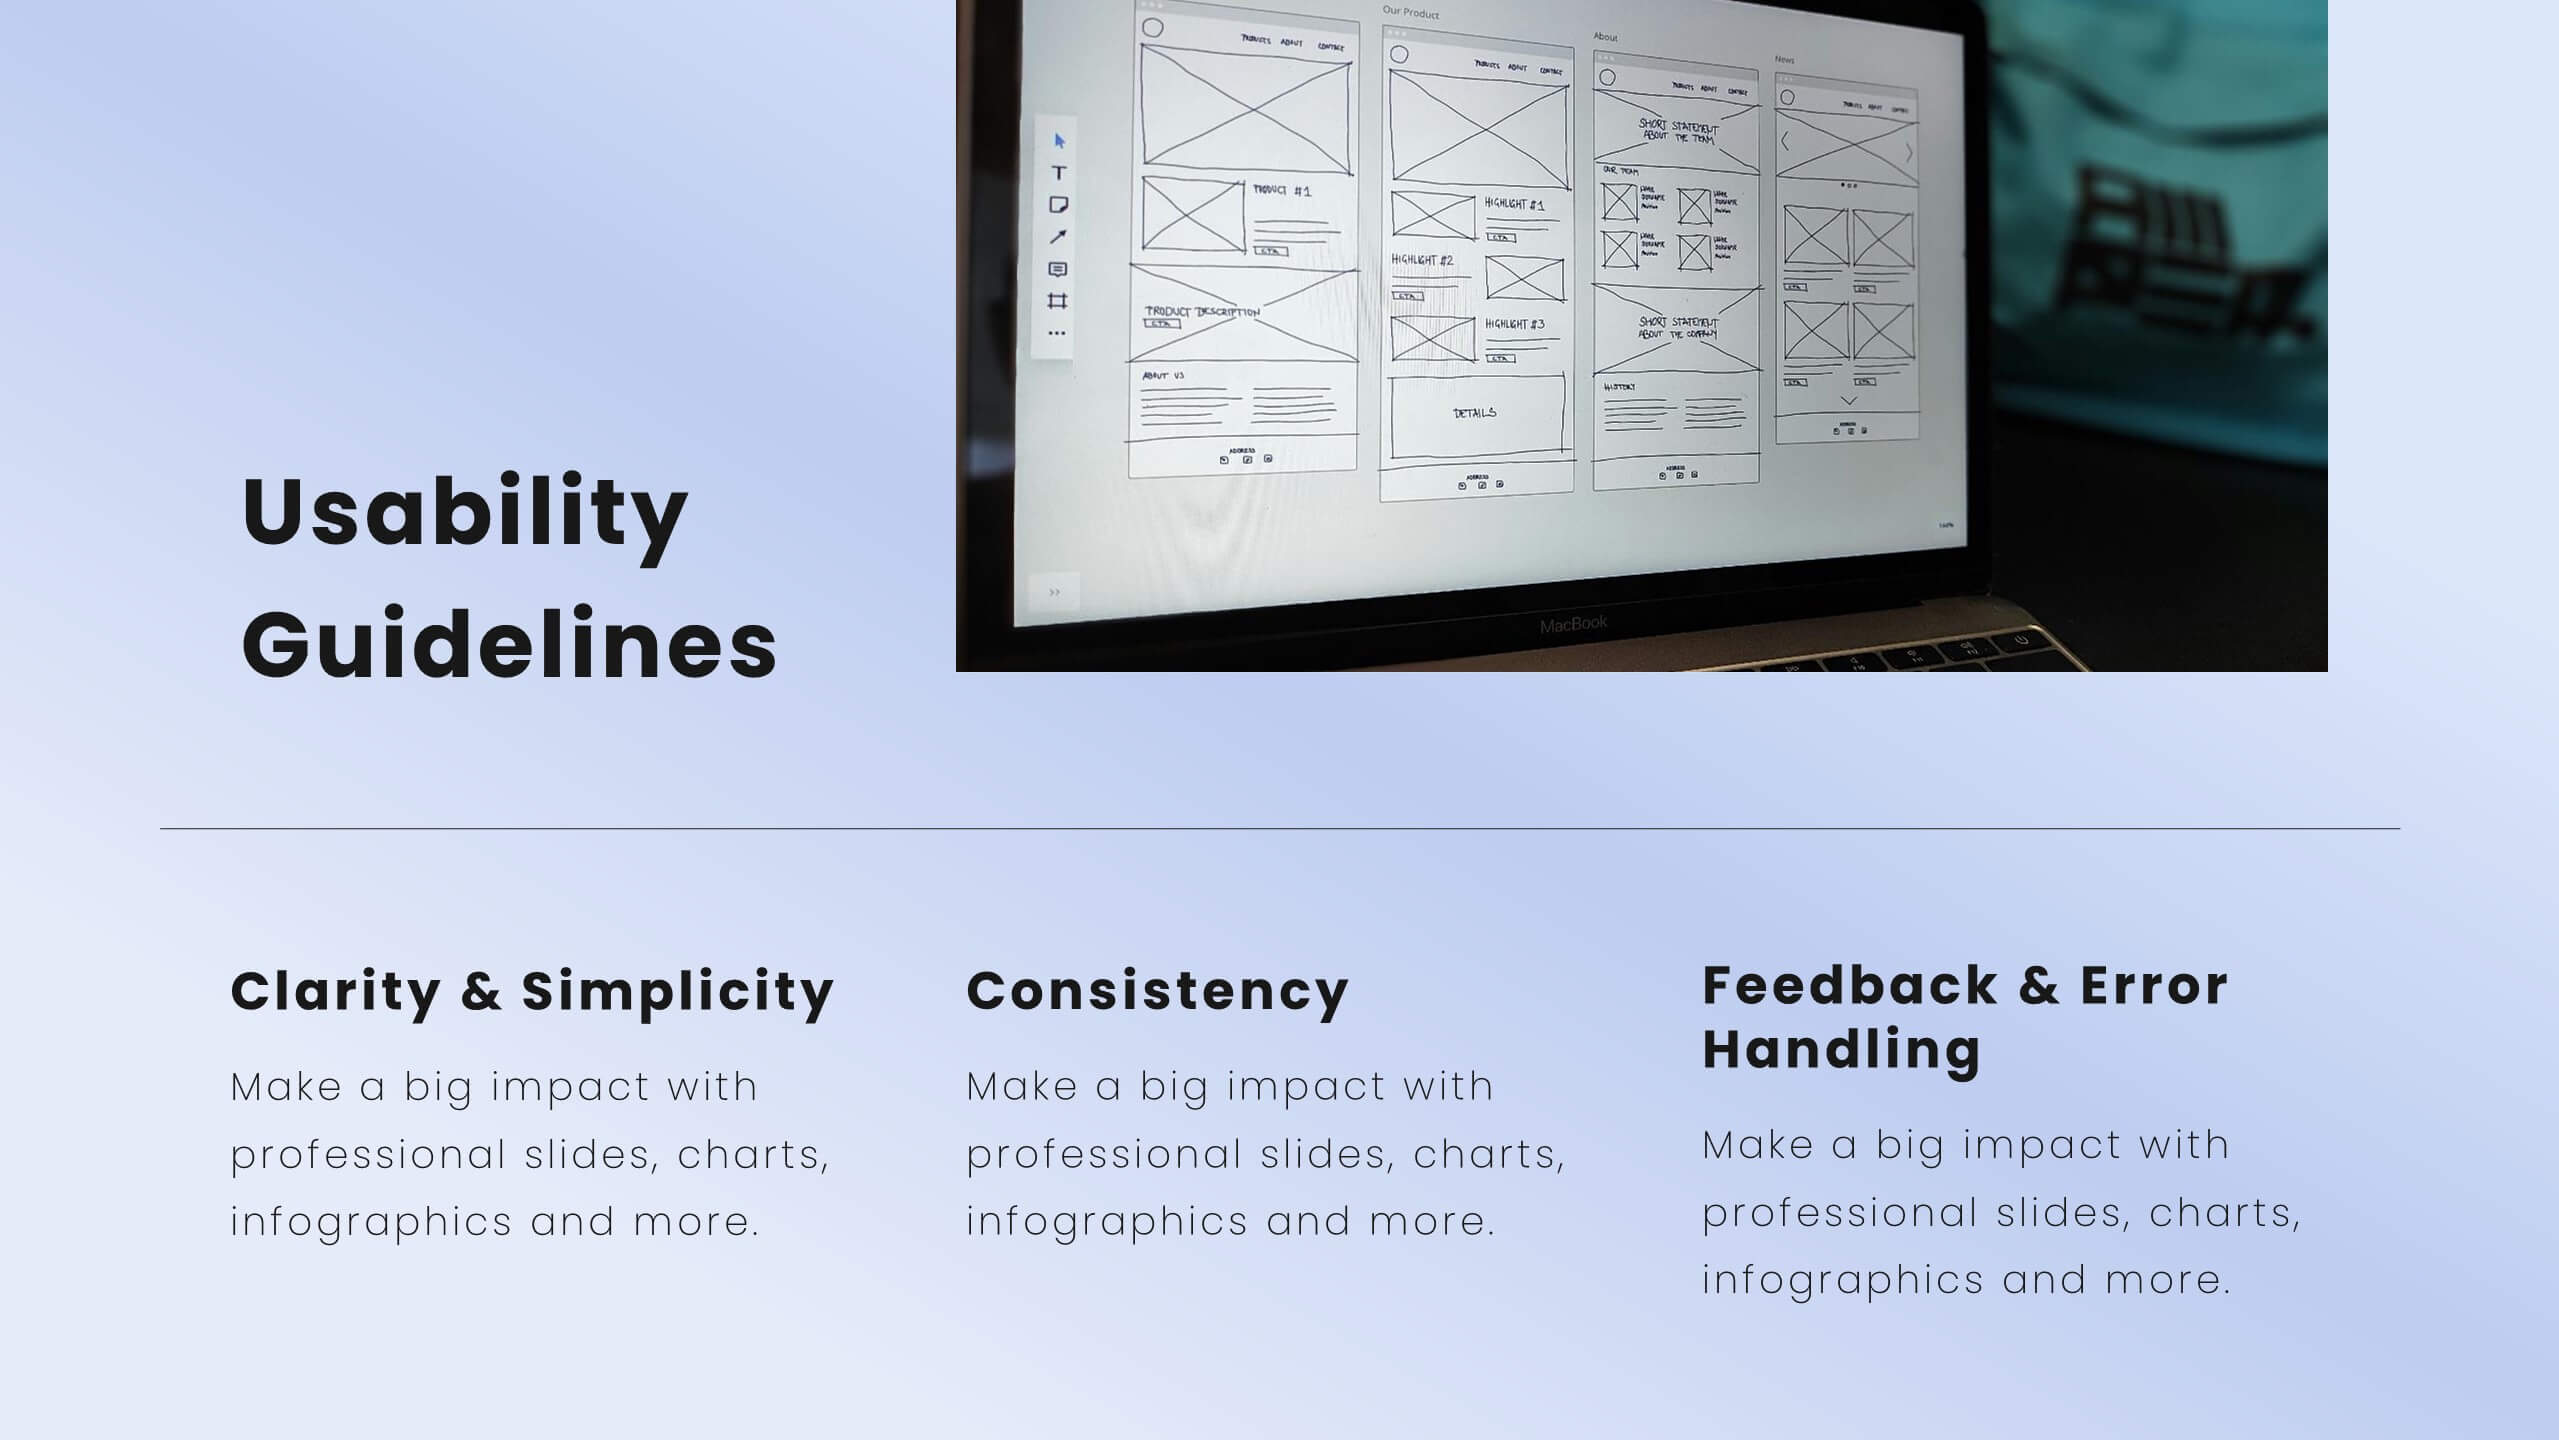
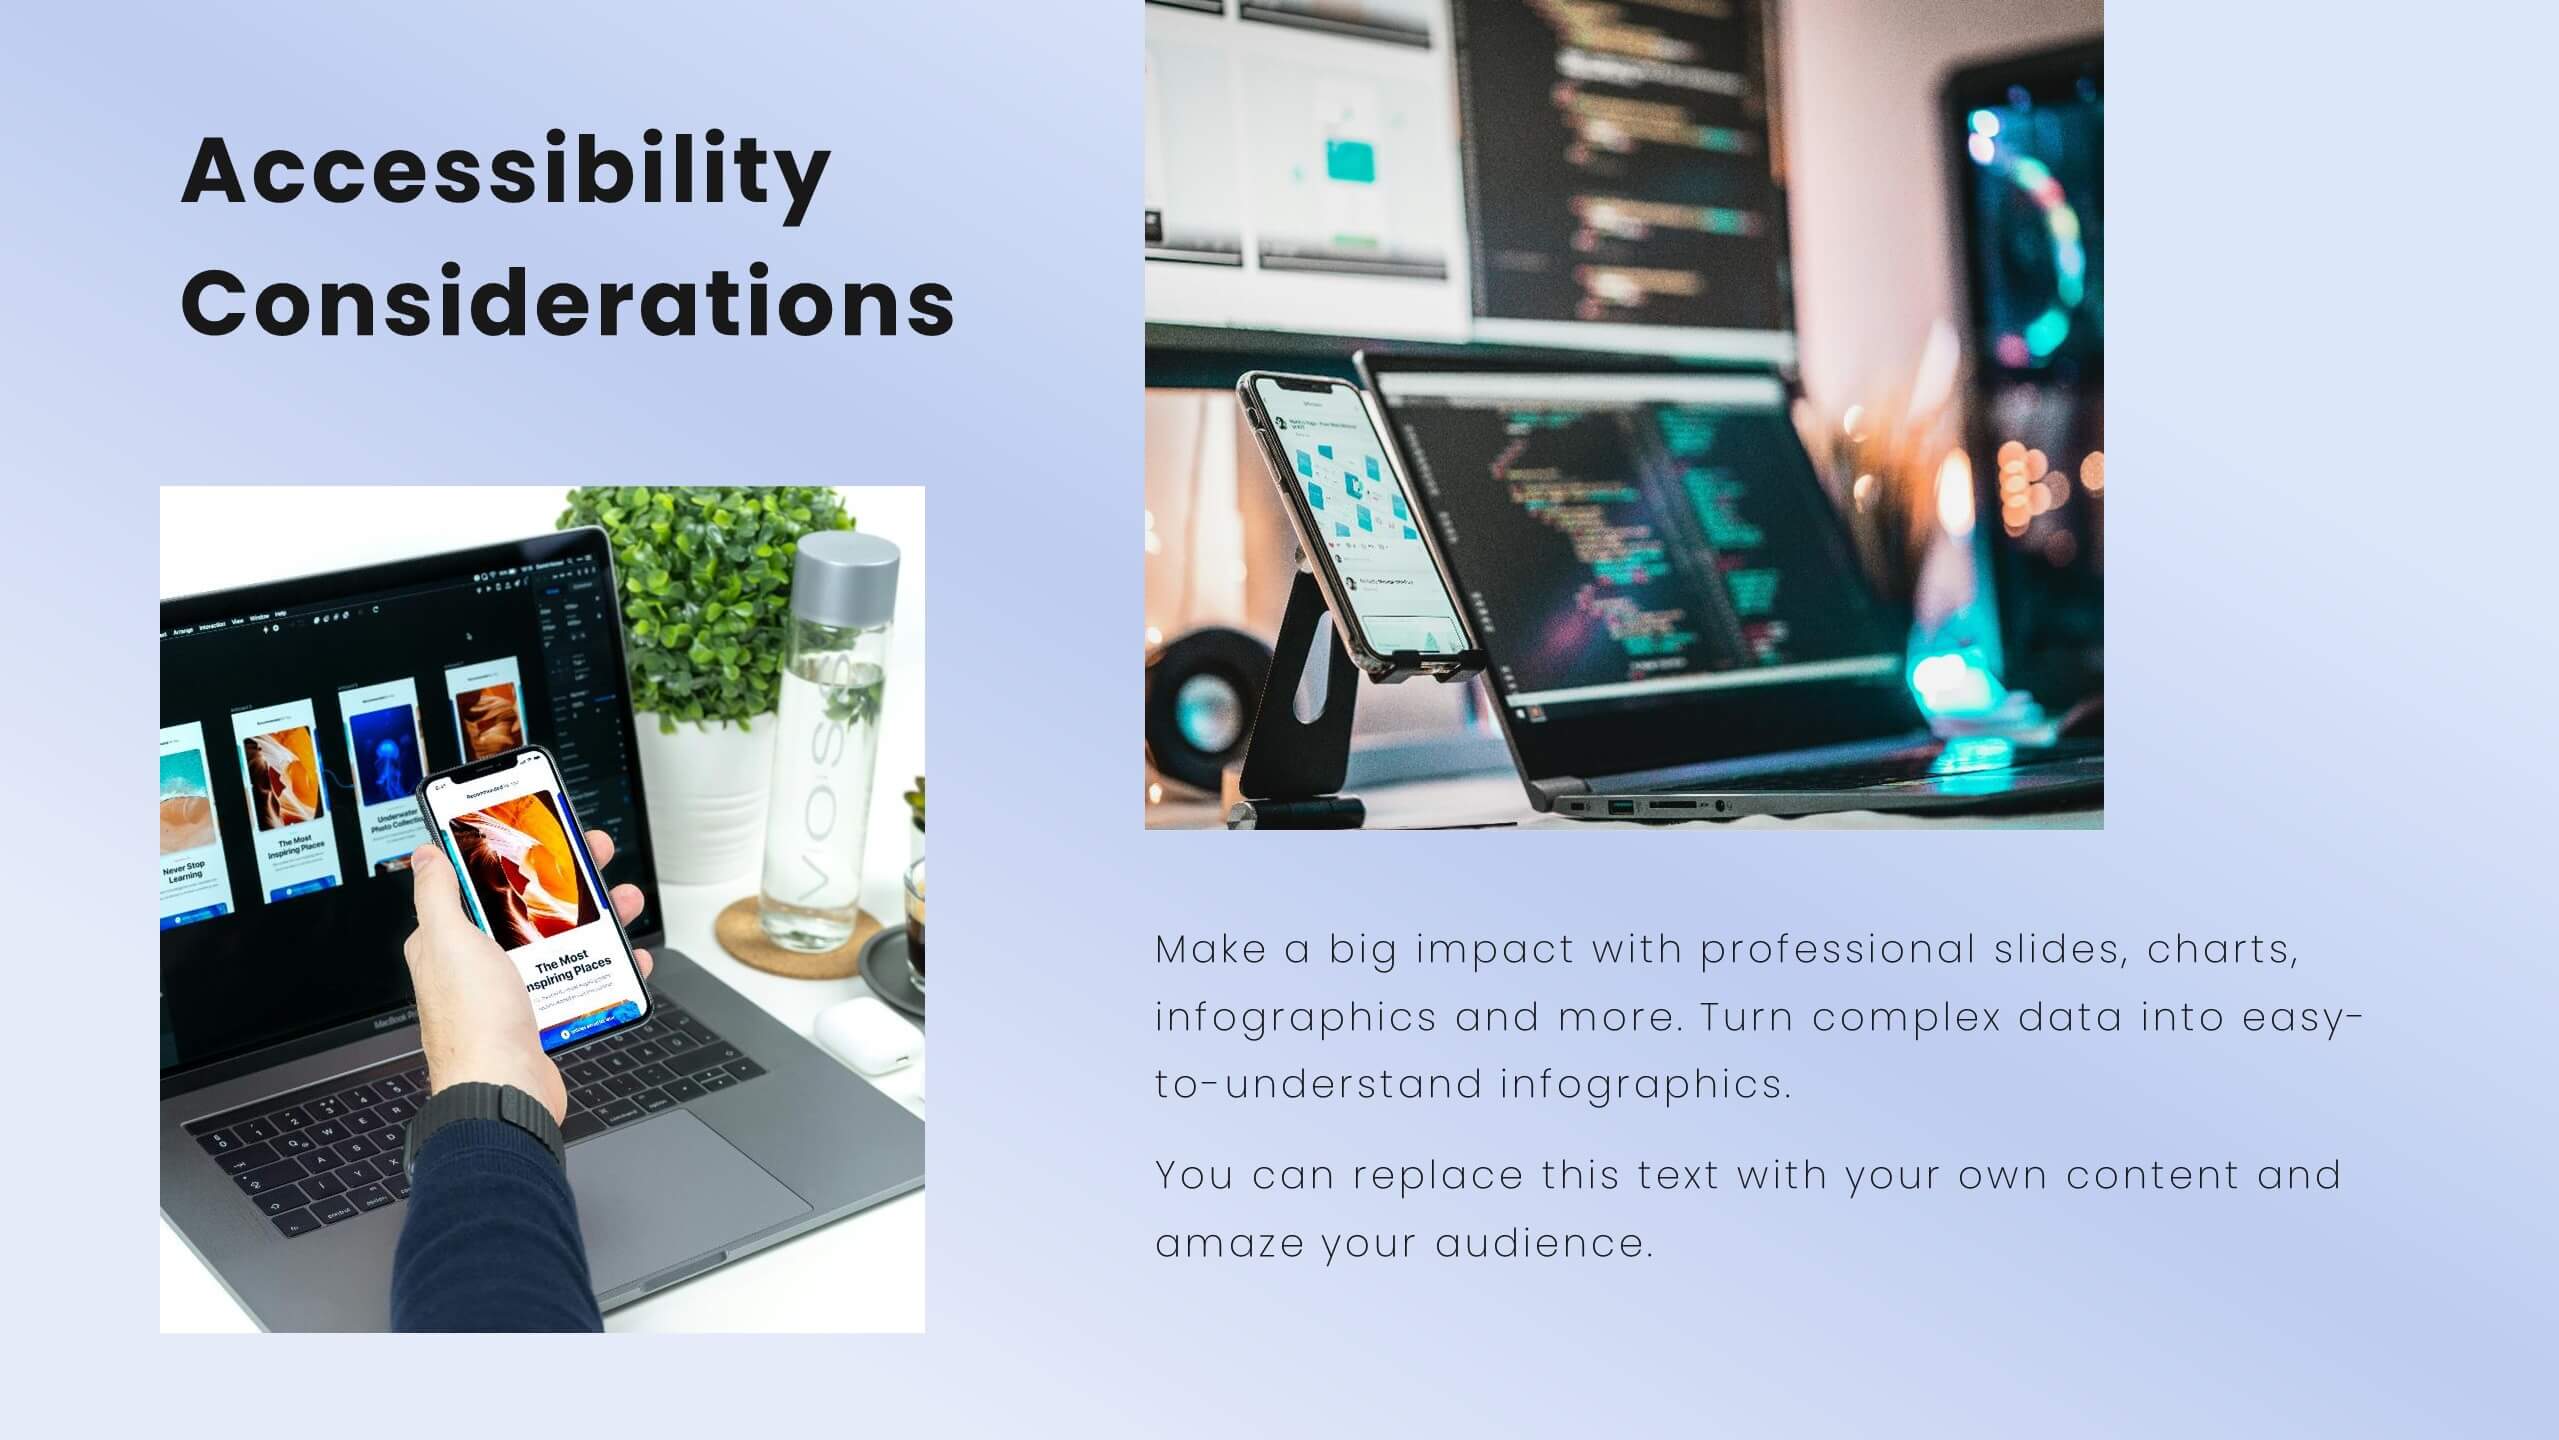
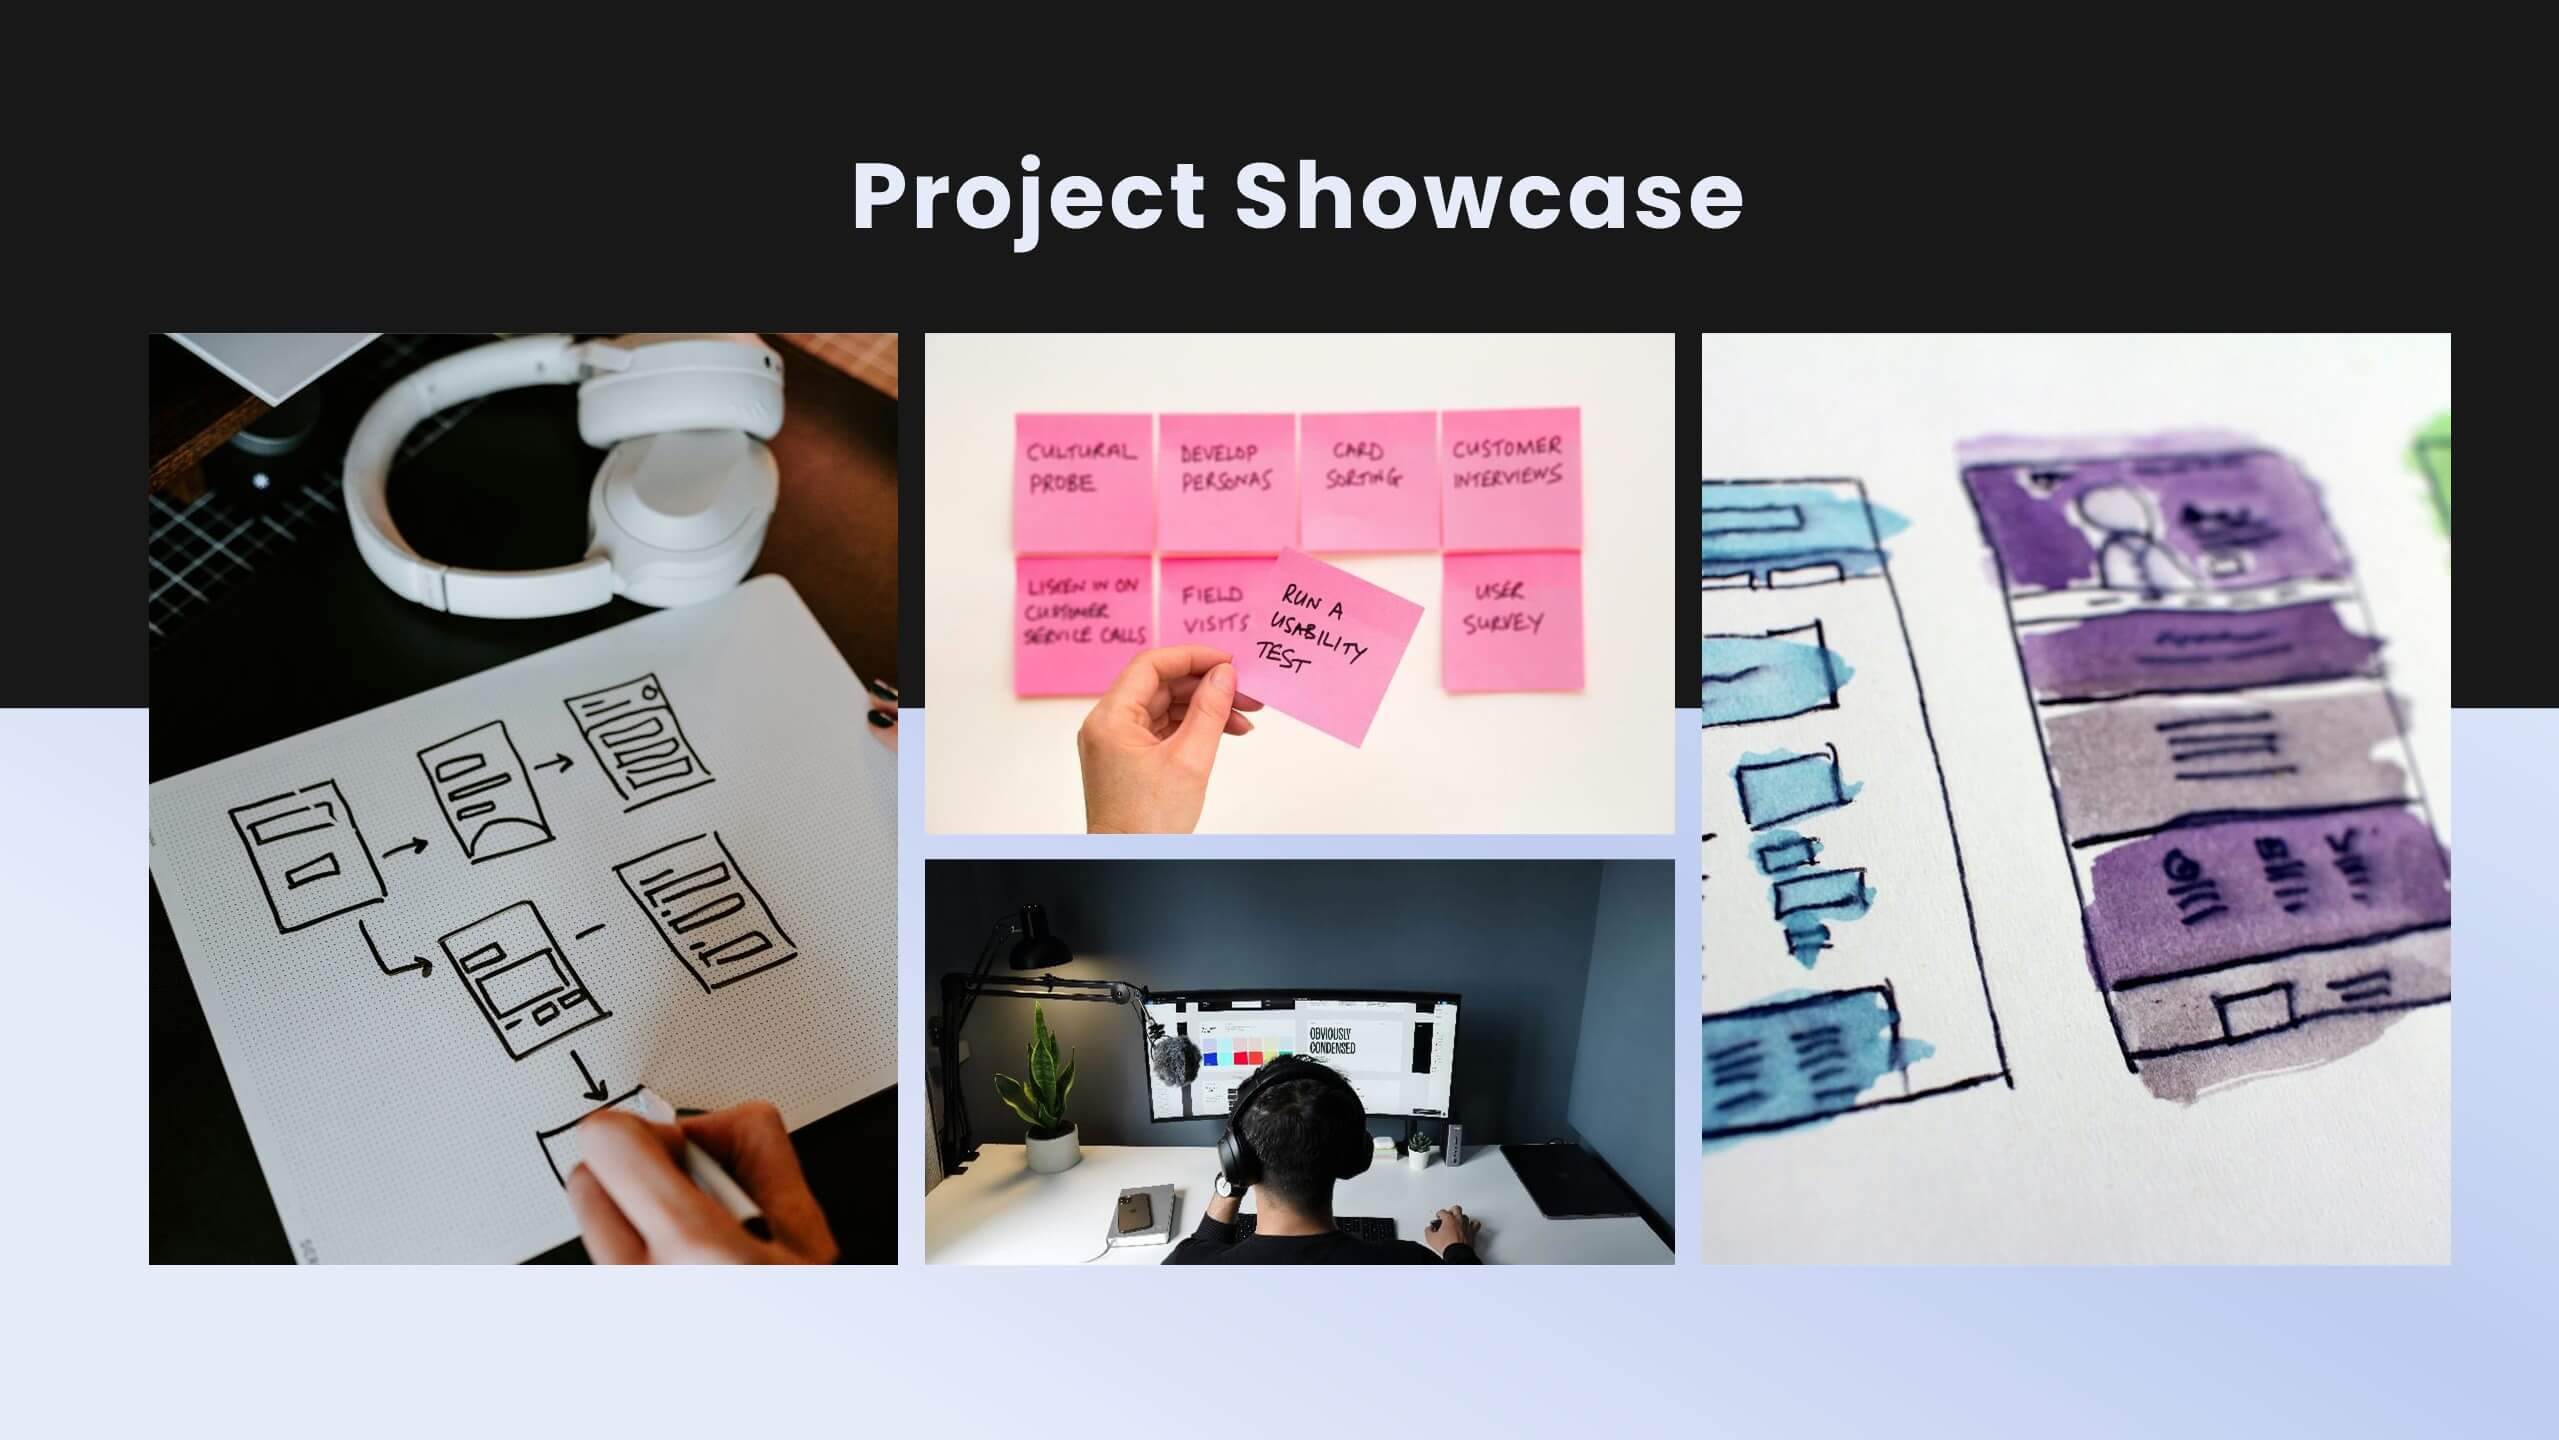
Jigsaw User Experience Proposal Presentation
Enhance user experience with this comprehensive UX proposal template! Perfect for outlining user research, personas, and design principles. Ideal for UX/UI designers aiming to present their strategies and solutions. Compatible with PowerPoint, Keynote, and Google Slides, this template ensures your UX proposals are clear, professional, and impactful. Create exceptional user experiences today!


6 slides
Budget and Expense Breakdown Presentation
Kickstart your financial story with a clean, energetic visual that makes every cost and category instantly understandable. This presentation helps you break down spending, compare expenses, and highlight key budget insights using a simple, structured layout. Perfect for reports and planning meetings. Fully compatible with PowerPoint, Keynote, and Google Slides.


21 slides
Slumbera Product Roadmap Presentation
Plan and showcase your product strategy with this clean and professional template. Cover key aspects such as product overview, target market, competitive analysis, and marketing strategy to align stakeholders and drive success. Fully customizable and compatible with PowerPoint, Keynote, and Google Slides.


26 slides
Spa and Wellness Company Profile Presentation
Embark on a journey to wellness and relaxation with our serene well spa & wellness company profile presentation. This template will Immerse your audience in a world of calmness, rejuvenation, and health. Present your company's mission and vision for promoting wellness. Compatible with Powerpoint, Keynote, and Google Slides. The soothing shades of pastels and soft hues create a peaceful atmosphere. This template integrates elements of nature like leaves, flowers, or waves to evoke serenity. This presentation is designed to captivate your audience and immerse them in the world of relaxation.


14 slides
IT Service Operations Strategy
Simplify complex IT operations into an intuitive visual strategy. This slide features a dynamic radial flow diagram and labeled segments to illustrate service components, support tiers, or incident flows. Perfect for IT managers, consultants, and teams aligning service delivery with business goals. Fully editable in PowerPoint, Keynote, or Google Slides


6 slides
Change Management Process Infographic
Change management is a structured approach used by organizations to transition from their current state to a desired future state. This infographic template is designed to showcase the steps and components involved in managing organizational changes effectively. This template helps viewers understand the process and key elements required for successful change management. This informative infographic can be shared with employees, managers, or students to provide a clear understanding of the steps and strategies involved in successfully implementing organizational changes. Compatible with Powerpoint, Keynote, and Google Slides.


5 slides
Regional Sales Heatmap Presentation
Showcase performance by region with this Regional Sales Heatmap Presentation. This template highlights U.S. state-by-state sales data using gradient color coding and a clear legend system. Easily customizable for quarterly reports, territory analysis, or sales strategy reviews. Compatible with PowerPoint, Keynote, and Google Slides.


15 slides
Business Infographic Presentation Template
A business is an organization engaged in commercial, industrial, or professional activities. A Business Infographic is a visual representation of information related to business topics like marketing, sales, finance, project management, customer service, and more. Using the graphics, charts, icons, and other design elements provided, create the best presentation. These infographics are usually used to help explain business concepts, show trends and results, and communicate information to employees, stakeholders, customers, and for students. Use this for presentations, reports and websites!


20 slides
Sylph Design Portfolio Presentation
Dive into a creative journey with this visually striking design portfolio presentation template! Ideal for showcasing design processes, mood boards, and final outcomes, it’s perfect for impressing clients or stakeholders. Highlight your design skills and methodology with this modern, sleek format. Compatible with PowerPoint, Keynote, and Google Slides for seamless integration into your workflow.


5 slides
Cryptocurrency Scams Infographics
Navigate the intricate world of digital currency with our cryptocurrency scams infographics template. This essential tool, designed with an informative and vertical style, serves as a beacon for investors, financial advisors, and digital currency enthusiasts, providing safeguarding strategies against the rising tide of cryptocurrency scams. Set against a bold palette of purple, yellow, and green, the template employs crisp graphics, decipherable icons, and strategic image placeholders to break down complex scam methodologies and preventive measures. Compatible with Powerpoint, Keynote, and Google Slides. Promote informed decision-making in the volatile cryptocurrency market.