


Features
- 6 Unique slides
- Fully editable and easy to edit in Microsoft Powerpoint, Keynote and Google Slides
- 16:9 widescreen layout
- Clean and professional designs
- Export to JPG, PDF or send by email


Do you have any questions?
Recommend


4 slides
Business KPI Metrics Dashboard Presentation
Track and present your key performance indicators clearly with this Business KPI Metrics Dashboard Presentation. Featuring modern gauge visuals, color-coded performance bars, and sectioned data blocks, this template helps you showcase financial, customer, and operational KPIs in a single glance. Fully editable and ideal for business reviews, team updates, and performance reports. Compatible with PowerPoint, Keynote, and Google Slides.


5 slides
IT Support and Systems Presentation
Streamline your tech communication with a clean, structured layout that highlights your IT services, support processes, and system workflows. Perfect for teams presenting solutions, infrastructure overviews, or technical strategies, this presentation brings clarity to complex topics. Fully compatible with PowerPoint, Keynote, and Google Slides for effortless editing and delivery.


5 slides
RAPID Decision-Making Model Presentation
The RAPID Decision-Making Model template simplifies complex decision processes, laying out steps from recommending to deciding in an easily digestible format. It's ideal for team leaders and managers who want to streamline decision-making. The template is designed for seamless use across PowerPoint, Keynote, and Google Slides, ensuring broad compatibility and user-friendly presentations.


6 slides
Human Resources Job Infographic
Human Resources (HR) refers to the department or function within an organization that is responsible for managing the human capital, workforce, and related processes. This infographic template serves as a helpful guide for individuals interested in pursuing a career in HR or for HR professionals looking to understand the different career paths and opportunities available in their field. This infographic uses visuals, icons, and graphics to make the content more engaging and easily understandable. The layout of the infographic is organized and easy to navigate, allowing viewers to quickly find information about different HR job roles.


7 slides
Business Model Canvas Segments Infographic Presentation
The Business Model Canvas is a strategic management and entrepreneurial tool that helps businesses to visualize, analyze, and develop their business models. This template gives you the ability to create a visually attractive infographic while presenting your business model in a professional format. This eye-catching template is made to help your audience visualize the business model you are presenting and easily follow it with the instructive text slides. Customize this template in just a couple of minutes. Simple and easy to use, ready to be edited with colors and graphics of your choice.


22 slides
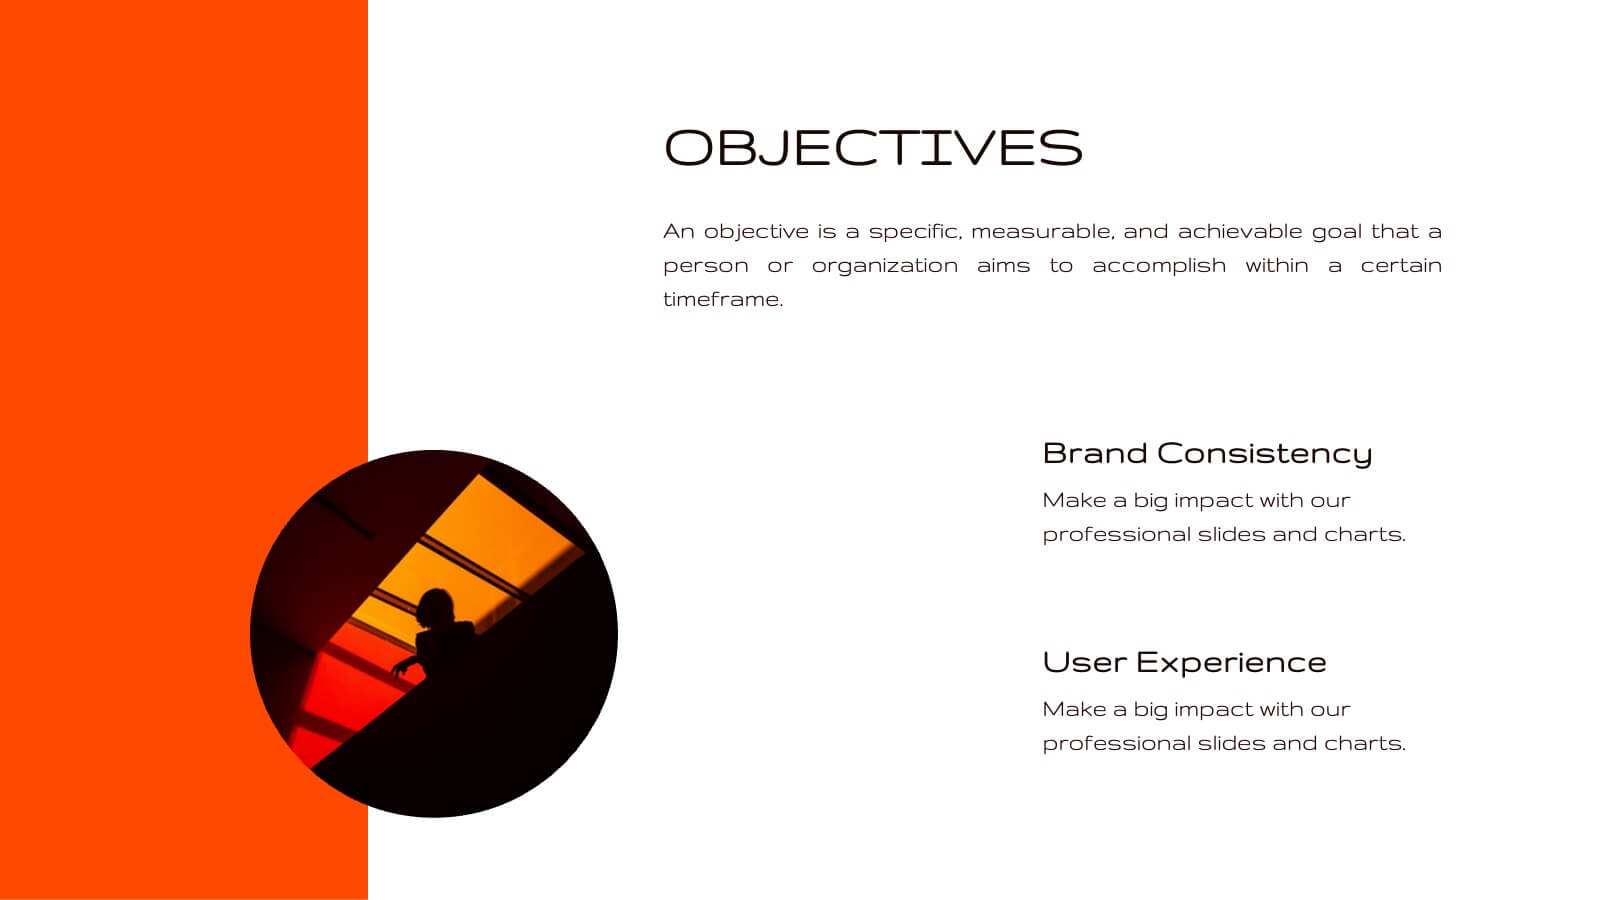
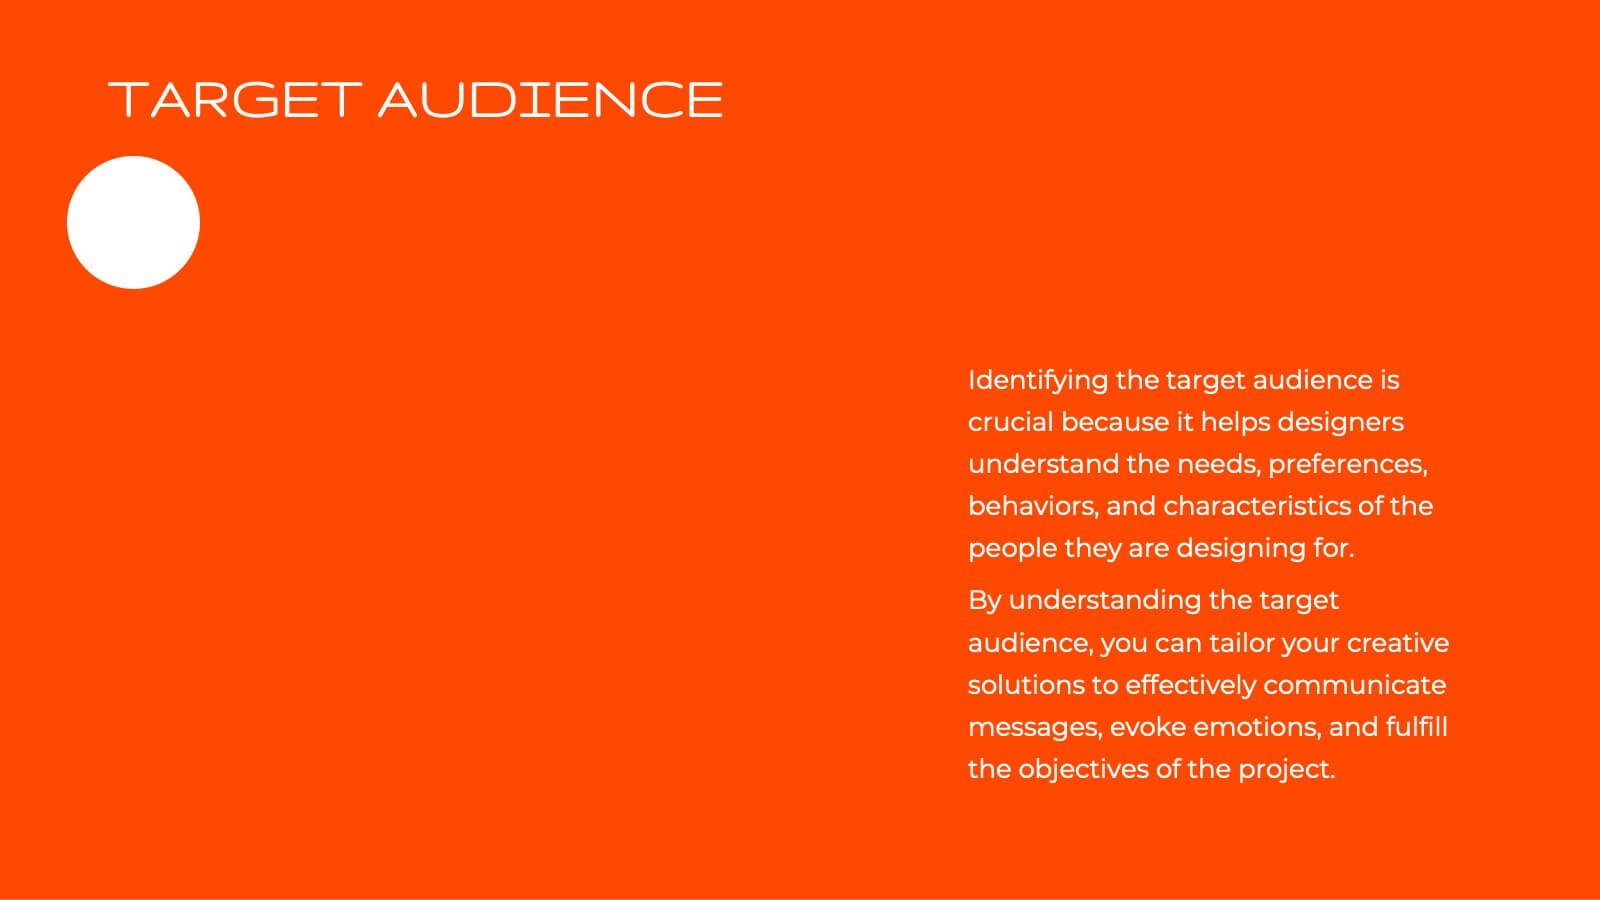
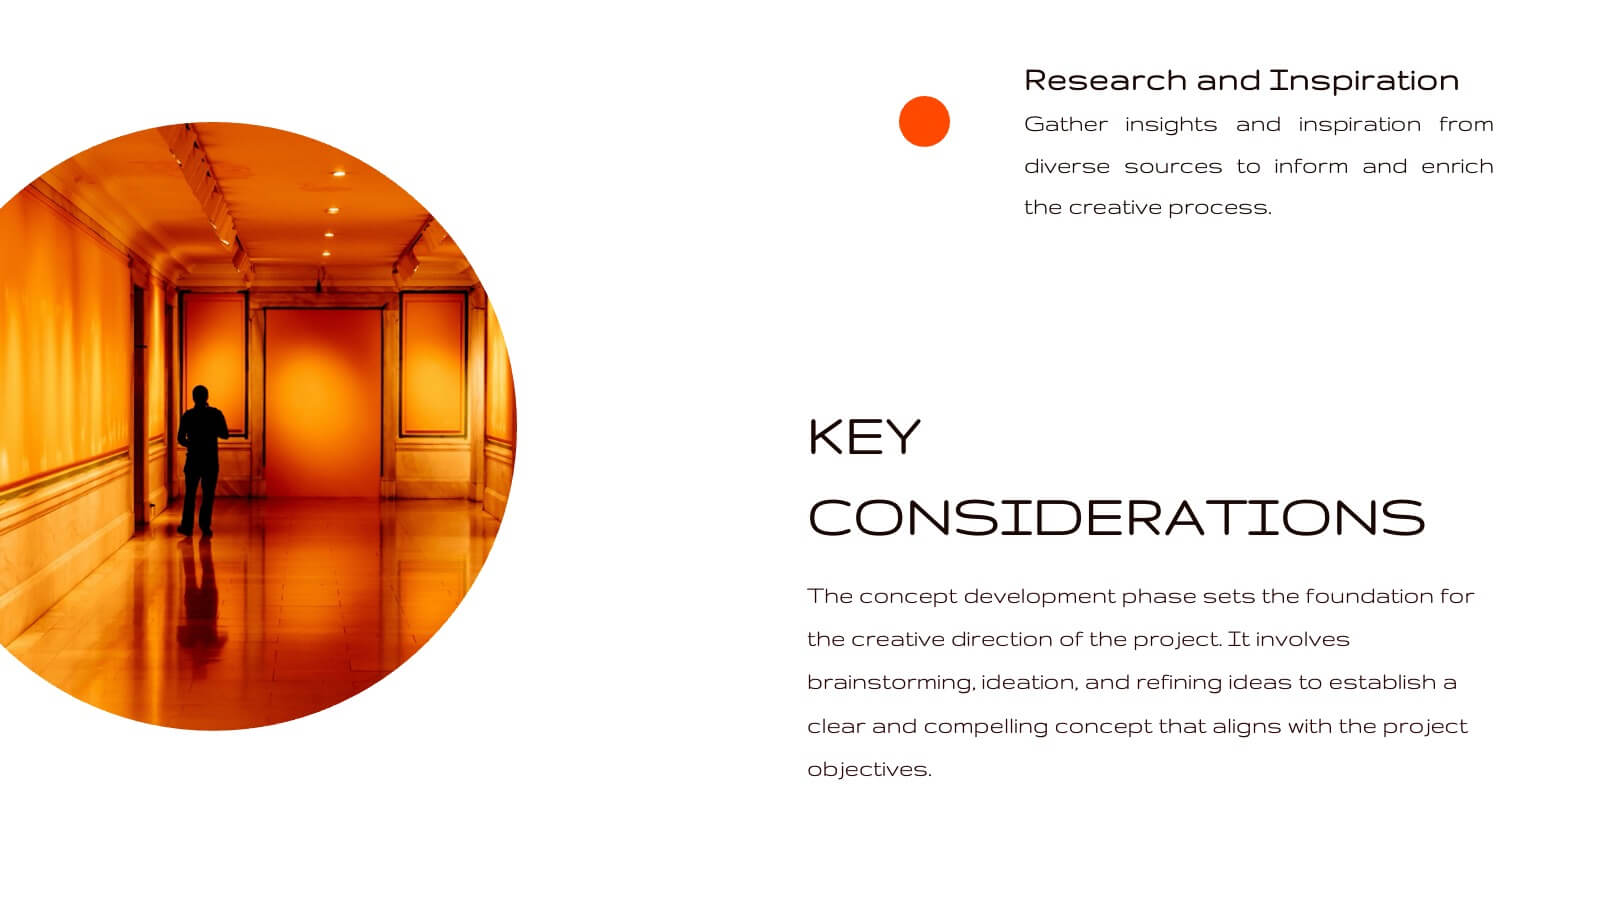
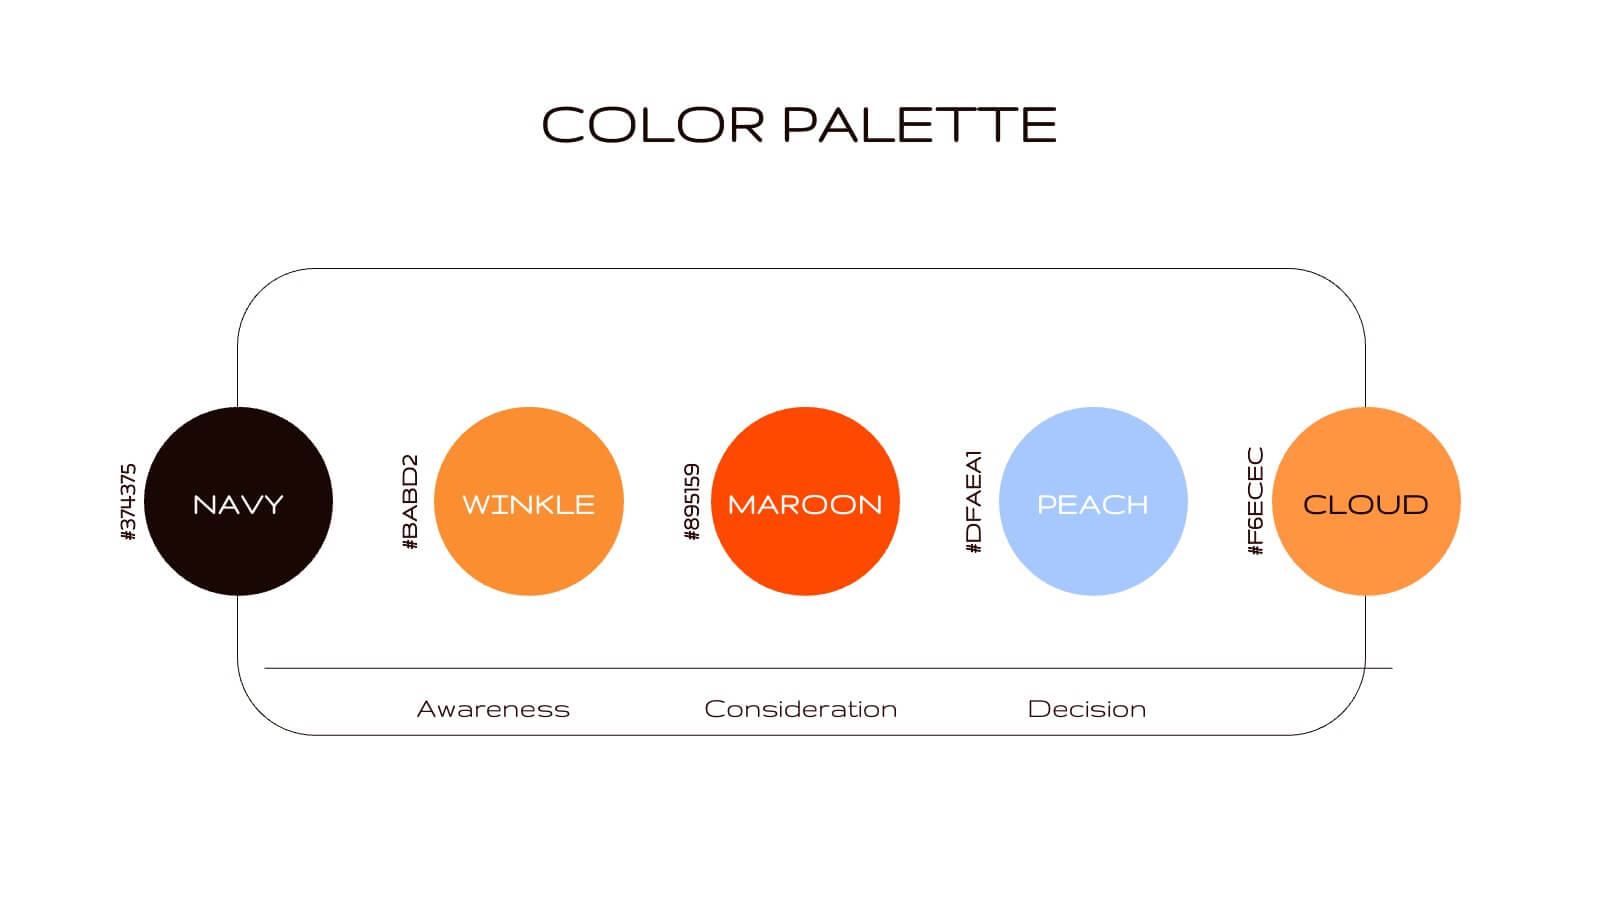
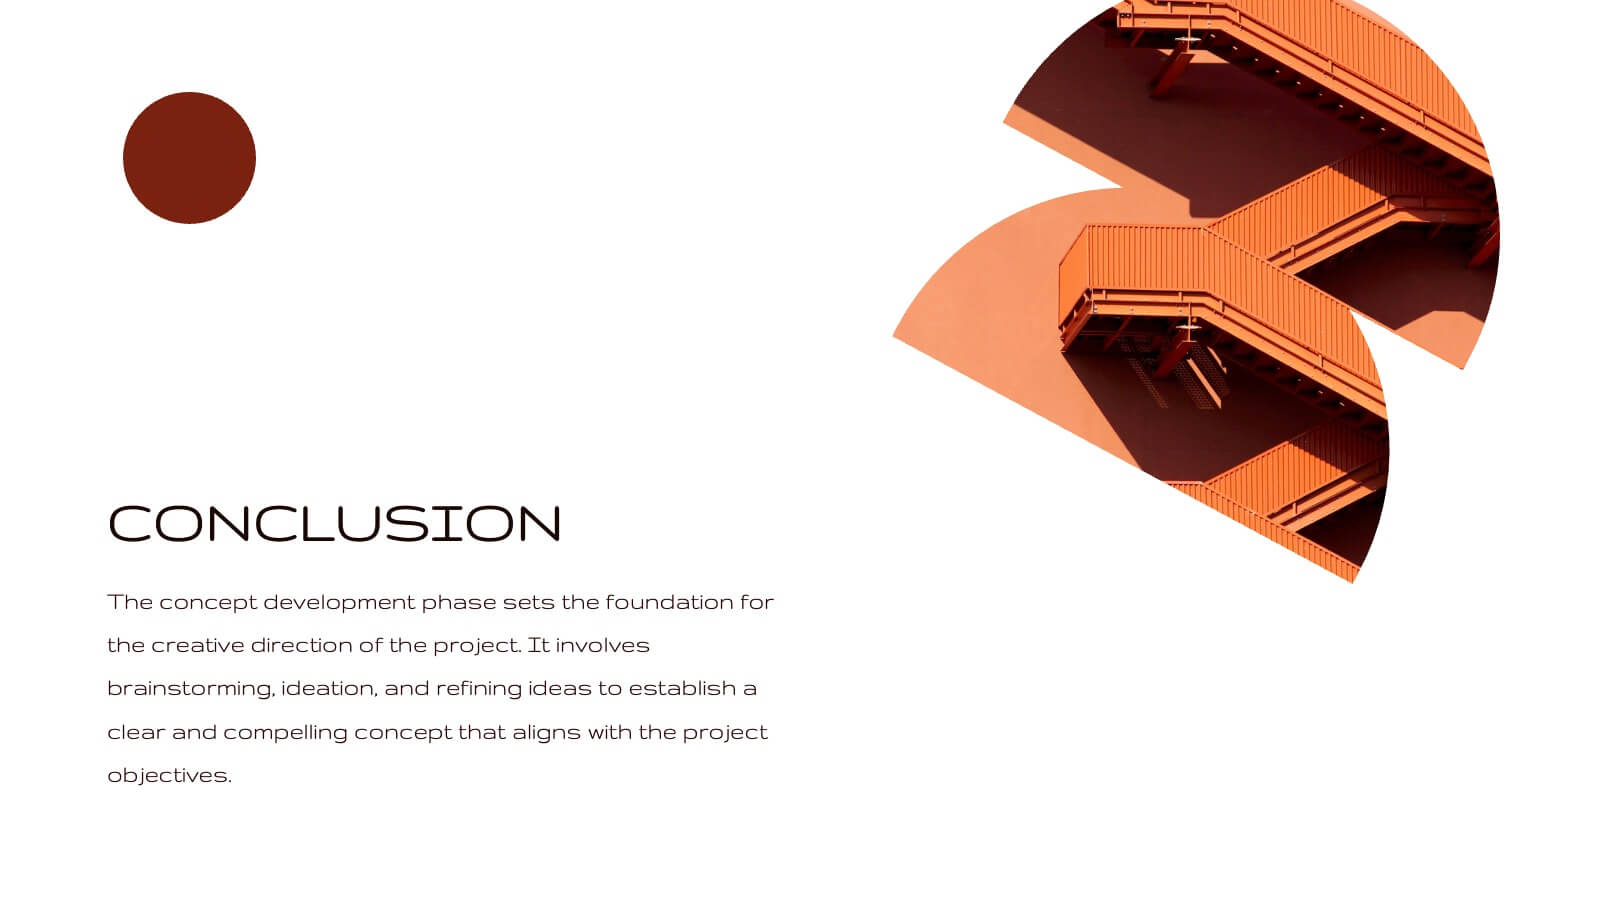
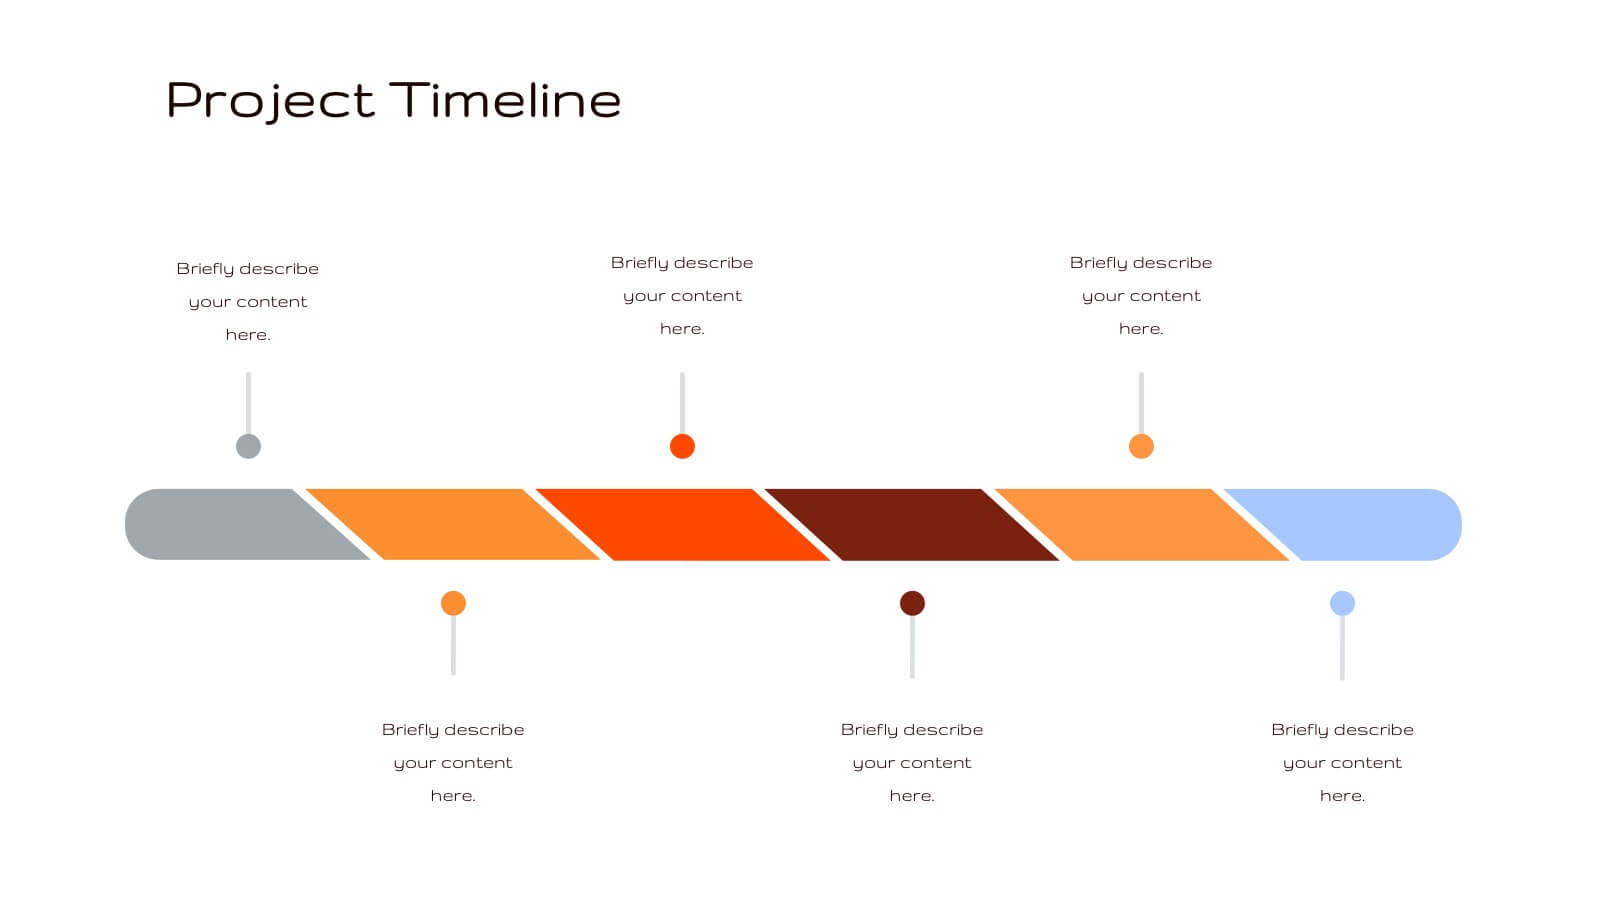
Radiance Creative Design Report Presentation
Bring your design ideas to life with this vibrant, engaging presentation template. Ideal for showcasing creative processes, concept development, and project timelines, it features a striking color palette and clean layout. This template is designed to captivate your audience and clearly communicate your design vision. Compatible with PowerPoint, Keynote, and Google Slides, it’s perfect for any platform.


6 slides
Global Transportation & Logistics Infographics
The "Global Transportation and Logistics" infographic template, suitable for PowerPoint, Keynote, and Google Slides, is an invaluable tool for professionals in the logistics, shipping, and supply chain industries. This comprehensive template is designed to effectively communicate the complexities and scope of global transportation and logistics. This template features key elements such as global shipping routes, logistics management, and supply chain operations. Its detailed and informative design is perfect for presentations that need to illustrate the intricacies of global logistics, from transportation networks to logistical challenges. This is especially useful for strategic planning, educational purposes, or corporate presentations in the logistics sector. The color scheme of the template reflects global connectivity and efficiency, incorporating shades of blue, green, and earth tones. This professional and visually appealing design not only enhances the clarity of the information but also adds a global perspective to your presentation. Whether used for training, client meetings, or industry conferences, this template ensures your insights into global transportation and logistics are presented with precision and professionalism.


5 slides
Modern Home Layout Slides Presentation
Give your design ideas a modern edge with this clean, architectural presentation. Perfect for showcasing home layouts, interior concepts, or real estate projects, it combines structure and creativity to keep viewers engaged. Fully customizable and compatible with PowerPoint, Keynote, and Google Slides for effortless editing and professional delivery.


8 slides
Europe Market Trends with Europe Map Presentation
Showcase key market insights with this Europe-focused presentation. Highlight regional trends using data-driven visuals, including percentage indicators and color-coded country comparisons. Ideal for marketing reports, business expansion plans, or performance reviews. Fully editable and compatible with PowerPoint, Keynote, and Google Slides for seamless customization across platforms.


5 slides
Employee Change Management Plan Presentation
Guide employees through transitions with clarity using this Employee Change Management Plan template. This step-by-step visual represents progress from initial stages (20%) to full implementation (100%), making it ideal for HR strategies, organizational development, and workforce transformation initiatives. Fully customizable—adjust colors, text, and data points to fit your business needs. Compatible with PowerPoint, Keynote, and Google Slides for seamless integration into your presentations.


8 slides
Achievements and Goals Milestone
Illustrate your team's journey with this visually engaging milestone roadmap. Featuring a step-by-step block design with space for five key accomplishments, it's perfect for goal tracking, progress reviews, or roadmap presentations. Fully editable in PowerPoint, Keynote, and Google Slides.


7 slides
Editable Gantt Timeline Presentation
Stay on top of your project deadlines with this Editable Gantt Timeline Presentation. Designed with a clean monthly layout and six task rows, it makes scheduling and tracking progress simple. Customize task names, durations, and icons easily. Perfect for PowerPoint, Keynote, or Google Slides for professional project planning.


5 slides
Porter's Five Forces Market Analysis
Visualize competitive dynamics with this clear, easy-to-follow Porter’s Five Forces slide. Each force—Buyer Power, Supplier Power, Competitive Rivalry, Threat of Substitution, and Threat of New Entry—is color-coded and icon-labeled for quick reference. Perfect for strategy meetings, SWOT comparisons, or investment pitches. Editable in PowerPoint, Keynote, and Google Slides.


4 slides
Strategic Triangle Model Slide
Visualize your core pillars with this Strategic Triangle Model Slide Presentation. Featuring a clean triangular layout with three editable segments, this template is perfect for showcasing frameworks such as mission-vision-values, policy-strategy-impact, or key business objectives. Each point of the triangle is paired with an icon and customizable text, making complex concepts easy to digest. Ideal for strategy planning, leadership discussions, or consulting proposals. Fully editable in PowerPoint, Google Slides, and Keynote.


7 slides
Customer Loyalty Program Infographic Presentation
Introducing our new customer loyalty program infographics template, the perfect tool for any business looking to boost customer engagement and loyalty! It's easy for you to create an engaging and effective presentation with these Infographics. With our template, you can add a touch of creativity to your presentation with a fun color scheme and infographic visuals with editable text. Whether you're presenting customer rewards or loyalty program benefits, our template will help you communicate your ideas in a clear and engaging way. So why wait? Start boosting your customer engagement and loyalty today with our amazing template!


4 slides
Climate Change Impact Stages Presentation
The "Climate Change Impact Stages" presentation template is designed to effectively communicate the various aspects of climate change impacts on an organizational or global scale. It utilizes a straightforward tag design with letters A through D, where each tag can detail a specific area of impact or response strategy related to climate change. This visually appealing layout helps categorize information neatly, making it easier for the audience to follow along and understand the segmented data or proposals. Ideal for environmental seminars, corporate sustainability reports, or educational purposes, this template serves as a functional tool to highlight crucial information regarding climate change challenges and solutions.


6 slides
Market Structure Infographics
Explore market structure effectively with our Market Structure infographic template. This template is fully compatible with popular presentation software like PowerPoint, Keynote, and Google Slides, allowing you to easily customize it to illustrate and communicate various aspects of market structures. The Market Structure infographic template offers a visually engaging platform to explain different types of market structures, including perfect competition, monopolistic competition, oligopoly, and monopoly. Whether you're a student, economist, business professional, or anyone interested in economics and market dynamics, this template provides a user-friendly canvas to create informative presentations and educational materials. Deepen your understanding of market structure with this SEO-optimized infographic template, thoughtfully designed for clarity and ease of use. Customize it to showcase the characteristics, examples, and implications of each market structure, ensuring that your audience gains valuable insights into how markets function. Start crafting your personalized infographic today to explore the world of market structure in economics.