


Features
- 10 Unique Slides
- Fully editable and easy to edit in Microsoft Powerpoint, Keynote and Google Slides
- 16:9 widescreen layout
- Clean and professional designs
- Export to JPG, PDF or send by email


Do you have any questions?
Recommend


5 slides
Insurance Policy Structure Presentation
Add a touch of creativity to your financial reports with this clean and modern presentation design. Perfect for explaining coverage breakdowns, risk management strategies, or policy frameworks, it simplifies complex ideas through visuals. Fully editable and compatible with PowerPoint, Keynote, and Google Slides for a seamless presentation experience.


2 slides
Professional Cover and Title Layout
Make a bold first impression with this stylish and modern cover slide template. Featuring a balanced design of imagery and typography, it's perfect for business reports, marketing decks, or strategic plans. Fully editable in PowerPoint, Keynote, and Google Slides for effortless customization.


7 slides
Behavior Psychology Infographic Presentation
A Psychology Infographic is a visual representation of information related to the field of psychology. This template includes charts, diagrams, and other visual elements that help illustrate concepts, theories, and research findings in psychology. Use this infographic to cover a wide range of topics, such as personality traits, cognitive processes, mental disorders, and social behavior. The purpose of this psychology template is to help people better understand the complex concepts related to psychology. Compatible with Powerpoint, Keynote, and Google Slides this template is fully editable.


6 slides
Company Hierarchy Infographics
Effectively illustrate your company's hierarchy with our Company Hierarchy infographic template. This template is fully compatible with popular presentation software like PowerPoint, Keynote, and Google Slides, allowing you to easily customize it to showcase your organization's structure and reporting relationships. The Company Hierarchy infographic template offers a visually engaging platform to depict the different levels of leadership, departments, and roles within your company. Whether you're an HR professional, manager, or business leader, this template provides a user-friendly canvas to create informative presentations and organizational charts. Optimize your communication of your company's hierarchy with this SEO-optimized Company Hierarchy infographic template, thoughtfully designed for clarity and ease of use. Customize it to showcase leadership teams, reporting lines, and the key responsibilities of each role, ensuring that your audience gains a comprehensive understanding of your organization's structure. Start crafting your personalized infographic today to effectively communicate your company's hierarchy.


4 slides
Business Partnership Development Presentation
Showcase key elements of collaboration with the Business Partnership Development Presentation. This quadrant-style layout is perfect for outlining strategies, stakeholders, or phases of a partnership. Ideal for business proposals, joint ventures, and strategic planning decks. Fully editable in PowerPoint, Keynote, and Google Slides.


4 slides
Colorful Workflow Process Chart Presentation
Bring your workflow to life with a vibrant, easy-to-follow layout that makes every stage feel connected and purposeful. This presentation helps you map processes, explain team roles, and simplify complex steps using a clean, visual flow. Fully compatible with PowerPoint, Keynote, and Google Slides.


6 slides
Effective Time Management Strategie Presentation
Make the most of your hours with this sharp and creative visual layout designed to organize your time-saving game plan. This template highlights key time management strategies, helping you structure priorities and boost daily efficiency. Fully customizable and easy to edit in PowerPoint, Keynote, and Google Slides for seamless presentation use.


6 slides
Organizational Structure Overview Presentation
Map out your team’s structure with clarity using this simple organizational chart template. Ideal for showcasing departments, reporting lines, or team roles, it helps stakeholders quickly understand who’s who and how responsibilities are divided. Perfect for internal meetings, onboarding decks, or company overviews. Works with PowerPoint, Keynote, and Google Slides.


10 slides
Profitability and Cost Analysis
Streamline your financial storytelling with this interlinked diagram template. Designed for business consultants, CFOs, and analysts, it helps visualize cost components and profit drivers across five stages. Each segment is clearly labeled and color-coded for easy comprehension. Fully customizable in PowerPoint, Keynote, and Google Slides.


7 slides
Balance Sheet and Profit Overview Presentation
Give your financial summary a clean, modern look with the Balance Sheet and Profit Overview Presentation. This slide offers a dual-column layout with icons and space for six key financial metrics or business insights—ideal for summarizing assets, liabilities, profits, and more. Easily editable in Canva, PowerPoint, and Google Slides.


10 slides
Real Estate Market Trends Presentation
Stay ahead of Real Estate Market Trends with this data-driven presentation template. Designed for agents, investors, and analysts, this template visually highlights housing trends, market insights, and investment opportunities with engaging layouts. Fully customizable and available for PowerPoint, Keynote, and Google Slides, ensuring a professional and compelling presentation.


21 slides
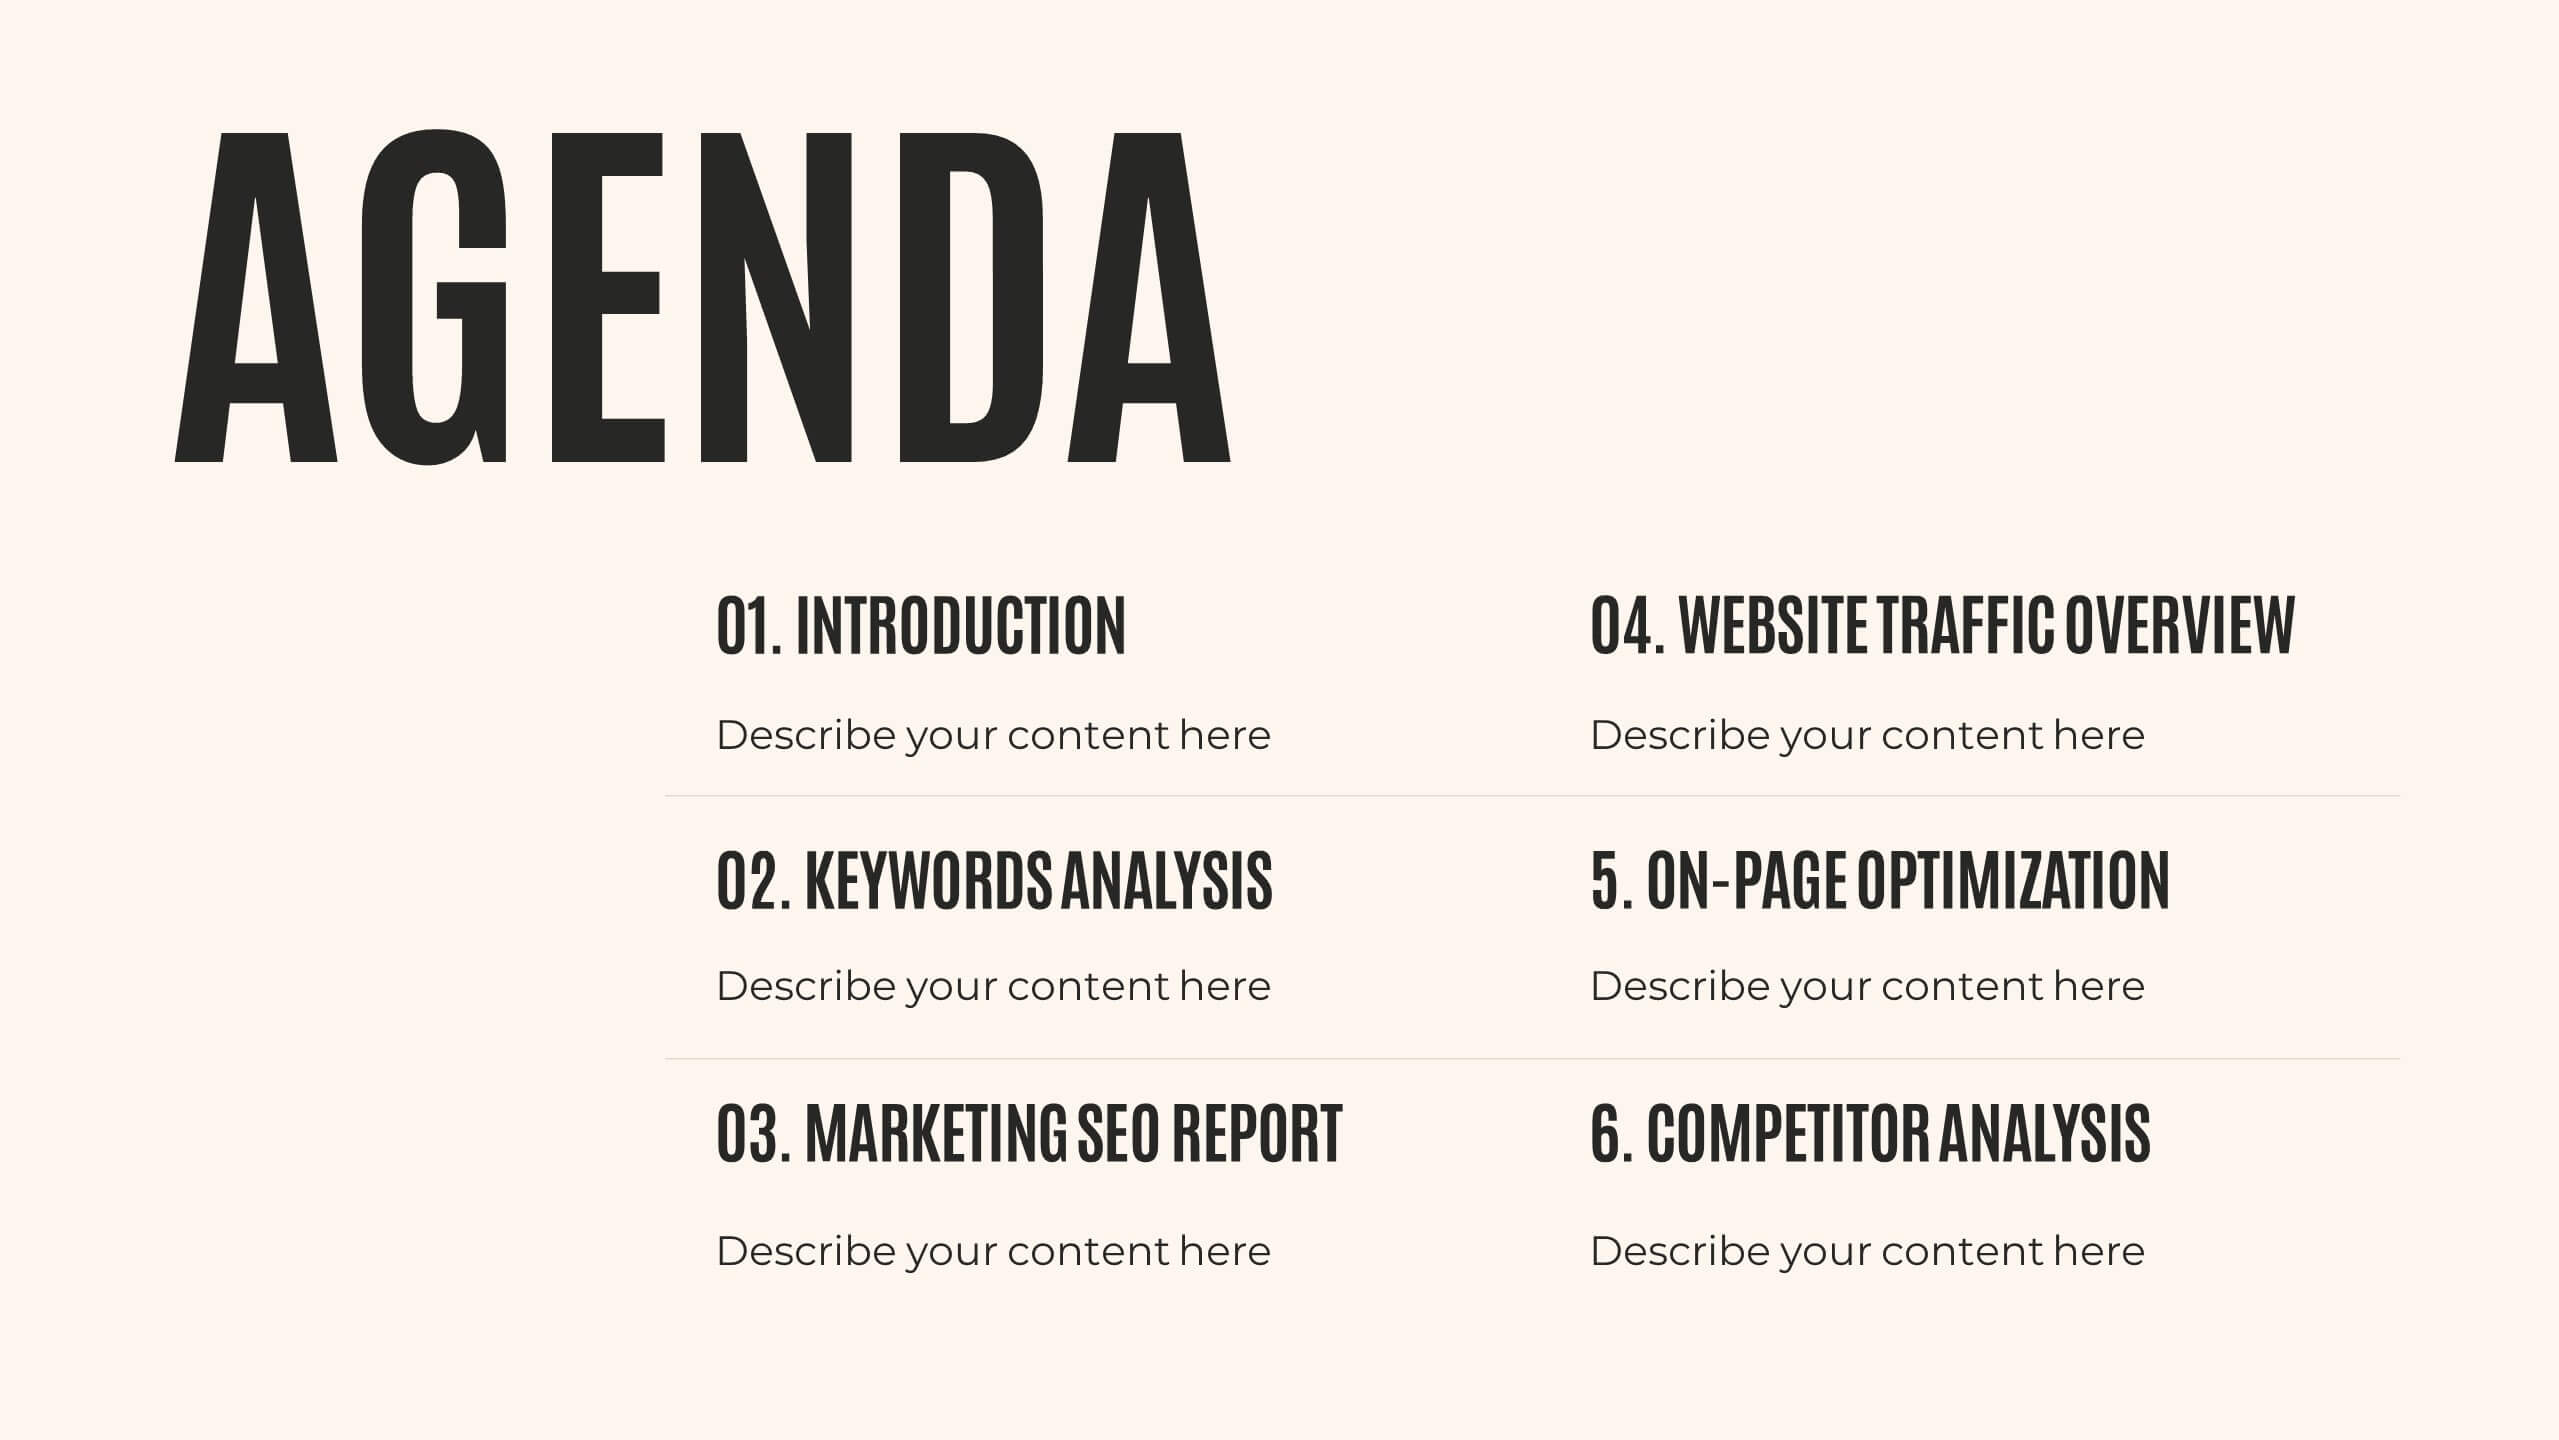
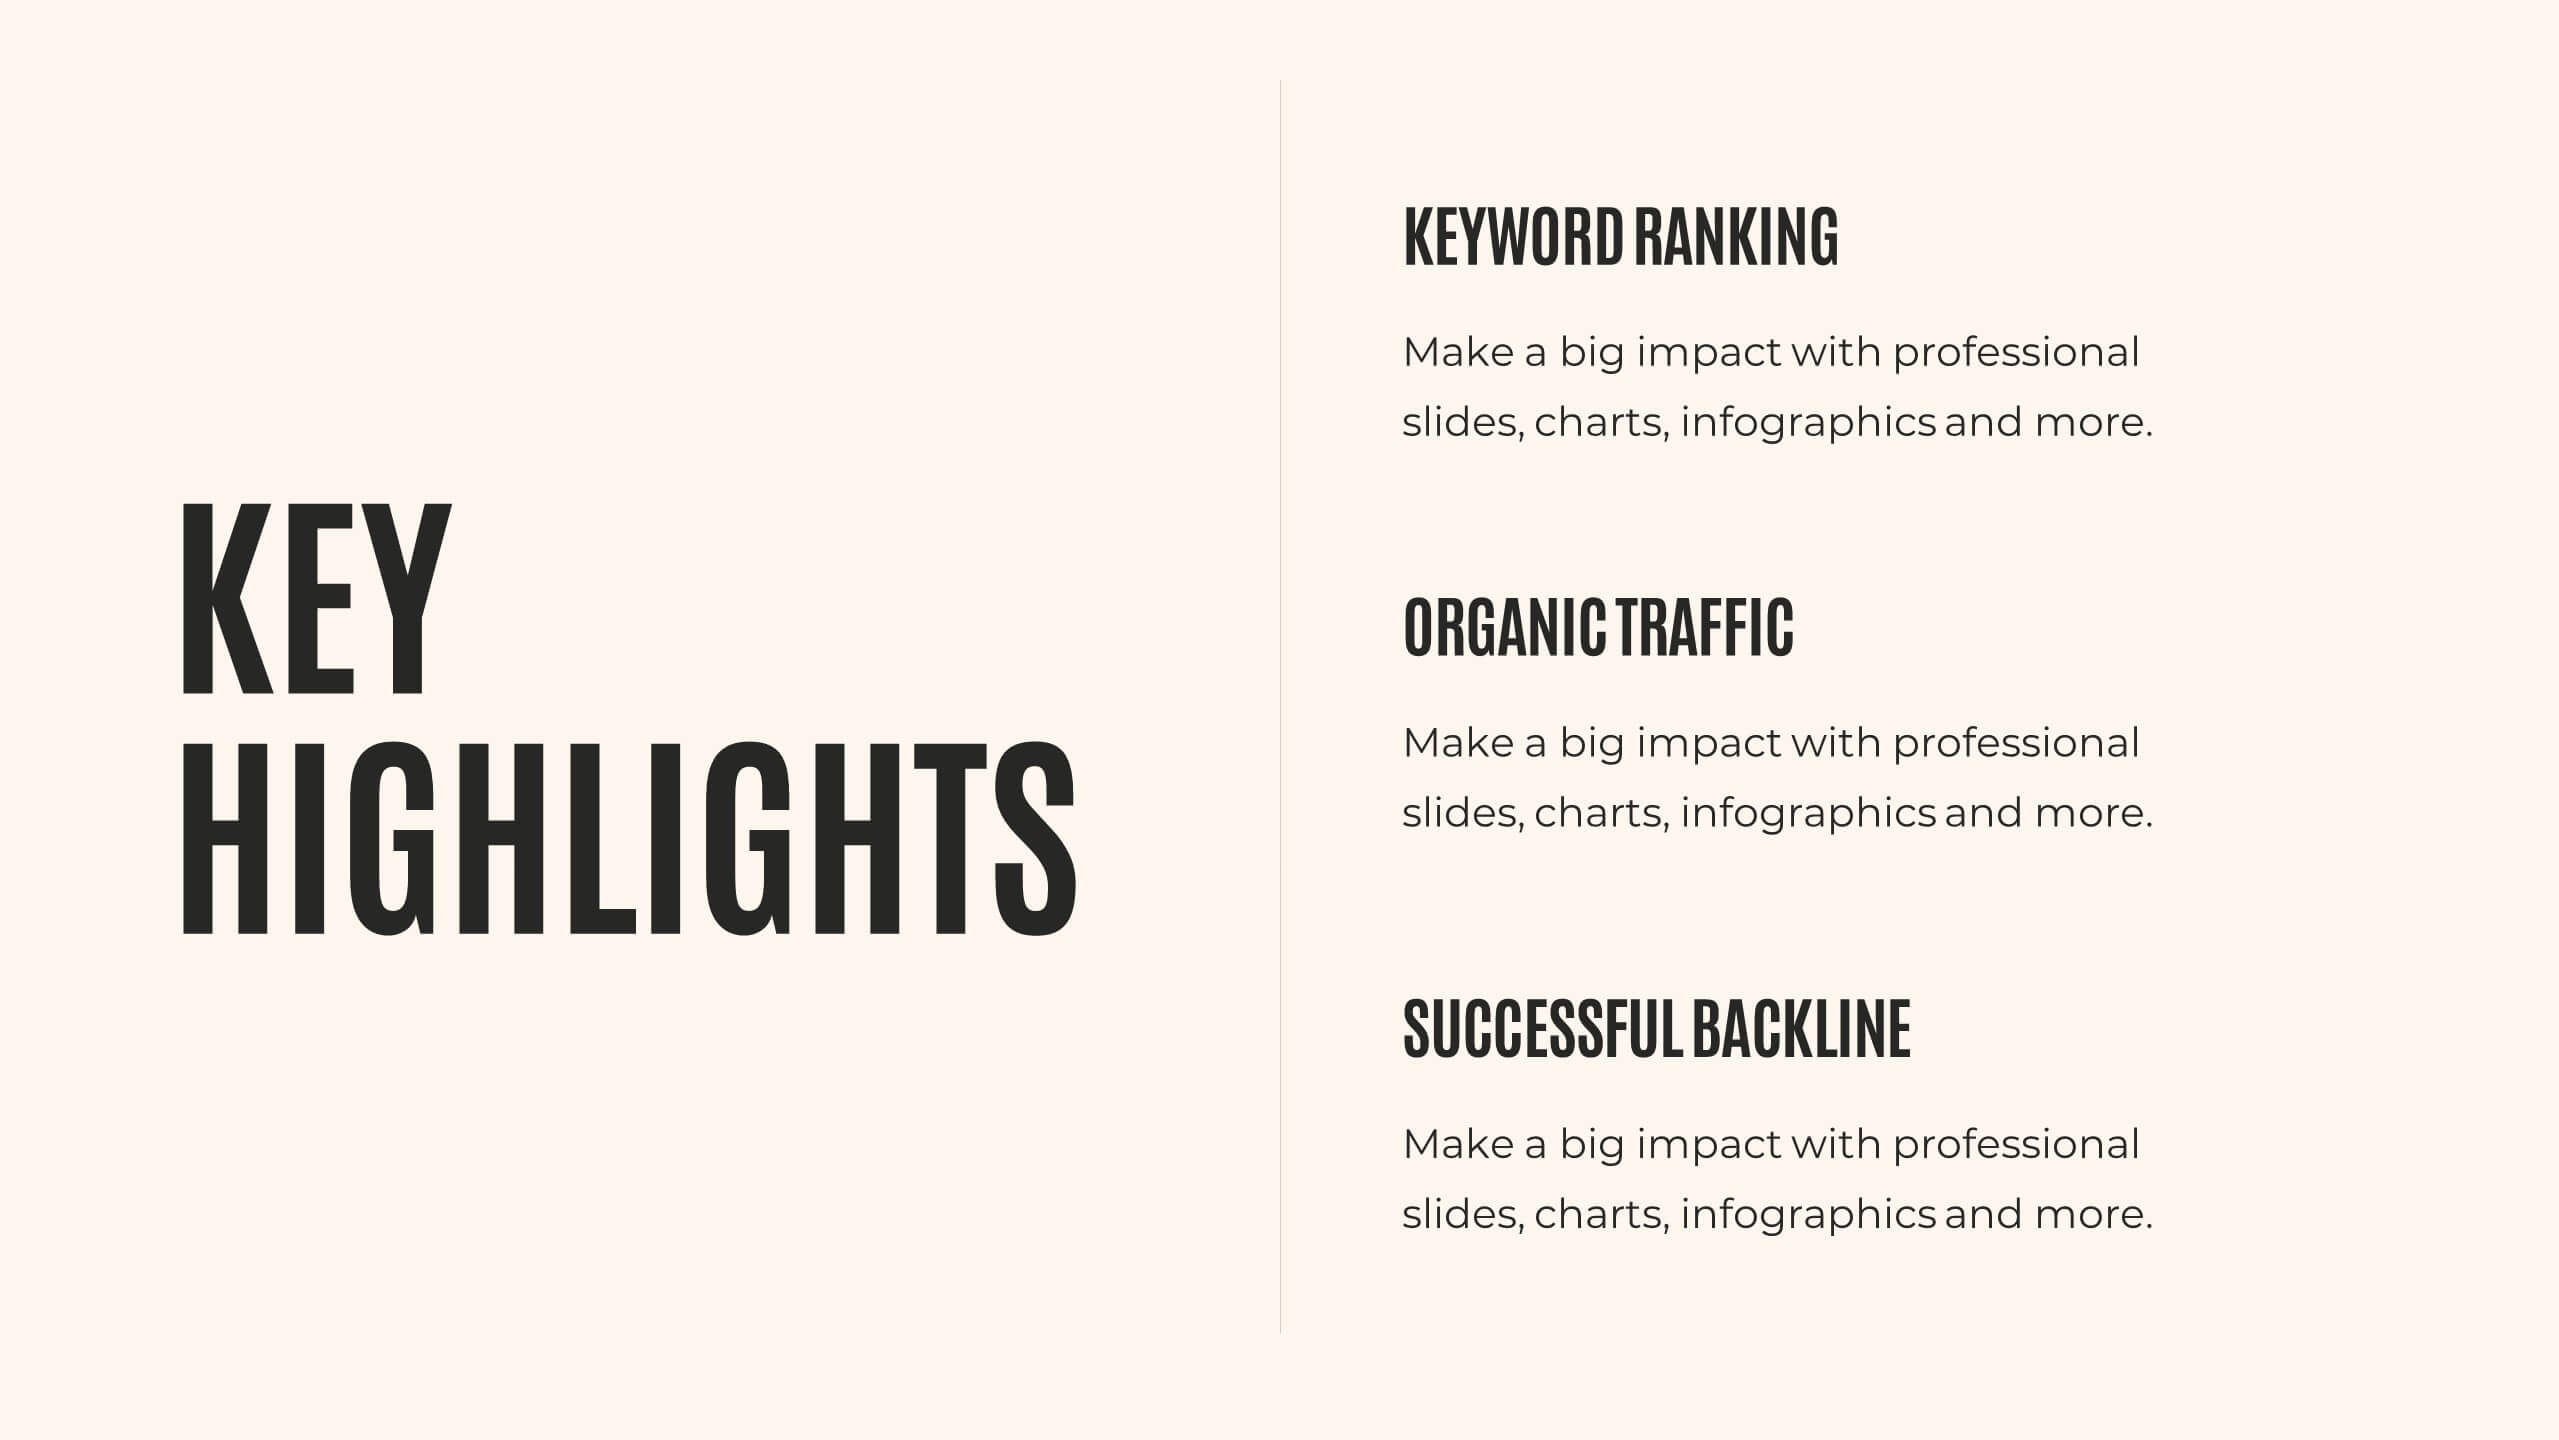
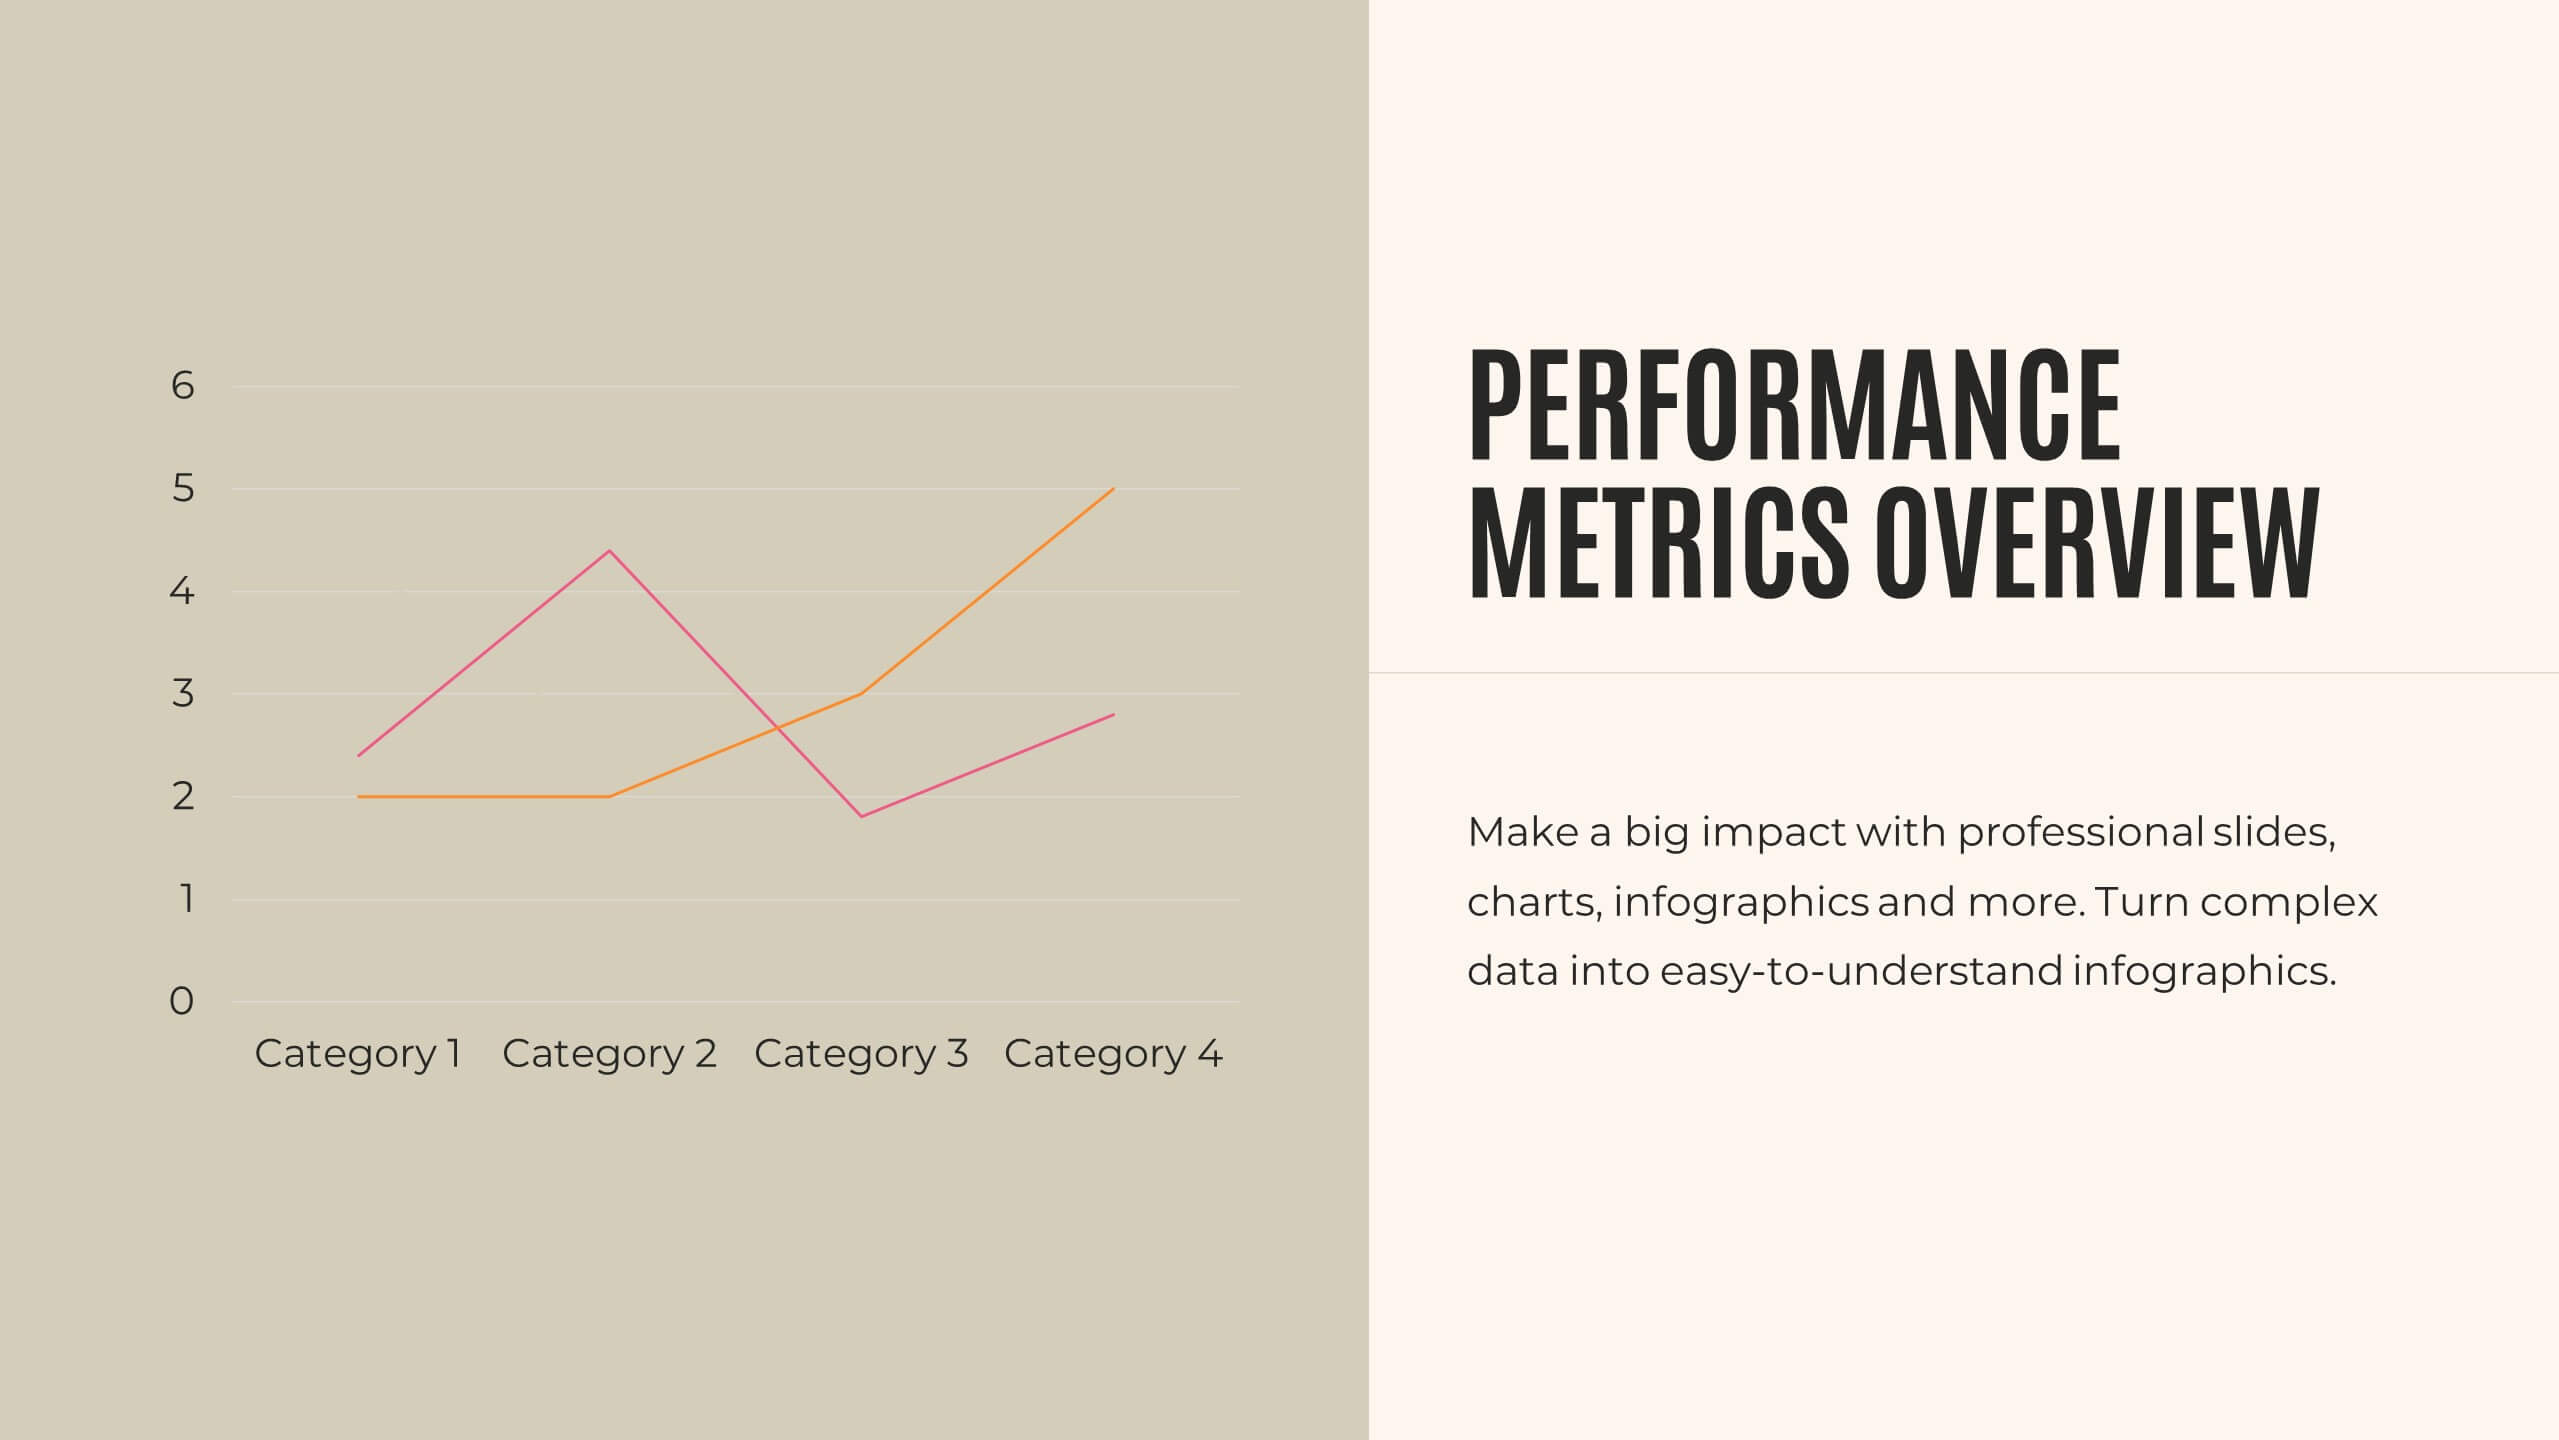
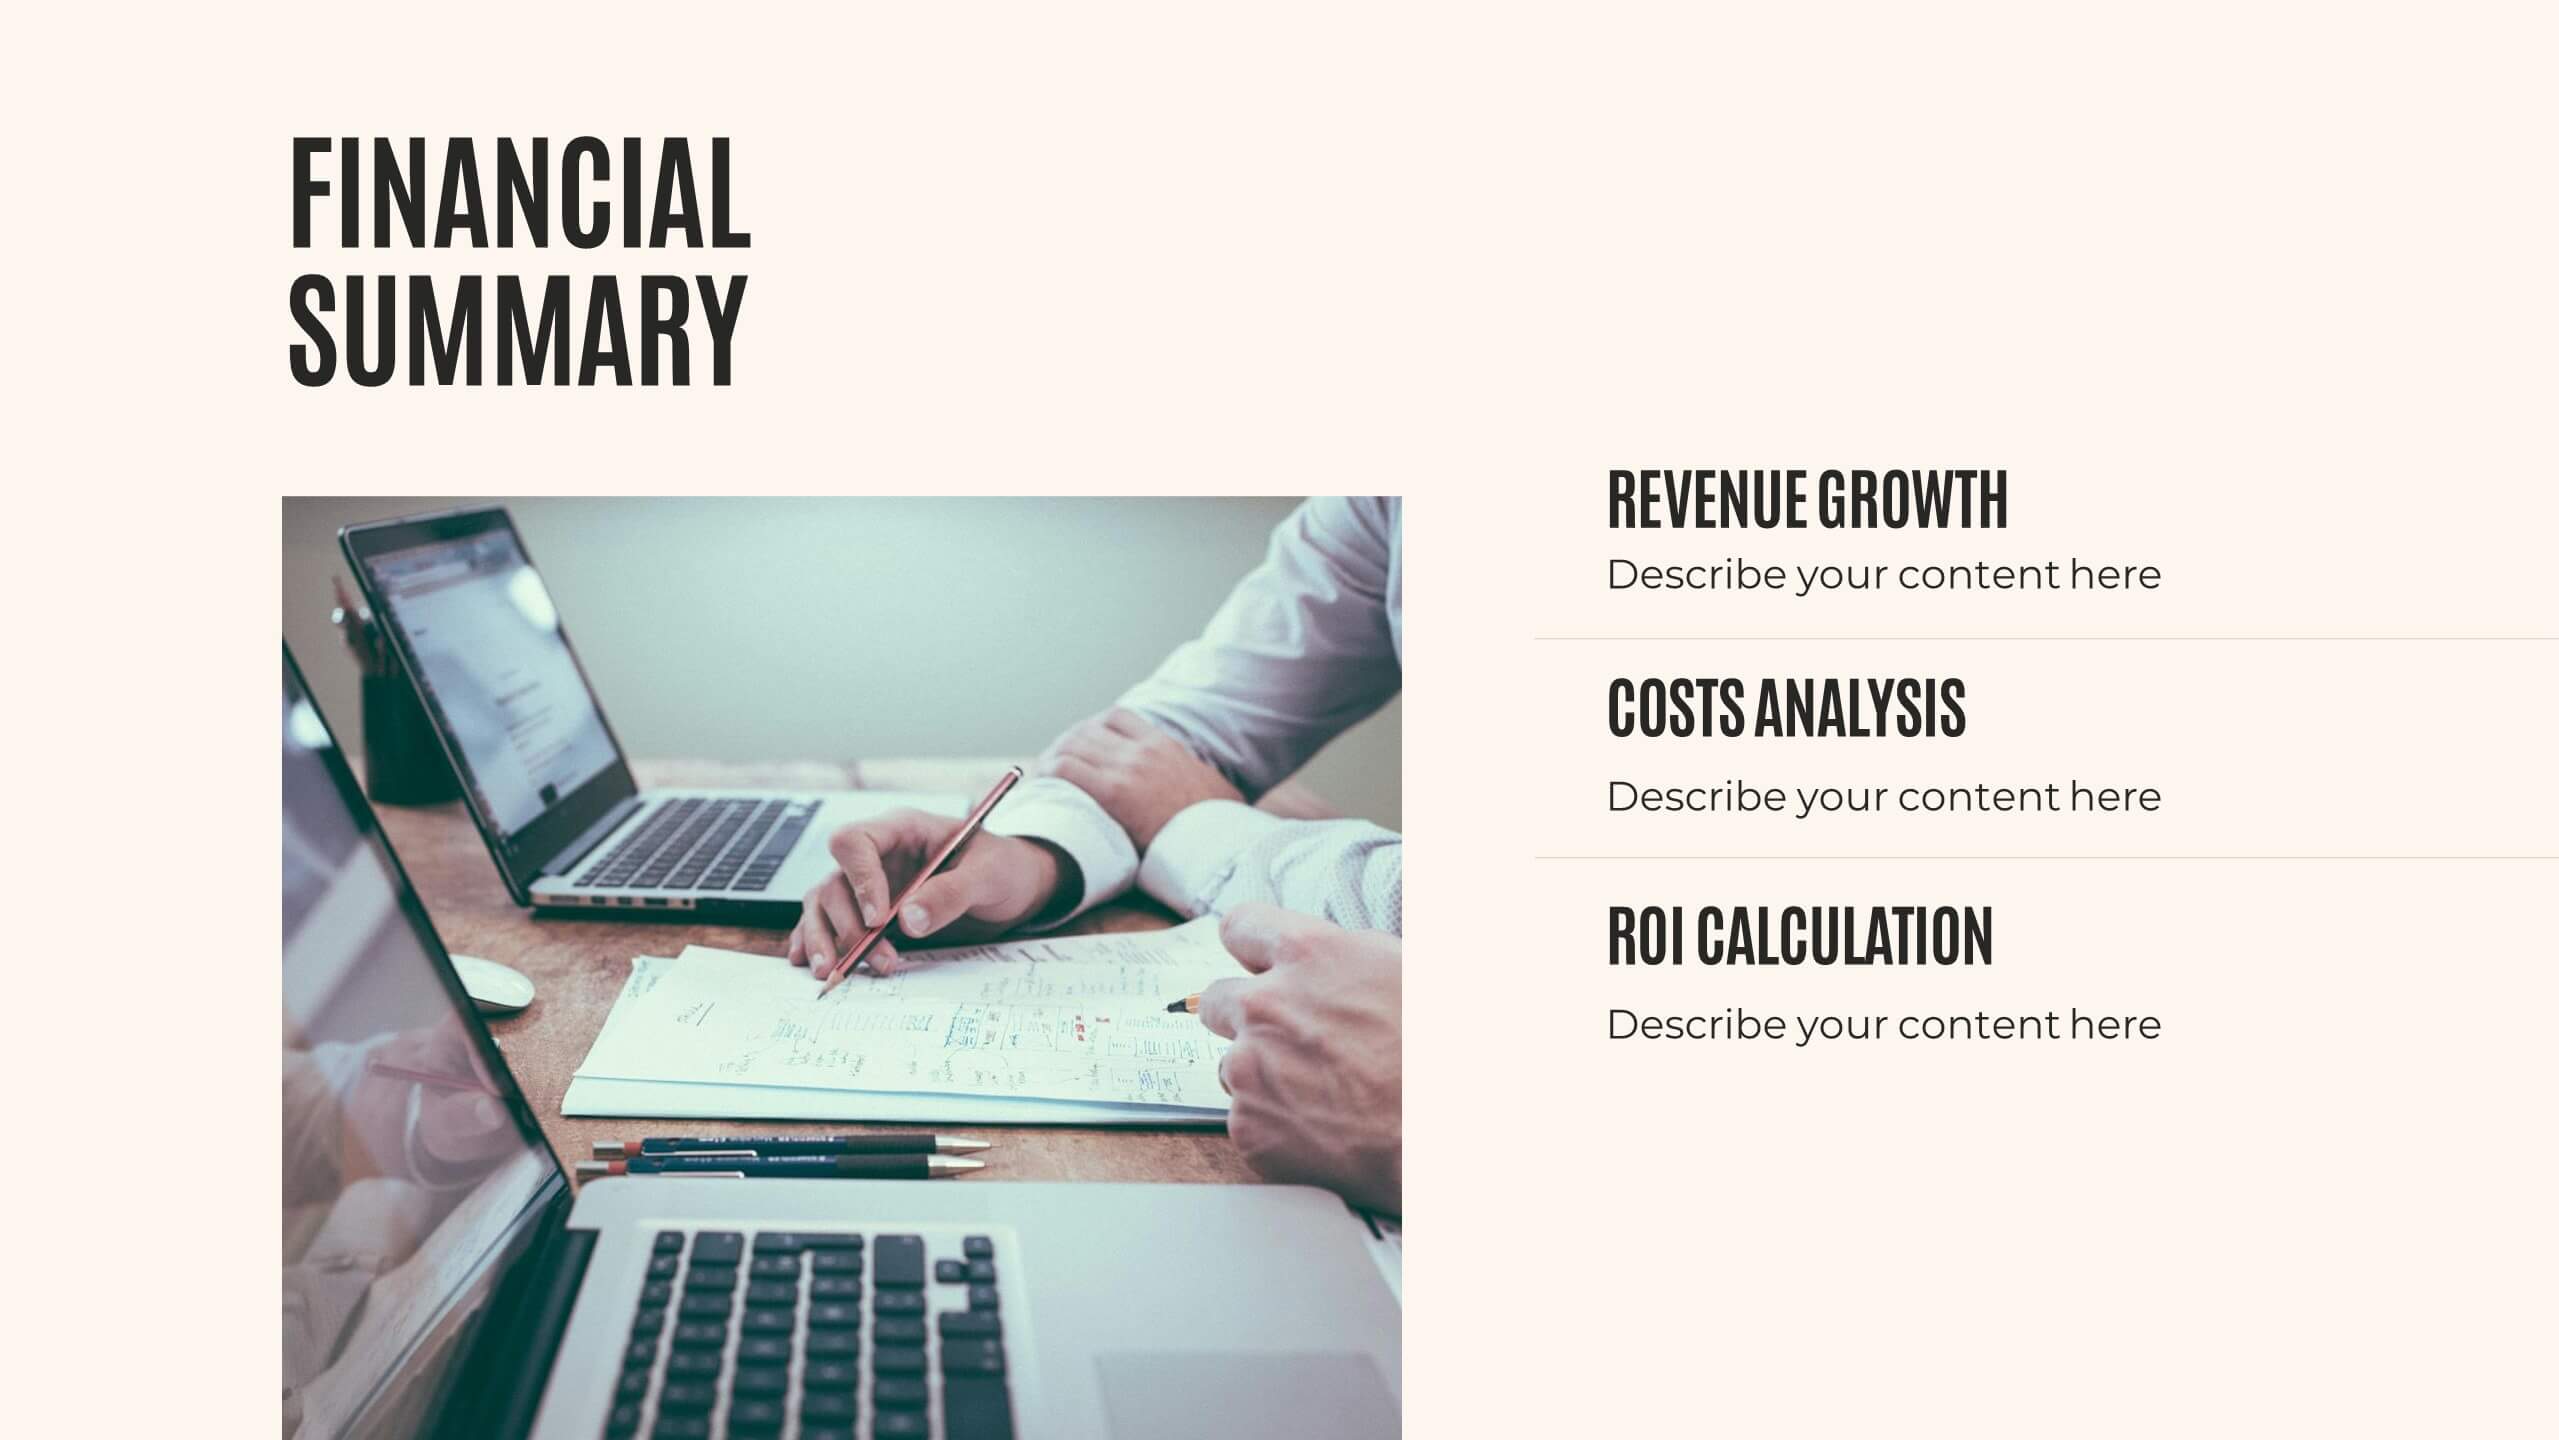
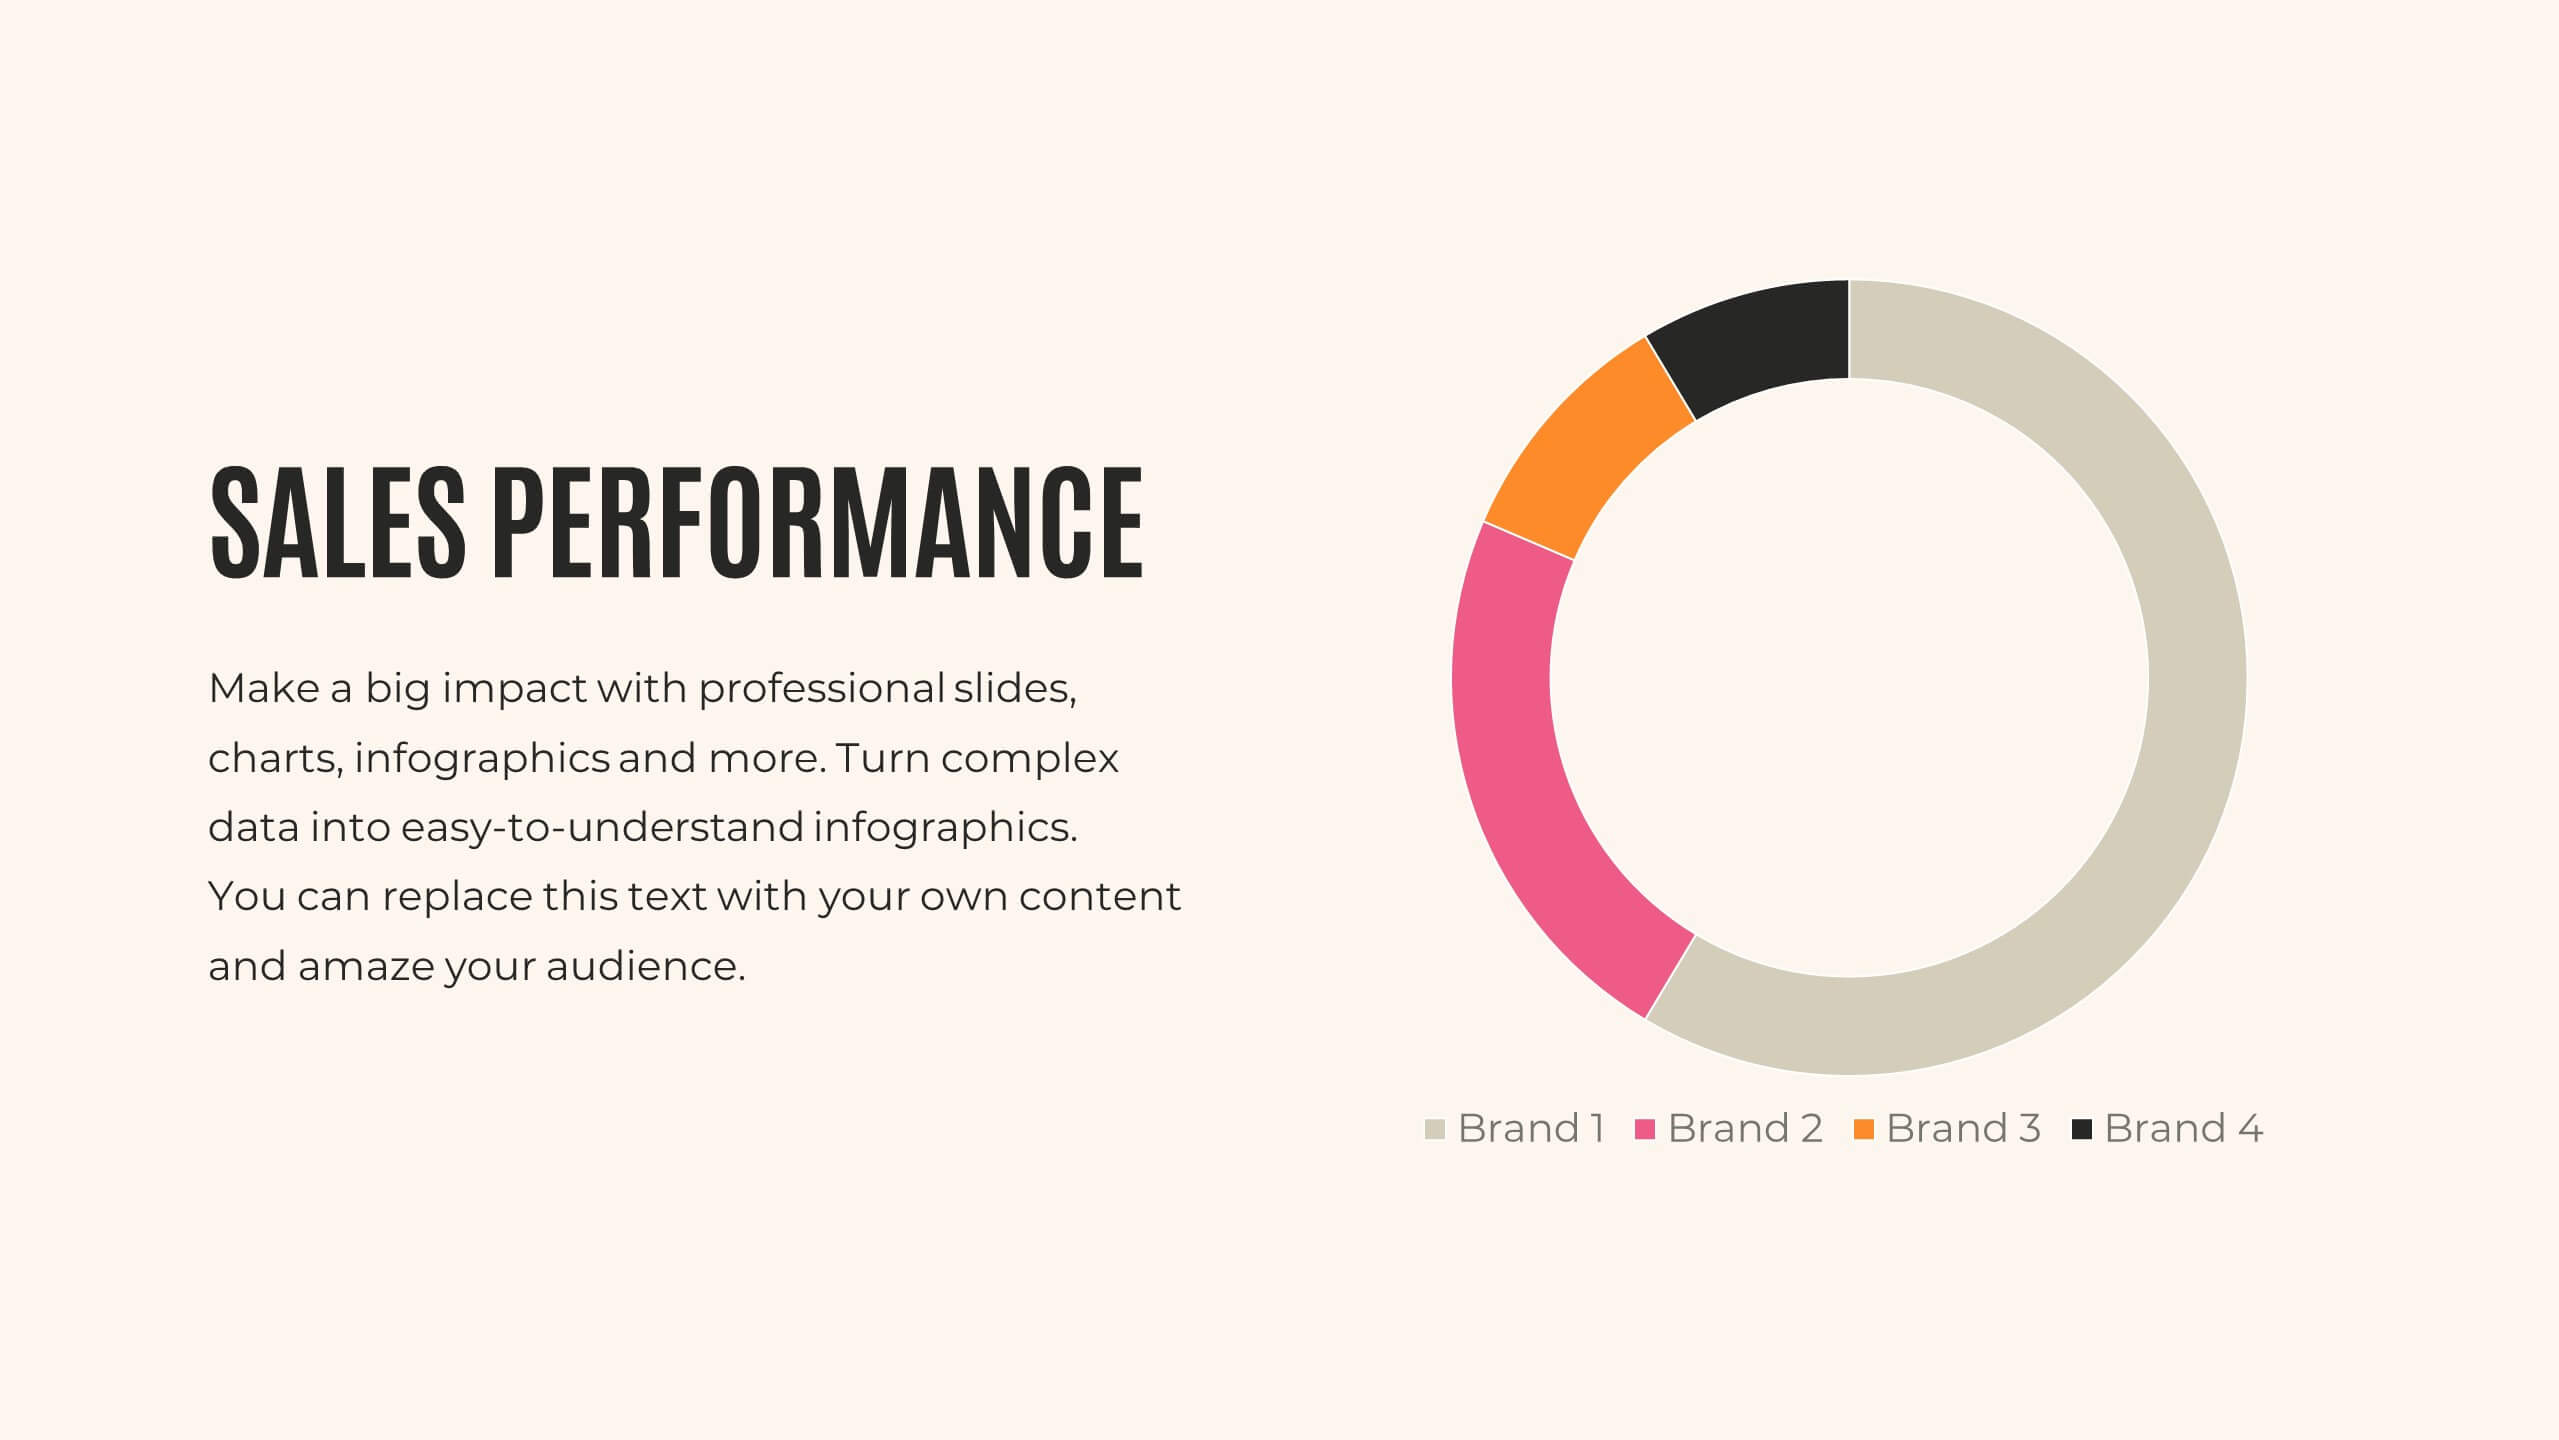
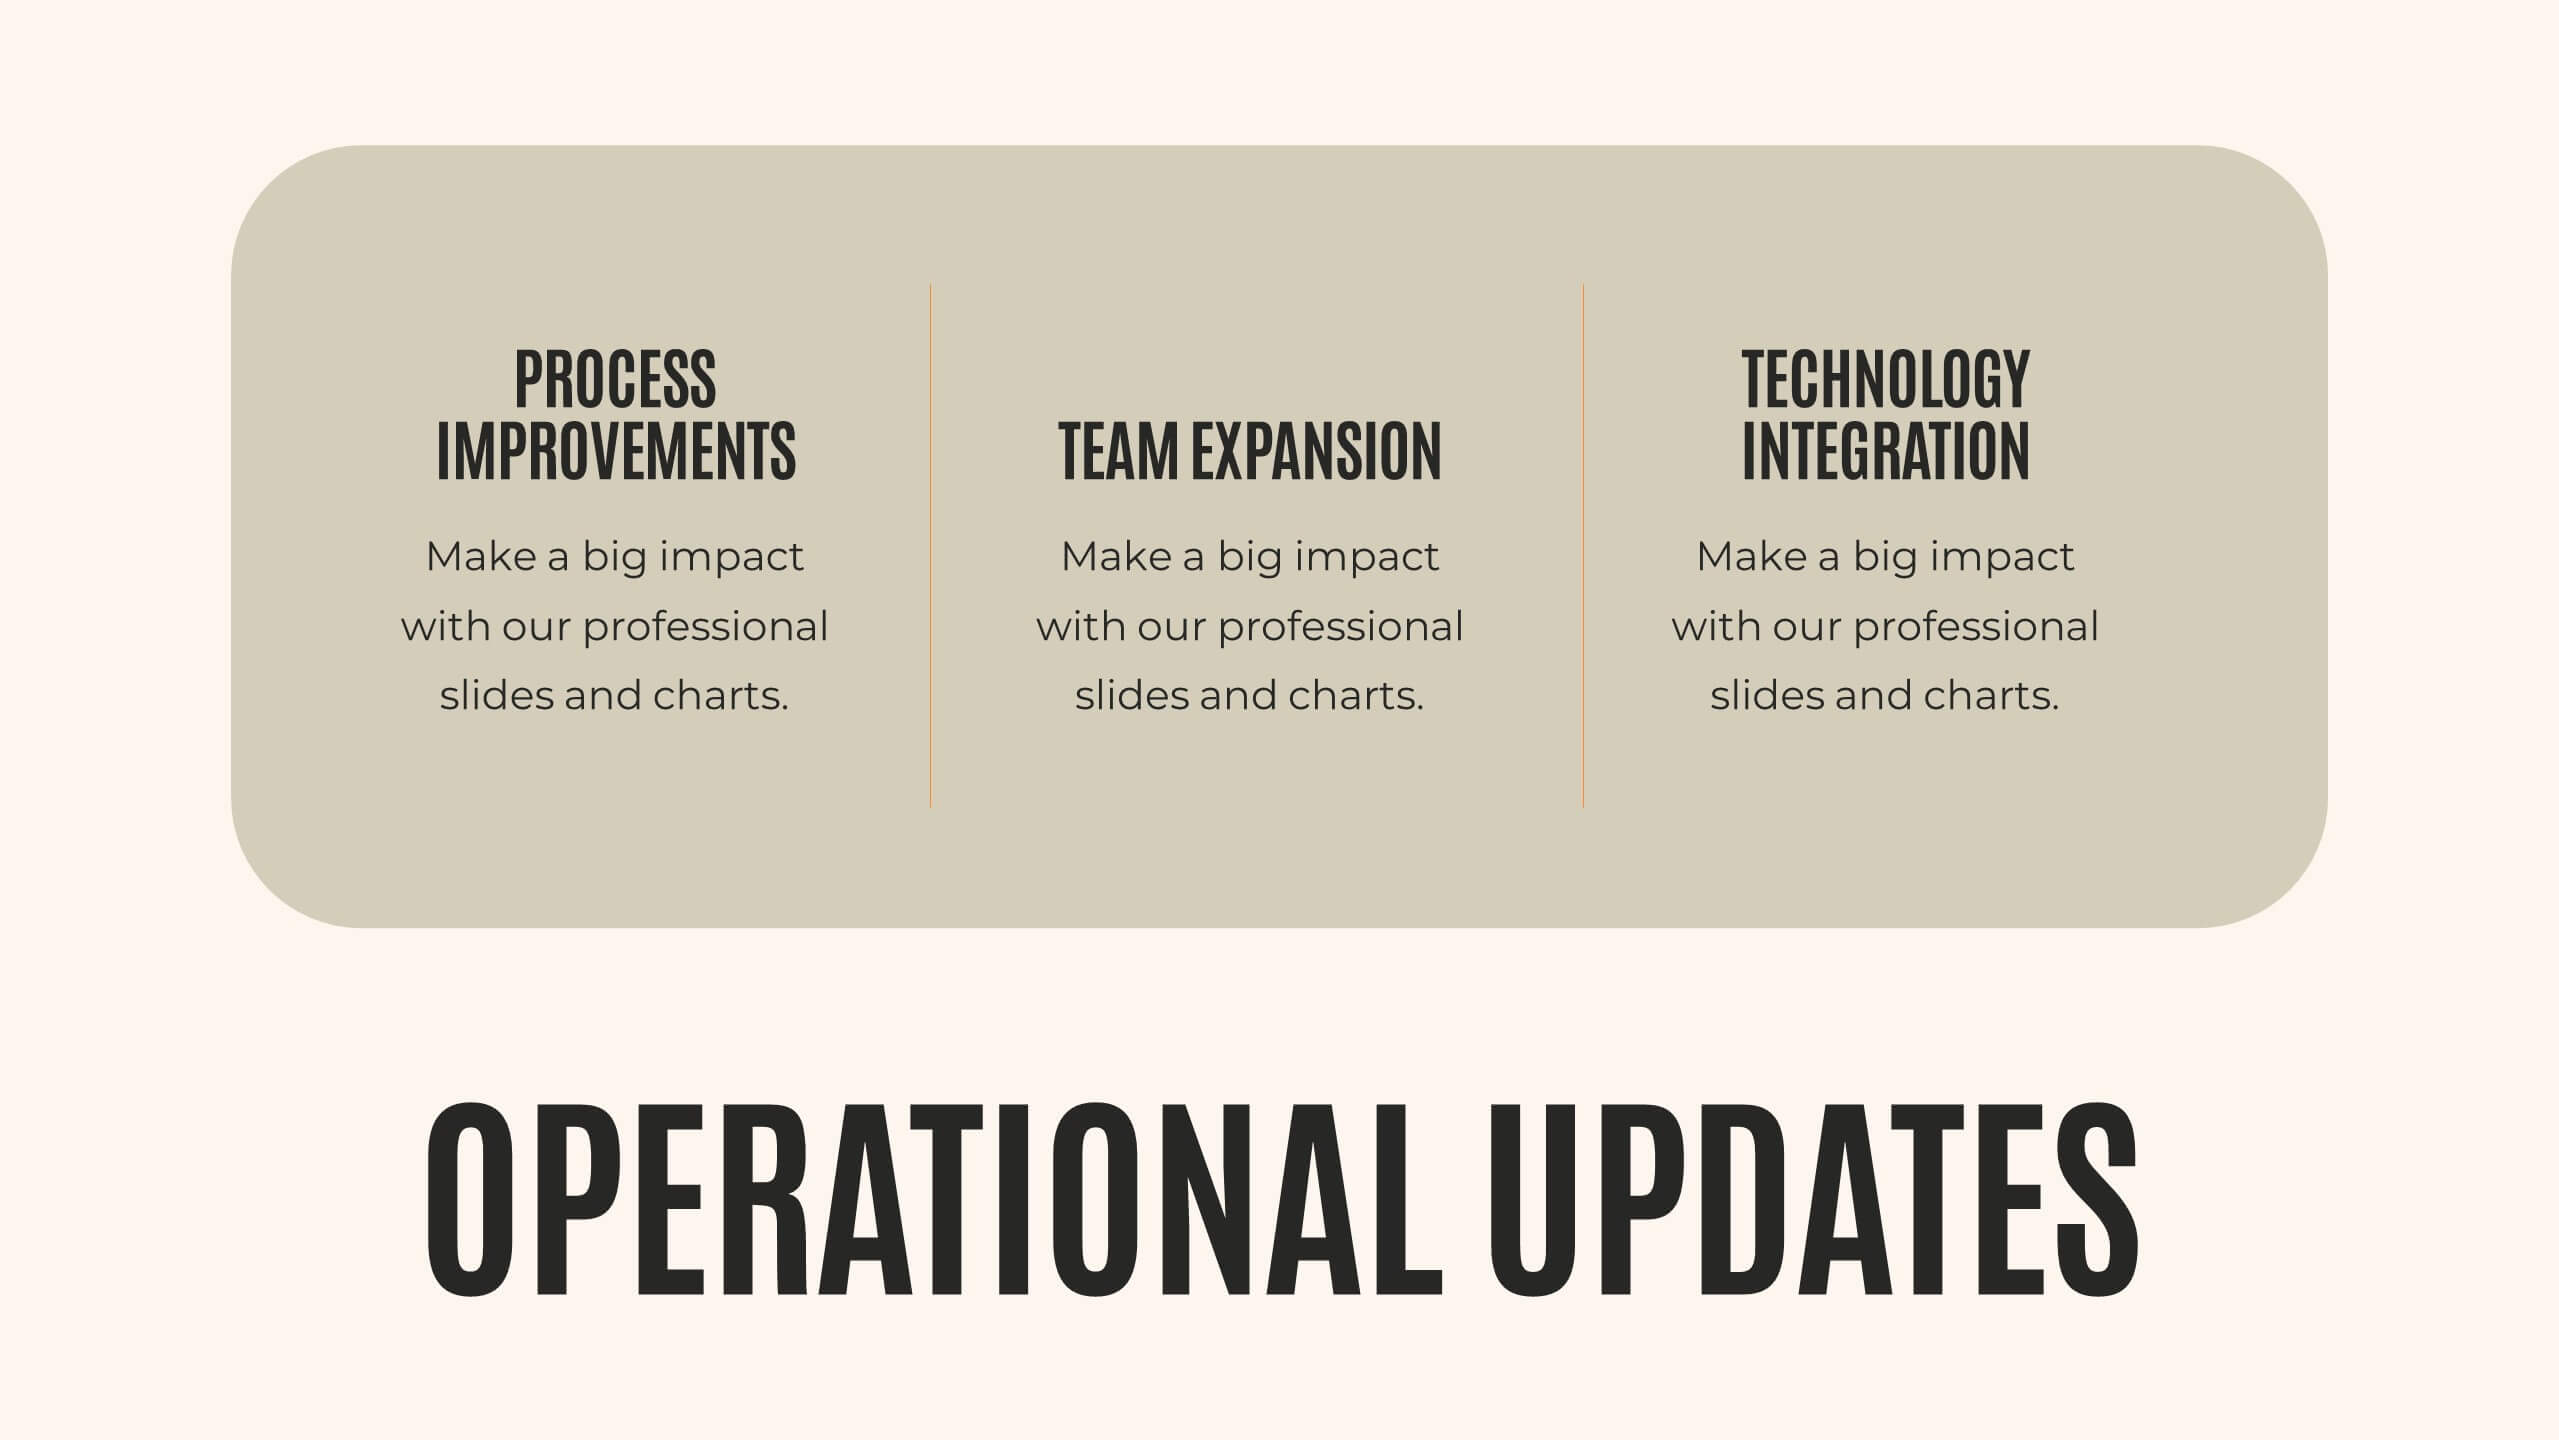
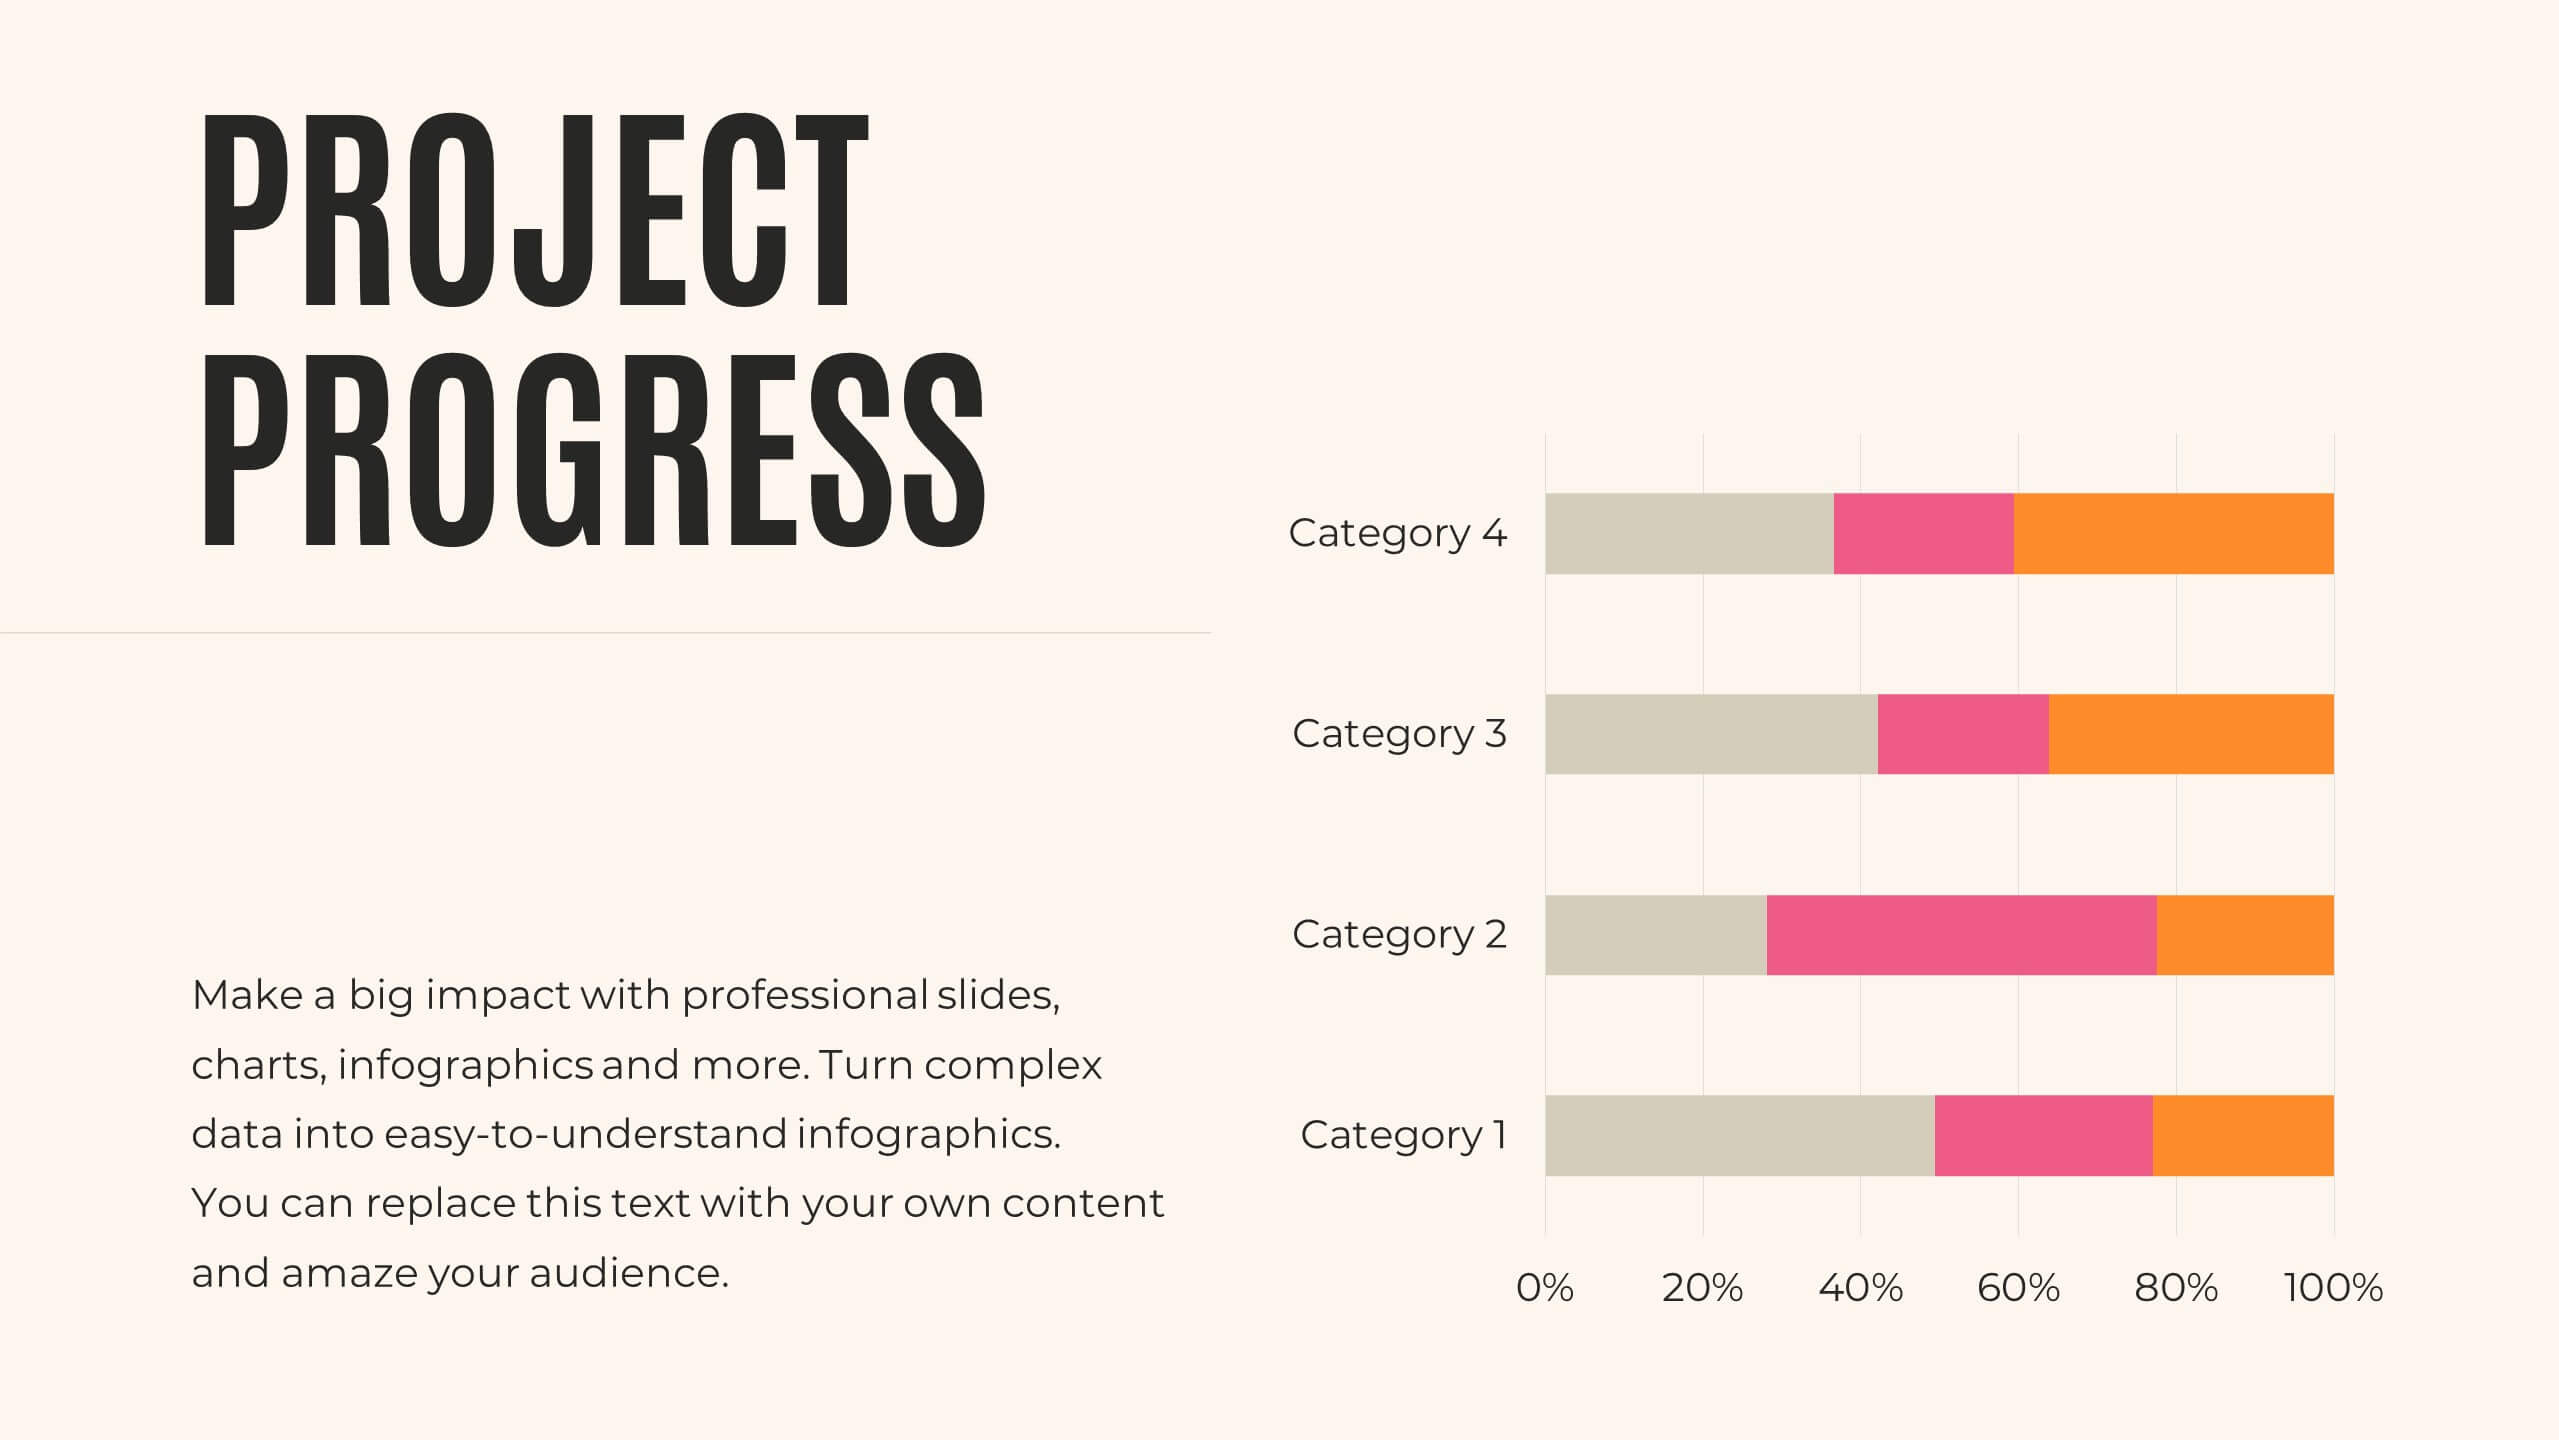
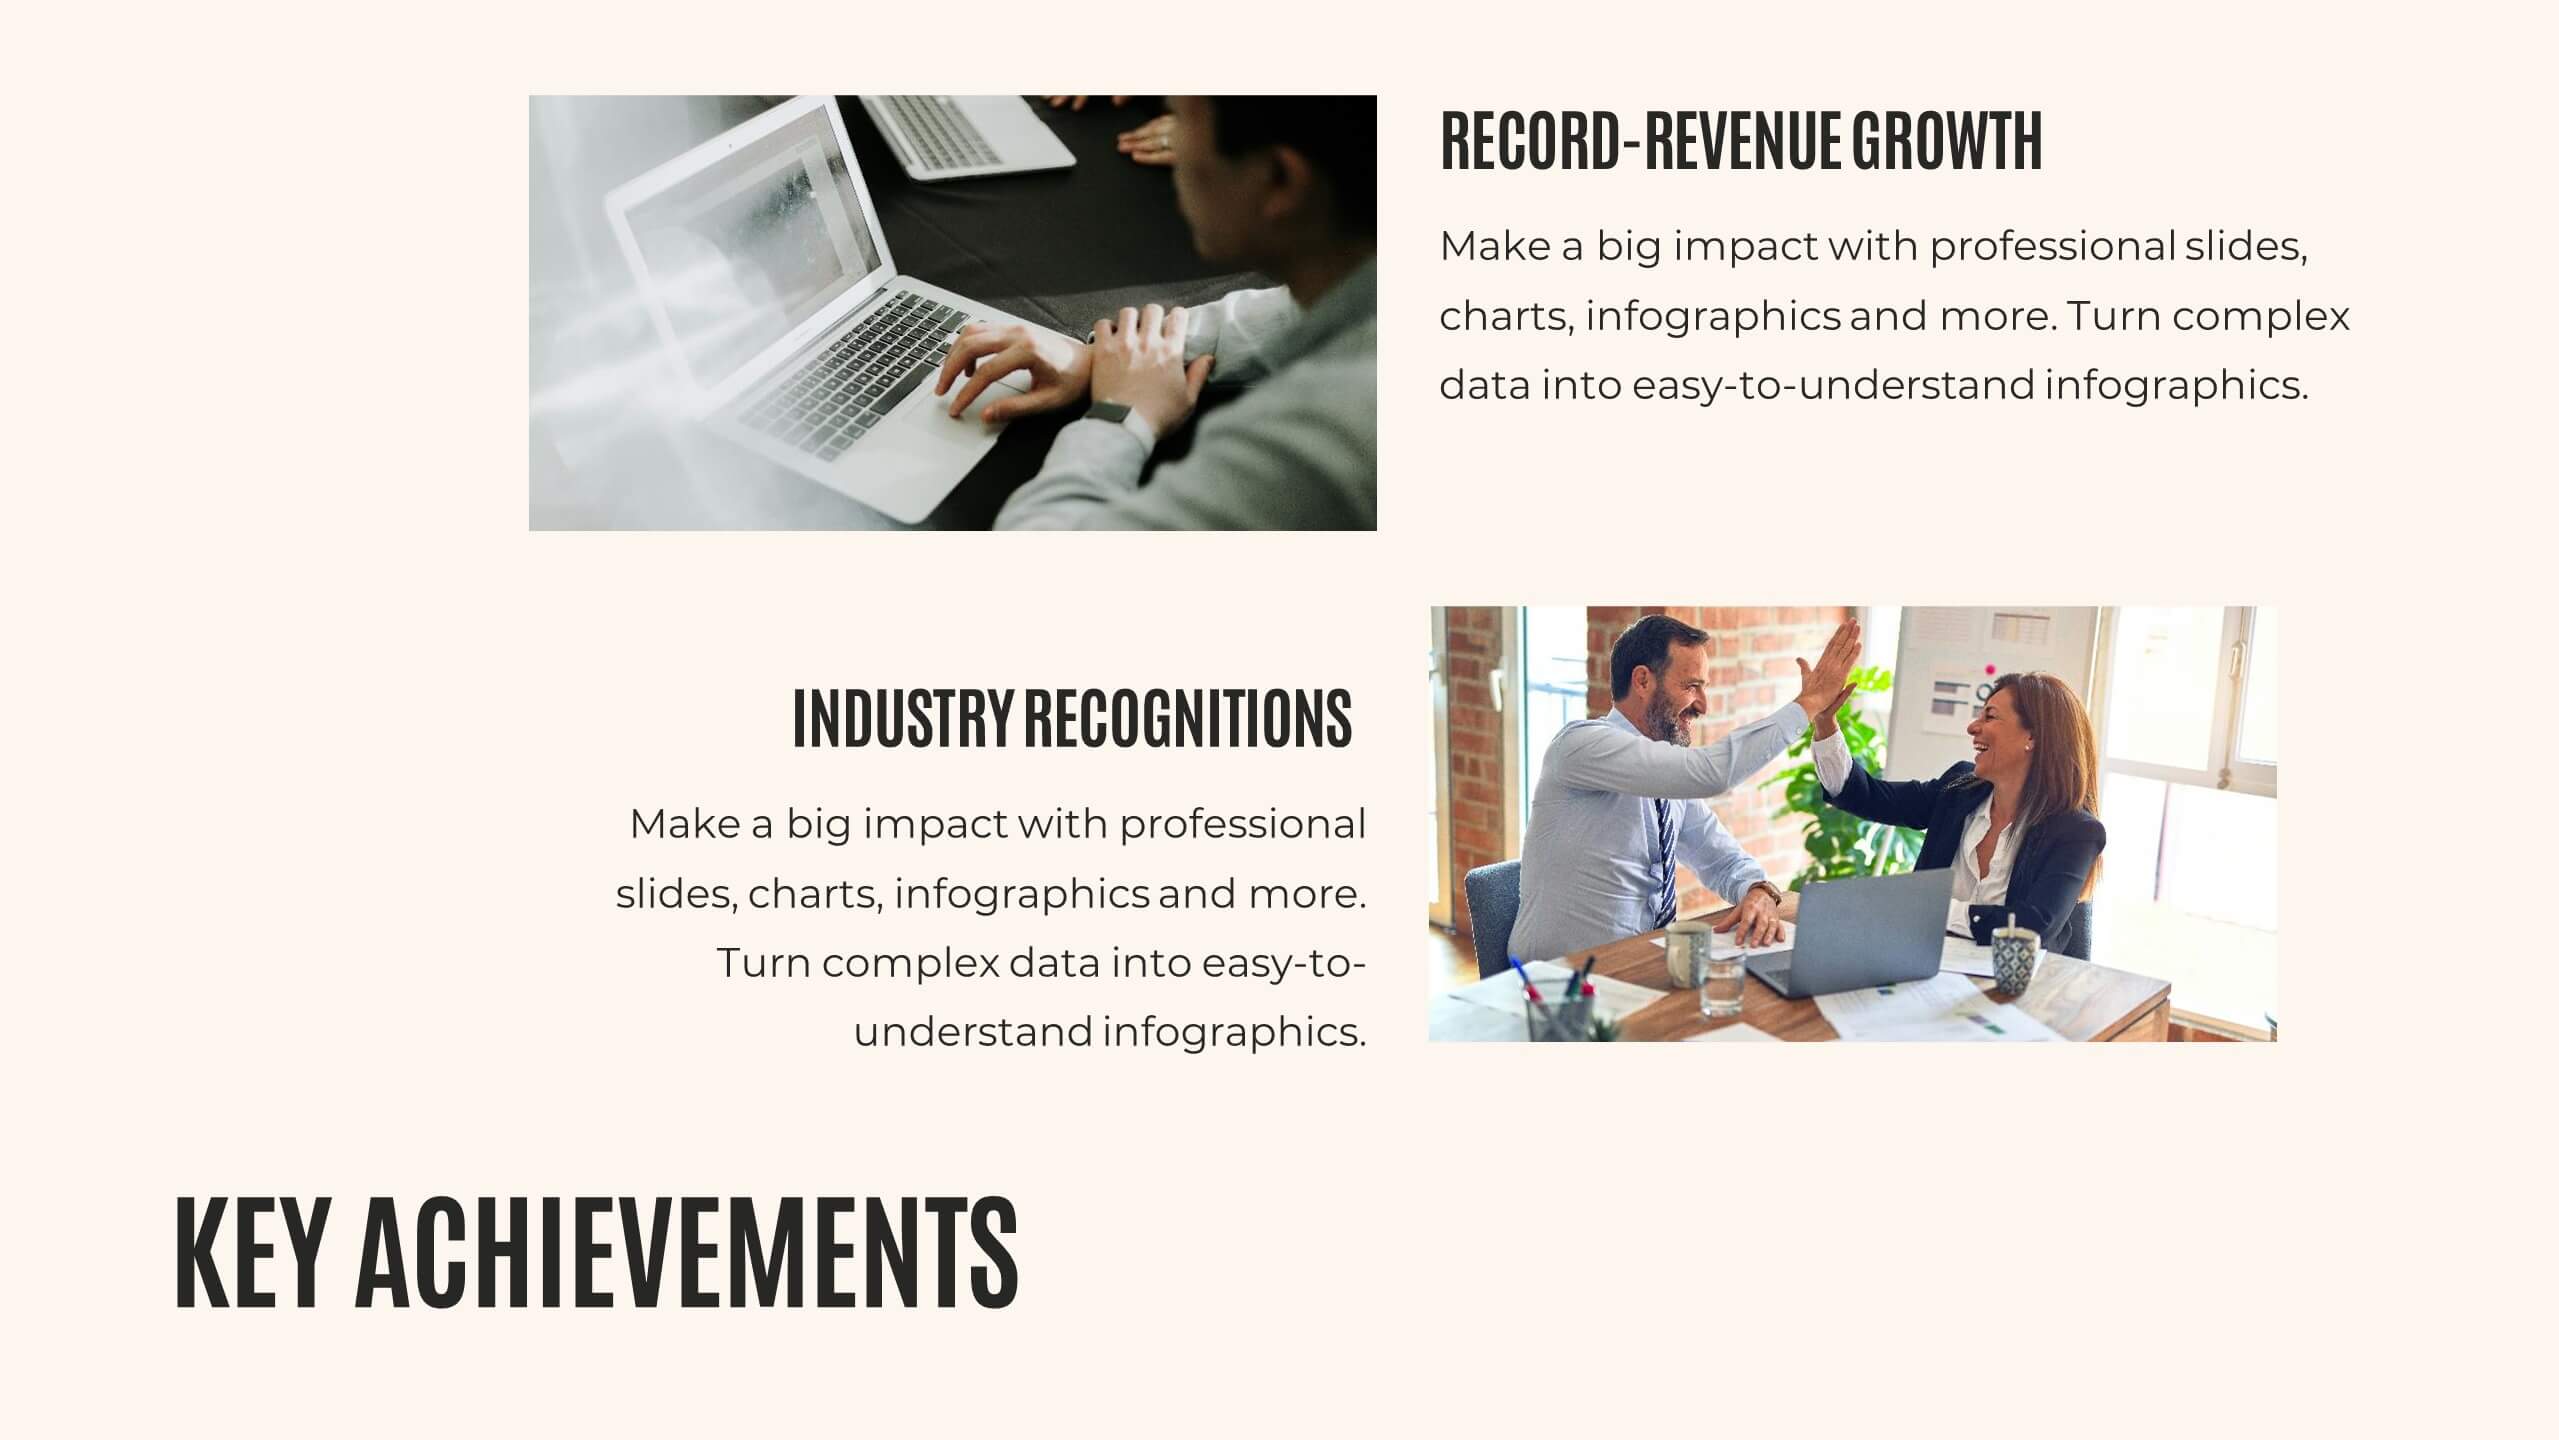
Journey Annual Report Presentation
Present your annual report with clarity and impact! This template covers agenda, key highlights, financial summary, sales performance, and project progress. Ideal for detailing achievements, insights, and future priorities. Compatible with PowerPoint, Keynote, and Google Slides, it ensures your data is visually compelling and easy to understand. Showcase your success effortlessly!


5 slides
Supply Chain Industry Infographics
The supply chain industry refers to the network of organizations, resources, activities, and technologies involved in the production, distribution, and delivery of goods and services from the point of origin to the point of consumption. These vertical infographics encompasses all the stages and processes involved in the movement of products, including procurement, manufacturing, logistics, and customer service. These are designed to help your audience understand the intricacies of supply chain management and its role in business operations. Compatible with Powerpoint, Keynote, and Google Slides.


8 slides
End-to-End Project Lifecycle Management Presentation
Visualize each phase of your project lifecycle with this clean, circular flow layout. Ideal for showcasing planning, execution, and delivery stages in a structured loop. Each segment is fully editable to match your content. Compatible with PowerPoint, Google Slides, and Keynote for effortless customization and professional results.


6 slides
KPI Overview in Dashboard Format Presentation
Track performance at a glance with this KPI Overview in Dashboard Format presentation. Featuring visual gauge meters and progress indicators, it's perfect for reporting on targets, performance metrics, and business KPIs. Clean and modern layout, fully customizable in Canva, PowerPoint, and Google Slides to match your data visualization needs.


5 slides
Marketing Concepts Infographics
Marketing Concepts refer to the various strategies and philosophies that guide the marketing efforts of businesses and organizations. Our marketing concept infographics are visual representations of the different marketing concepts and strategies that businesses use to promote their products or services. These infographics can cover a wide range of marketing topics, including target audience, product positioning, branding, advertising, and video marketing. The purpose of these infographics is to provide a easy-to-understand overview of key marketing concepts that businesses can use to drive sales and increase brand awareness.


6 slides
Step-by-Step Process Guide Presentation
Clearly outline your workflow with this step-by-step process guide template, featuring six bold arrow graphics for sequential planning. Perfect for illustrating procedures, timelines, or strategies, this modern design ensures clarity and flow. Fully editable in Canva, PowerPoint, or Google Slides, making it ideal for business, project management, or training presentations.