


Features
- 6 Unique slides
- Fully editable and easy to edit in Microsoft Powerpoint, Keynote and Google Slides
- 16:9 widescreen layout
- Clean and professional designs
- Export to JPG, PDF or send by email


Do you have any questions?
Recommend


22 slides
Diana Digital Agency Strategy Plan Presentation
Set your agency’s strategy in motion with this sleek and professional presentation! Featuring essential sections like market analysis, service offerings, campaign execution, and client success stories, it’s built to align your vision and goals. Ideal for client pitches or internal meetings, it’s fully compatible with PowerPoint, Keynote, and Google Slides.


7 slides
Oceania Countries Map Infographic
Set sail on an informative voyage across the enchanting islands of Oceania with our meticulously crafted map infographic. Dressed in the pristine shades of white, the vastness of blue, the lushness of green, and the richness of gold, our template encapsulates the beauty and diversity of Oceania's countries. Outfitted with pinpoint infographics, emblematic icons, and island-specific image placeholders, it offers a holistic view of this unique region. Expertly configured for Powerpoint, Keynote, or Google Slides. An essential compass for educators, geographers, or businesses exploring the Oceania market. Journey with knowledge; let each slide be a revelation of Oceania's splendors.


5 slides
Easy Dinner Recipes Infographics
Easy Dinner Recipes offer a practical solution for busy individuals or those who are new to cooking. These infographic templates offer a practical resource for meal planning and preparation. Its visually appealing design, clear instructions, and organized layout make it easy to follow and implement. Whether for personal use or as a presentation tool in cooking classes this template simplifies the process of discovering and trying out delicious dinner recipes. Use these to provide a collection of quick and delicious dinner recipes. This is designed to make meal planning easier, providing step-by-step instructions, ingredient lists, and visuals.


5 slides
Scalability Metrics for Business Growth Presentation
Visualize business growth stages with this tiered pyramid-style slide. Each layer highlights key performance metrics with editable percentage labels, perfect for scaling strategies or KPI reports. Simple, structured, and impactful—ideal for business planning, team briefings, or investor updates. Fully customizable in PowerPoint, Keynote, and Google Slides for seamless editing.


6 slides
Innovation-Driven Culture and Vision
Present your strategy with clarity using the Innovation-Driven Culture and Vision Presentation. This clean, modern layout features five vertical icon markers to highlight key pillars of innovation. Ideal for leadership talks or team strategy meetings. Fully customizable in PowerPoint, Keynote, and Google Slides for easy edits and branding.


5 slides
How to Prevent Cyberbullying Infographics
Cyberbullying is a serious issue that can have detrimental effects on individuals' mental and emotional well-being. These vertical infographics provide essential information and tips for preventing cyberbullying. These are designed to raise awareness about the issue and educate individuals on how to effectively address and prevent cyberbullying incidents. The infographics feature a visually appealing design with attention-grabbing colors, icons, and illustrations. The engaging visuals are intended to capture the attention of the audience and convey the seriousness of the topic. The infographics offer practical tips and strategies for preventing cyberbullying.


7 slides
E-Learning Modules Structure Presentation
Design engaging learning experiences with a presentation that feels structured, modern, and easy to follow. Ideal for educators, trainers, or course creators, it helps organize e-learning content into clear, modular sections that enhance comprehension. Fully customizable and compatible with PowerPoint, Keynote, and Google Slides for effortless presentation design.


6 slides
Concept Matching Puzzle Infographic
Visualize interconnected ideas with the Concept Matching Puzzle Infographic Presentation. Shaped like a head silhouette, this infographic uses five interlocking puzzle pieces to highlight the synergy of concepts—ideal for training, teamwork, decision-making, or idea development. Each segment is icon-tagged and paired with text for clarity. Fully editable in PowerPoint, Keynote, and Google Slides.


5 slides
Corporate Teamwork Presentation
The "Corporate Teamwork" presentation template visually captures the interconnectivity of team roles and tasks. Each slide features a circular flow diagram with icons representing different aspects of business teamwork. The dynamic arrangement of the icons around the central circle helps illustrate the cyclical nature of team processes and collaboration. This template allows for customization with text and color coding, making it easy to adapt to specific corporate environments or team structures. It's a great tool for presentations aimed at enhancing teamwork strategies or demonstrating the flow of tasks within team settings.


20 slides
Elementra Marketing Proposal Presentation
Elevate your marketing initiatives with this professional and well-structured proposal template. Covering essential sections such as objectives, goals, budget breakdown, timeline, and pricing structure, this presentation helps you effectively communicate your strategy to stakeholders and clients. Its clean, modern design ensures clarity and engagement, making it ideal for pitching ideas and securing approvals. Fully customizable and compatible with PowerPoint, Keynote, and Google Slides.


7 slides
SCRUM Infographic Presentation Template
A SCRUM infographic is an Agile methodology for software development. The goal of this infographic template is to provide a clear and easy-to-understand overview of the key principles and practices of scrum, such as the roles, events, and artifacts used in the process. This template can be used as a reference for team members, as a teaching tool for new scrum practitioners, or as a way to communicate scrum to stakeholders. Our well-designed scrum infographic can help you and your audience quickly understand the basics of the framework, as well as its benefits, applications, and best practices.


7 slides
Sustainable Agriculture Infographic Presentation
An Agriculture Infographic presents information and data related to agriculture and the farming industry. This template is designed to cover a wide range of topics, including crop production, livestock farming, food processing, distribution, and sustainable agriculture practices. Use this infographic to provide information on the economic, social, and environmental impacts of agriculture, as well as to showcase new technologies and innovations in the farming industry. This infographic includes 7 slide layouts each with unique illustrations related to agriculture, charts, and diagrams.


10 slides
SWOT-Based Competitive Analysis Presentation
Identify your competitive edge with a clear, structured approach! This SWOT-based analysis template helps businesses assess strengths, weaknesses, opportunities, and threats in a visually engaging format. Perfect for strategic planning, it ensures clarity and impact in every presentation. Fully customizable and compatible with PowerPoint, Keynote, and Google Slides.


5 slides
5 Types of Credit Cards Explained Presentation
Unlock the world of smarter spending with this clear, engaging layout designed to break down different credit card types in a simple, visual way. It helps you present features, benefits, and key distinctions with ease, making financial concepts easy to understand. Fully editable and compatible with PowerPoint, Keynote, and Google Slides.


7 slides
Matrix Structure Diagram
A matrix diagram is a management planning tool that enables you to analyze and display the relationship between data sets. This is a visual way to display information that you can quickly and easily analyze. With this template, you can create awesome Matrix Diagrams that will help you group and analyze information in a clear and organized way. This template is the perfect tool If you want to impress your teacher or boss with Infographic presentations. Arrange your information in a way that makes sense to you. Get started by downloading and editing in Powerpoint, Keynote, or Google Slides.


5 slides
Customer Behavior Pathway Visualization Presentation
Illustrate each step in the decision-making journey with this Customer Behavior Pathway Visualization presentation. Designed with directional arrows and dotted flow markers, this slide helps you map behavioral patterns across key stages—from awareness to loyalty. Ideal for sales, marketing, or UX teams. Fully editable in PowerPoint, Canva, and Google Slides.


22 slides
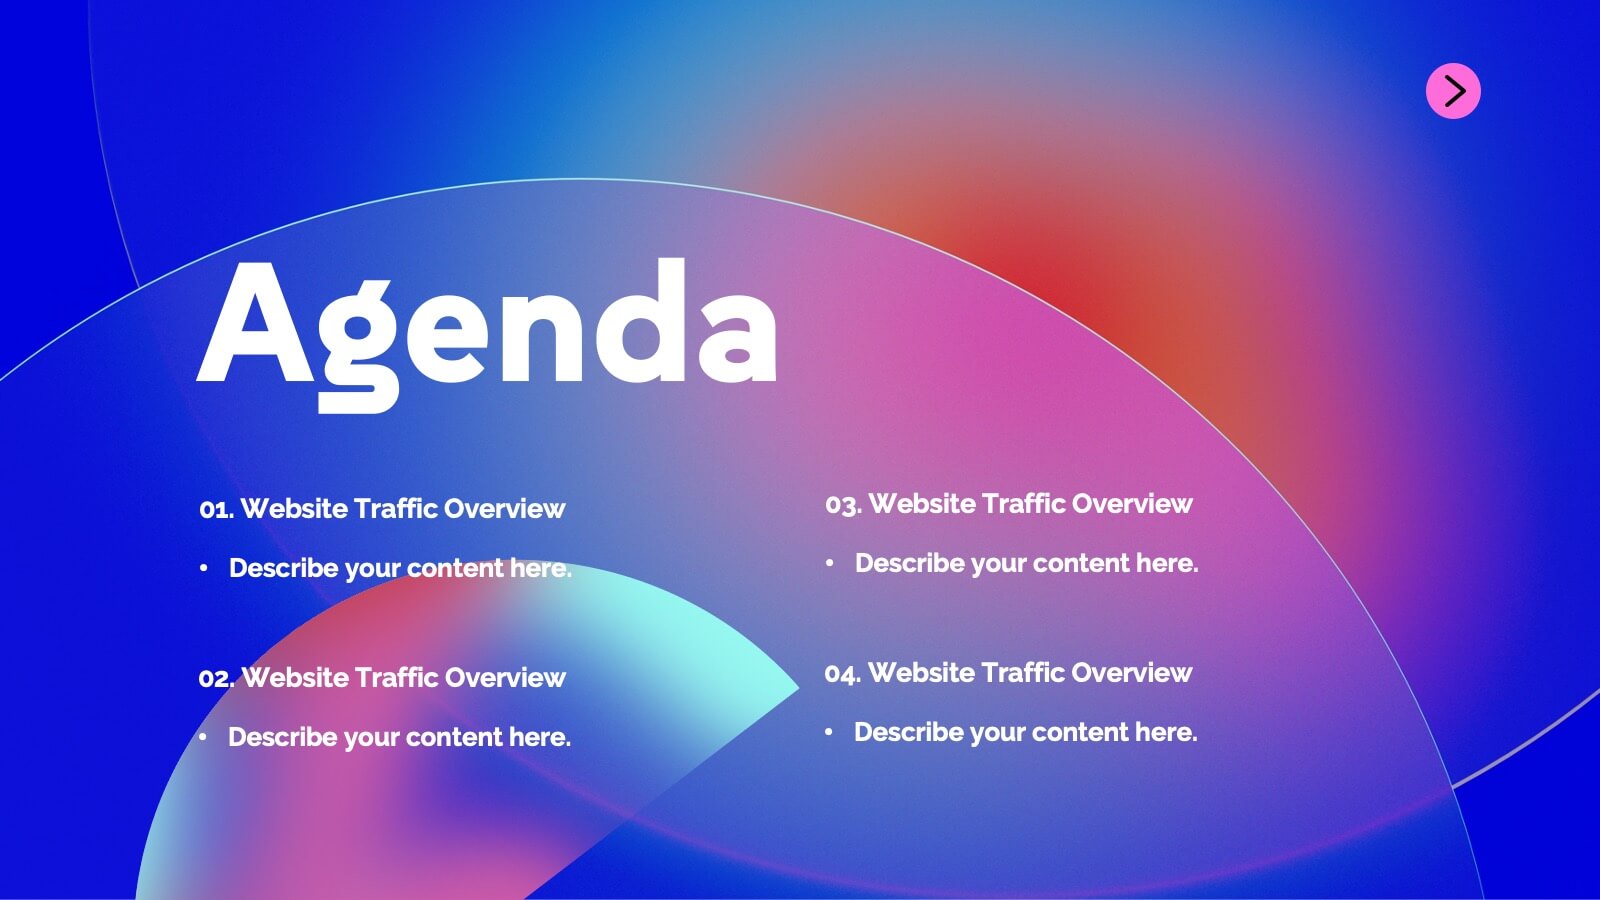
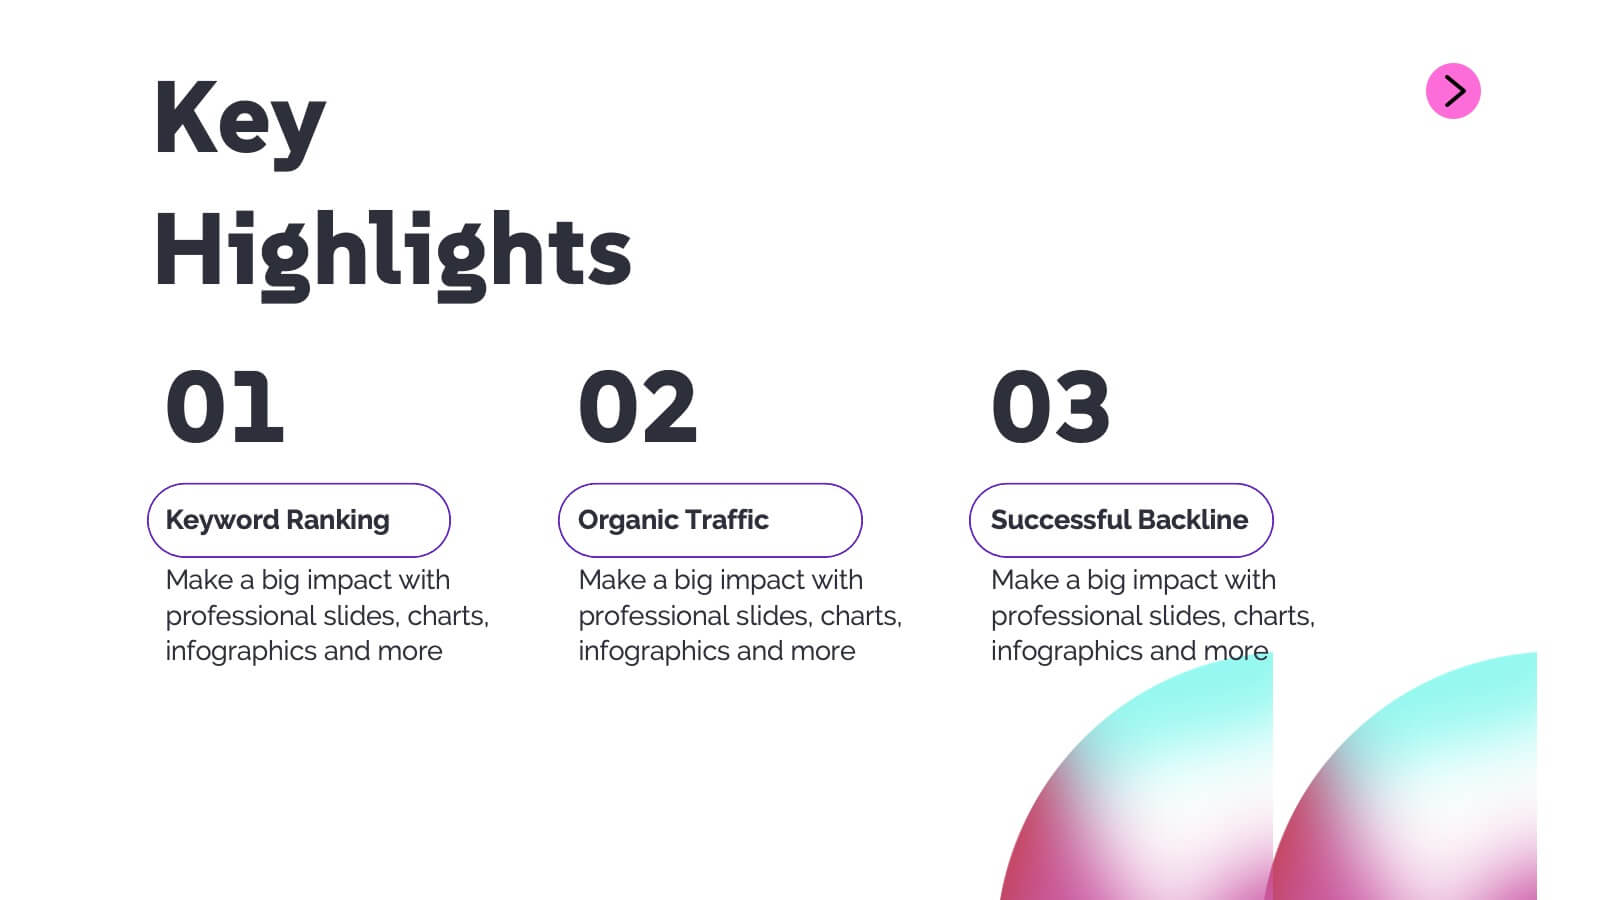
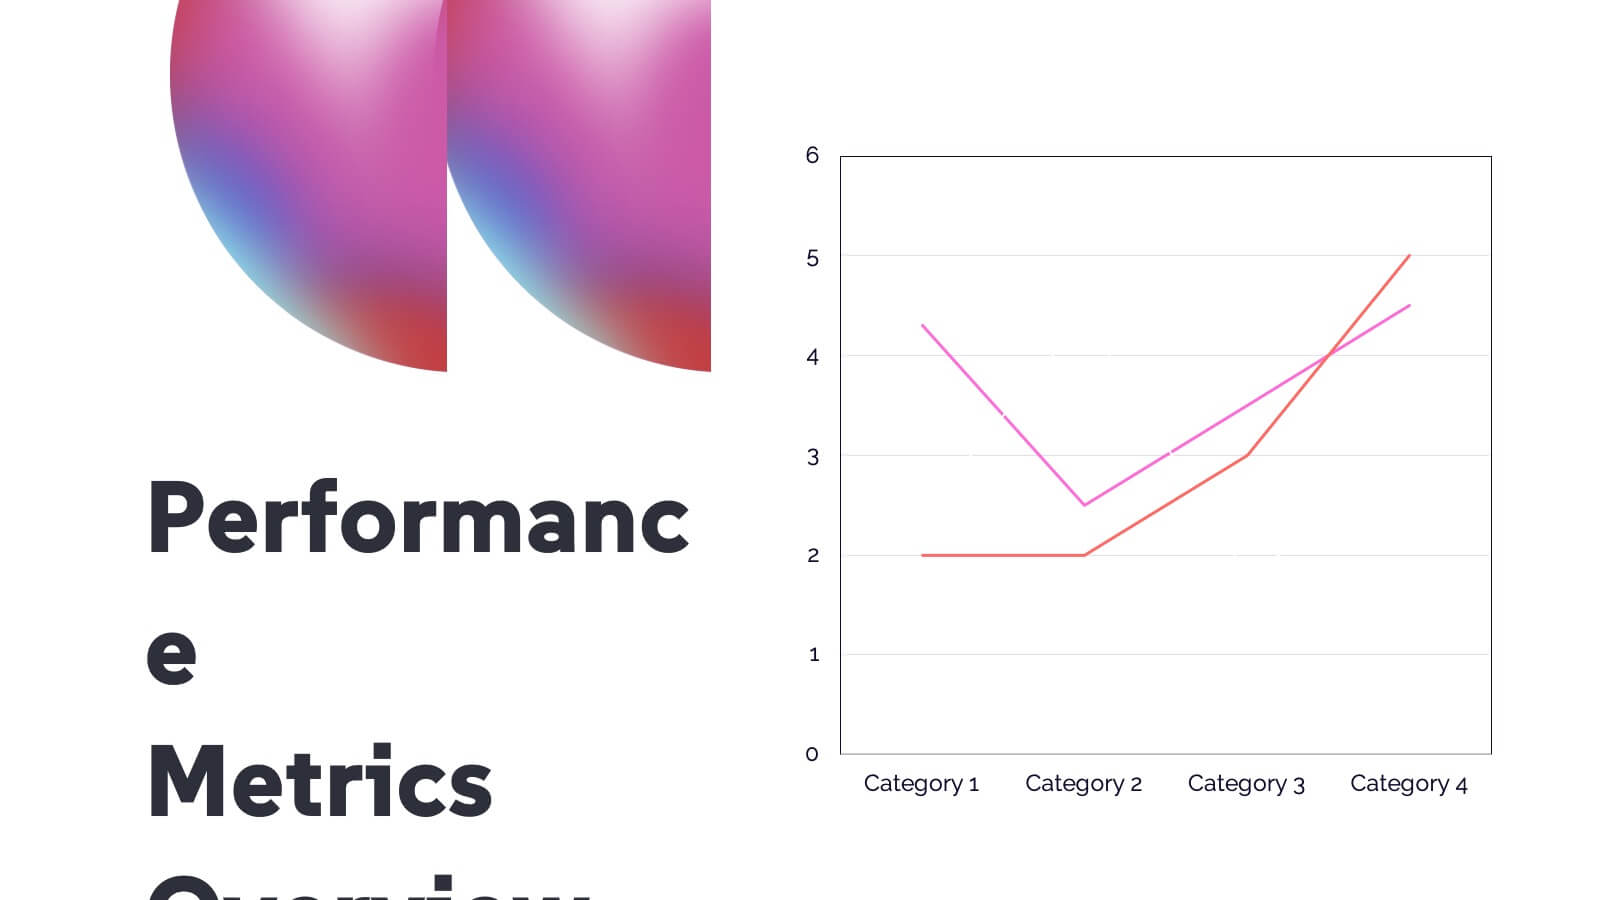
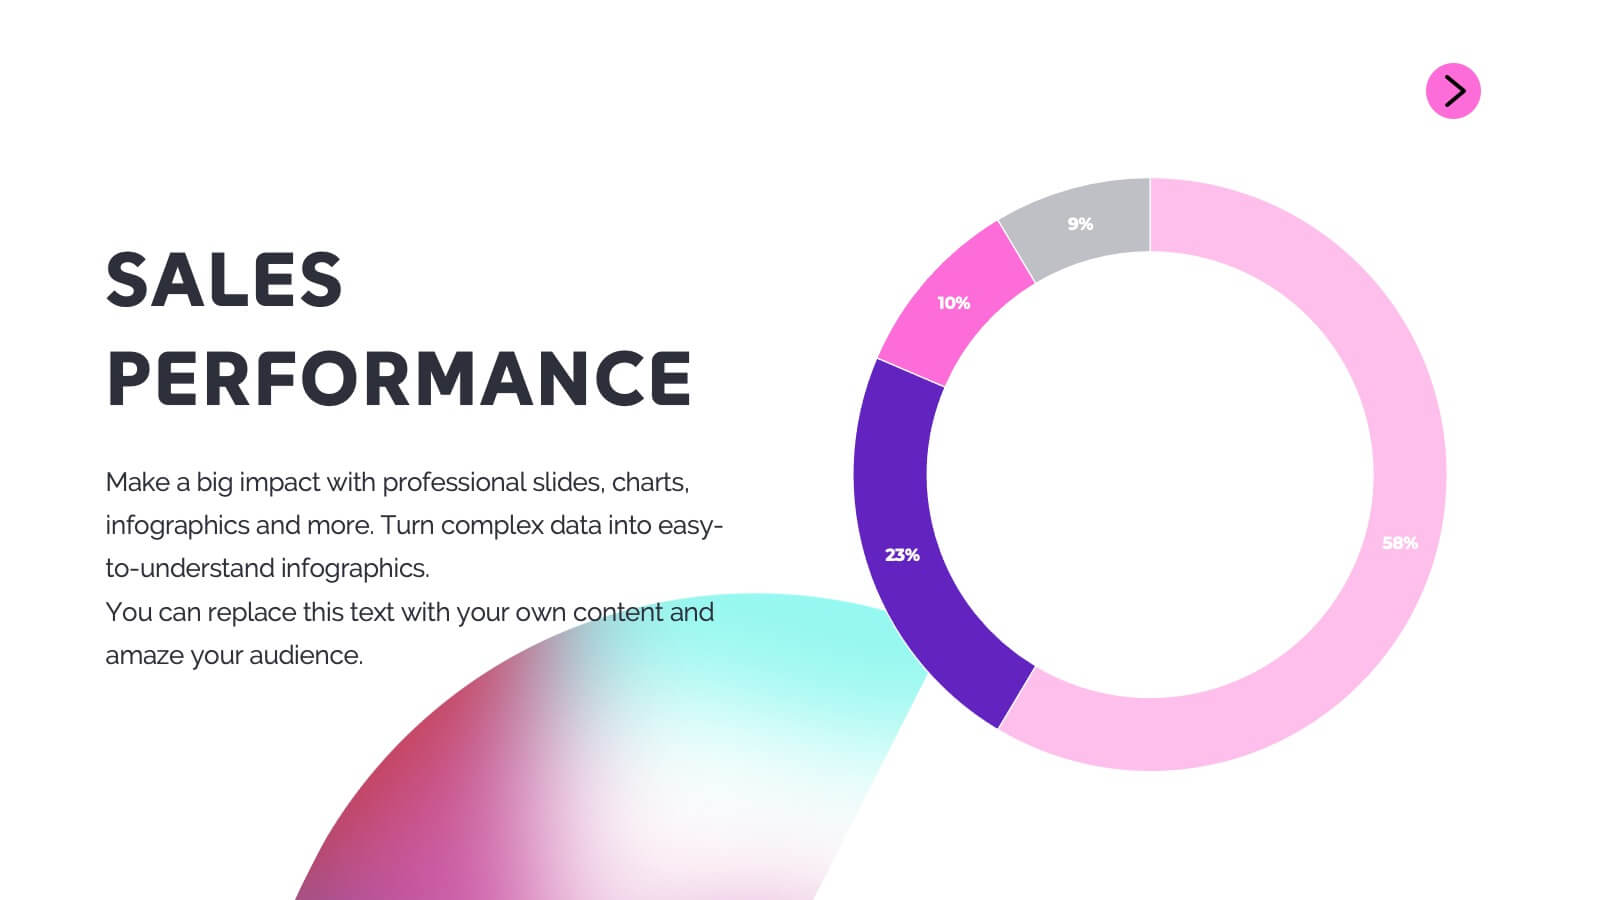
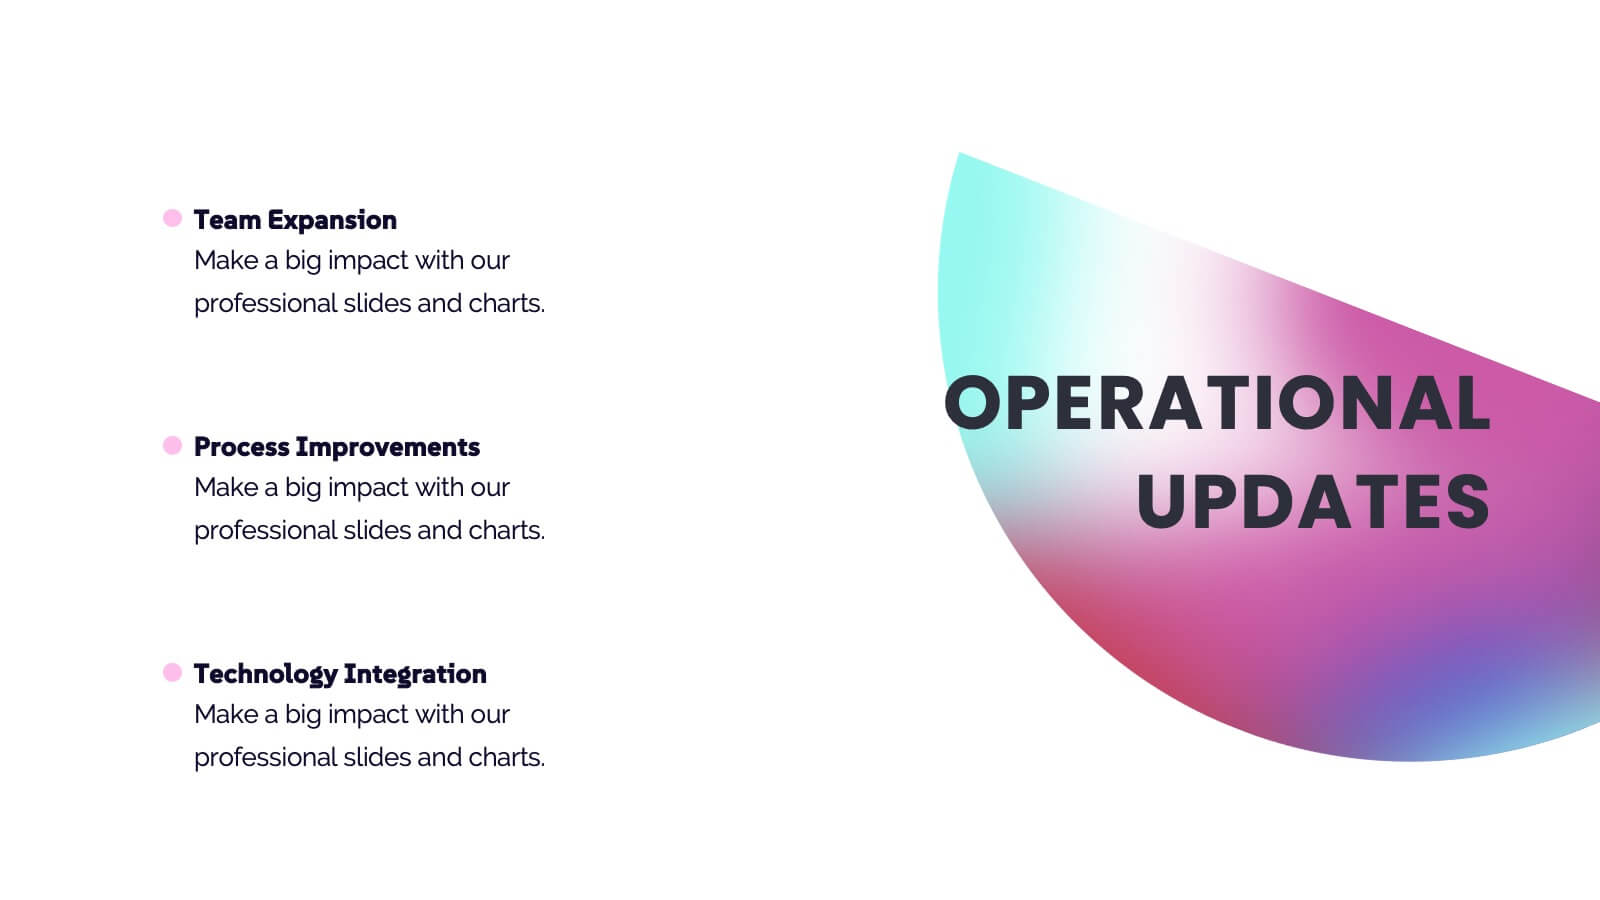
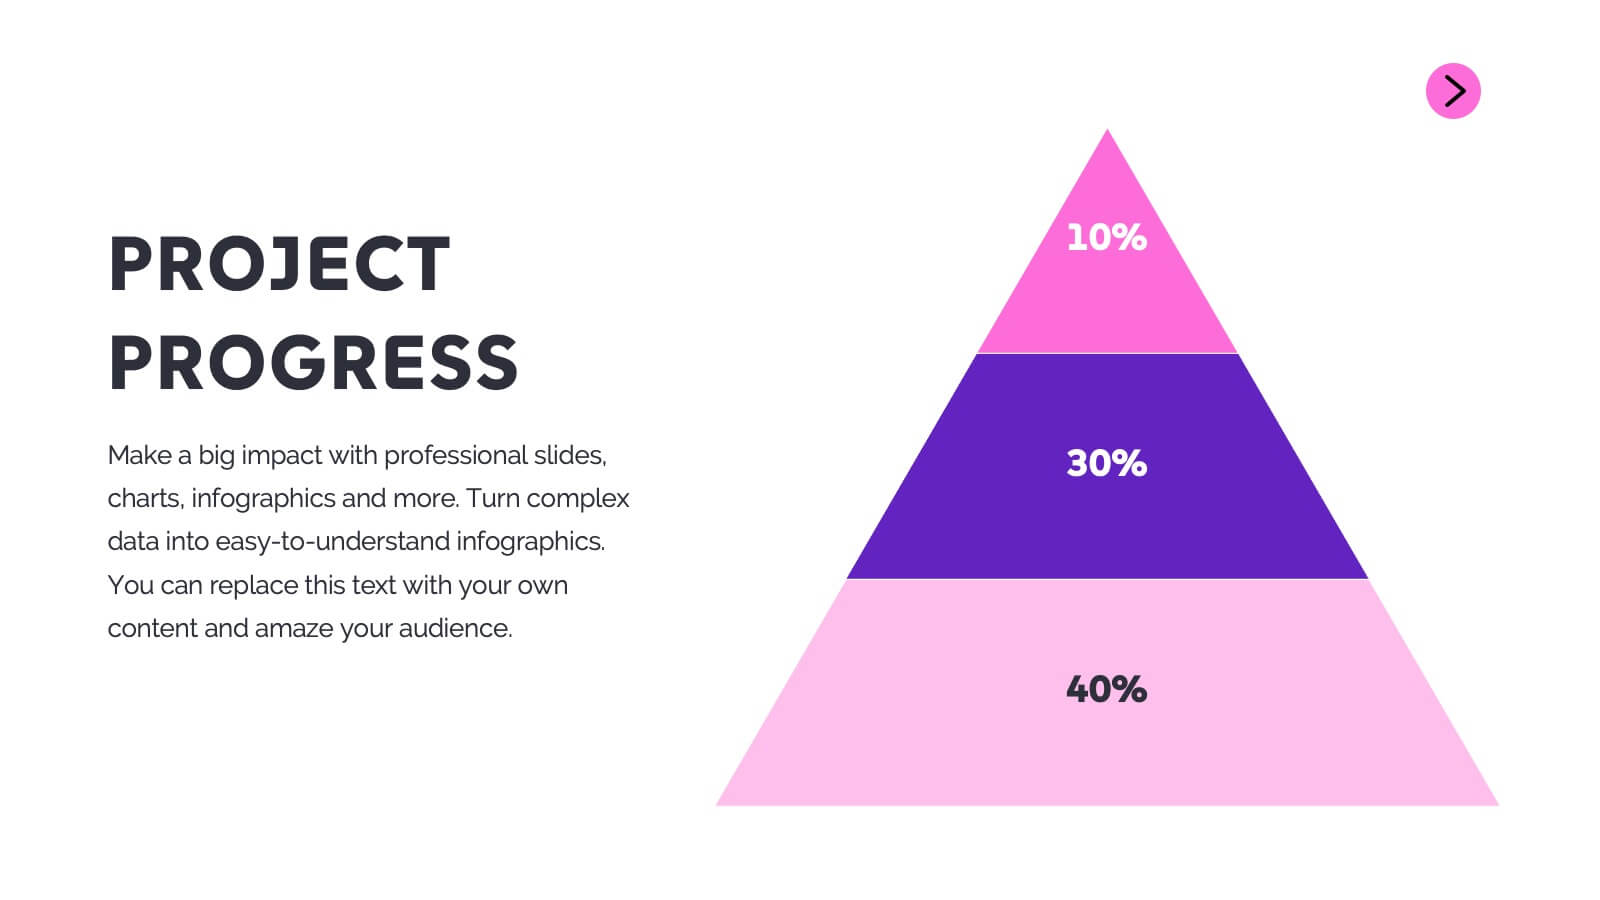
Sphinx Project Status Report Presentation
This modern project status report template is perfect for tracking progress and highlighting key achievements. It includes sections for performance metrics, financial summaries, challenges, and strategic initiatives. Keep stakeholders informed with clear, concise updates. Compatible with PowerPoint, Keynote, and Google Slides for easy customization and presentation.