


Features
- 5 Unique slides
- Fully editable and easy to edit in Microsoft Powerpoint, Keynote and Google Slides
- 16:9 widescreen layout
- Clean and professional designs
- Export to JPG, PDF or send by email


Do you have any questions?
Recommend


5 slides
Employee Change Management Plan Presentation
Guide employees through transitions with clarity using this Employee Change Management Plan template. This step-by-step visual represents progress from initial stages (20%) to full implementation (100%), making it ideal for HR strategies, organizational development, and workforce transformation initiatives. Fully customizable—adjust colors, text, and data points to fit your business needs. Compatible with PowerPoint, Keynote, and Google Slides for seamless integration into your presentations.


24 slides
Minerva UX Design Presentation
Elevate your UX design presentations with this comprehensive template, featuring sections for project overview, user research, wireframes, prototyping, and usability testing. Showcase design systems, branding guidelines, and accessibility considerations with ease. Perfect for demonstrating a user-centered approach. Compatible with PowerPoint, Keynote, and Google Slides for seamless customization.


12 slides
Understanding Digital Currencies Presentation
Simplify the complexity of crypto ecosystems with the Understanding Digital Currencies presentation template. Designed around a wallet-style visual, this layout highlights key features of various cryptocurrencies using six labeled touchpoints. Perfect for introducing Bitcoin, Ethereum, altcoins, and digital wallets in educational, financial, or blockchain-related presentations. Ideal for crypto educators, fintech startups, and investment analysts. Compatible with PowerPoint, Keynote, and Google Slides.


10 slides
Decision Tree Diagram Presentation
Simplify Decision-Making! The Decision Tree Diagram Presentation helps visualize complex choices with structured branching paths. Perfect for business strategies, process flows, or risk analysis, this template ensures clarity with editable nodes and connectors. Fully customizable and available for PowerPoint, Keynote, and Google Slides to fit your unique needs effortlessly.


7 slides
Finance in Business Infographic Presentation
Finance is an essential component of any economy, and it plays a crucial role in enabling businesses, individuals, and governments to manage their resources effectively. Use this template to help others understand the basics of finance in a simple manner. Finance is very broad, this template contains everything you need to keep track of your spending and earning. This has been designed to help you deliver informative Infographics that convey the main points of your topic. It is compatible with PowerPoint, Keynote and Google Slides, so you can easily change the text, add images, and change colors.


4 slides
New Hire Orientation Program Presentation
Set new hires up for success with a structured onboarding journey. This New Hire Orientation Program template visually represents key onboarding steps, ensuring clarity and consistency. Ideal for HR professionals and managers. Fully editable and compatible with PowerPoint, Keynote, and Google Slides for seamless customization.


4 slides
Workforce Adaptation Through Change Management Presentation
Show how your team evolves and thrives through transformation with this visual journey up the change curve. This template uses a clear mountain-climb illustration to highlight workforce progression and adaptation. Ideal for HR, change leaders, and organizational development professionals. Fully compatible with PowerPoint, Keynote, and Google Slides.


7 slides
Science Program Infographic Presentation
Science play's a crucial role in shaping our understanding of the world around us and has numerous applications in fields such as medicine and environmental science. This template can be used to present your science project in a professional fashion. The infographic contains all the graphs, figures and data you need, so that all you need to include is your own text. This is a creative template perfect for your next scientific research projects. It can be used to present the results of a study or an experiment. This template is compatible with powerpoint, keynote and google slides.


6 slides
Business Flow Chart Design Presentation
Bring clarity and momentum to your process with a clean, visual layout that turns complex steps into an easy-to-follow flow. This presentation helps teams map stages, responsibilities, and progress with confidence, making it perfect for planning, strategy, and operations. Fully compatible with PowerPoint, Keynote, and Google Slides.


21 slides
Duskflare Corporate Strategy Proposal Presentation
Present your corporate strategy effectively with this comprehensive template, featuring sections on market trends, SWOT analysis, strategic initiatives, and risk management. Designed for clarity and impact, it’s ideal for outlining high-level goals and action plans. Compatible with PowerPoint, Keynote, and Google Slides for seamless presentations.


23 slides
Pomona Business Plan Presentation
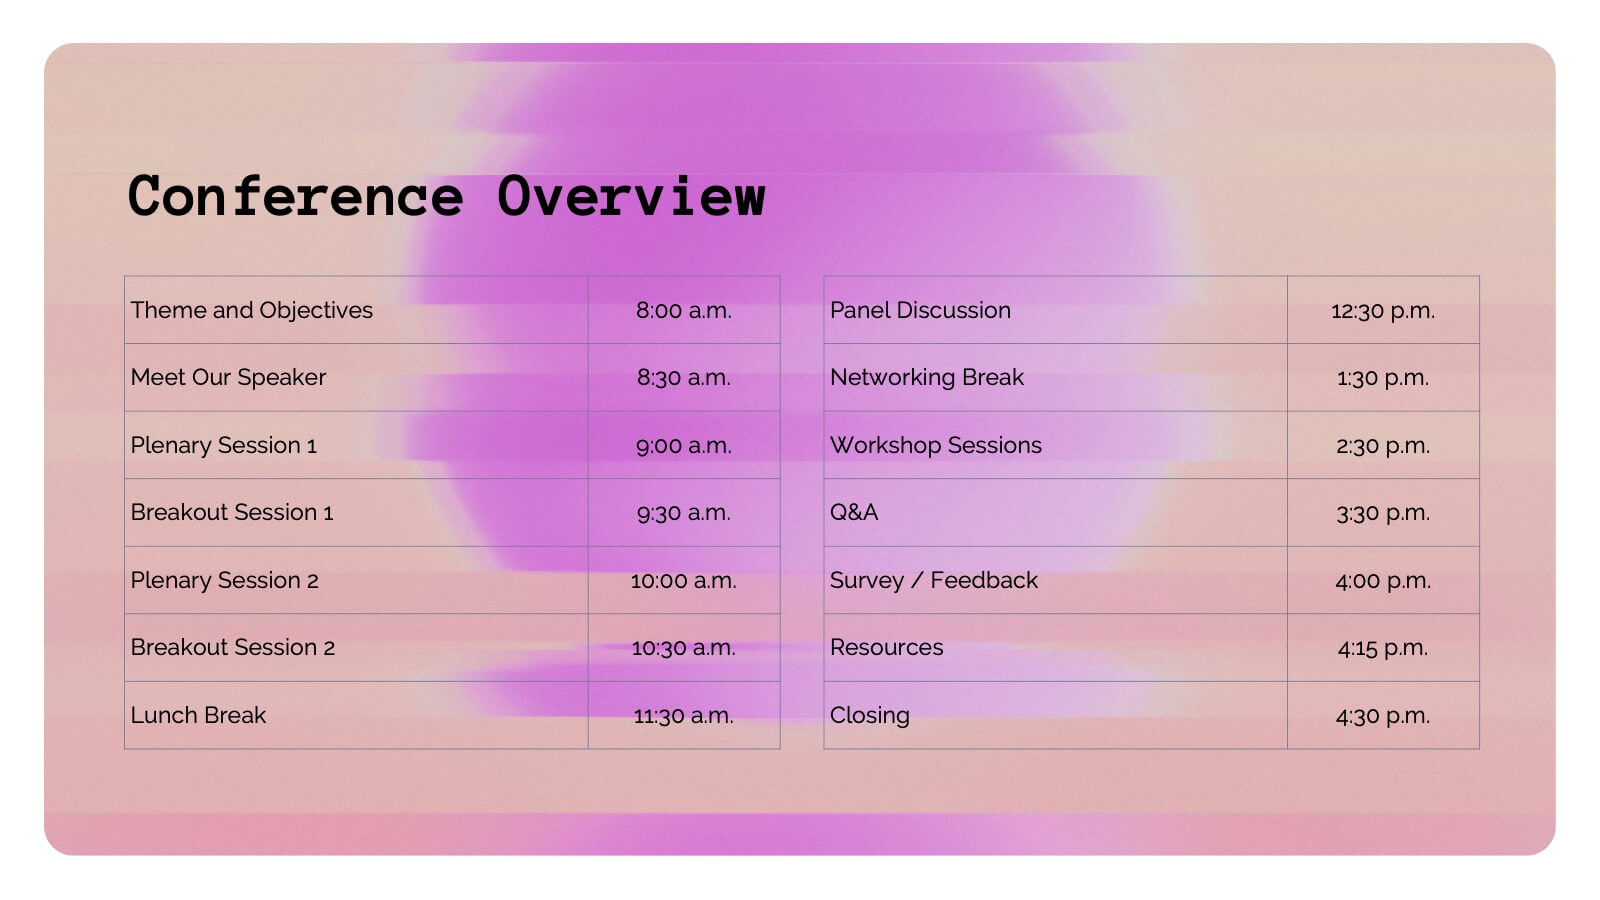
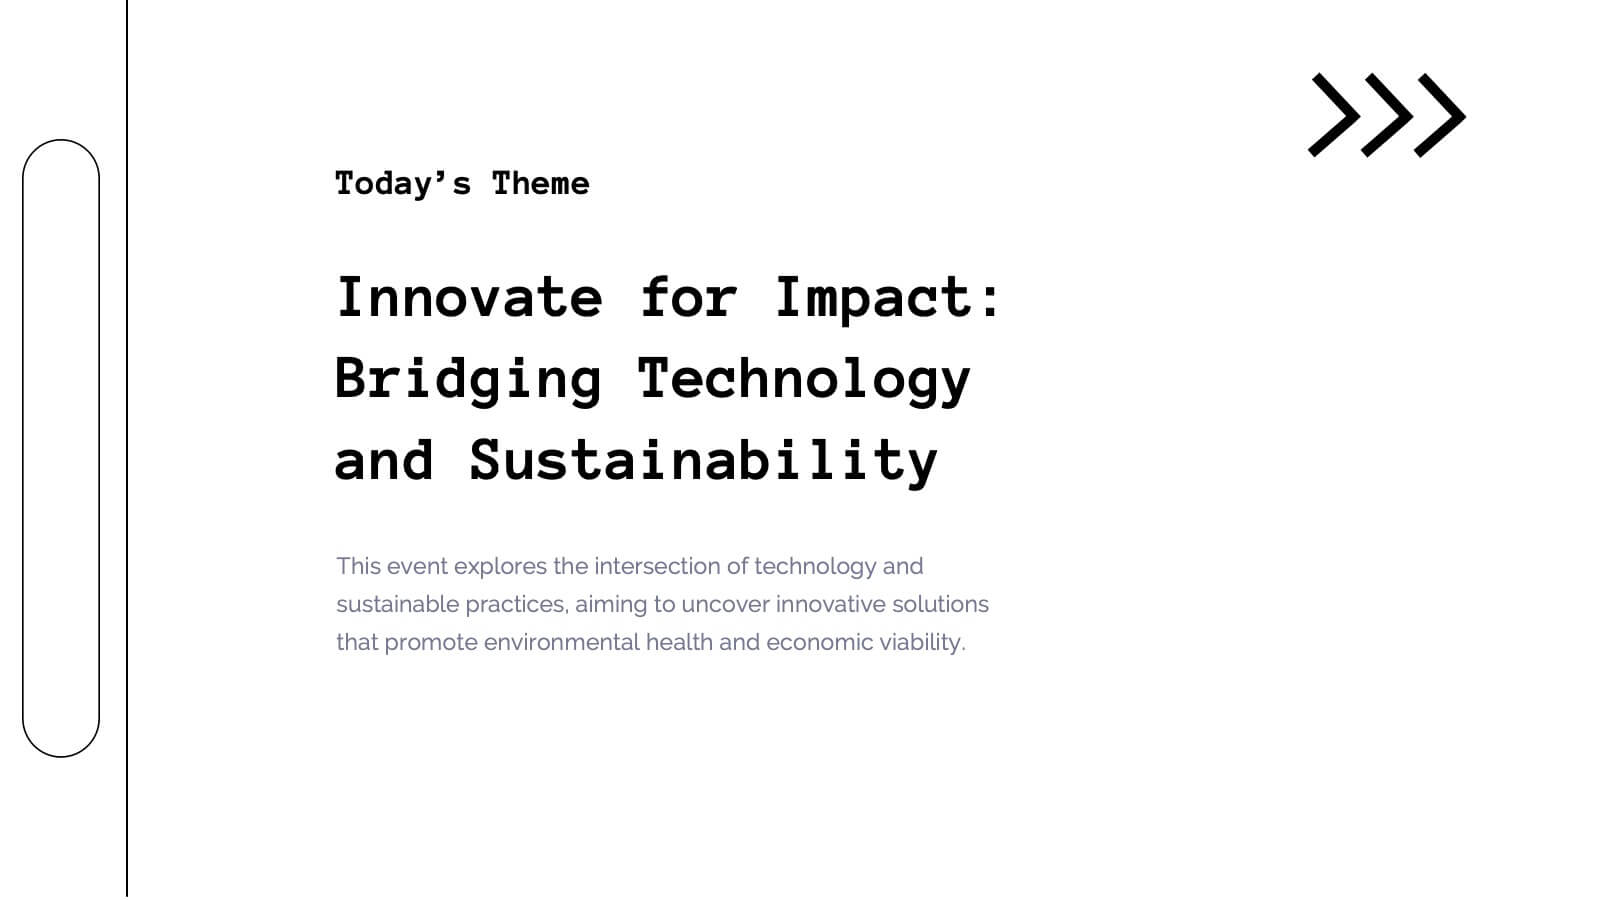
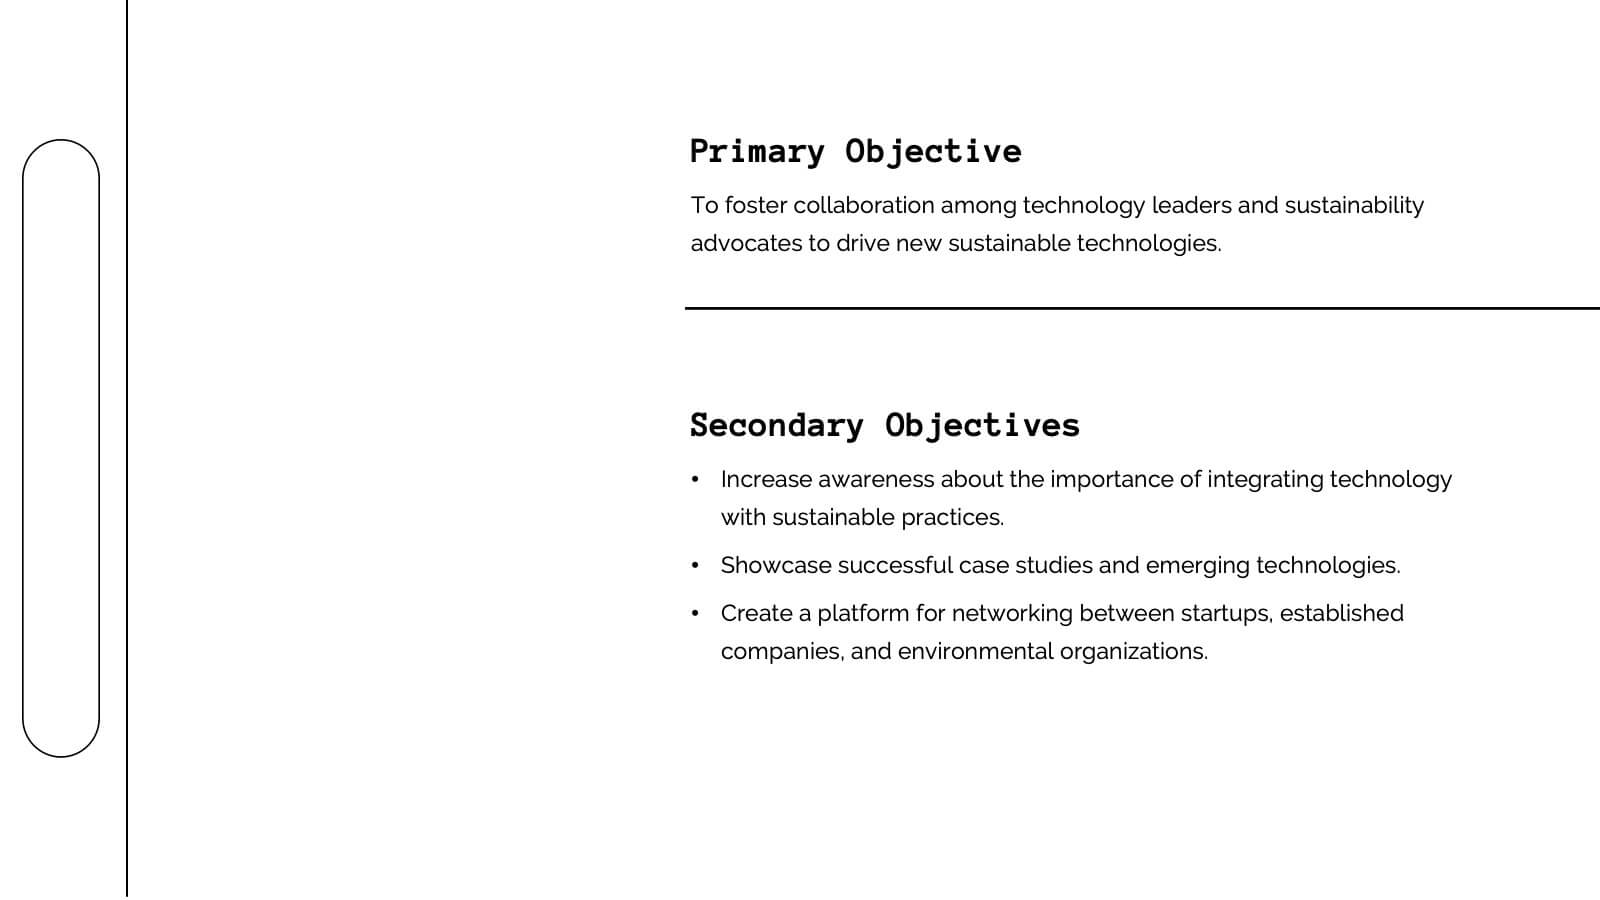
This vibrant and adaptable event agenda template is perfect for organizing your business conference or corporate event. It includes customizable sections for session details, speaker information, and key activities like networking breaks, workshops, and panel discussions. Compatible with PowerPoint, Keynote, and Google Slides, it ensures a smooth and engaging event presentation experience!


5 slides
Training Needs Through Skills Gap Analysis Presentation
Clearly identify training gaps and skill development priorities with the Training Needs Through Skills Gap Analysis Presentation. This structured layout helps HR teams and managers map out competency levels, prioritize development, and align learning paths with business goals. Fully editable in PowerPoint, Keynote, Canva, and Google Slides.


4 slides
Pillar Strategy Framework Presentation
Turn complex strategies into clear, structured visuals with this elegant infographic design. Ideal for showcasing key principles, organizational foundations, or business frameworks, it helps communicate ideas with precision and balance. Fully customizable and compatible with PowerPoint, Keynote, and Google Slides for effortless editing and professional results.


7 slides
Business Strategy Options Presentation
Bring clarity to your strategic choices with a clean, modern layout that helps you present multiple business directions side by side. Ideal for showcasing growth plans, decision paths, or market approaches, this presentation makes strategy easy to follow. Fully compatible with PowerPoint, Keynote, and Google Slides for effortless editing.


5 slides
Marijuana Cultivation Infographics
Marijuana cultivation refers to the process of growing and cultivating marijuana plants for various purposes, primarily for medicinal or recreational use. These vertical infographics are designed to provide essential information about the cultivation of marijuana. It offers an in-depth overview of the cultivation process, growing techniques, equipment, and best practices. The template outlines the step-by-step cultivation process of marijuana, starting from seed germination to harvesting and drying. It includes visuals and icons to illustrate each stage, making it easy to understand for beginners and everyone.


26 slides
Maki Presentation Template
Japanese cuisine is known all around the world, there is so much to try including all the different types of sushi. Maki is a 26 slide template made to help you market your services and products. The clean, simplistic design makes it easy for you to display your content in any modernized way. Maki is designed to showcase your packages, pricing and more. Help your customers feel comfortable purchasing your service or product using this template. Present your message clearly and effectively with this presentation. You can customize the design, photos, background and fonts to make it your own.


26 slides
Sophia Presentation Template
Sophia is a feminine template with a colorful presentation that is simple, clean and organized to make any information stand out. Sophia is suitable for personal projects as well as anyone looking for a presentation for their business. It's equipped to keep your content and layout consistent. The theme is eye catching with the colors, images and font. Anyone who has a bakery would love this template. Editing features make it easy to customize for your own needs by adding company logos, product information and other relevant details on your template. It is lightweight, fast and easy to use.