


Features
- 4 Unique slides
- Fully editable and easy to edit in Microsoft Powerpoint, Keynote and Google Slides
- 16:9 widescreen layout
- Clean and professional designs
- Export to JPG, PDF or send by email


Do you have any questions?
Recommend


26 slides
Human Resources Colorful Vectors
Dive into the dynamic realm of human resources, where talent thrives and organizations find their heartbeat. Radiating with a playful palette of sunny yellow, refreshing green, blush pink, and crisp white, our template captures the vibrancy and diversity of the HR world. Adorned with colorful graphics, relatable icons, and insightful image placeholders, it's a testament to the human touch in every organization. Expertly tailored for Powerpoint, Keynote, or Google Slides. An invaluable tool for HR professionals, recruitment agencies, corporate trainers, or anyone focused on building and nurturing talent. Engage, empower, and elevate; let your HR endeavors shine.


23 slides
Skycrest Business Idea Pitch Deck Presentation
Present your innovative business idea with this bold pitch deck, featuring sections for problem statement, solution, business model, and financial projections. Ideal for capturing investor attention, this template supports PowerPoint, Keynote, and Google Slides, making it perfect for impactful presentations across multiple platforms.


24 slides
Zenith Investor Pitch Presentation
Impress your investors with this sleek, modern pitch deck presentation template. Perfect for detailing problem statements, solutions, business models, and revenue projections, it features a professional design with a cohesive color scheme. Highlight key elements like market opportunities, competitive landscapes, and financials to captivate your audience. Compatible with PowerPoint, Keynote, and Google Slides, it ensures seamless presentations on any platform.


12 slides
Sales Metrics Dashboard Presentation
Unlock a sharper view of your sales story with a clean, data-driven layout that highlights performance trends at a glance. This presentation organizes KPIs, charts, and progress indicators into an easy-to-follow dashboard that supports smarter decision-making. Fully compatible with PowerPoint, Keynote, and Google Slides.


7 slides
Alphabet Infographic Presentation Template
Our Alphabet Infographic features a well-designed set of icons, letters and numbers. This template is perfect for PowerPoint presentations and will allow you to enhance your business/school design. Make your data sets easily readable, attractive and concise with this template. This Alphabet Infographic template is perfect for making your pitch stand out, with a bold and catchy design. It features a modern look that captures viewer's attention, but also contains plenty of details for them to explore. The colors are bright and vibrant, so you know the message won't be forgotten easily.


5 slides
Benefits of Good Nutrition Infographics
Good Nutrition is crucial for overall health, disease prevention, weight management, mental well-being, energy levels, and various other aspects of our physical and mental health. These vertical infographic templates can be used to present the importance and advantages of maintaining a healthy and balanced diet. These are designed to educate and inspire individuals to make informed choices about their nutrition and overall well-being. Perfect for educational presentations, nutrition workshops, wellness programs, or health-related websites, these templates provide valuable information and visual aids to promote better nutrition choices.


21 slides
Novaedge Professional Portfolio Showcase Presentation
Showcase your expertise with this elegant experience proposal presentation! Featuring sections like portfolio highlights, creative process, client testimonials, and pricing packages, it provides a complete overview of your work. Ideal for freelance professionals or agencies, this template ensures a polished presentation. Fully compatible with PowerPoint, Keynote, and Google Slides.


5 slides
Oil Industry Revenue Infographics
The oil industry, also known as the petroleum industry, is a global sector that involves the exploration, production, refining, transportation, and marketing of petroleum products. These vertical infographics present key statistics and insights about the revenue generated by the oil industry. This infographic provides an overview of the financial aspects of the oil industry, including revenue sources, market trends, and economic impact. The template showcases the revenue trends of the oil industry over a specific period. It utilizes line graphs, bar charts, or other visual elements to illustrate the growth or fluctuations in revenue over time.


4 slides
Task List and To-Do Management Presentation
Boost productivity with this engaging task management template. Designed for clear visualization, it helps organize priorities, track progress, and streamline workflows efficiently. Featuring a structured layout, it's perfect for professionals managing daily to-dos, project timelines, or business strategies. Fully compatible with PowerPoint, Keynote, and Google Slides for seamless use.


8 slides
Root Cause Visual via Ishikawa Method
Clarify root causes and drive actionable solutions with the Root Cause Visual via Ishikawa Method Presentation. This fishbone-style infographic layout uses six categorized nodes mapped directly to a streamlined fish silhouette, ideal for visualizing complex problems. Easily editable in PowerPoint, Keynote, and Google Slides.


2 slides
Elegant Thank You Slide Presentation
Leave a lasting impression with this elegant thank-you slide template! Perfect for closing presentations with professionalism, this design features a modern layout with space for contact details and branding. Ideal for business meetings, pitches, and corporate events. Fully customizable and compatible with PowerPoint, Keynote, and Google Slides for seamless editing.


6 slides
Cognitive Psychology Infographics
Delve into the fascinating realm of Cognitive Psychology with our customizable infographic template. This template is fully compatible with popular presentation software like PowerPoint, Keynote, and Google Slides, allowing you to easily tailor it to convey essential concepts and insights within the field of Cognitive Psychology. The Cognitive Psychology infographic template serves as a visually engaging platform for summarizing key principles, theories, and research findings. Whether you're a psychology student, educator, or simply intrigued by the workings of the human mind, this template provides a user-friendly canvas to create informative presentations and educational materials. Enhance your understanding of Cognitive Psychology with this SEO-optimized infographic template, designed for clarity and ease of use. Customize it to showcase cognitive processes, influential experiments, and practical applications, making complex concepts more accessible to your audience. Start crafting your personalized infographic today to explore the depths of Cognitive Psychology.


22 slides
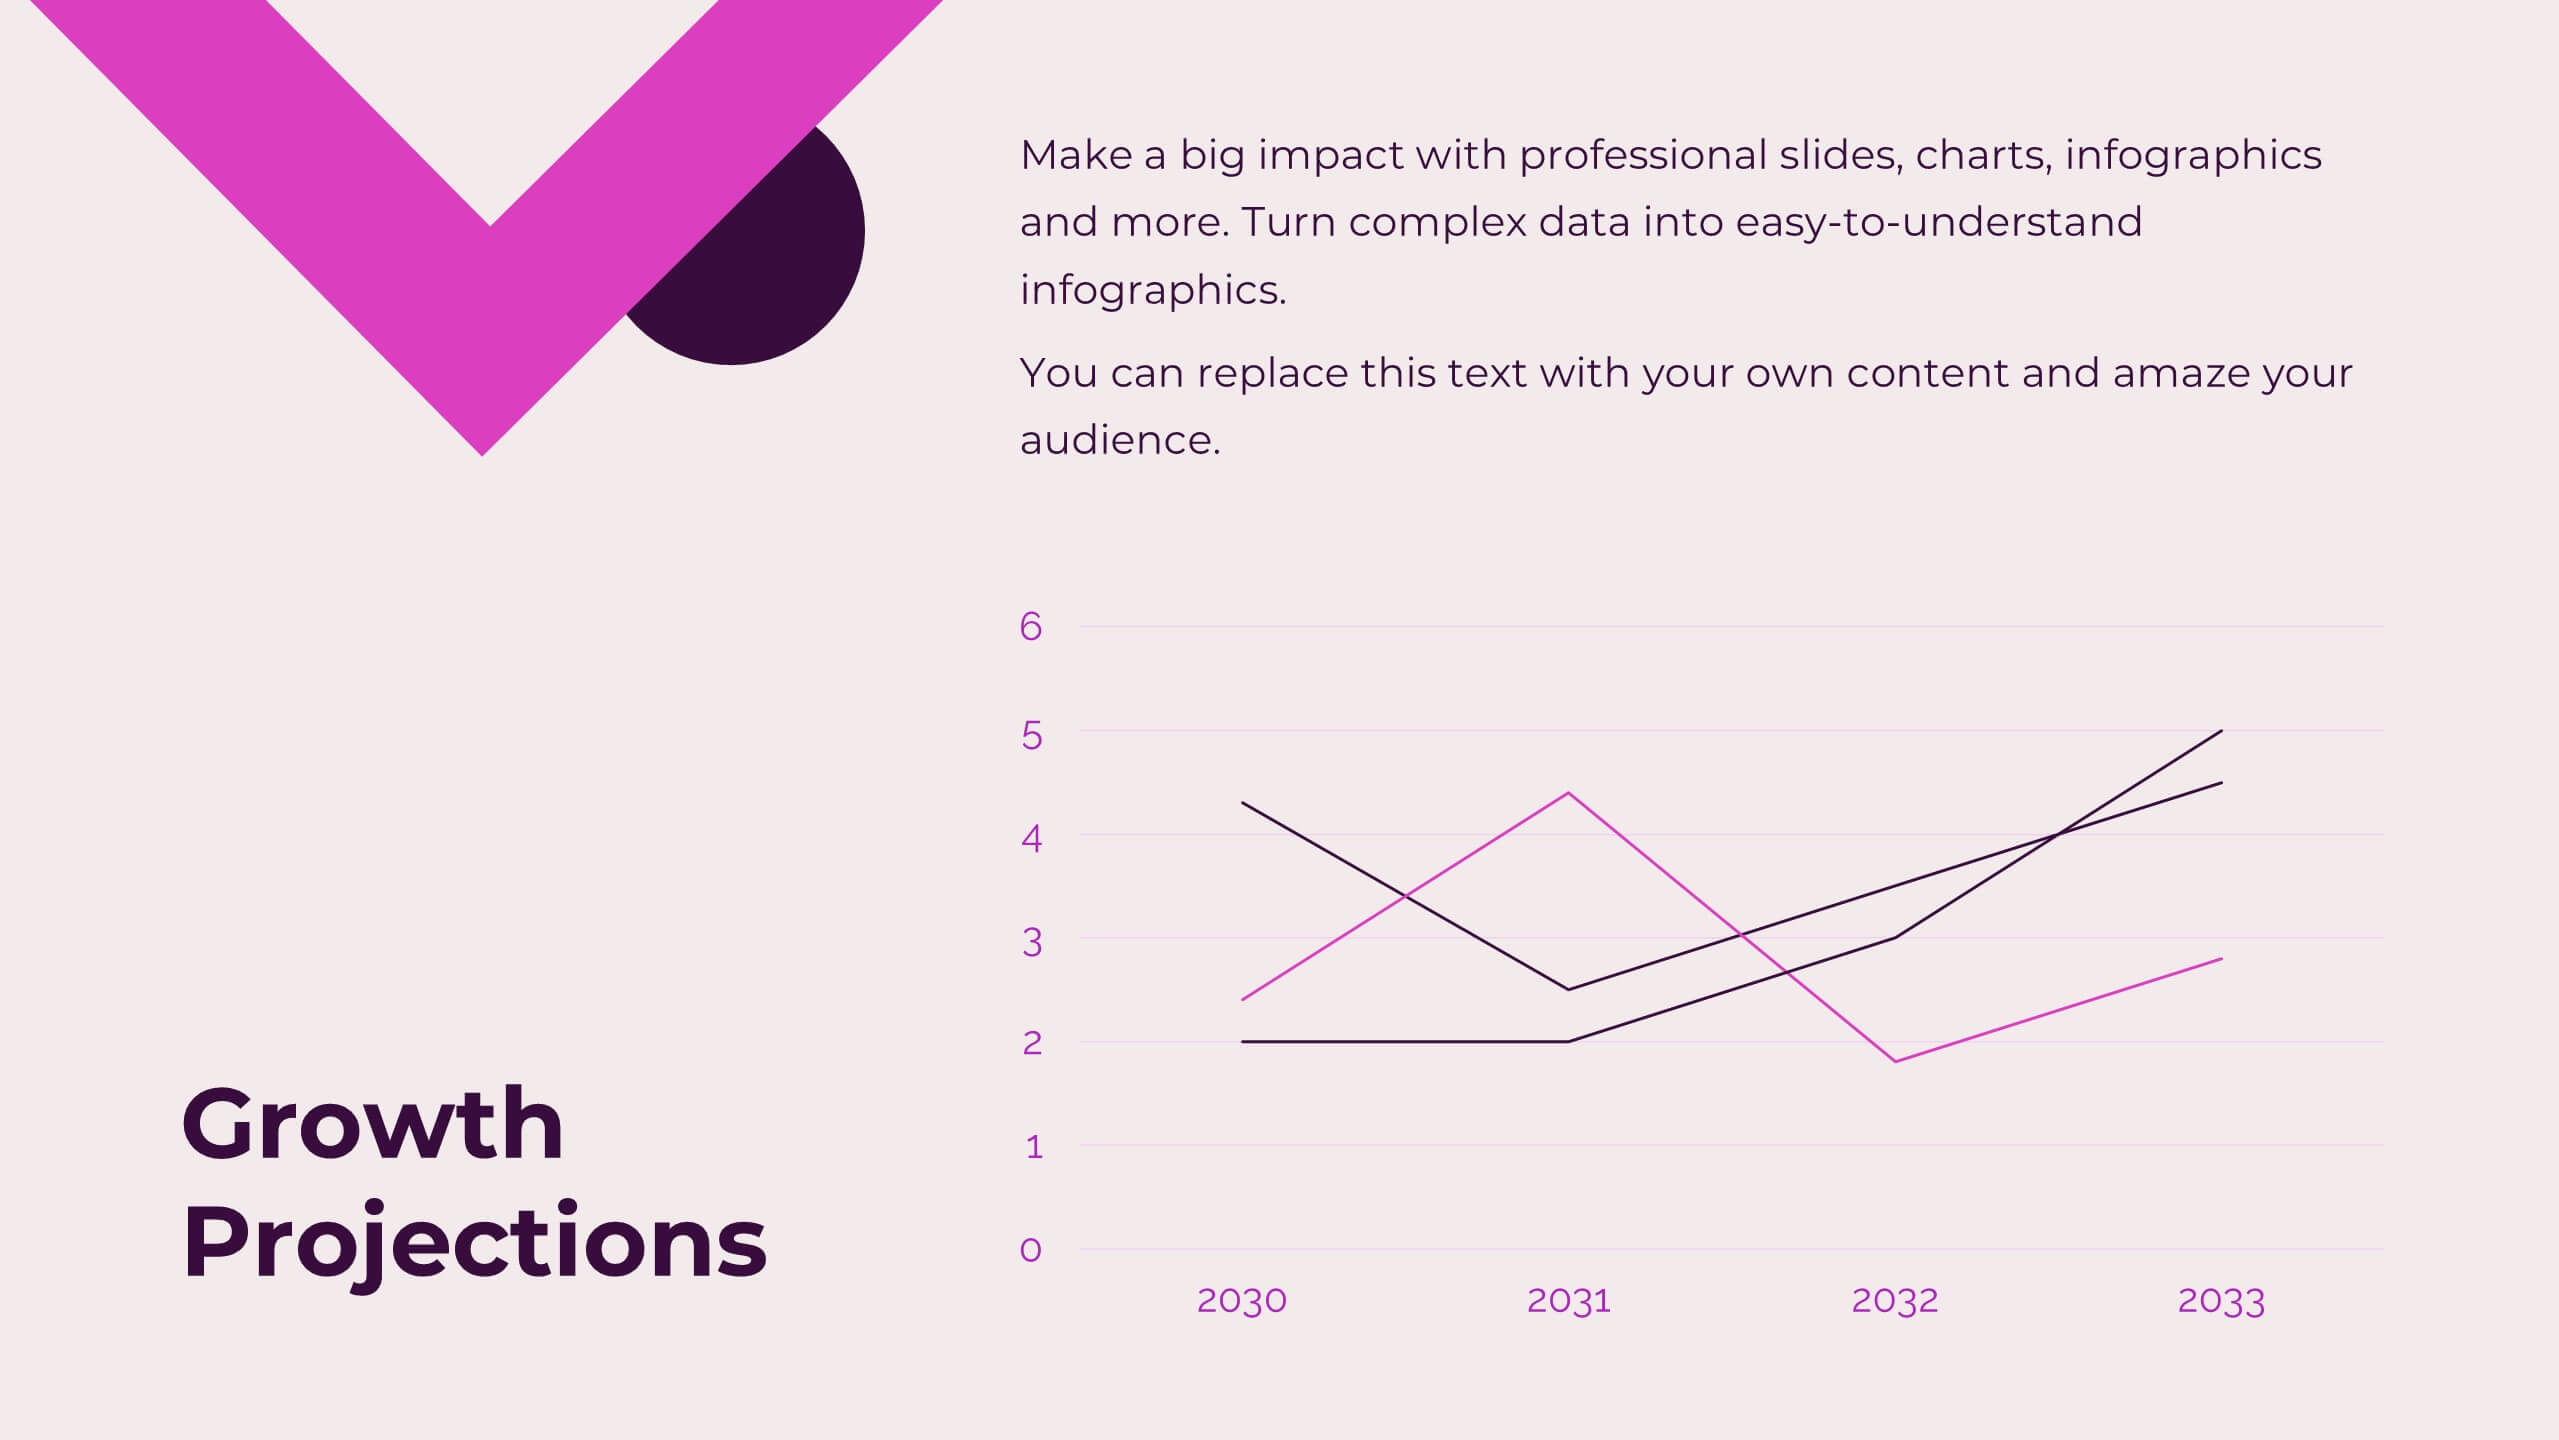
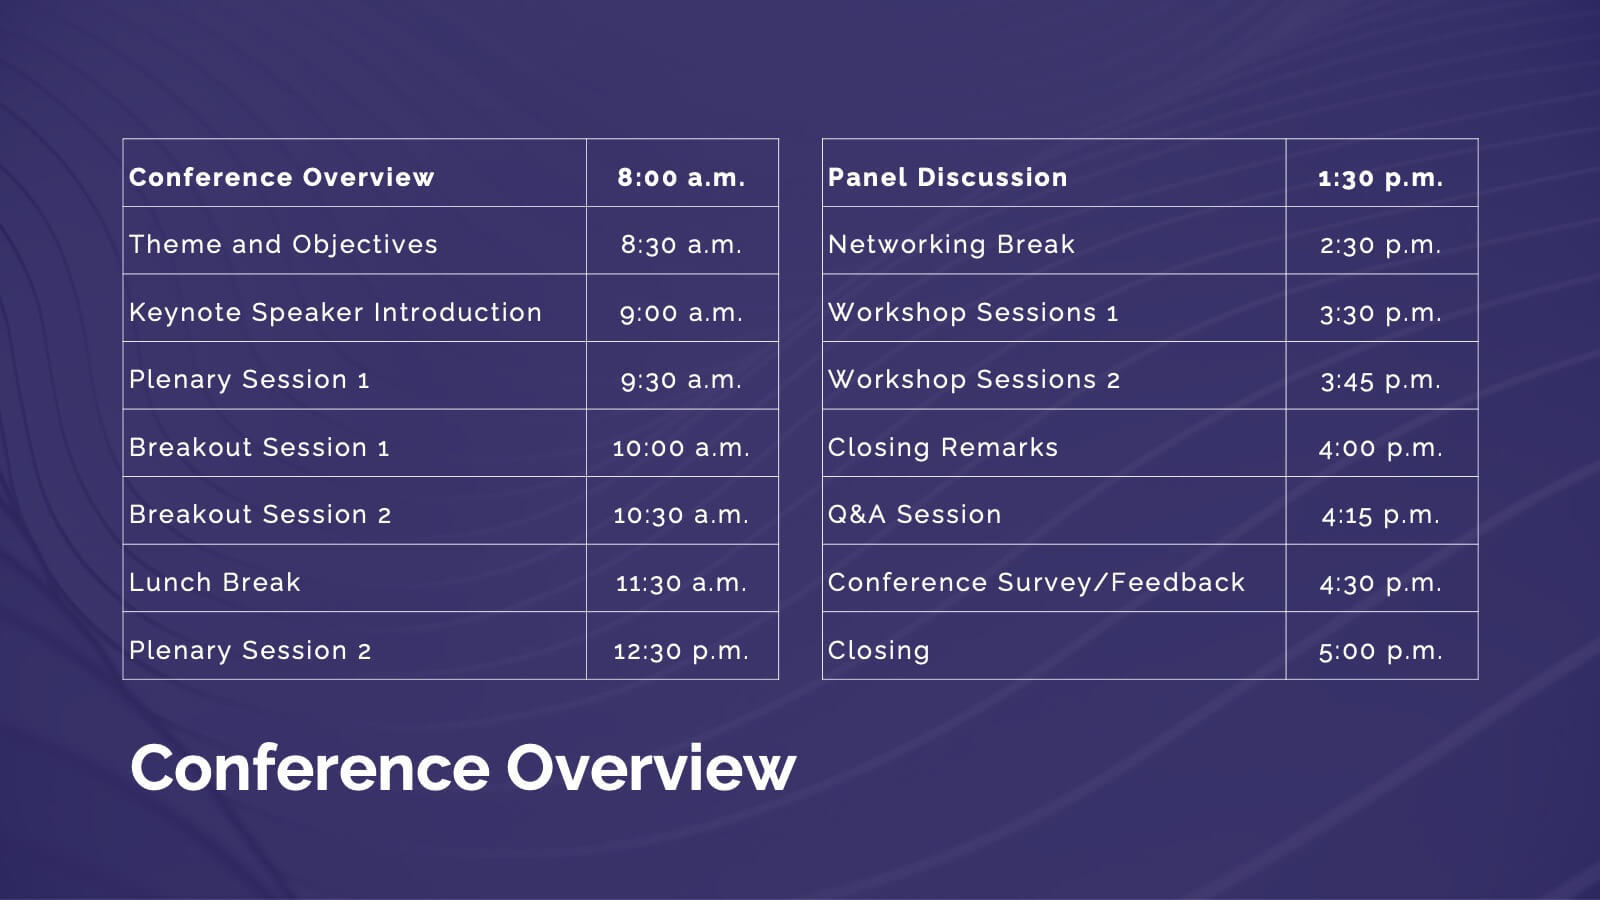
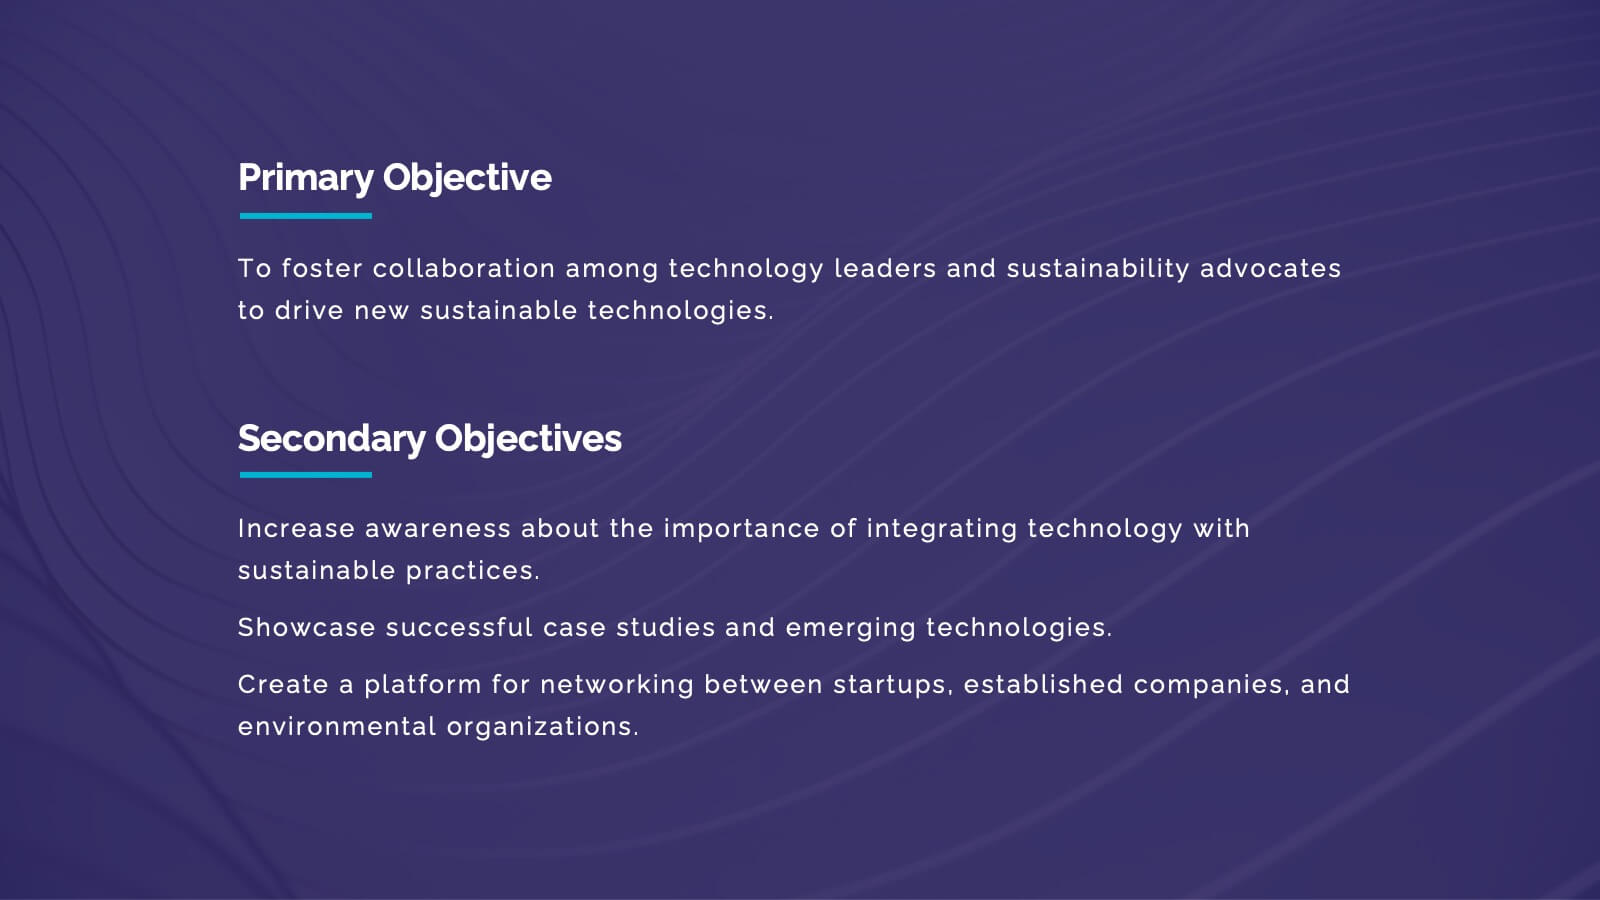
Nimbus Business Development Proposal Presentation
Boost your business presentations with this vibrant, professional template designed for business development proposals. Perfect for detailing conference overviews, themes, objectives, and keynotes, it features a clean and engaging layout. Highlight critical sessions and networking opportunities to captivate your audience. Compatible with PowerPoint, Keynote, and Google Slides, it ensures seamless presentations on any platform.


5 slides
Traveling Options Infographics
There are various traveling options available, depending on the destination, budget, and personal preferences. These infographic templates are a comprehensive tool for presenting different modes of transportation and travel options. This is the perfect option if you're delivering a presentation on travel planning, transportation choices, or sustainable travel, this template will help you present information in a visually appealing and informative way, assisting your audience in making well-informed decisions for their travel needs. This template is designed to be compatible with PowerPoint, Keynote, and Google Slides.


5 slides
Spider Chart for Mind Organization Presentation
Clarify complex ideas with the Spider Chart for Mind Organization Presentation. This layout visually maps key topics and subtopics, helping you identify patterns, priorities, or areas of focus. Ideal for planning, decision-making, and brainstorming sessions. Fully customizable in Canva, PowerPoint, Google Slides, and Keynote for seamless use.


10 slides
Water Cycle and Hydrological Study Presentation
Break down complex water cycle processes with this engaging diagram layout. Featuring a bottle-shaped center graphic with directional arrows, it’s perfect for illustrating hydrological stages or sustainability concepts. Fully editable in PowerPoint, Keynote, and Google Slides, making it ideal for educational, environmental, or scientific presentations. Clear, modern, and easy to use.


5 slides
Visual Mind Connections Bubble Chart Presentation
Visualize interconnected concepts with clarity using the Visual Mind Connections Bubble Chart Presentation. This engaging layout centers around a core idea, surrounded by supporting points in a clean, circular flow. Ideal for mapping strategies, team roles, or processes. Fully editable in PowerPoint, Keynote, or Google Slides—perfect for business, education, or coaching.