


Features
- 4 Unique slides
- Fully editable and easy to edit in Microsoft Powerpoint, Keynote and Google Slides
- 16:9 widescreen layout
- Clean and professional designs
- Export to JPG, PDF or send by email


Do you have any questions?
Recommend


20 slides
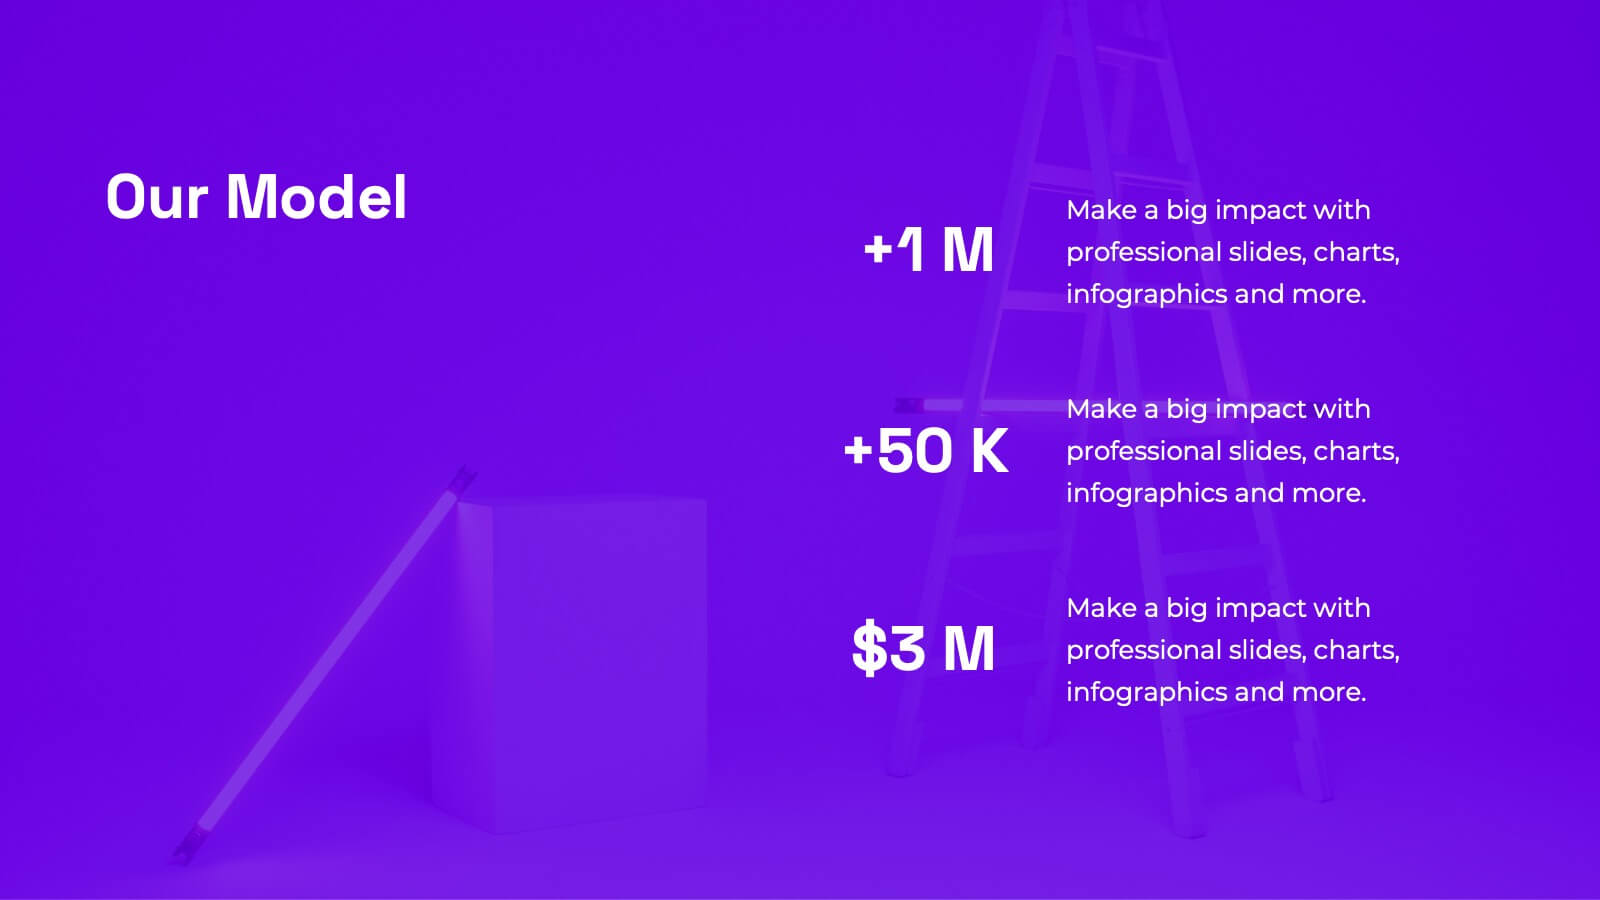
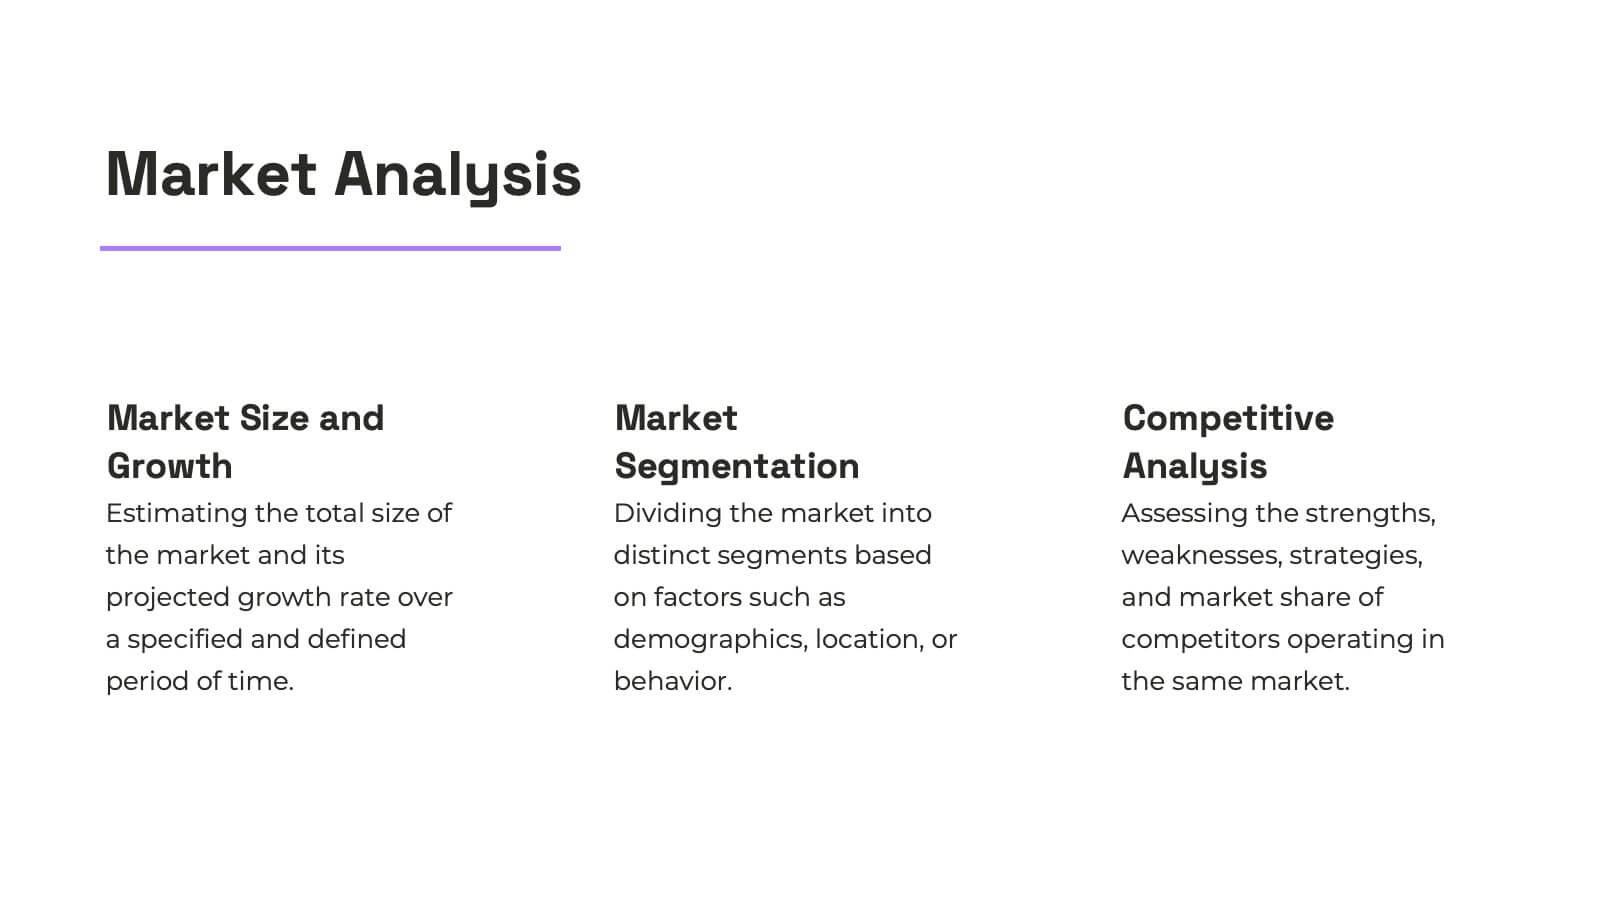
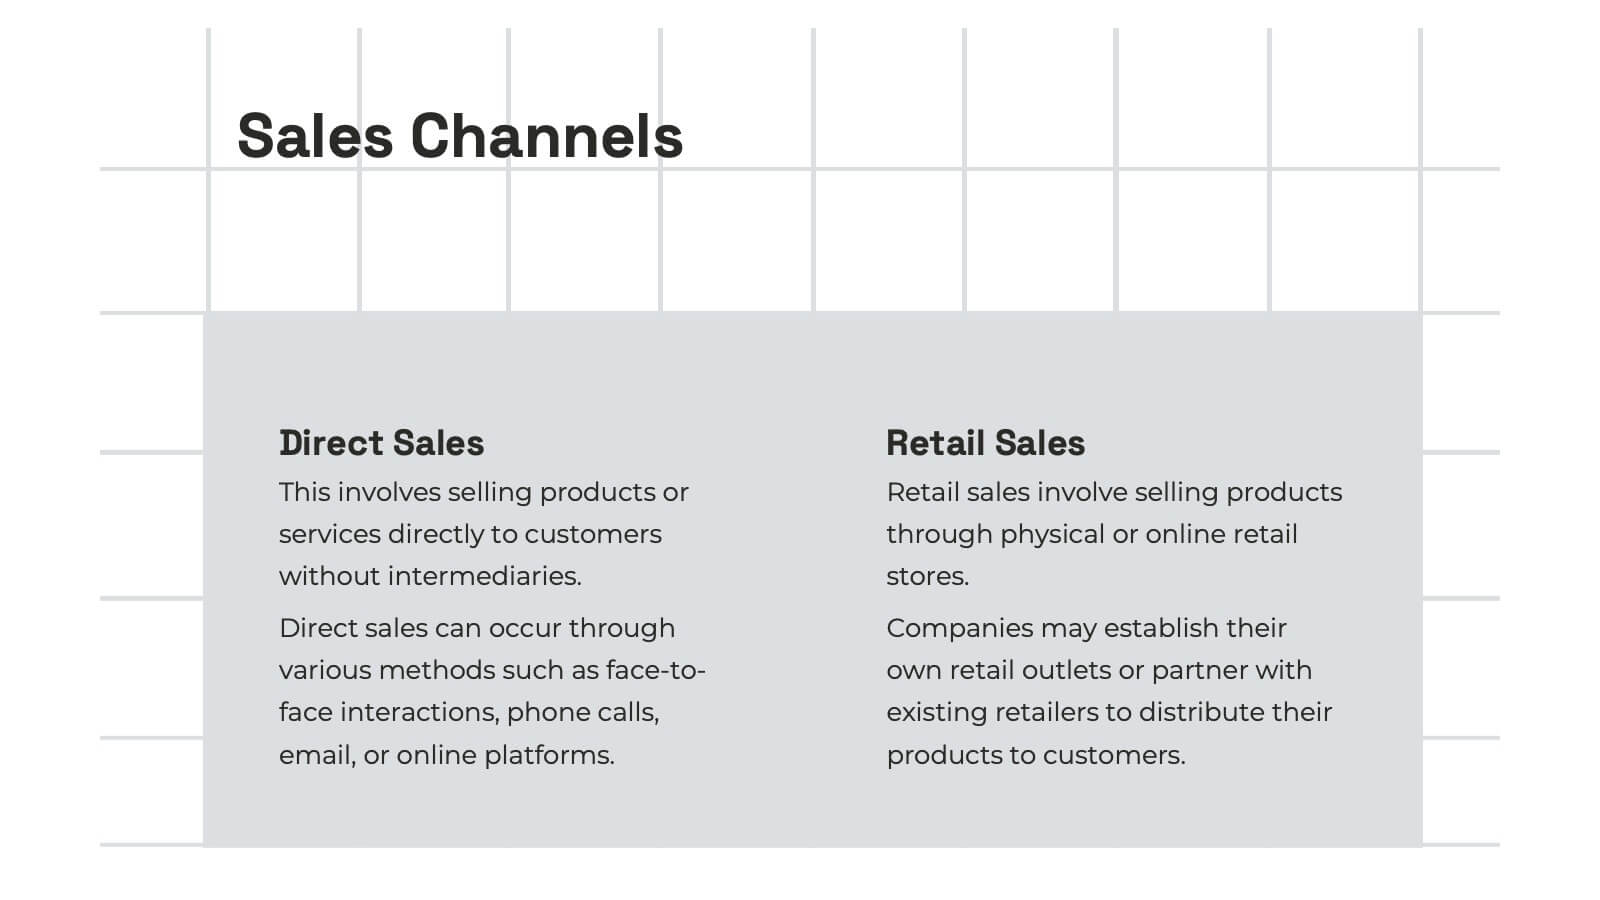
Ashen Sales Proposal Presentation
The Sales Proposal Presentation Template is designed to help you showcase your sales strategy effectively. With 20 fully customizable slides, it covers key areas such as market analysis, sales objectives, pricing strategy, and future opportunities. Ideal for professionals, it’s compatible with PowerPoint, Keynote, and Google Slides.


23 slides
Nightspire Strategic Planning Report Presentation
Streamline your strategic planning process with this professionally designed presentation template. Covering key areas such as market analysis, SWOT assessment, milestones, and resource allocation, this template is ideal for businesses and project teams. Fully editable and compatible with PowerPoint, Keynote, and Google Slides.


4 slides
Case Study Insights and Outcomes Presentation
Showcase real-world takeaways with the Case Study Insights and Outcomes Presentation. This modern, folder-style infographic layout guides your audience through three key stages of a case study—process, insight, and results. Ideal for highlighting lessons learned, performance reviews, or client success journeys. Fully editable in PowerPoint, Keynote, and Google Slides.


4 slides
Customers Journey Map Presentation
Take your audience on a smooth, visual adventure that clearly outlines each stage of the customer experience. This presentation helps you map behaviors, highlight key interactions, and explain decision points with clarity and style. Designed for easy customization and fully compatible with PowerPoint, Keynote, and Google Slides.


6 slides
Employee Feedback Survey Results Presentation
Showcase Employee Feedback Survey Results with a data-driven and professional layout designed for clear visualization and analysis. This PowerPoint, Keynote, and Google Slides-compatible template features stacked bar charts for easy trend comparison, helping you present workplace insights effectively. Fully customizable with editable text, colors, and labels, this template ensures a seamless and engaging presentation of employee feedback metrics.


22 slides
Verseon Full-Service Agency Project Plan Presentation
Deliver your agency’s strategy with this modern and professional presentation template. Covering key sections such as services, case studies, market analysis, strategy development, and future outlook, it’s designed for seamless customization. Fully editable and compatible with PowerPoint, Keynote, and Google Slides.


4 slides
Project Responsibility Chart
Streamline team coordination with this Project Responsibility Chart. Clearly define who is Responsible, Accountable, Consulted, and Informed across key tasks. Ideal for project managers and team leads ensuring role clarity. Fully editable in PowerPoint, Keynote, and Google Slides.


5 slides
Revenue and Cost Breakdown Presentation
Present your financial insights with clarity using this 4-point revenue and cost analysis layout. Ideal for summarizing earnings, expenses, or budget comparisons. The circular icon design keeps information clean and engaging. Fully customizable in Canva, PowerPoint, or Google Slides to fit your brand’s data and presentation needs.


21 slides
Delta Marketing Campaign Presentation
This dynamic Marketing Campaign template covers everything from market presence to target audience and financial highlights. With a sleek, professional design, it helps you showcase your brand’s unique selling points and industry recognition. Compatible with PowerPoint, Keynote, and Google Slides for easy, impactful presentations.


4 slides
Business Report Conclusion Slide Presentation
Summarize findings with impact using the Business Report Conclusion Slide Presentation. This template provides a structured, four-step layout that helps you clearly present key takeaways, data highlights, or action points. Clean design with icon integration makes it easy to follow. Fully editable and compatible with PowerPoint, Keynote, and Google Slides.


20 slides
Unity New Product Proposal Presentation
Unveil your product strategy with this modern, comprehensive template! Highlight your company overview, product features, and unique selling proposition. Perfect for presenting market analysis, pricing strategy, and technical specifications. Ideal for product managers and developers. Compatible with PowerPoint, Keynote, and Google Slides.


22 slides
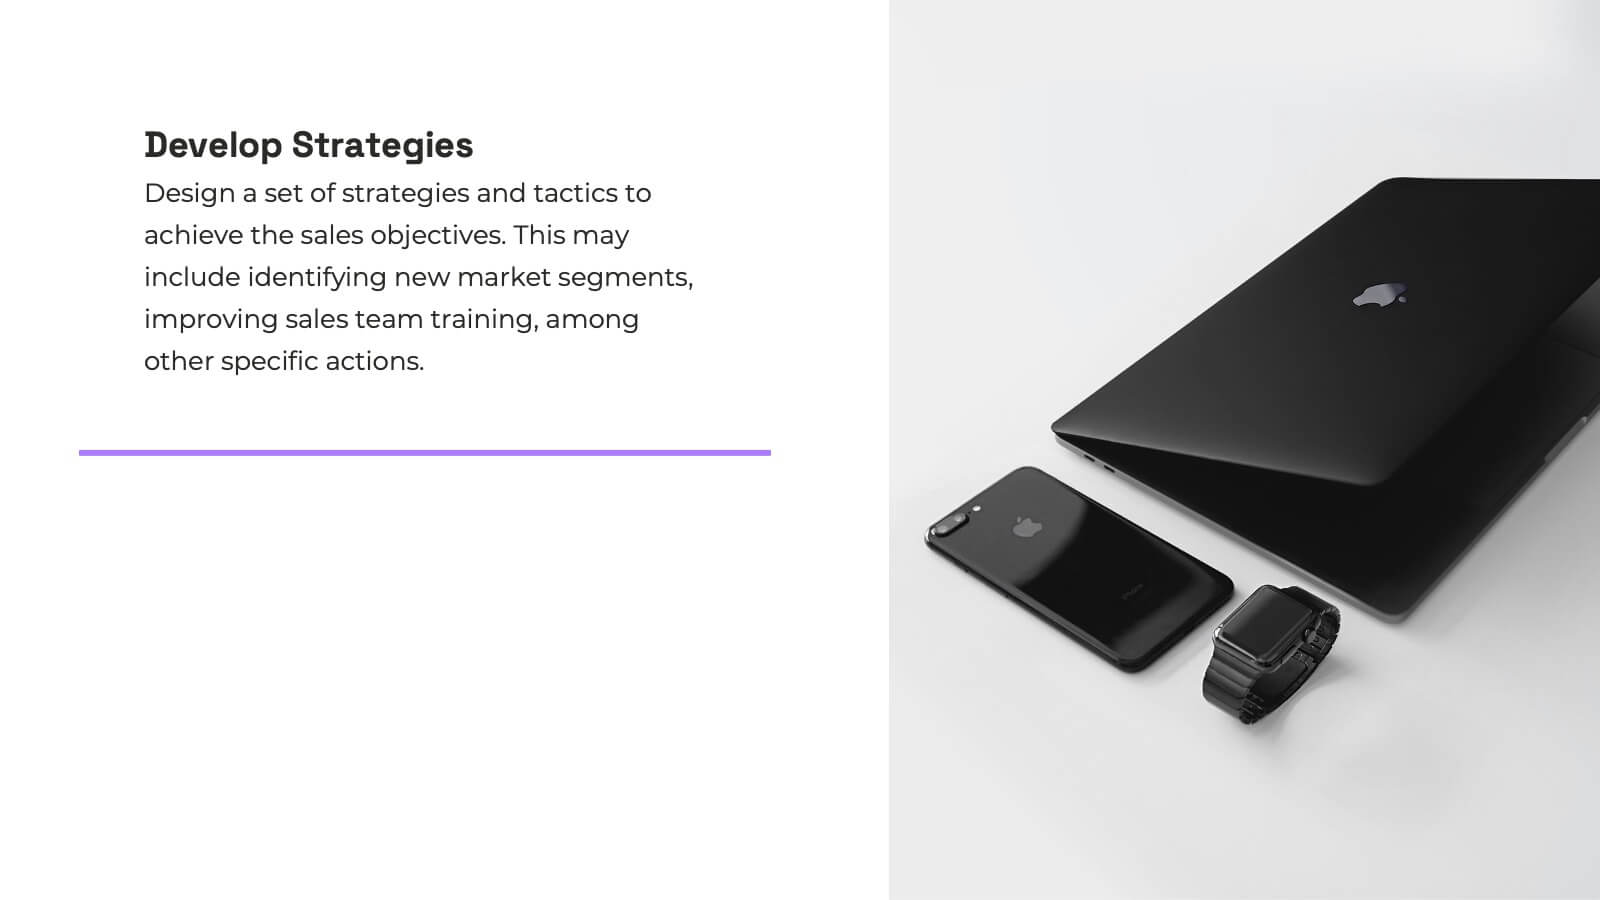
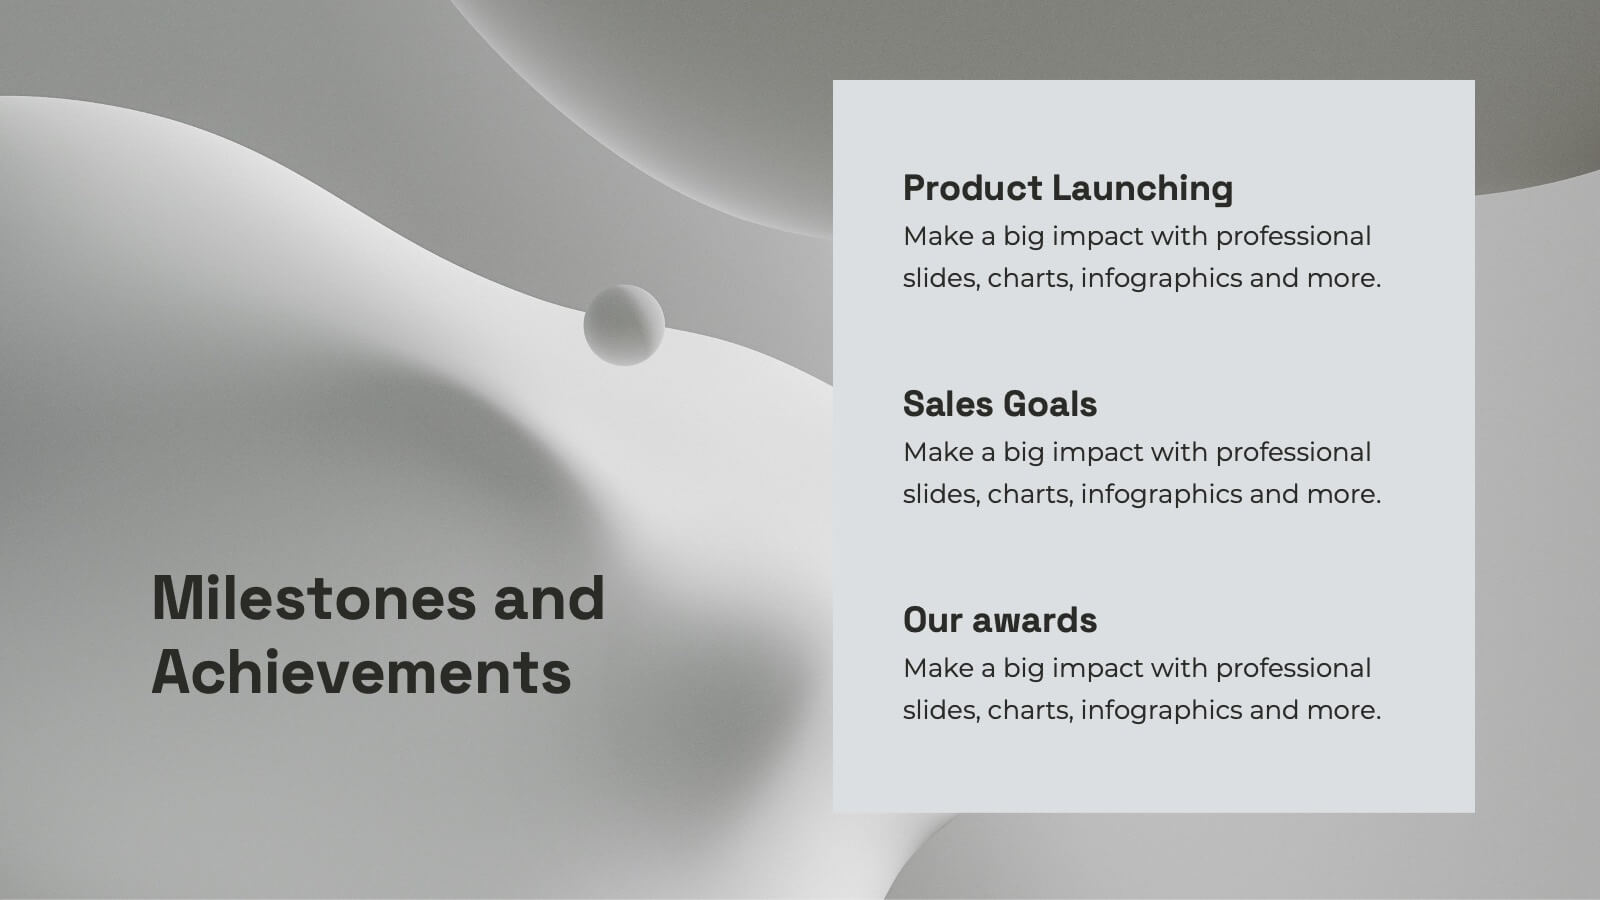
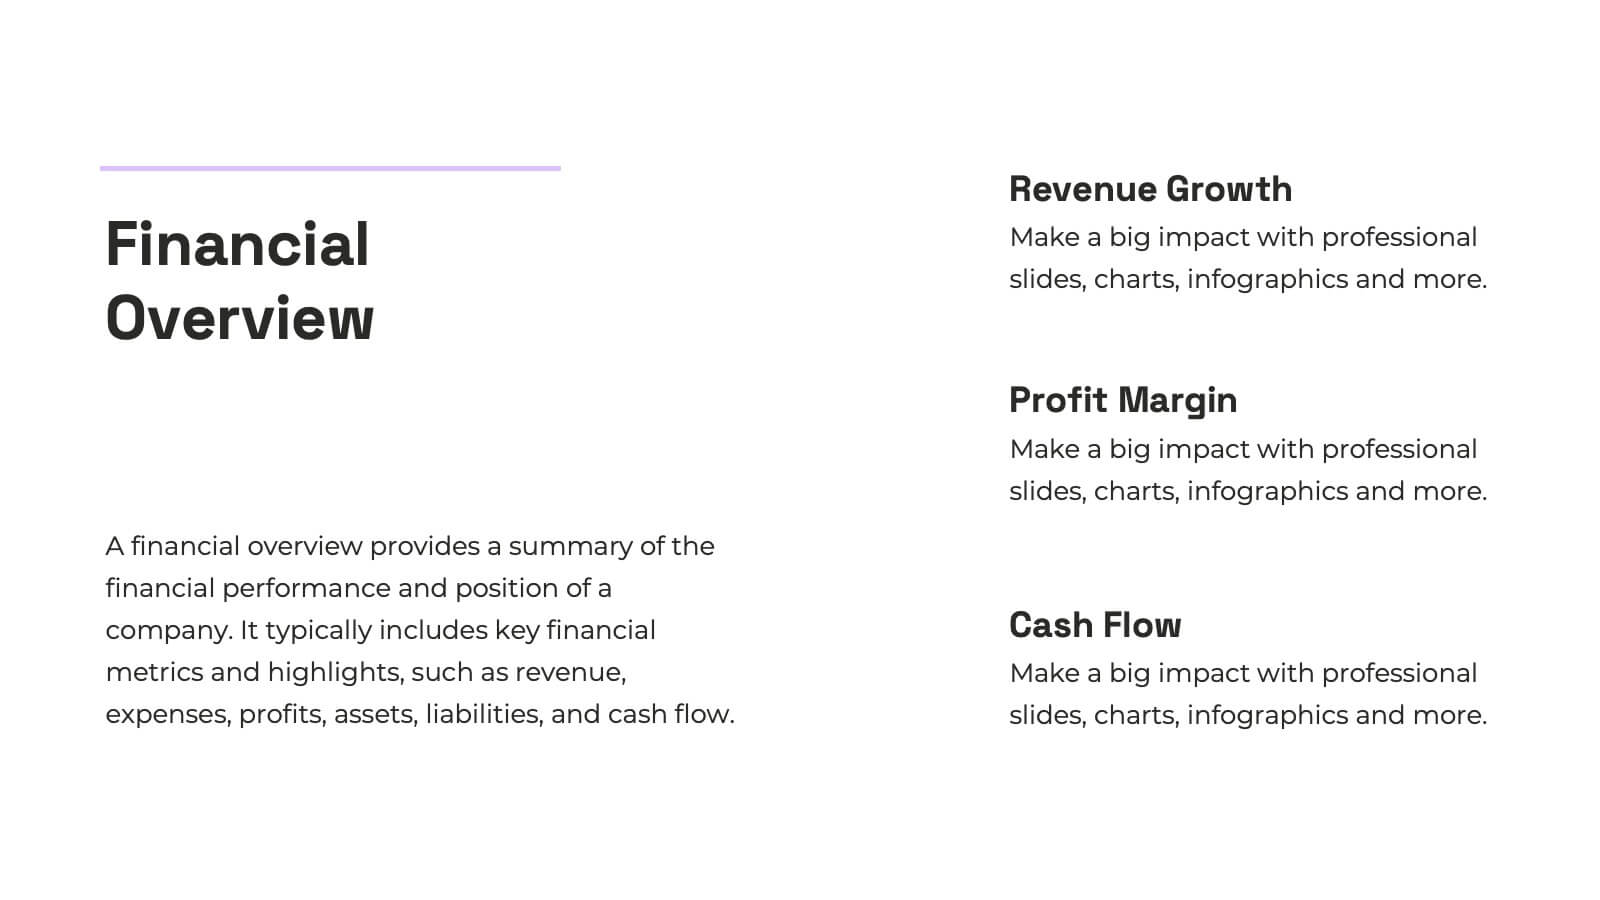
Nexus Startup Growth Plan Presentation
Jumpstart your business journey with this dynamic presentation template! Ideal for outlining your startup growth plan, it covers mission, vision, market analysis, and financial projections with sleek, professional slides. Capture investor interest and articulate your strategy effortlessly. Compatible with PowerPoint, Keynote, and Google Slides, ensuring seamless presentation across all platforms.


7 slides
Numbers Infographic Presentation Template
This Numbers Infographic Presentation is a great resource for business and education. Designed to give you a quick and easy way to educate in an infographic presentation to use as an overview, or specific product description of what you are selling. This template features a smart object to insert text, images and logos which allow for easy customization. Each design is specially made and crafted in the highest quality possible to help bring your message to life in an exciting new way. This template is ideal for conveying statistical information in a visually stunning and engaging way.


26 slides
Summer Sale Presentation
Soak up the bright, sunny vibes of a presentation template that’s perfectly tailor-made for the lively summer season. Its radiant design, infused with the essence of summer sales and tropical aesthetics, is a perfect match for retail campaigns, travel promotions, or any topic that aims to bring the sizzle of summer into a room. Bright colors, playful graphics, and beach-inspired backgrounds set the stage for vibrant storytelling, whether you're introducing a seasonal team, showcasing hot vacation spots, or highlighting the latest summer fashion. The template not only captures the casual, cheerful spirit of the season but also ensures that your content makes a splash with clear, concise data displays and infographics. It’s a breeze to use across various platforms like PowerPoint, Keynote, and Google Slides, ensuring your summer message is as refreshing as a cool ocean wave.
5 slides
Performance Progress Tracking Presentation
Monitor performance with precision using this Performance Progress Tracking template. This visually engaging dashboard helps you track progress across multiple stages, from planning to testing. With interactive bar graphs and percentage indicators, you can evaluate real-time performance, identify bottlenecks, and make data-driven decisions. Fully customizable for PowerPoint, Keynote, and Google Slides, ensuring seamless adaptability.


6 slides
Closing Summary and Key Takeaways Presentation
Wrap up your presentation with clarity using the Closing Summary and Key Takeaways Presentation. This slide features a semi-circular segmented layout, ideal for highlighting 3–5 final points, action steps, or reflections. Clean, modern, and easy to customize in PowerPoint, Keynote, Google Slides, or Canva—perfect for impactful conclusions.


7 slides
Common Problem Infographic
These slides offer a professional and clean design approach for presenting common challenges or issues within a project or organizational setting. Each slide is carefully structured to allow clear delineation and analysis of problems, providing a straightforward layout for presenting solutions and discussions. The design palette ranges from minimalistic to dynamic, catering to various presentation needs. Whether you are addressing an internal team, stakeholders, or a broader audience, these templates are adaptable to convey critical problems effectively. You can easily customize these slides to integrate specific details relevant to the issues at hand, making your presentation not only informative but also visually engaging.