


Features
- 4 Unique slides
- Fully editable and easy to edit in Microsoft Powerpoint, Keynote and Google Slides
- 16:9 widescreen layout
- Clean and professional designs
- Export to JPG, PDF or send by email


Do you have any questions?
Recommend


24 slides
Kepler Investor Pitch Presentation
Impress potential investors with this thoughtfully crafted investor pitch presentation template. Its sleek design is tailored to captivate attention while delivering a clear and concise narrative about your business. Highlight key sections, including your company overview, problem statement, and innovative solutions, all designed to set you apart from the competition. Dive deep into your market opportunities, target audience, and revenue model, using visually engaging layouts and infographics. Showcase growth projections, financial overviews, and funding requirements with clarity and professionalism. Additionally, present your unique selling proposition, milestones, and risk analysis effectively. With dedicated slides for team introductions and a compelling close, this template is perfect for startups and established businesses alike. Fully customizable and compatible with PowerPoint, Google Slides, and Keynote, it ensures seamless branding and adaptability for any presentation. Engage your audience and secure the investment you need!


20 slides
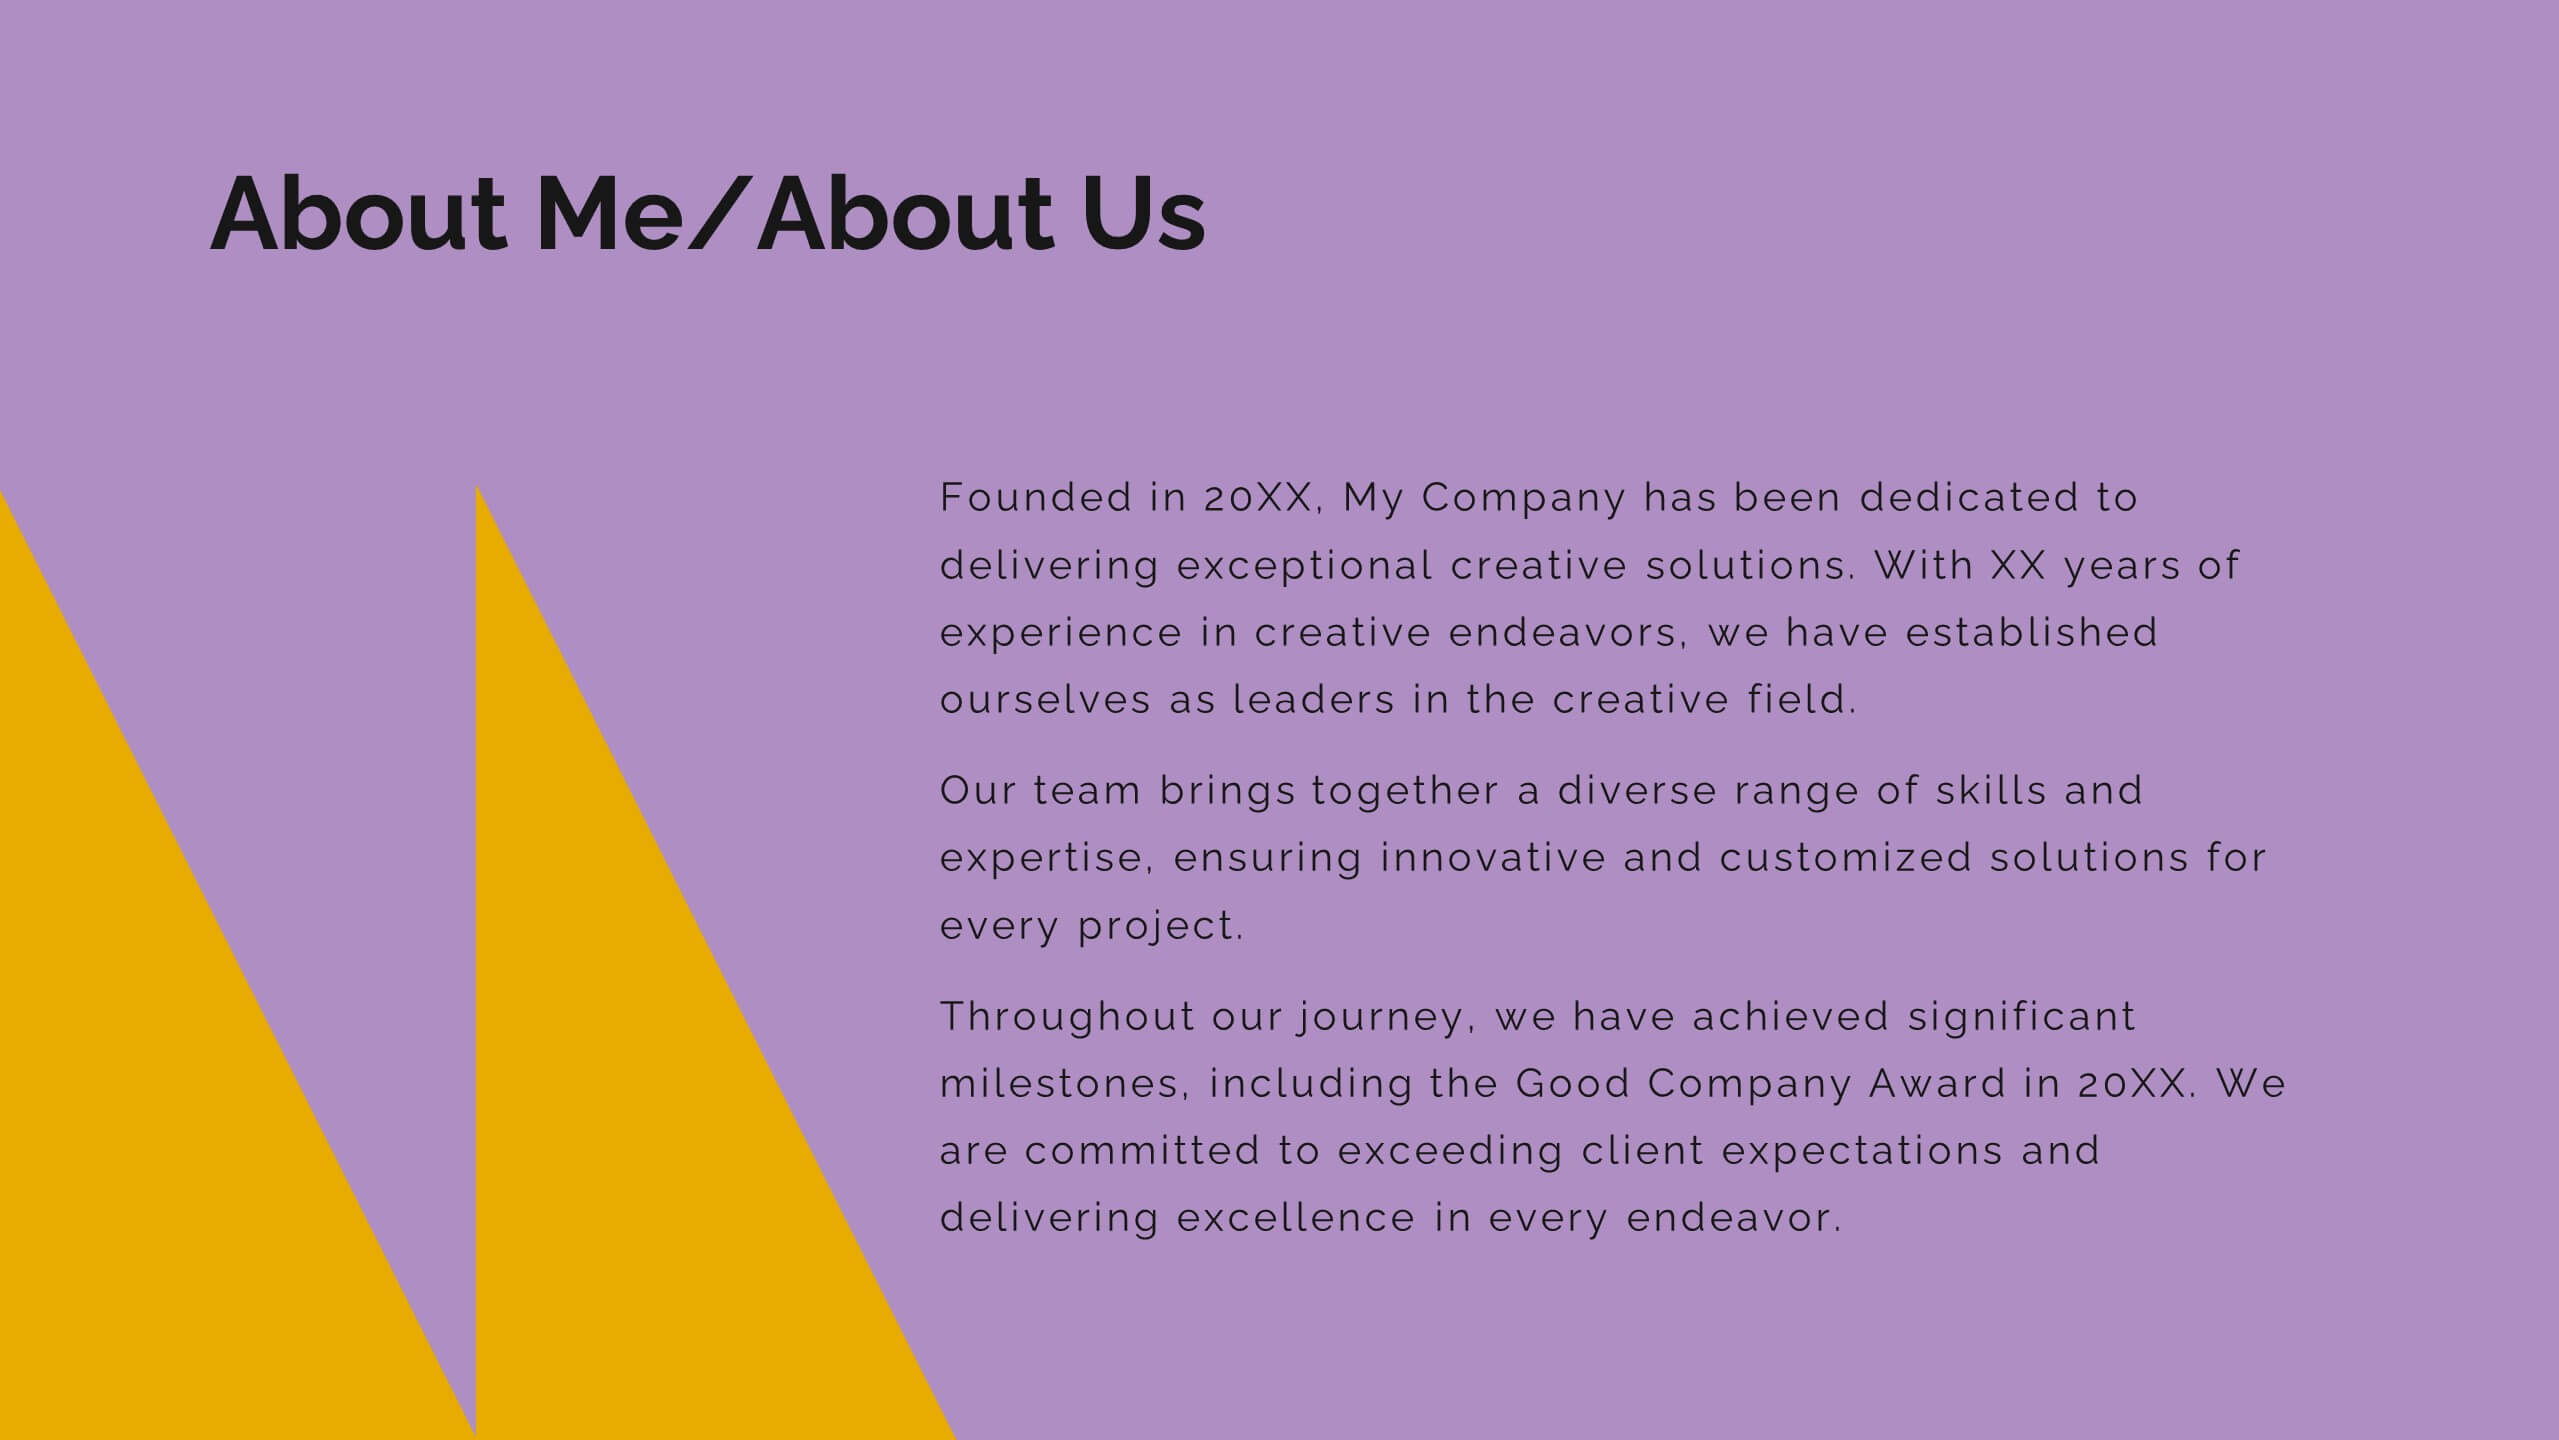
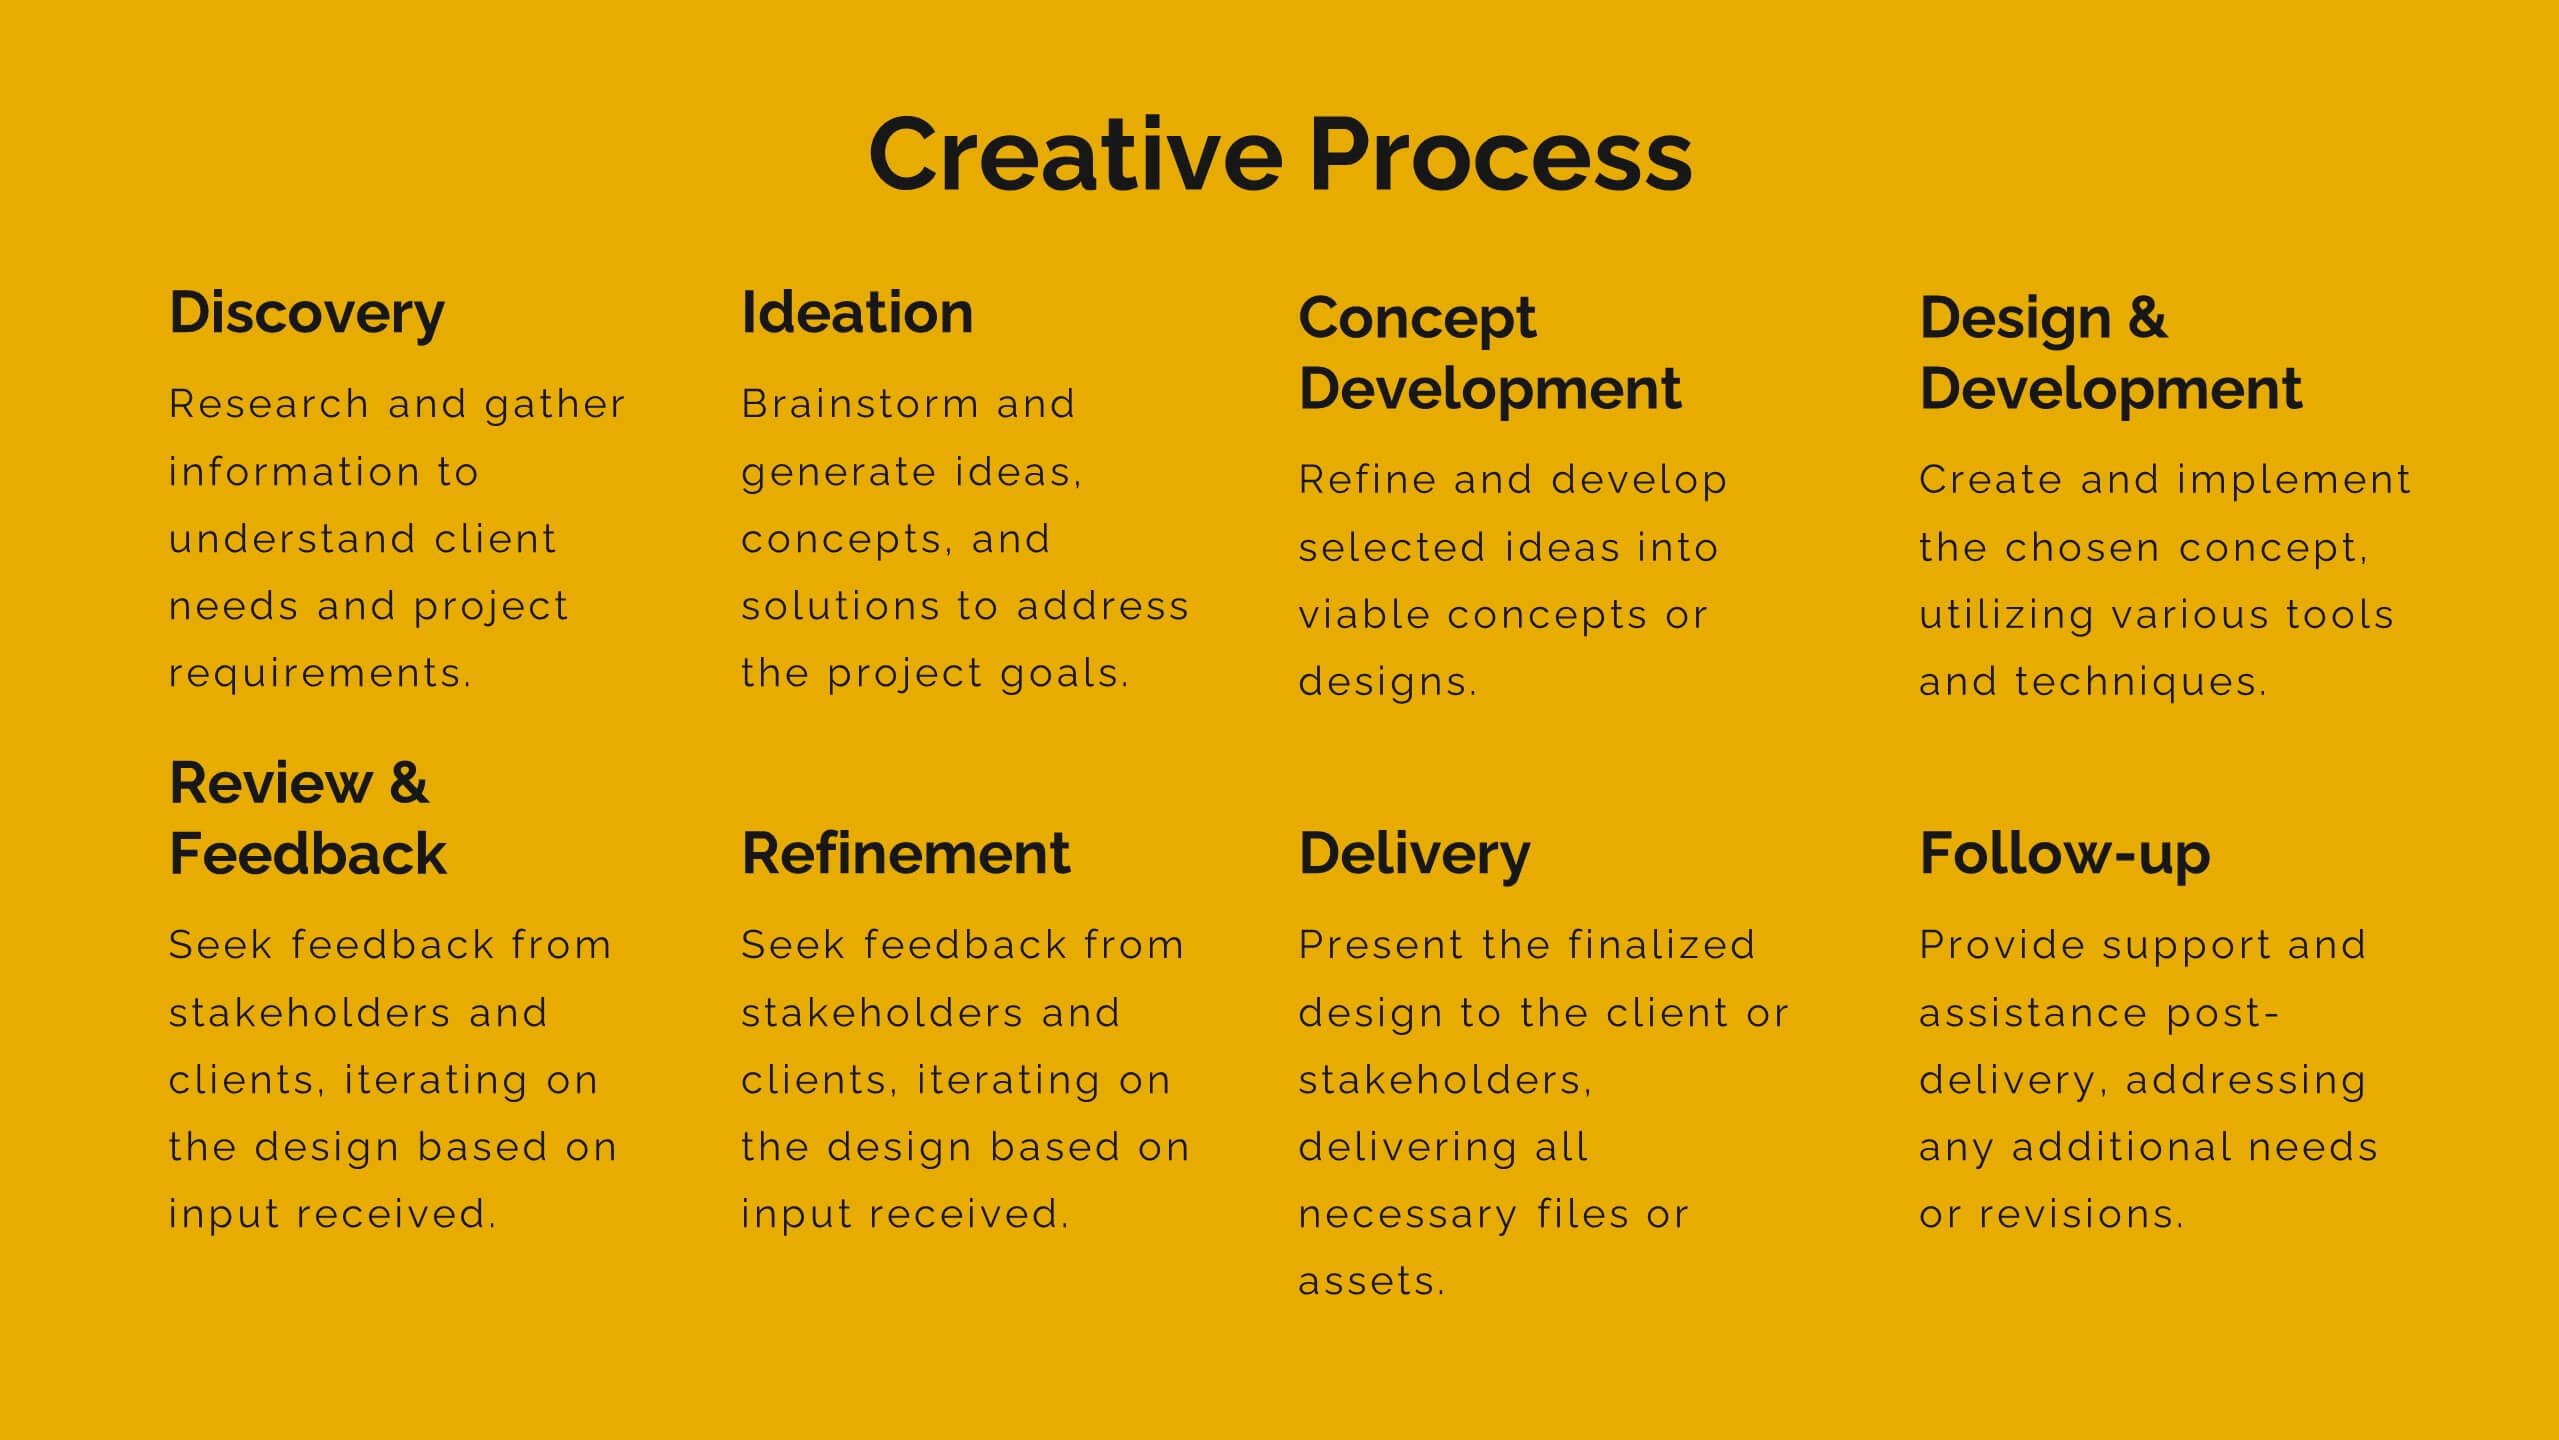
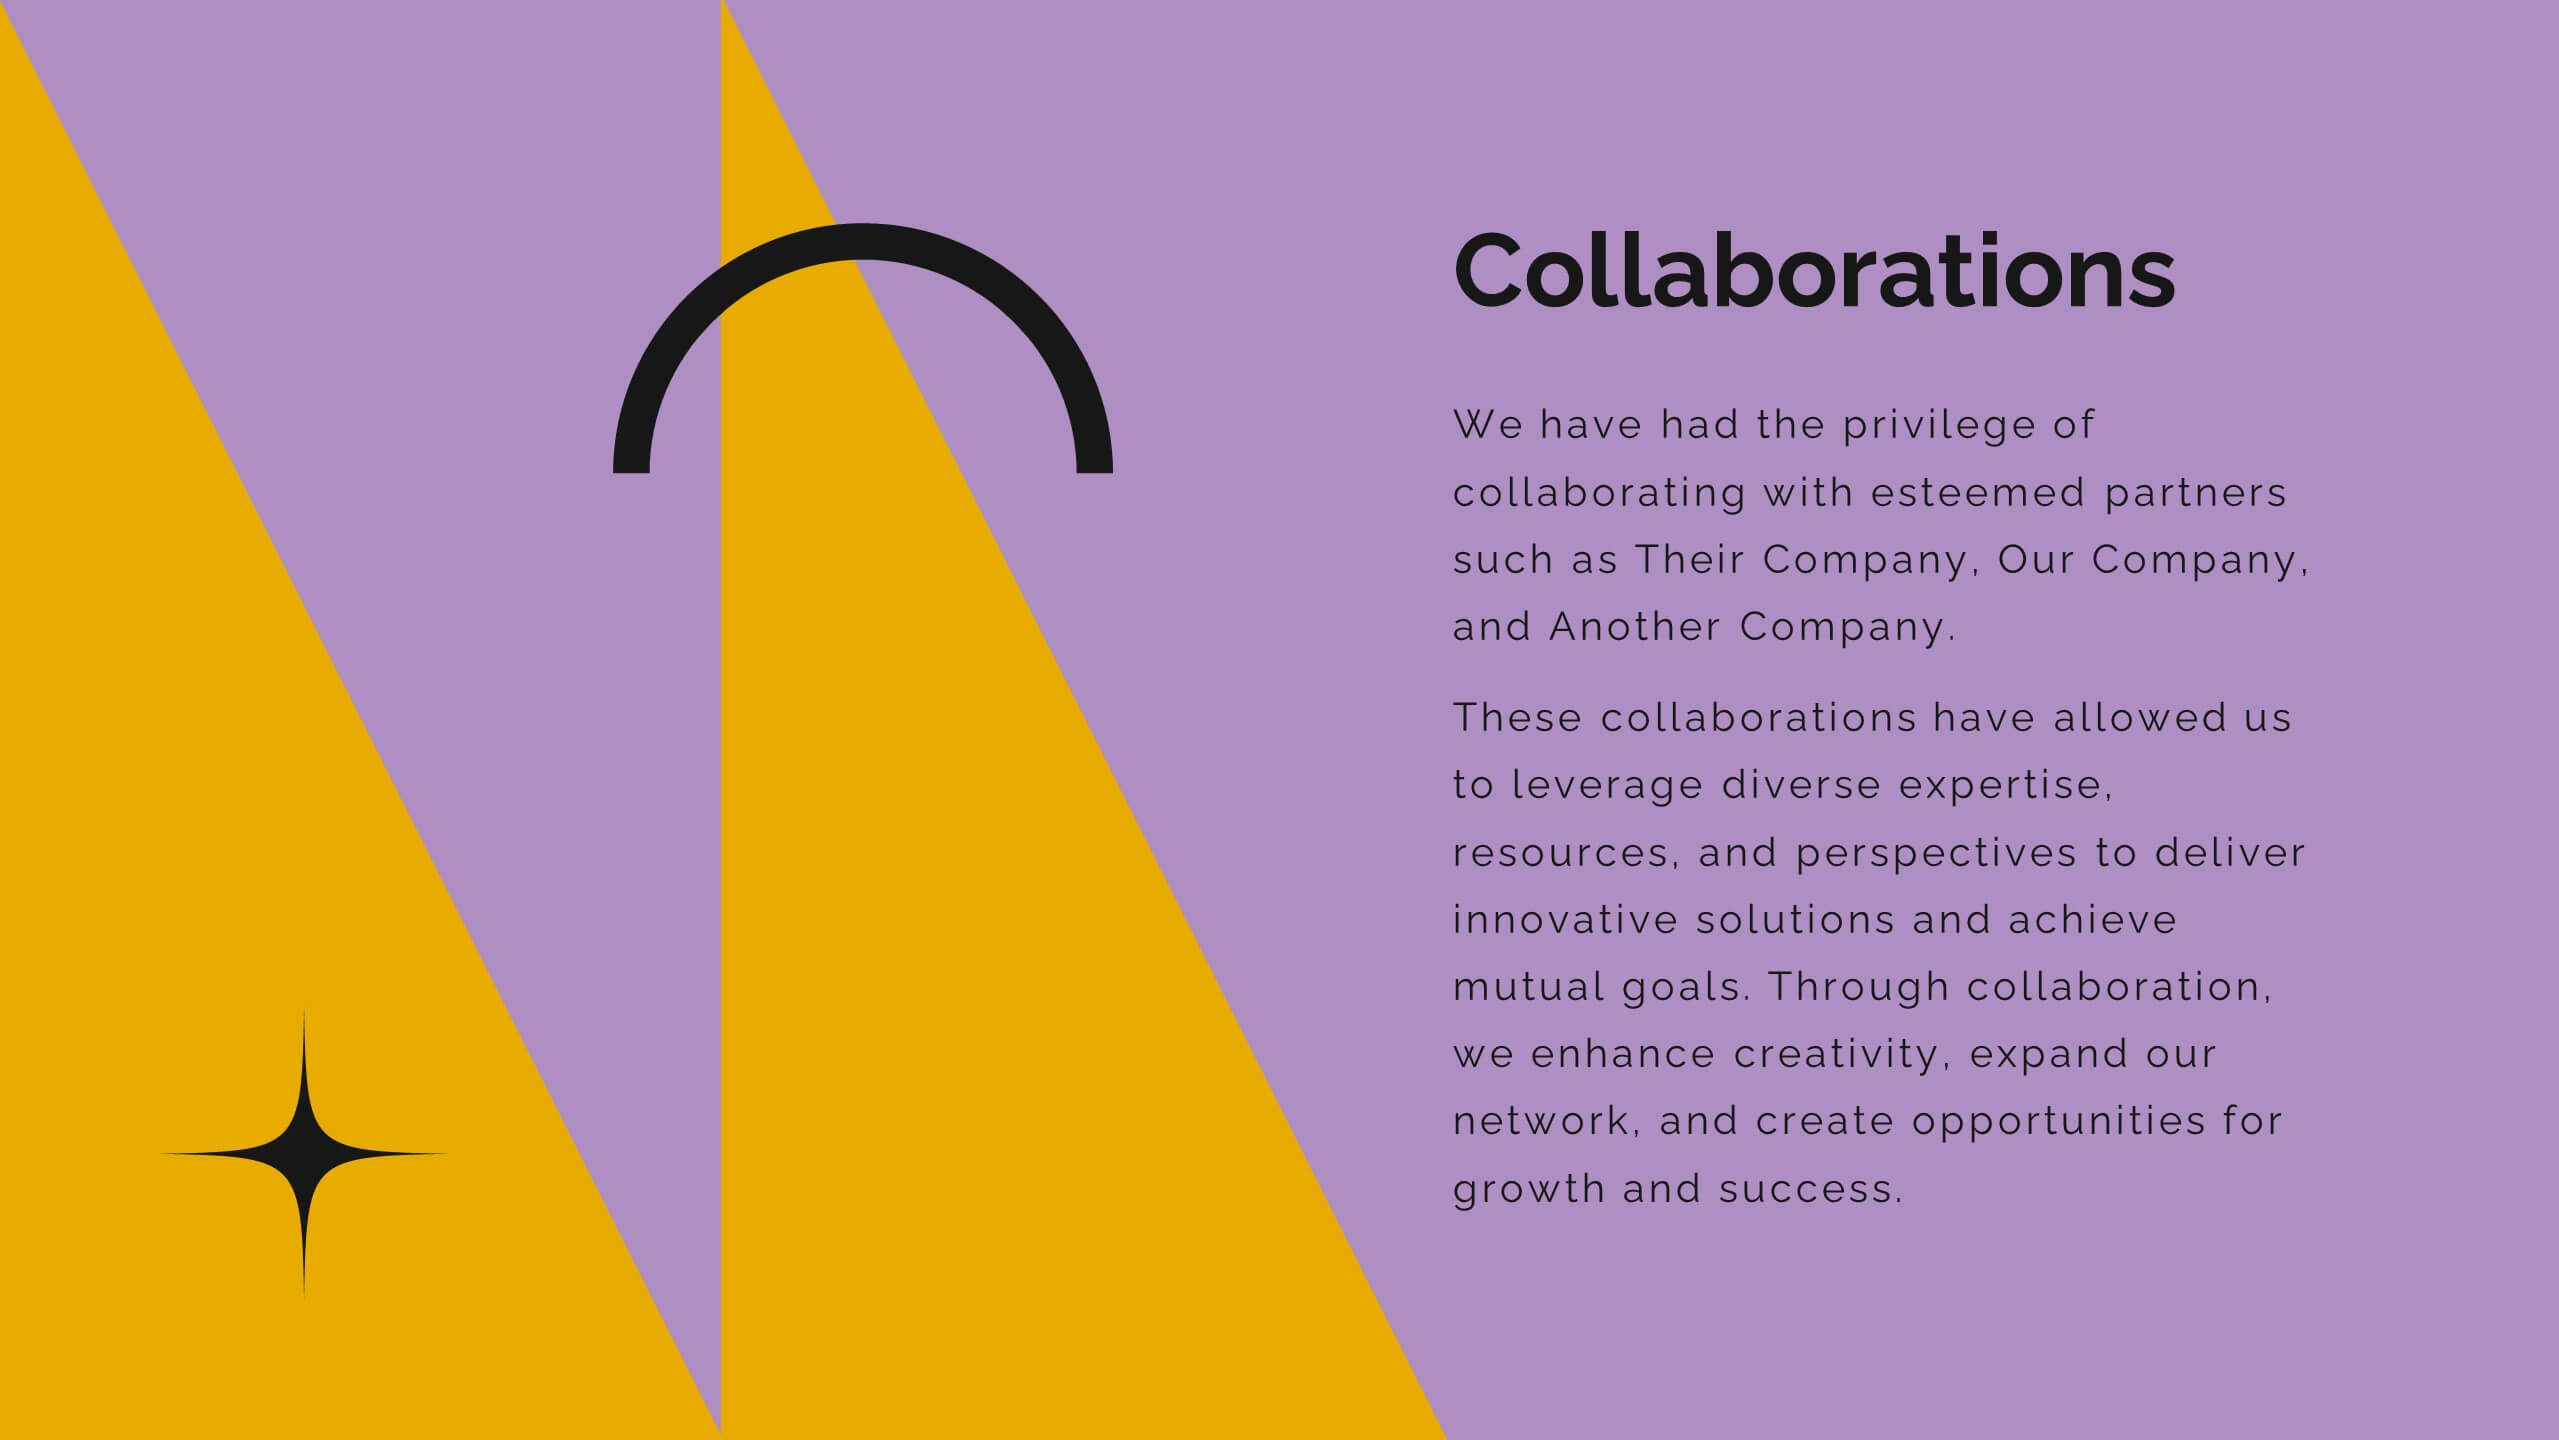
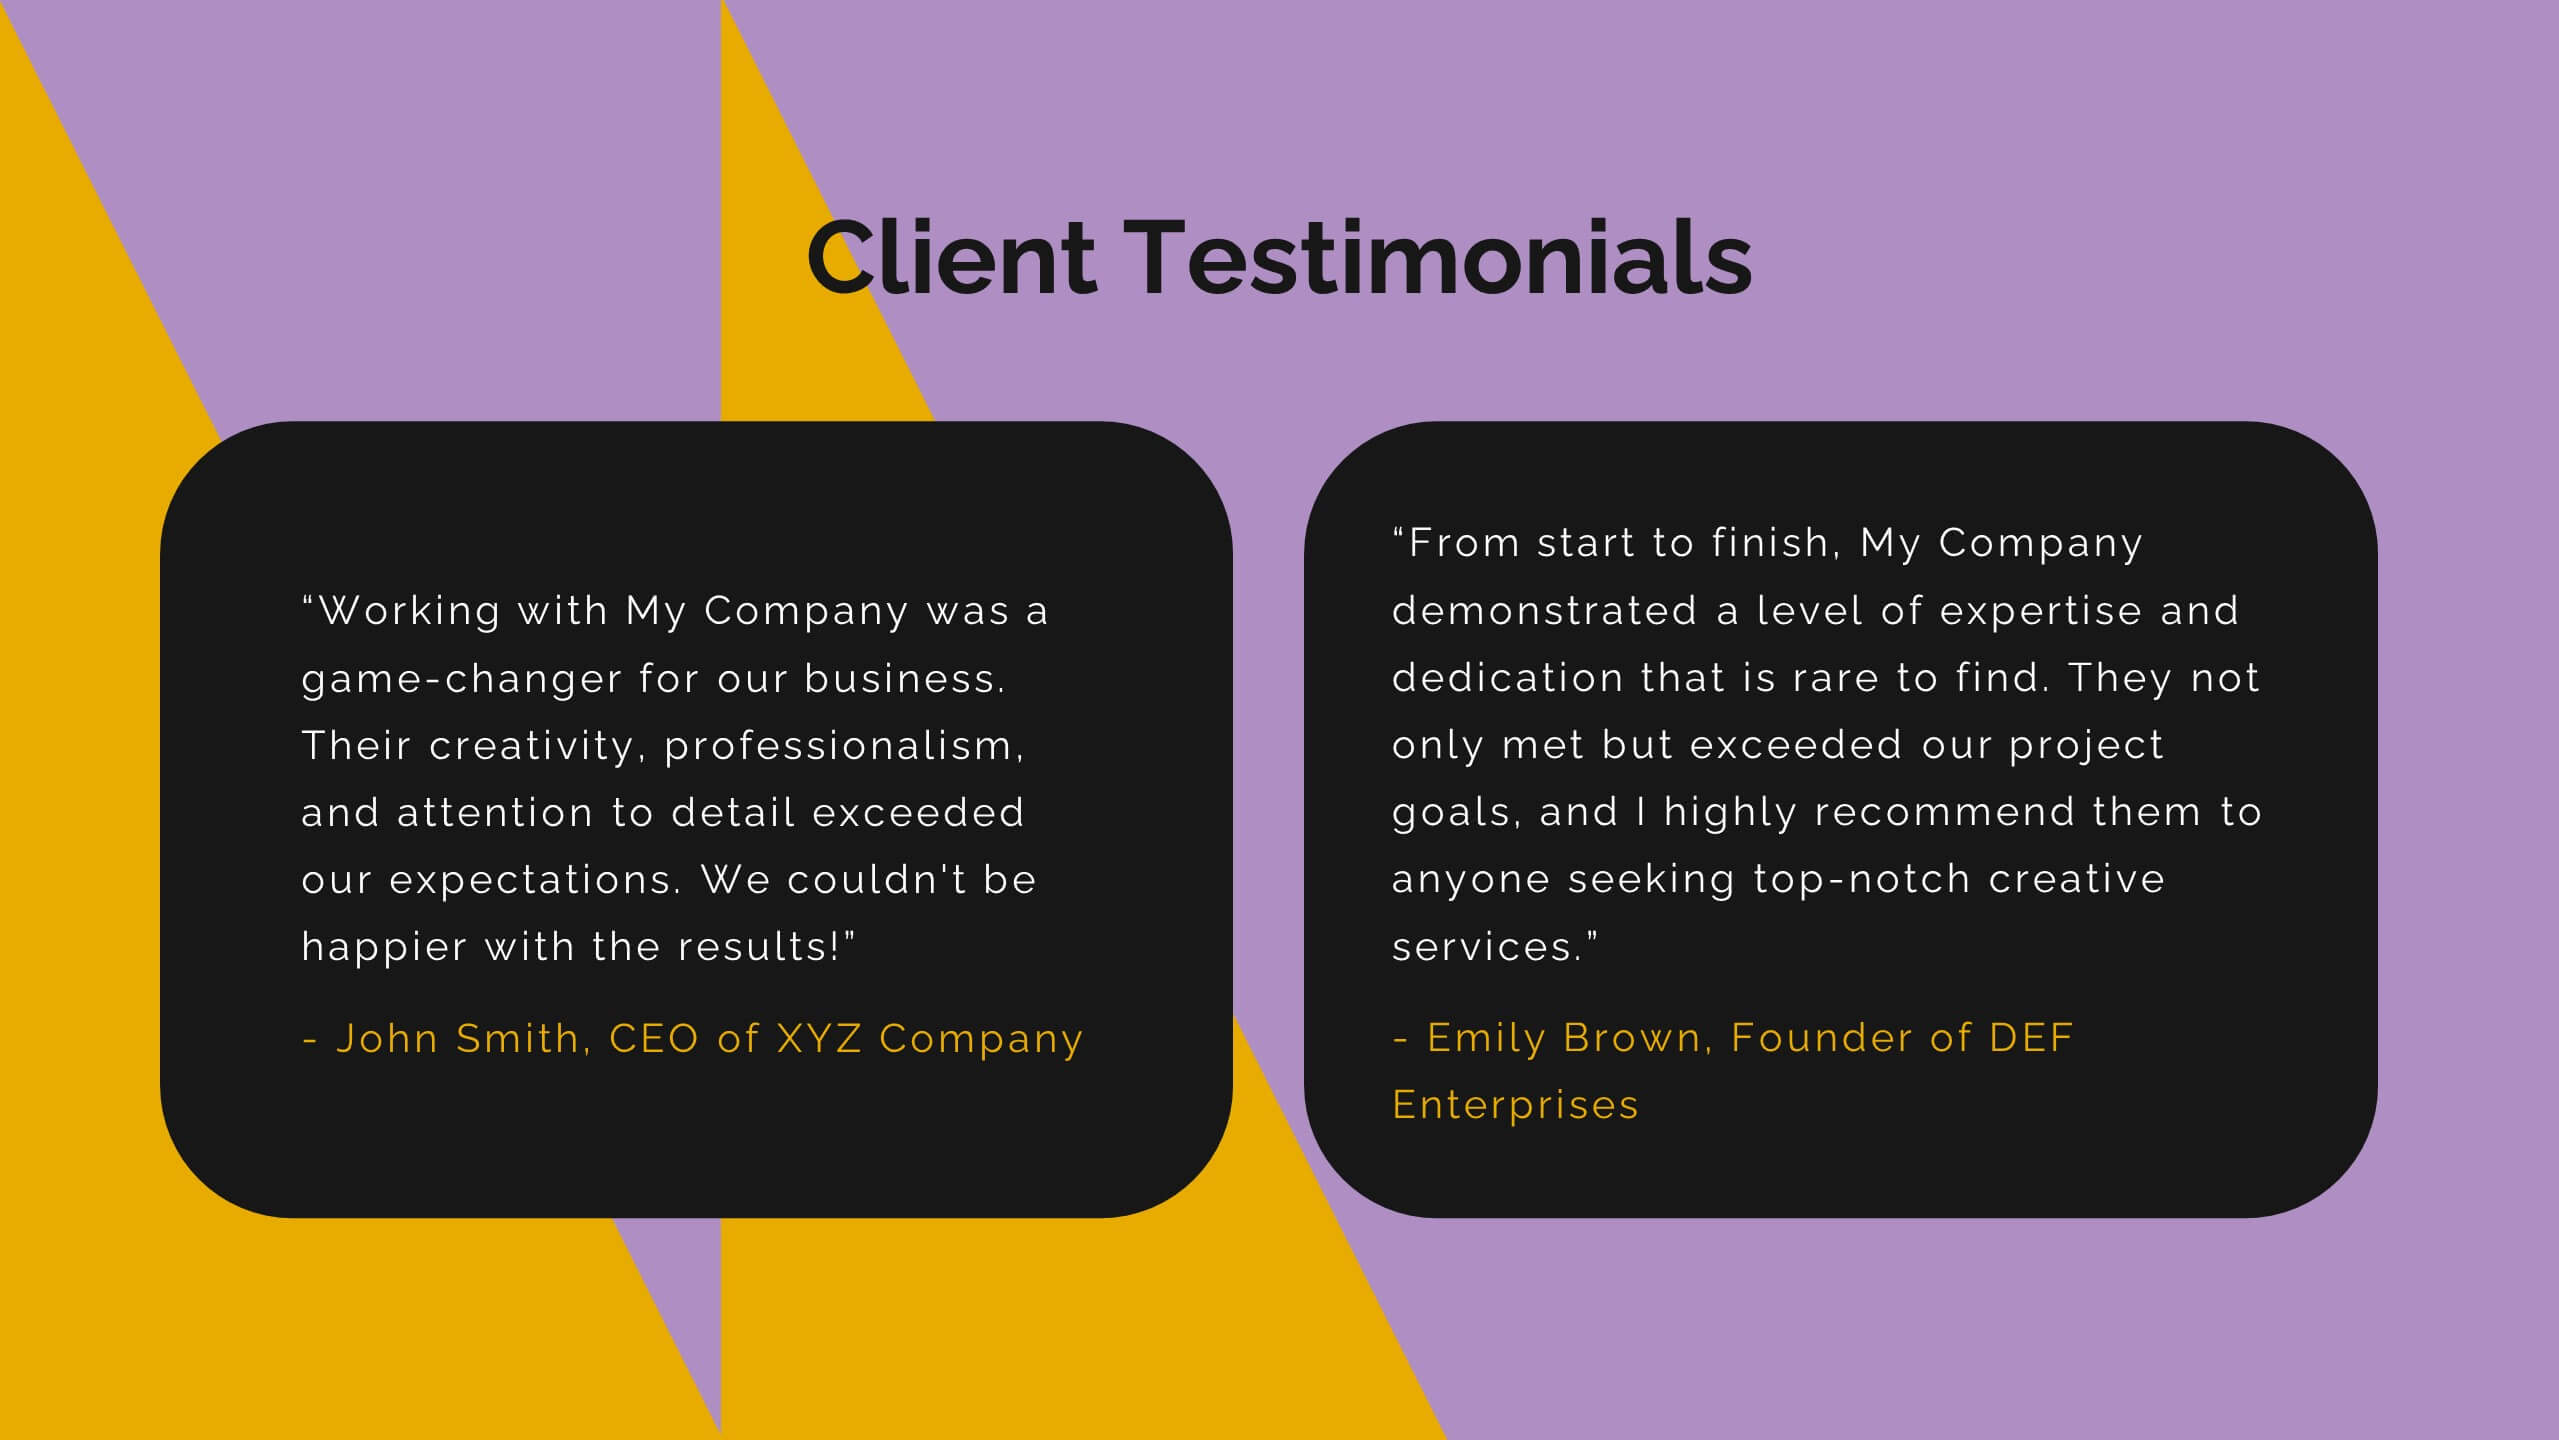
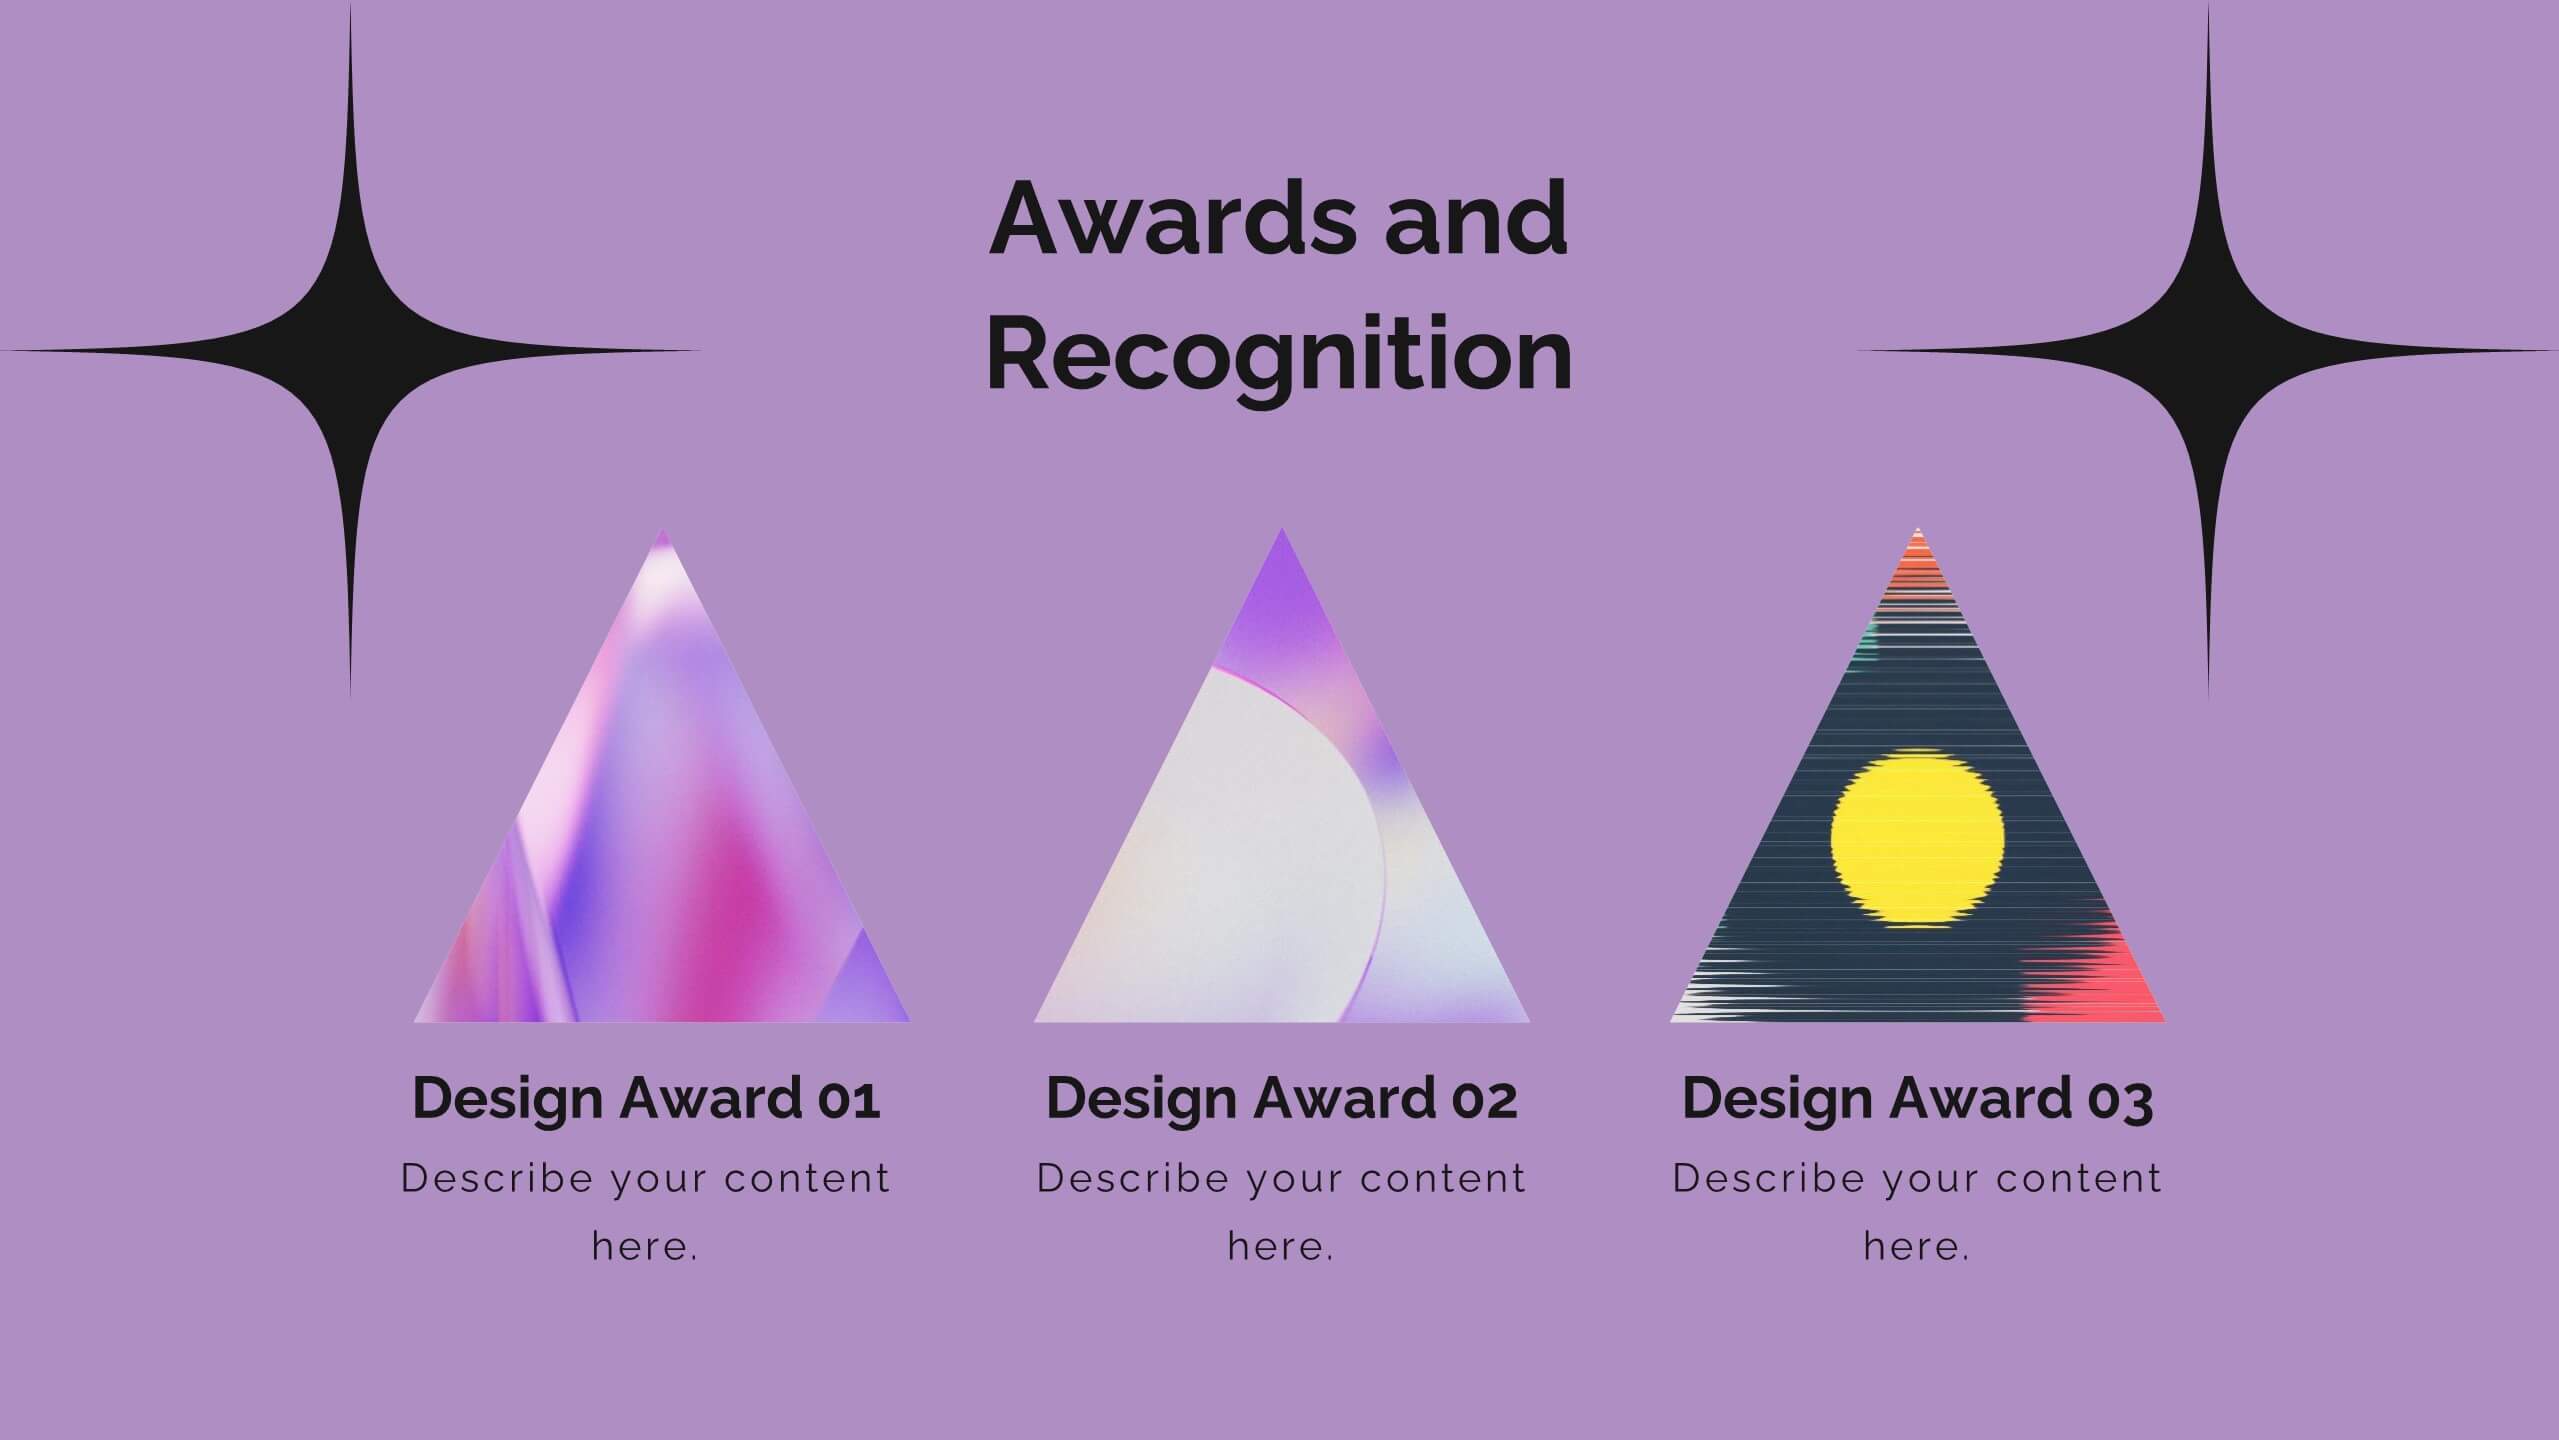
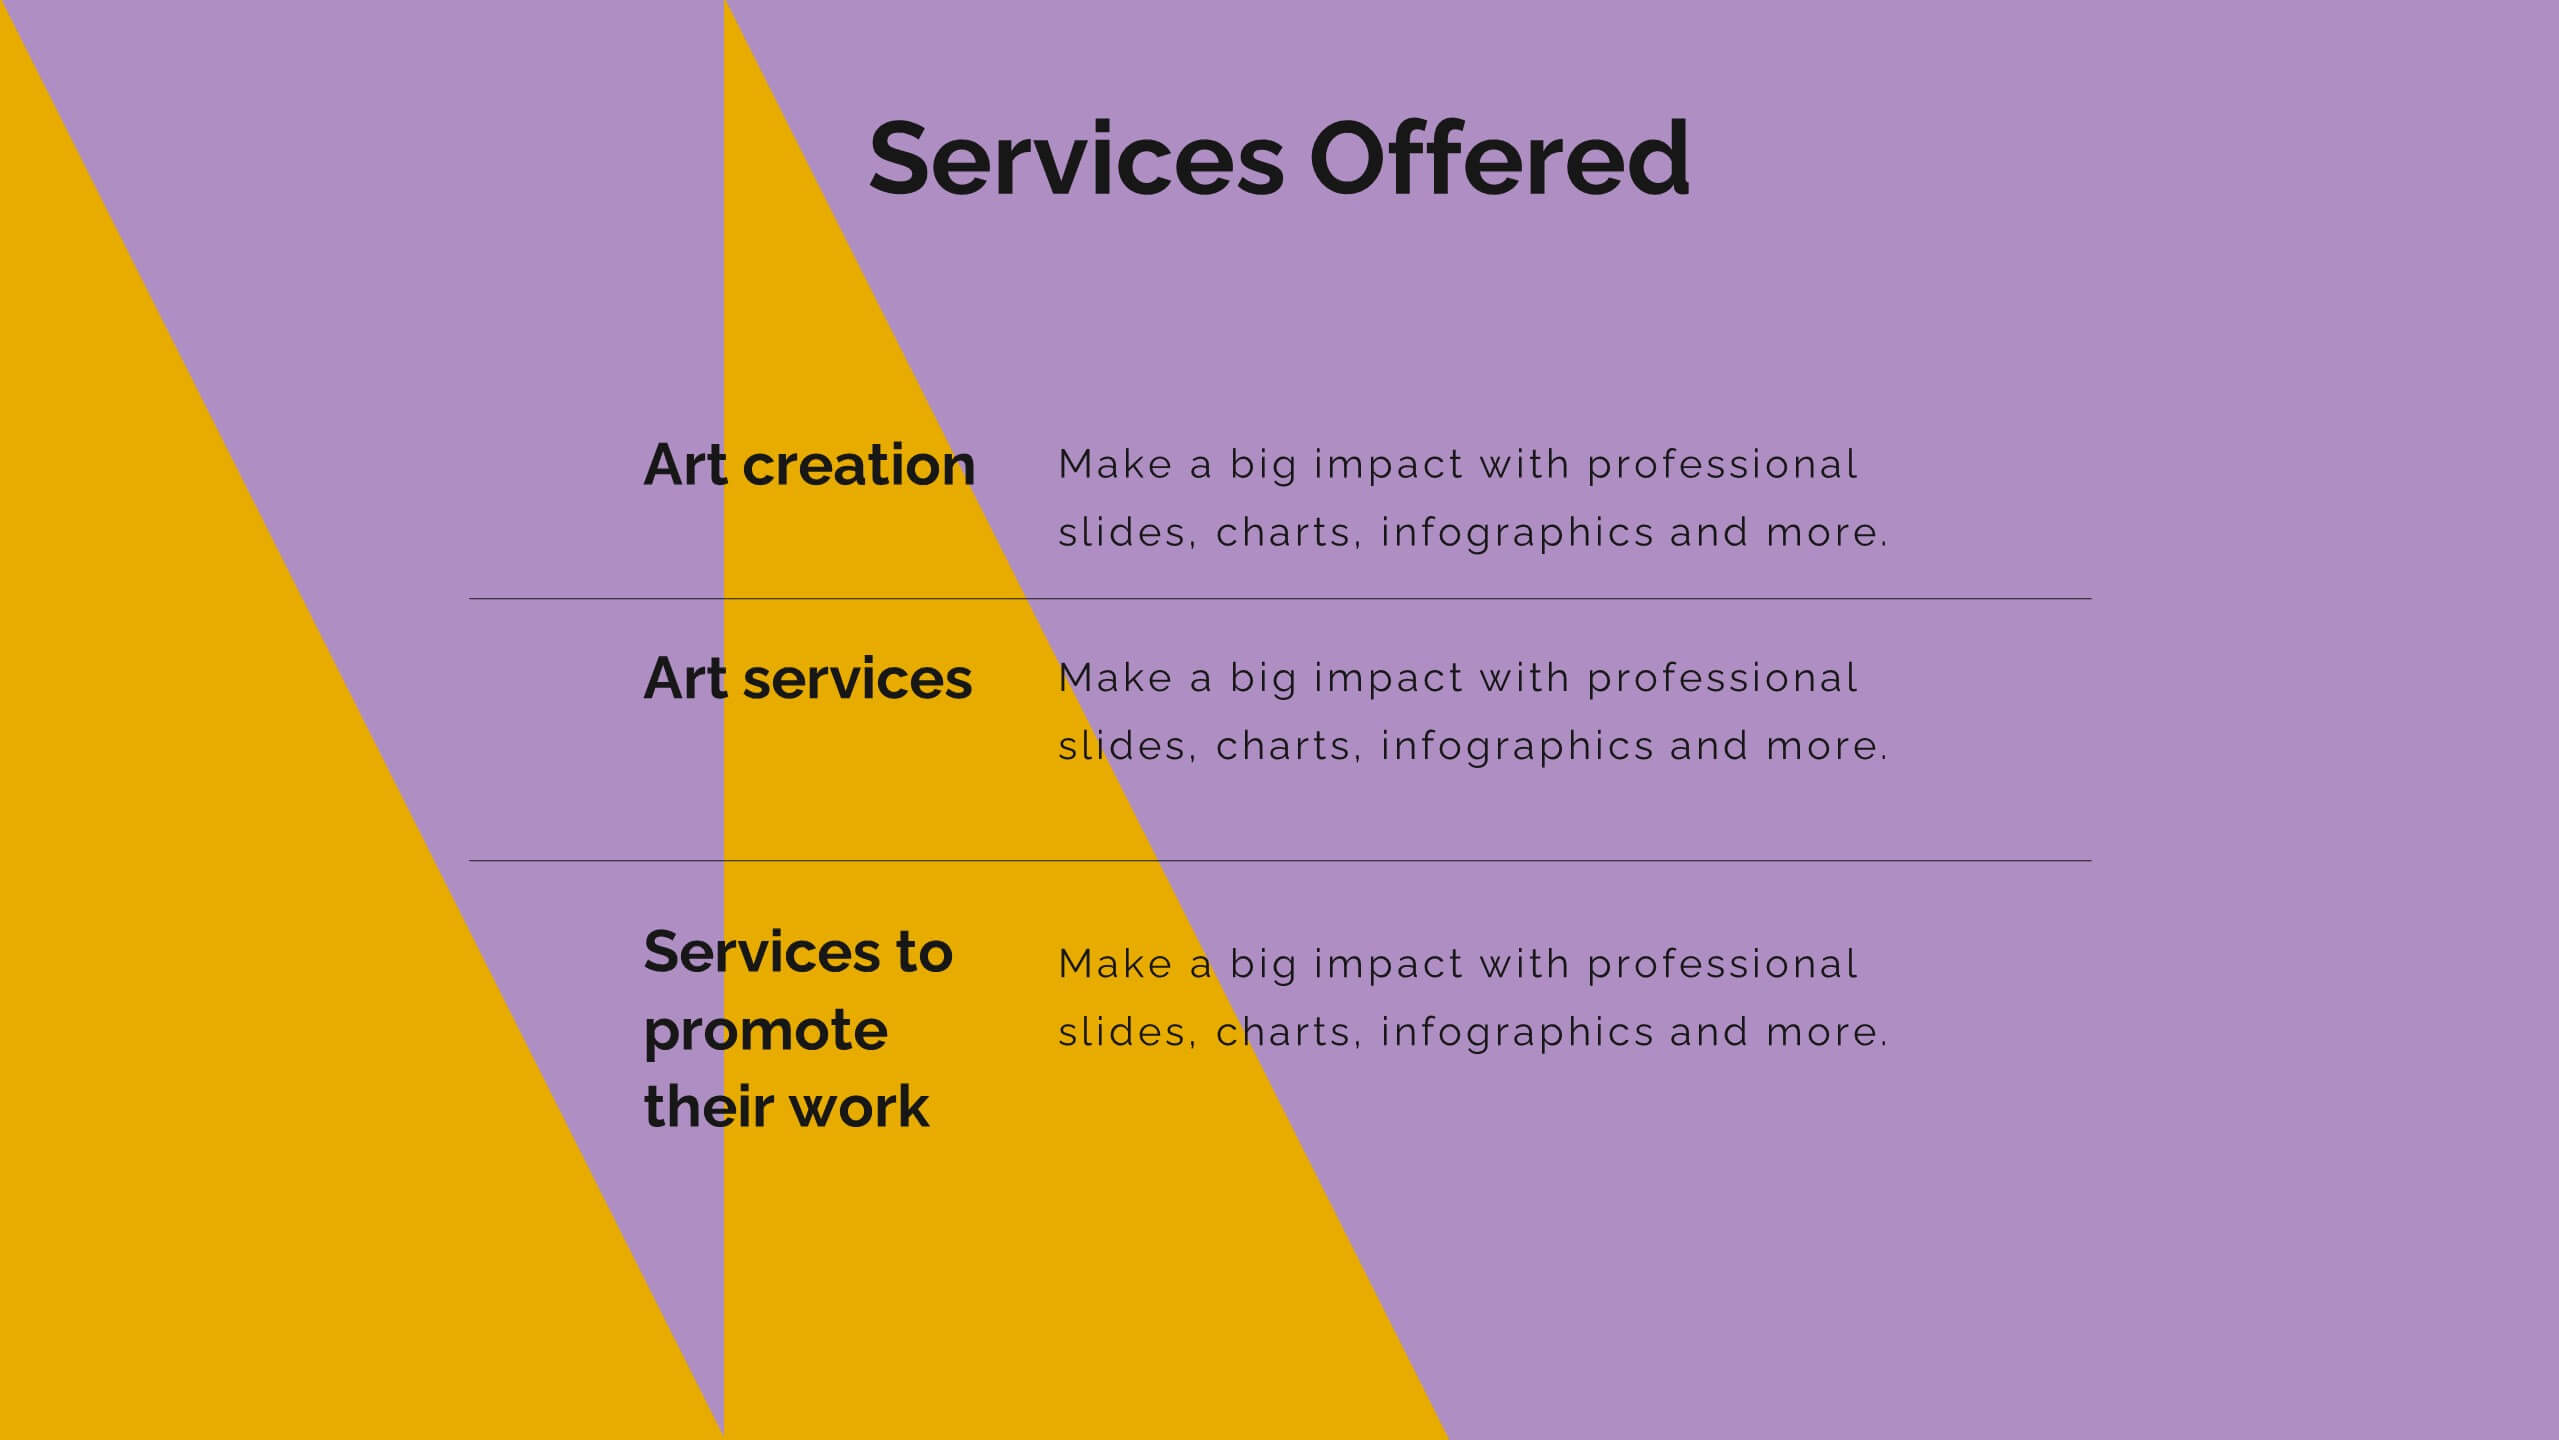
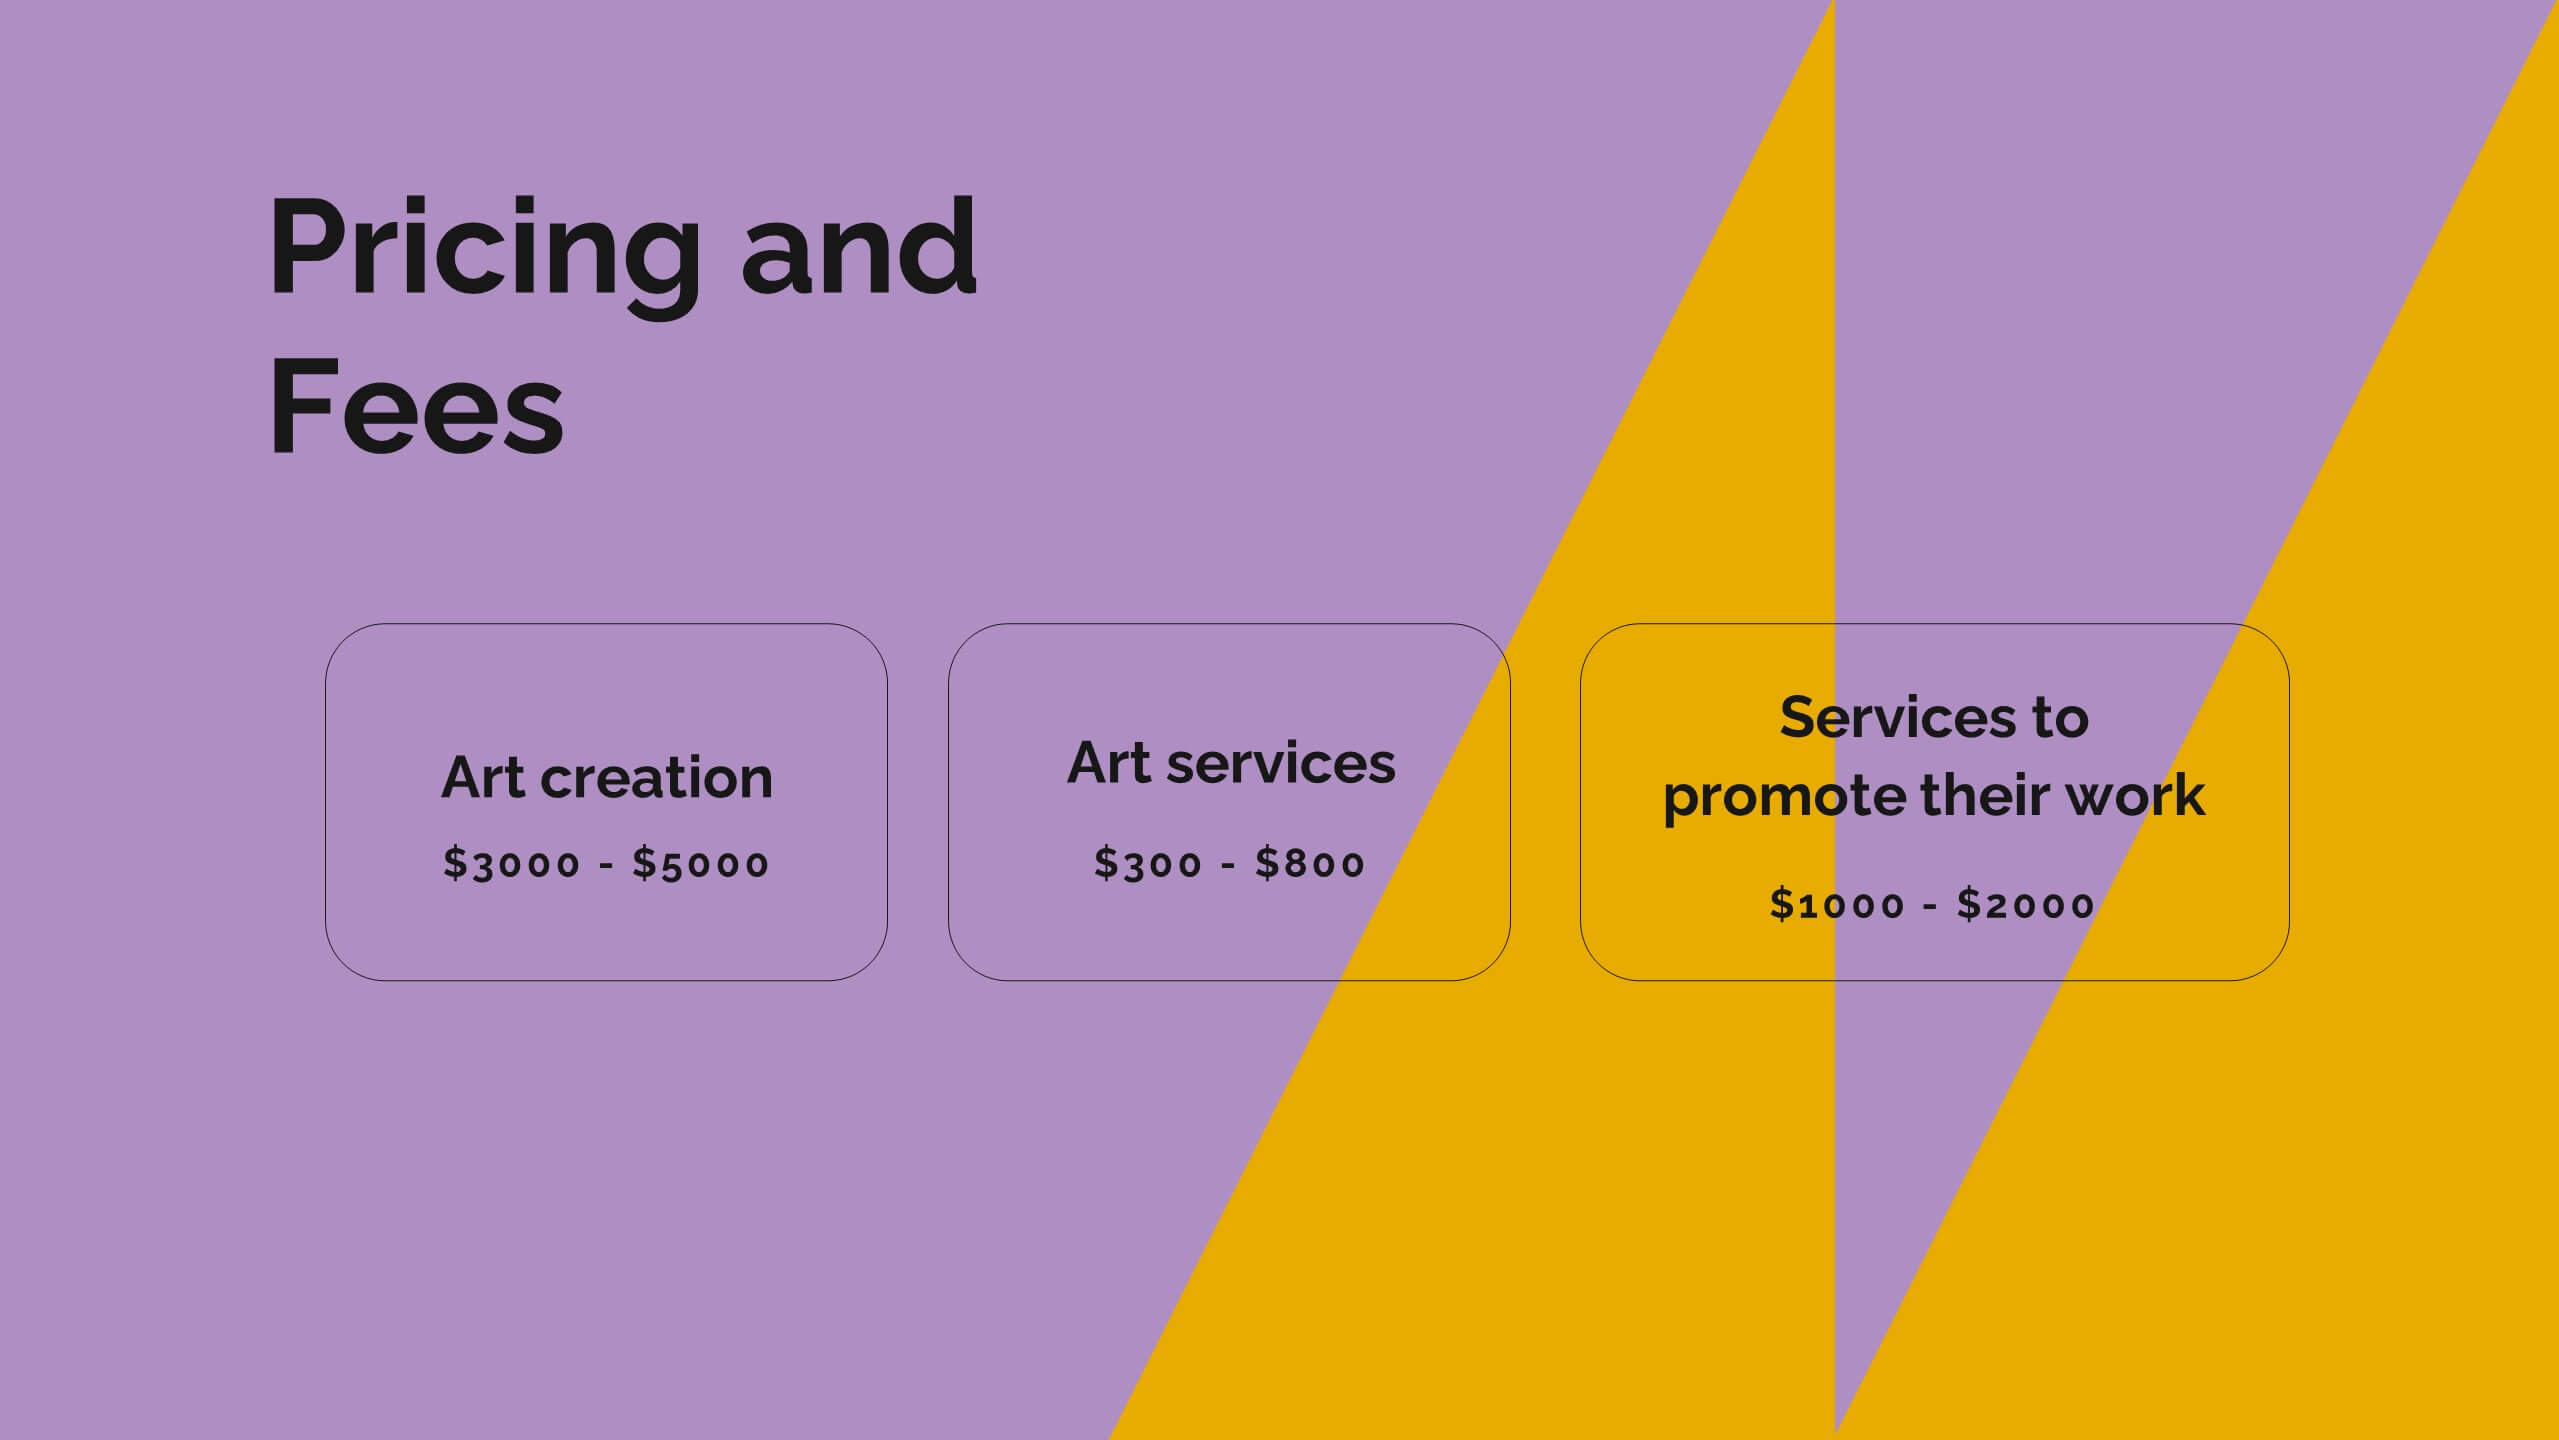
Vortex Artist Portfolio Template Presentation
Showcase your artistic brilliance with this eye-catching portfolio presentation template! Perfect for highlighting your projects, creative process, and awards, it features vibrant slides for your philosophy, collaborations, and client testimonials. Impress potential clients and collaborators with a stunning, well-organized portfolio. Compatible with PowerPoint, Keynote, and Google Slides for seamless presentations on any platform.


5 slides
Cognitive Psychology Framework Presentation
Unlock insights in the most visual way possible with this bold, brain-powered slide! This presentation template helps simplify complex ideas behind how we think, reason, and remember—perfect for research, education, or team workshops. Fully customizable and compatible with PowerPoint, Keynote, and Google Slides for seamless editing across platforms.


5 slides
Timeline-Based Year-End Recap Presentation
Summarize milestones with the Timeline-Based Year-End Recap Presentation. This structured, column-based layout allows you to compare achievements across multiple years in a clear, organized format. Each year is color-coded and paired with icons and editable label sections to highlight key points. Ideal for annual reports, strategic reviews, and progress tracking. Fully editable in PowerPoint, Google Slides, and Canva.


6 slides
Framework Diagram Layout Presentation
Bring structure to your ideas with this sleek and modern presentation layout designed for clarity and flow. Perfect for visualizing systems, workflows, and strategic processes, it helps audiences grasp relationships between concepts effortlessly. Fully editable and compatible with PowerPoint, Keynote, and Google Slides for smooth customization and professional results.


5 slides
Scrum Methodology for Product Development Presentation
Visualize each phase of your product development lifecycle using this Scrum methodology diagram. Highlight team roles, sprint cycles, and delivery steps with clear, color-coded sections. Ideal for Agile coaches, product managers, and tech teams. Fully editable in PowerPoint, Keynote, and Google Slides to align with your project planning needs.


6 slides
Innovation Ideas Infographics
Energize your presentations with our Innovation Ideas infographic, designed for full compatibility with Powerpoint, Keynote, and Google Slides. This vibrant and insightful infographic is the perfect addition for innovators, entrepreneurs, and educators looking to foster a culture of creativity and ideation. The infographic provides a visual exploration of the innovation process, from ideation to execution. It highlights key concepts and strategies that stimulate creative thinking and drive innovation within teams and organizations. With a focus on collaborative brainstorming and the incubation of ideas, it serves as a guide to developing groundbreaking concepts. Incorporating this infographic into your slides will help you effectively communicate the dynamics of successful innovation strategies. It’s ideal for workshops, team meetings, and academic courses that cover topics such as design thinking, innovation management, and product development. Use it to inspire your audience and to illustrate a roadmap for transforming ideas into tangible innovations.


6 slides
School Goals and Administration Presentation
Visualize key academic priorities with this notebook-style layout, perfect for school administrators and teachers. Featuring colorful pushpin markers and a two-page spread, this template is great for outlining goals, responsibilities, or class guidelines. Fully editable in PowerPoint, Keynote, and Google Slides for customized, classroom-ready presentations.


26 slides
Digital Agency Pink Themed Company Profile
A fashion digital agency is a specialized agency that provides a range of digital marketing, advertising, and branding services tailored to the fashion industry. This template focuses on helping you leverage your digital platforms and technologies to enhance brand visibility, engage target audiences, drive sales, and create a strong online presence for your fashion brand. Fully customizable and compatible with Powerpoint, Keynote, and Google Slides. The elegant shades of pink reflect the fashion-forward and creative nature of your agency. Use this presentation template to showcase your best work, fashion trends, and styles.


6 slides
Travel Insurance Infographics
Our "Travel Insurance" infographic template, compatible with PowerPoint, Keynote, and Google Slides, is crafted for insurance companies, travel agencies, and financial advisors. This template is an excellent tool for explaining the benefits and details of travel insurance to clients and customers. The template comprehensively covers vital elements such as coverage options, emergency assistance services, and claim procedures. Its clear and organized layout makes it easy to convey complex insurance information in a manner that is both accessible and engaging. This is particularly useful for presentations aimed at educating travelers about the importance and benefits of travel insurance. Designed with a bright and inviting travel-themed color scheme, the template incorporates elements that reflect global travel and security. This not only makes the presentation visually appealing but also resonates with the theme of travel and protection. Whether used in client consultations, marketing materials, or informational workshops, this template ensures that the key aspects of travel insurance are presented clearly and attractively.


6 slides
Business Revenue and Growth Model Presentation
Visualize your business's revenue trajectory and performance gains with this modern Growth Model presentation template. Designed to showcase incremental success, it features clean bar graphics with space for key milestones and KPIs across five growth stages. Perfect for financial reviews, investor updates, or strategy meetings. Compatible with PowerPoint, Keynote, and Google Slides.


26 slides
Corporate Social Responsibility (CSR) Presentation
Make a difference with our Corporate Social Responsibility (CSR) presentation template, perfect for PowerPoint, Keynote, and Google Slides. This template is designed for leaders and organizations committed to ethical practices, environmental stewardship, and community engagement. Our CSR template empowers you to showcase your company's commitment to social responsibility. It provides a structured format to present your sustainability efforts, ethical initiatives, and community projects. It helps you to communicate the value of CSR to stakeholders and illustrates how responsible business practices contribute to overall success. With customizable visuals, you can highlight your CSR achievements and goals, fostering transparency and trust. This template is SEO-optimized, ensuring that your message of commitment to social responsibility reaches a broad audience. Use this template to promote your CSR strategy and demonstrate how your organization is playing a pivotal role in building a sustainable and equitable future.


7 slides
Company Mission Infographic
The templates presented are tailored to elucidate the company's mission, blending aesthetic appeal with functional design to communicate core values and strategic objectives effectively. These slides are ideal for businesses looking to articulate their mission clearly and compellingly, ensuring alignment across all levels of the organization. Each slide in the collection is designed with precision, incorporating elements that highlight key aspects of the company’s ethos without overwhelming the viewer. The use of clean lines, minimalistic design, and coordinated color palettes emphasizes clarity and professionalism, making each slide both engaging and informative. These templates serve multiple purposes; they are perfect for enhancing corporate presentations, annual meetings, and strategic workshops. They help in broadcasting the foundational goals and the mission to new hires, potential investors, and external stakeholders. By presenting the mission in a visually cohesive and structured manner, these slides foster a unified understanding of what the company stands for. Customizable features allow these templates to be adapted to match specific branding requirements, making them a versatile tool in the corporate communication arsenal. They are not just slides but strategic tools that reinforce the company’s identity and commitment to its goals, serving as a cornerstone for building corporate identity and culture.


6 slides
Root Cause Investigation Framework Presentation
Uncover the "why" behind your challenges with the Root Cause Investigation Framework Presentation. Designed around the classic fishbone (Ishikawa) diagram, this slide helps teams visually identify and organize contributing factors across multiple categories. With editable sections and bold color coding, it’s ideal for quality management, Six Sigma, and process improvement. Compatible with PowerPoint, Keynote, and Google Slides.


6 slides
Project Rollout Milestone Timeline Presentation
Visually map out your project phases with the Project Rollout Milestone Timeline Presentation. Featuring a modern cylinder path layout, this slide is perfect for showcasing five key milestones in sequential or strategic order. Ideal for project managers and teams, and fully editable in Canva, PowerPoint, Keynote, and Google Slides.


20 slides
Solar Beam Sales Proposal Presentation
Supercharge your sales presentation with the Solar Beam Sales Proposal template! This vibrant and dynamic template is designed to capture attention and drive home your key points with flair. Start with a bold introduction, then seamlessly guide your audience through your company overview, product/service details, and target market analysis. Highlight your sales objectives, showcase your team, and provide compelling customer testimonials. With dedicated slides for pricing strategies, sales collateral, and performance metrics, you’ll have all the tools you need to make a persuasive pitch. The template also includes sections for discussing future opportunities, action plans, and a Q&A session to address any final questions. Its modern, professional design ensures that your proposal stands out in any setting. Fully customizable and compatible with PowerPoint, Keynote, and Google Slides, this template is your go-to for creating impactful sales presentations that leave a lasting impression.


6 slides
Market Trends Heat Map Visualization Presentation
Analyze market trends with an intuitive heat map infographic. This visualization helps identify patterns, strengths, and risks using color-coded data blocks. Perfect for financial analysis, competitive research, and industry forecasting. Fully customizable and compatible with PowerPoint, Keynote, and Google Slides for seamless integration into your presentations.