


Features
- 4 Unique slides
- Fully editable and easy to edit in Microsoft Powerpoint, Keynote and Google Slides
- 16:9 widescreen layout
- Clean and professional designs
- Export to JPG, PDF or send by email


Do you have any questions?
Recommend


8 slides
Environmental Impact Reporting Presentation
Showcase sustainability data with clarity using the Environmental Impact Reporting Presentation. Perfect for tracking plastic usage, waste trends, and eco-initiatives. The infographic-style visuals highlight four distinct data points with bold icons and labeled callouts. Fully editable in PowerPoint, Keynote, and Google Slides—ideal for ESG reports, audits, or environmental awareness campaigns.


10 slides
Effective Leadership Strategy Presentation
Unveil the secrets to transformative leadership with our Effective Leadership Strategy Presentation. This template guides you through essential leadership stages with visually engaging graphics, ideal for molding influential leaders. Fully compatible with PowerPoint, Keynote, and Google Slides, it's perfect for enhancing your leadership training sessions.


6 slides
Engagement Survey Results Infographics
Effectively communicate your engagement survey results with our Engagement Survey Results infographic template. This template is fully compatible with popular presentation software like PowerPoint, Keynote, and Google Slides, allowing you to easily customize it to illustrate and convey your survey findings. The Engagement Survey Results infographic template offers a visually engaging platform to present survey data, key findings, and insights related to employee or customer engagement. Whether you're an HR professional, manager, or business leader, this template provides a user-friendly canvas to create informative presentations and reports on engagement survey outcomes. Optimize your communication of survey results with this SEO-optimized Engagement Survey Results infographic template, thoughtfully designed for clarity and ease of use. Customize it to showcase survey methodology, response rates, visualizations of data, and action plans based on the findings, ensuring that your audience gains a comprehensive understanding of the survey results and their implications. Start crafting your personalized infographic today to effectively communicate engagement survey outcomes.


6 slides
Professional Company Profile Deck Presentation
Present your business with impact using this modern company profile deck. Designed for clarity and professionalism, it includes structured icons, visual highlights, and customizable content sections. Ideal for pitches, internal briefings, or executive introductions. Fully editable in PowerPoint, Keynote, and Google Slides to match your brand and messaging effortlessly.


5 slides
Online Education Training Presentation
Present your digital learning programs with this Online Education Training Presentation. The visual layout highlights a central computer screen connected to key e-learning components, making it perfect for explaining course structures, virtual classroom tools, or distance learning workflows. Designed for trainers, educators, or edtech professionals. Fully editable in PowerPoint, Keynote, and Google Slides.


12 slides
Geometric Shapes Design Slide Presentation
Make your content stand out with a bold, modern layout built from clean geometric forms that guide the viewer’s eye effortlessly. This presentation helps you organize ideas, highlight key points, and create a polished visual flow without distractions. Fully editable and compatible with PowerPoint, Keynote, and Google Slides.


6 slides
Tech Infrastructure Strategy Presentation
Build a smarter foundation for your tech-driven goals with a clear, layered design that showcases every stage of your technology roadmap. Perfect for presenting IT systems, cloud migration, or infrastructure planning, this presentation ensures clarity and impact. Fully compatible with PowerPoint, Keynote, and Google Slides for smooth customization.


7 slides
Target Audience Demographics Slide Presentation
Capture attention with a clean, data-driven layout that makes understanding your audience quick and intuitive. This presentation helps you showcase key demographic insights, highlight behavioral patterns, and communicate strategic findings with clarity. Designed for easy editing and smooth workflow, it’s fully compatible with PowerPoint, Keynote, and Google Slides.


6 slides
Children's Smile Rating Infographic
Smile Rating refers to a method of evaluating customer satisfaction or user experience by measuring the positive emotional response elicited, often in the form of a smile. This infographic template is a visually engaging way to showcase customer satisfaction or feedback using smiley faces to represent different levels of happiness or contentment. This type of infographic is commonly used in customer service, user experience, and feedback analysis. This can provide valuable insights into emotional engagement and satisfaction. This infographic is designed to focus on providing services or products that are intended to create a positive and enjoyable experience.


8 slides
Breast Cancer Research and Support Presentation
Dive into the pivotal world of healthcare with the Breast Cancer Research and Support template. This presentation emphasizes the critical aspects of breast cancer research and community support, providing a deep exploration of both scientific advancements and compassionate outreach. Suitable for PowerPoint, Keynote, and Google Slides, it effectively highlights statistical data, support resources, and key information with easy-to-understand graphics and dedicated spaces for comprehensive details, ideal for educational sessions and health advocacy meetings.


7 slides
Supply Chain Logistic Infographics
Streamline your logistics insights with our Supply Chain Logistics Infographic, tailored for logistics managers, supply chain analysts, and operations directors. This infographic provides a visual tool to depict the intricacies and flow of your supply chain from procurement to distribution. Our infographic offers a comprehensive layout to map out each step of the supply chain, highlighting key processes such as supplier selection, manufacturing, inventory management, and logistics. It's designed to facilitate a better understanding of each segment's role in the overall efficiency and effectiveness of the supply chain. Customize this infographic with specific data points, such as lead times, turnover rates, and transportation modes, to provide a detailed view of your logistics operations. This SEO-optimized infographic is crafted to make your supply chain data accessible and actionable. Implement our infographic to communicate the complexities of supply chain logistics succinctly, ensuring that stakeholders grasp the full scope of your supply chain dynamics.


5 slides
Pet Clinic Business Strategy Presentation
Enhance your pet clinic's approach with our Pet Clinic Business Strategy presentation template. This layout is expertly designed to outline your clinic’s key strategies and enhance your operational excellence, making it perfect for meetings, stakeholder presentations, and strategic workshops.


21 slides
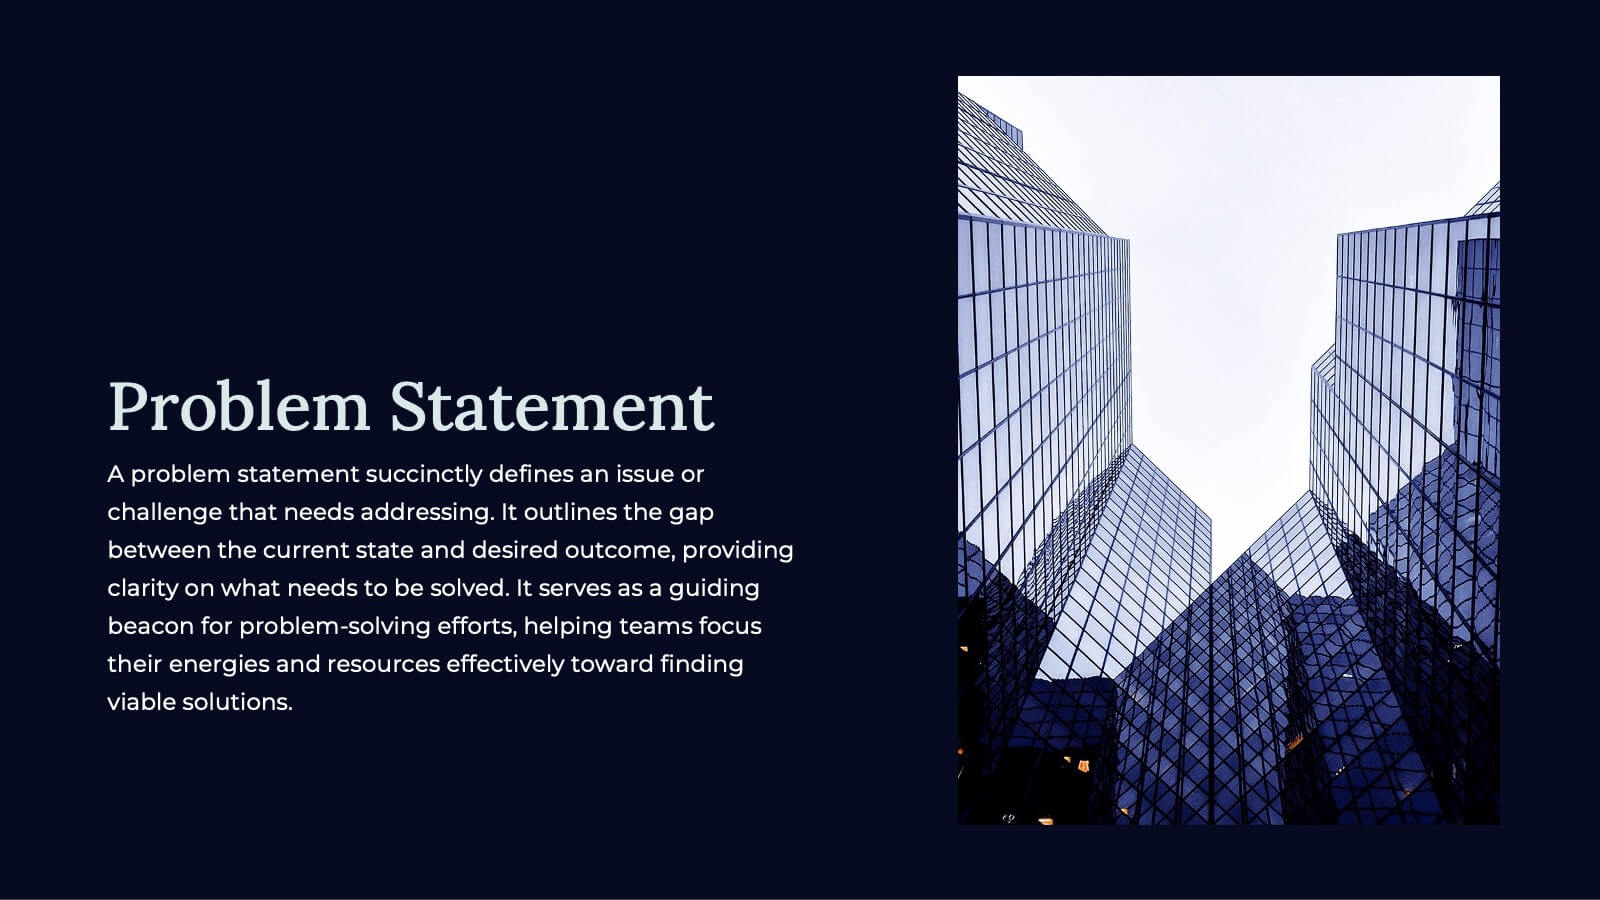
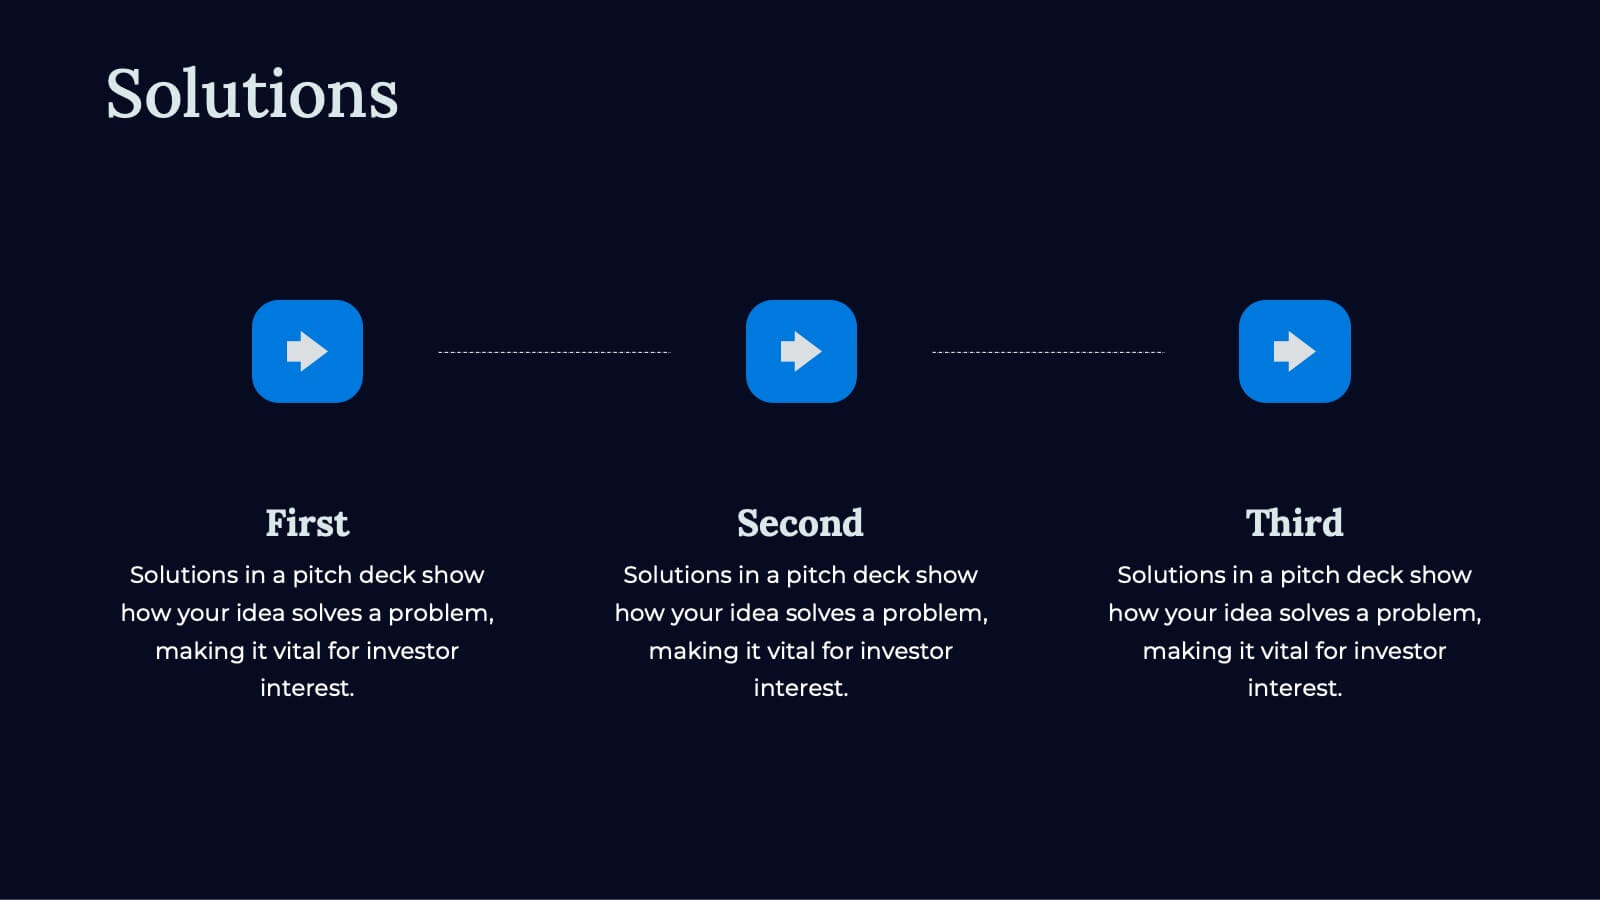
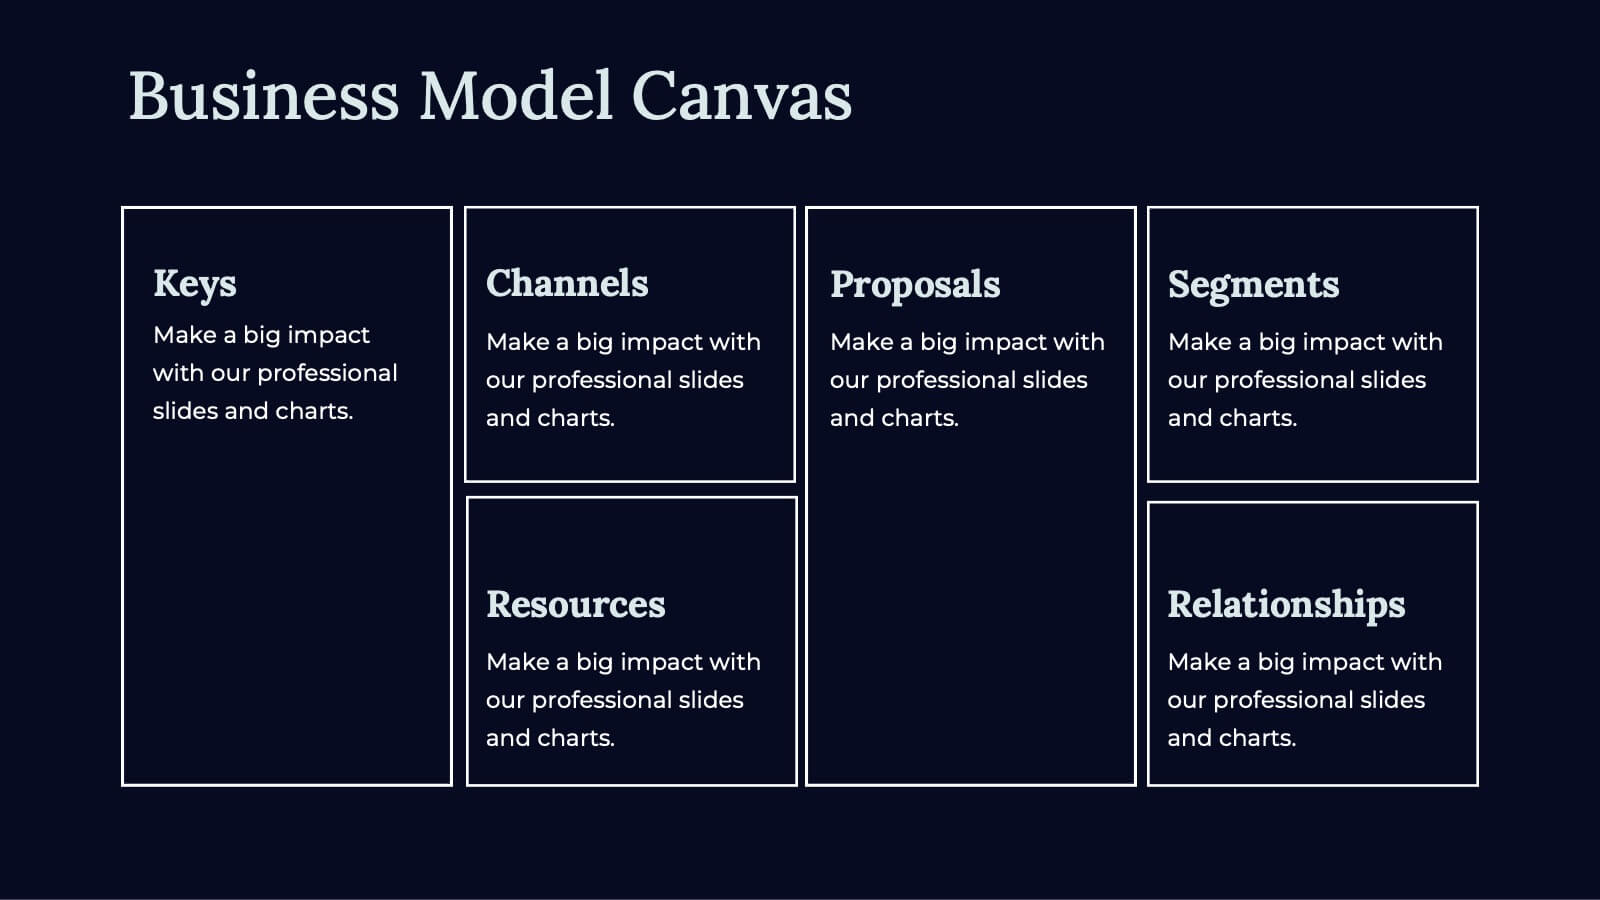
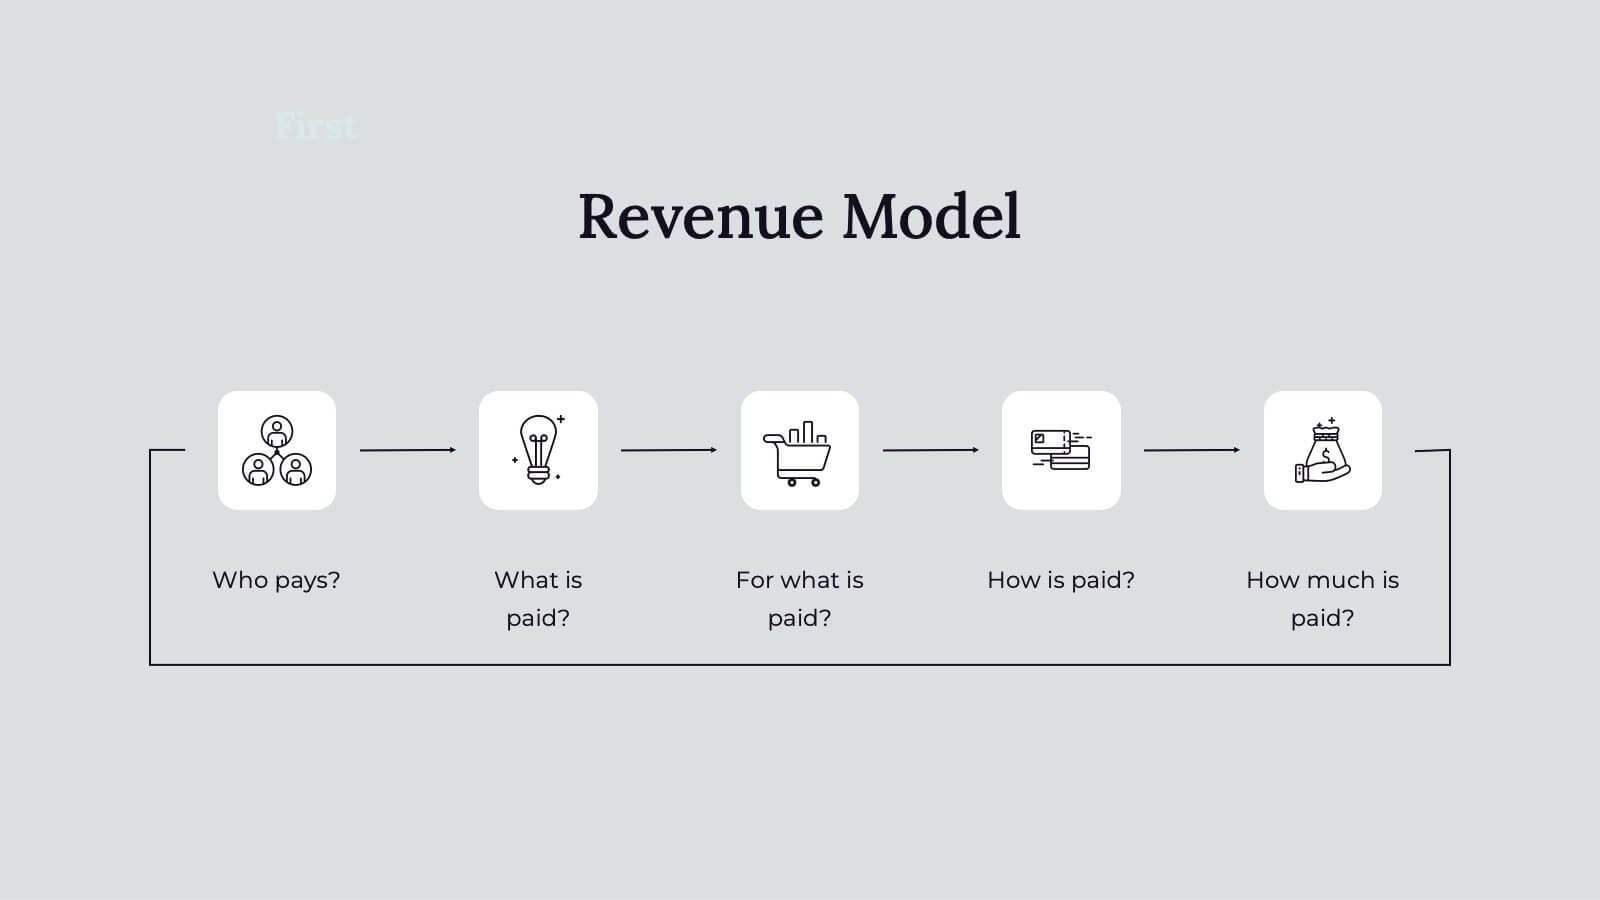
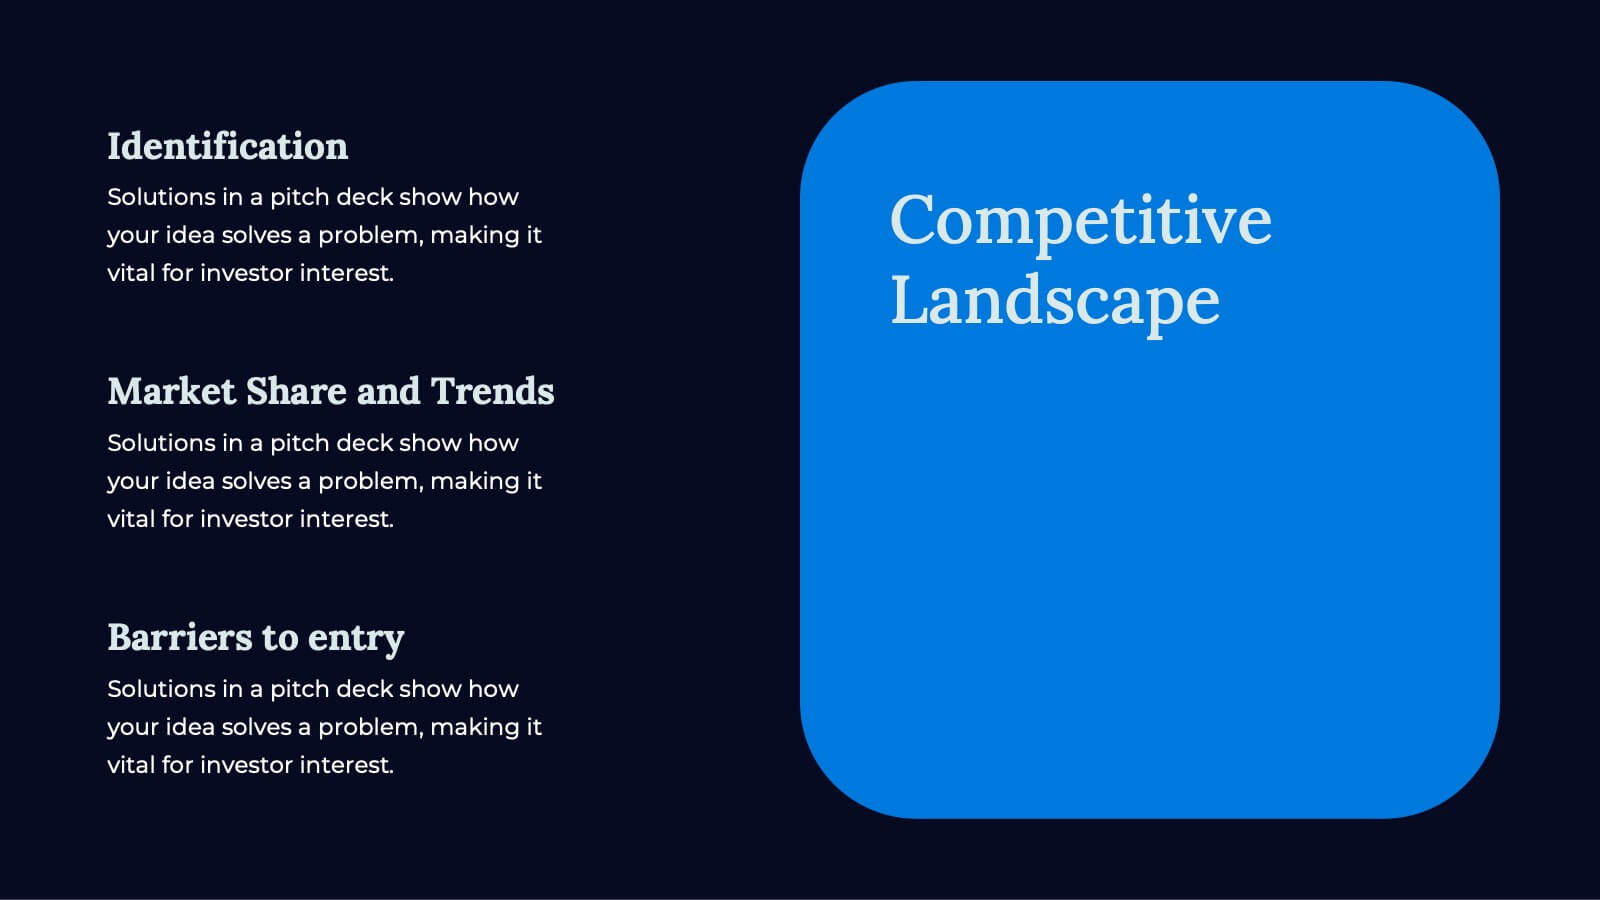
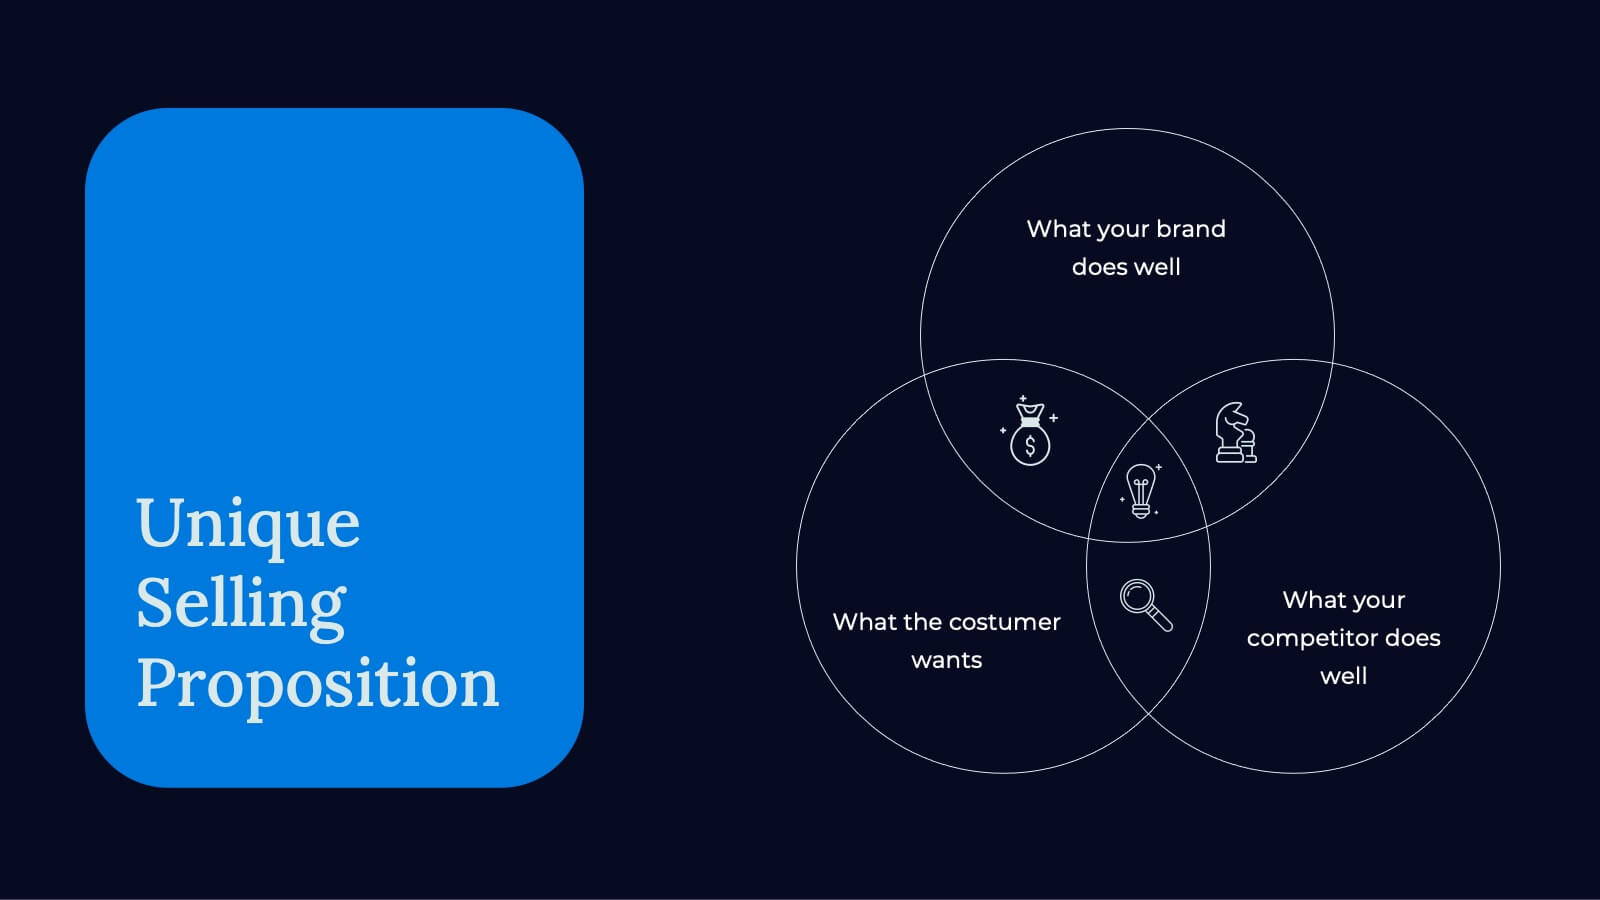
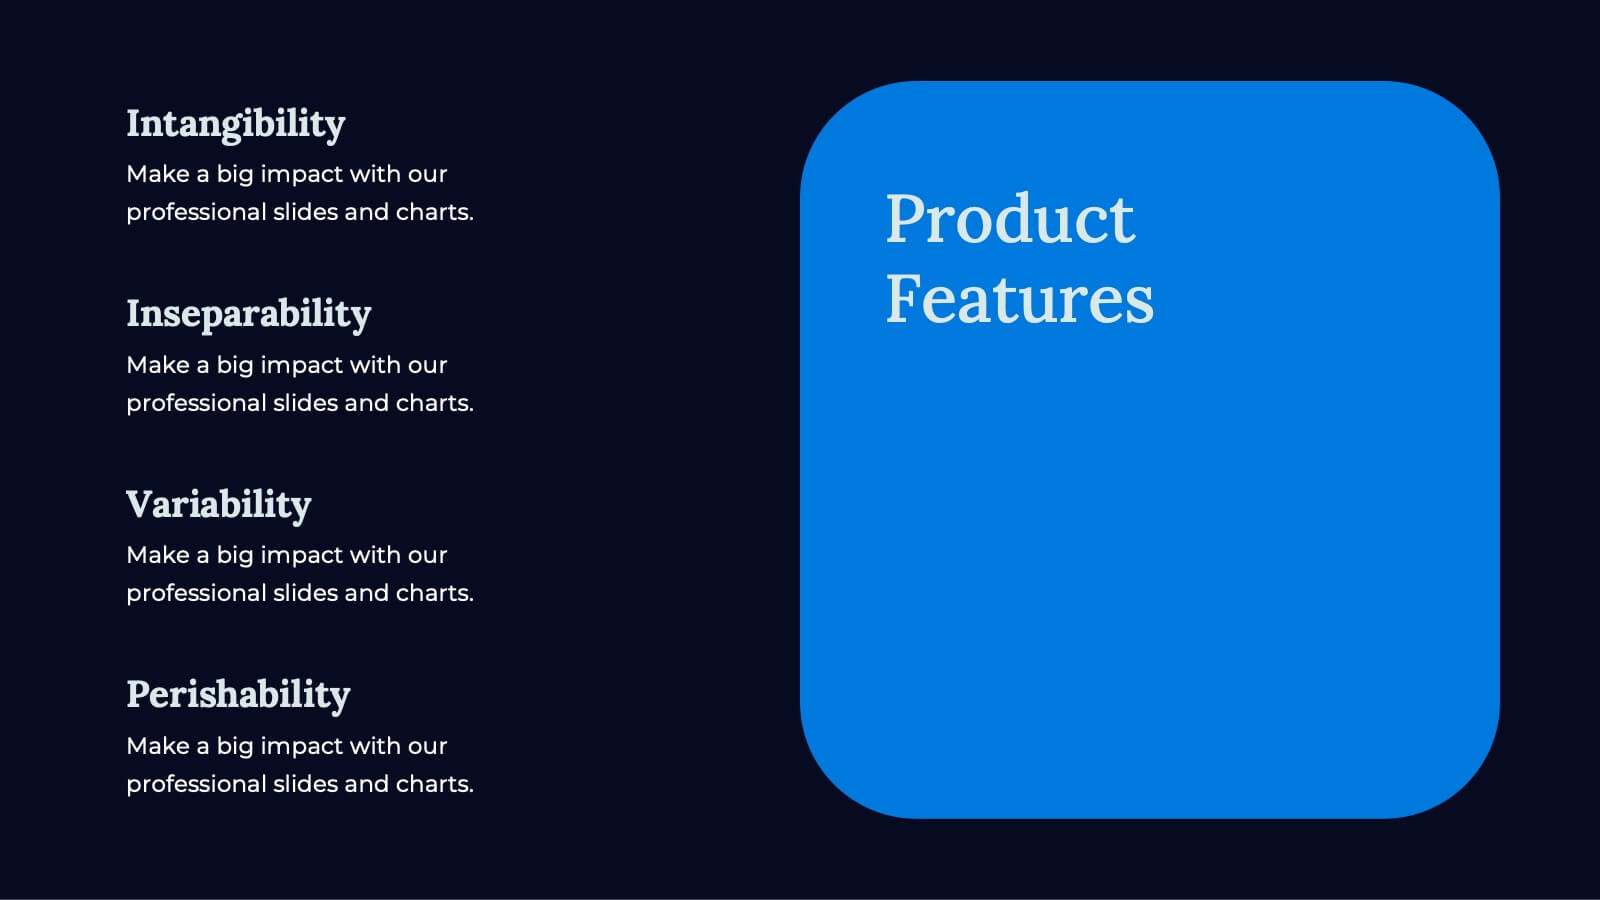
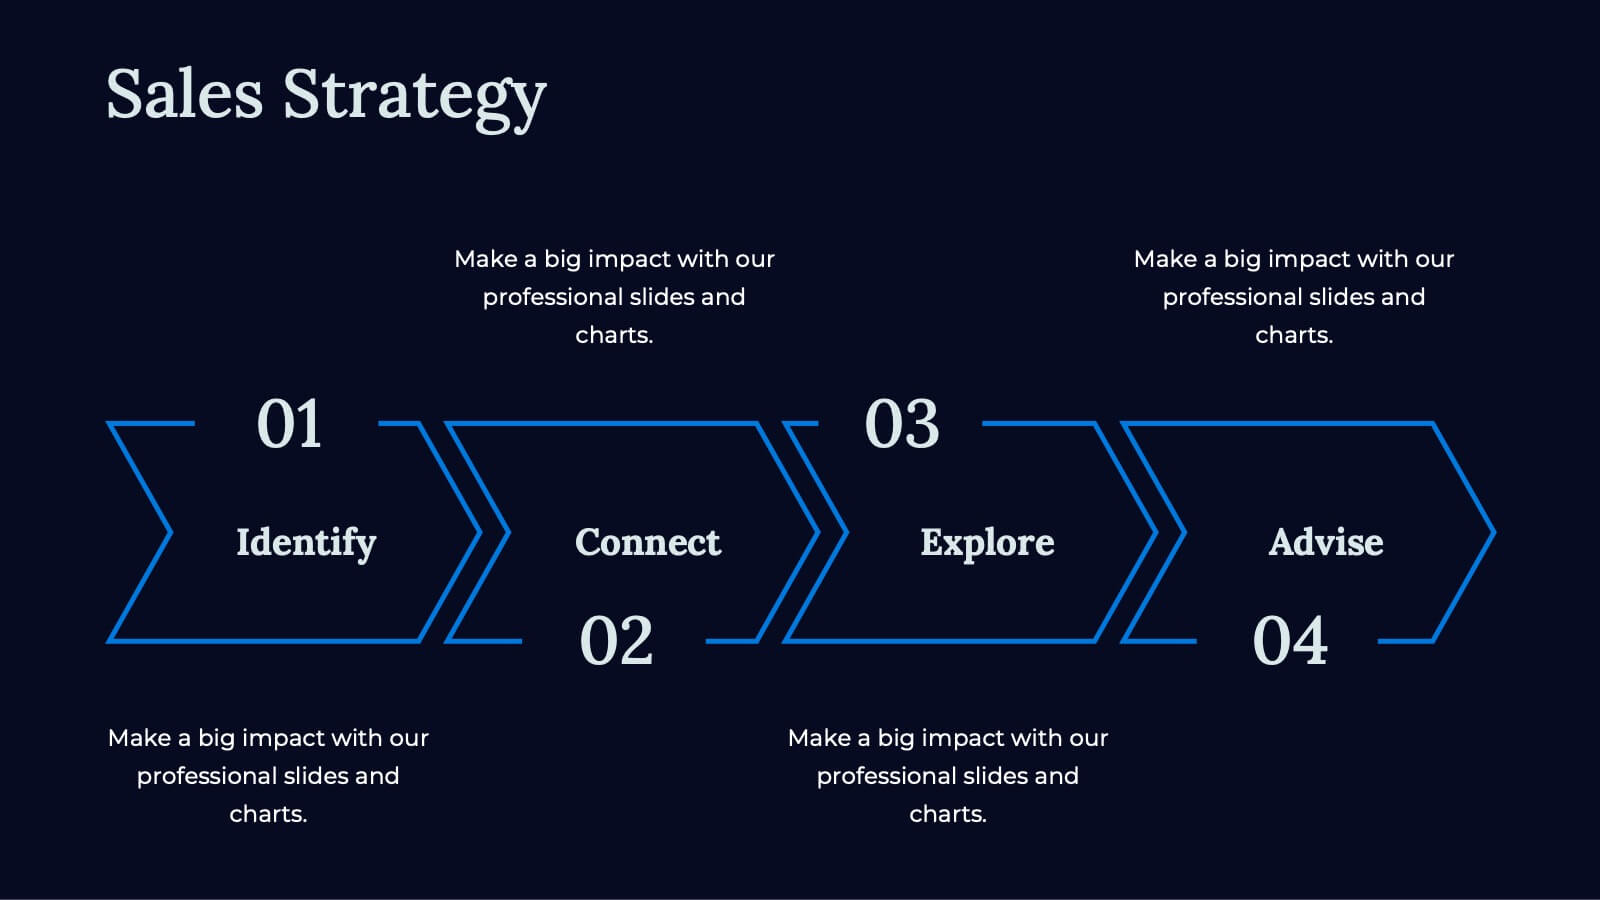
Apex Business Idea Pitch Deck Presentation
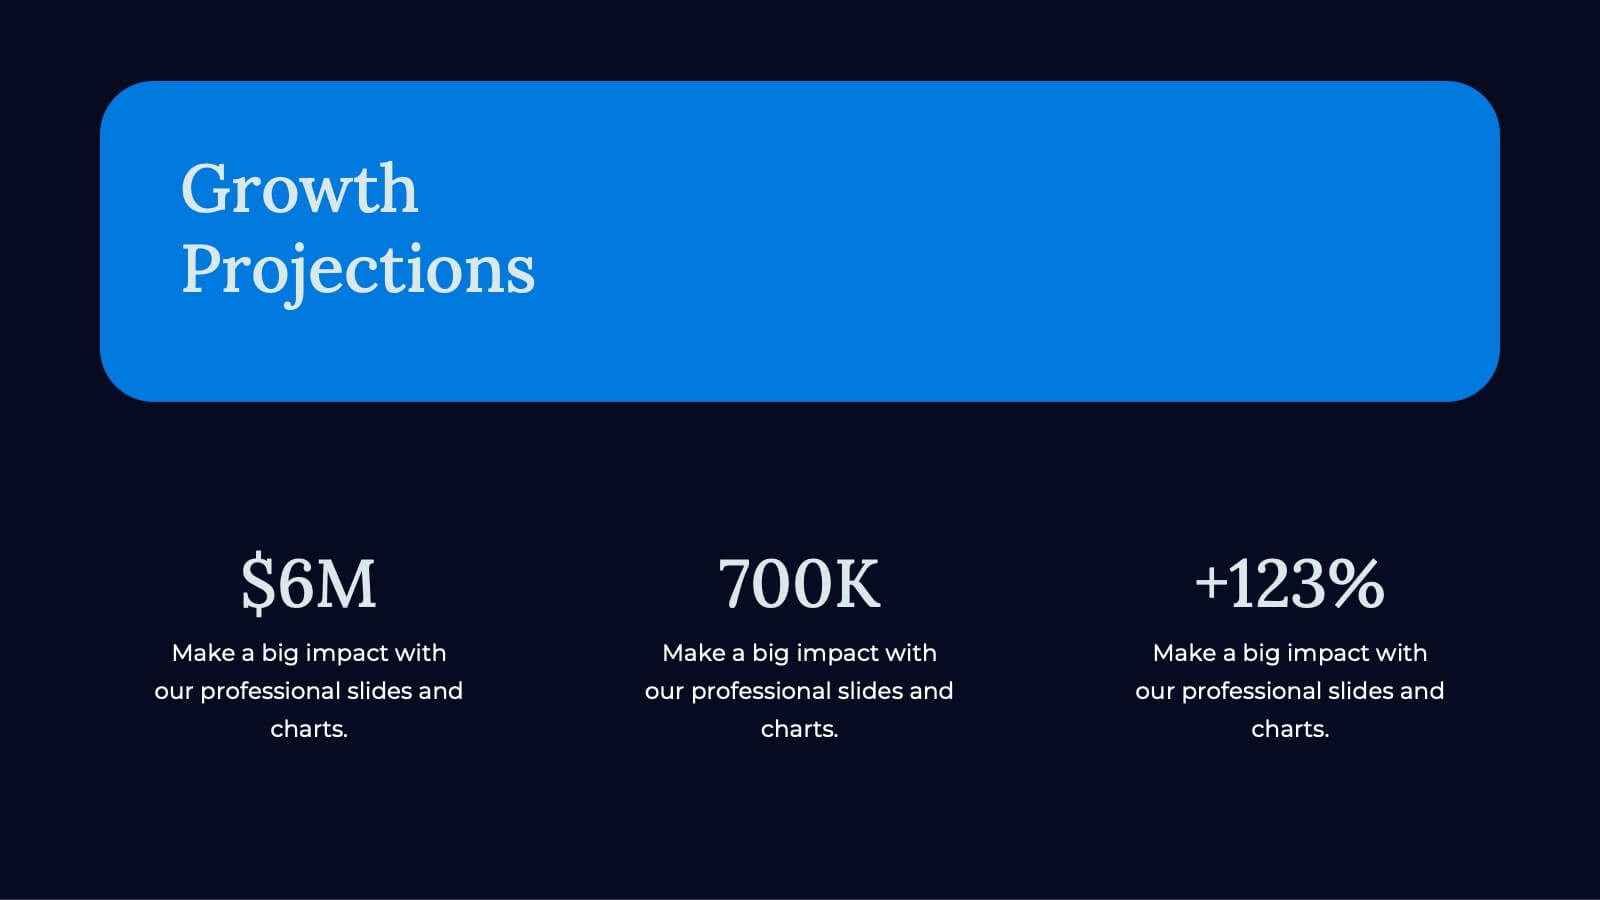
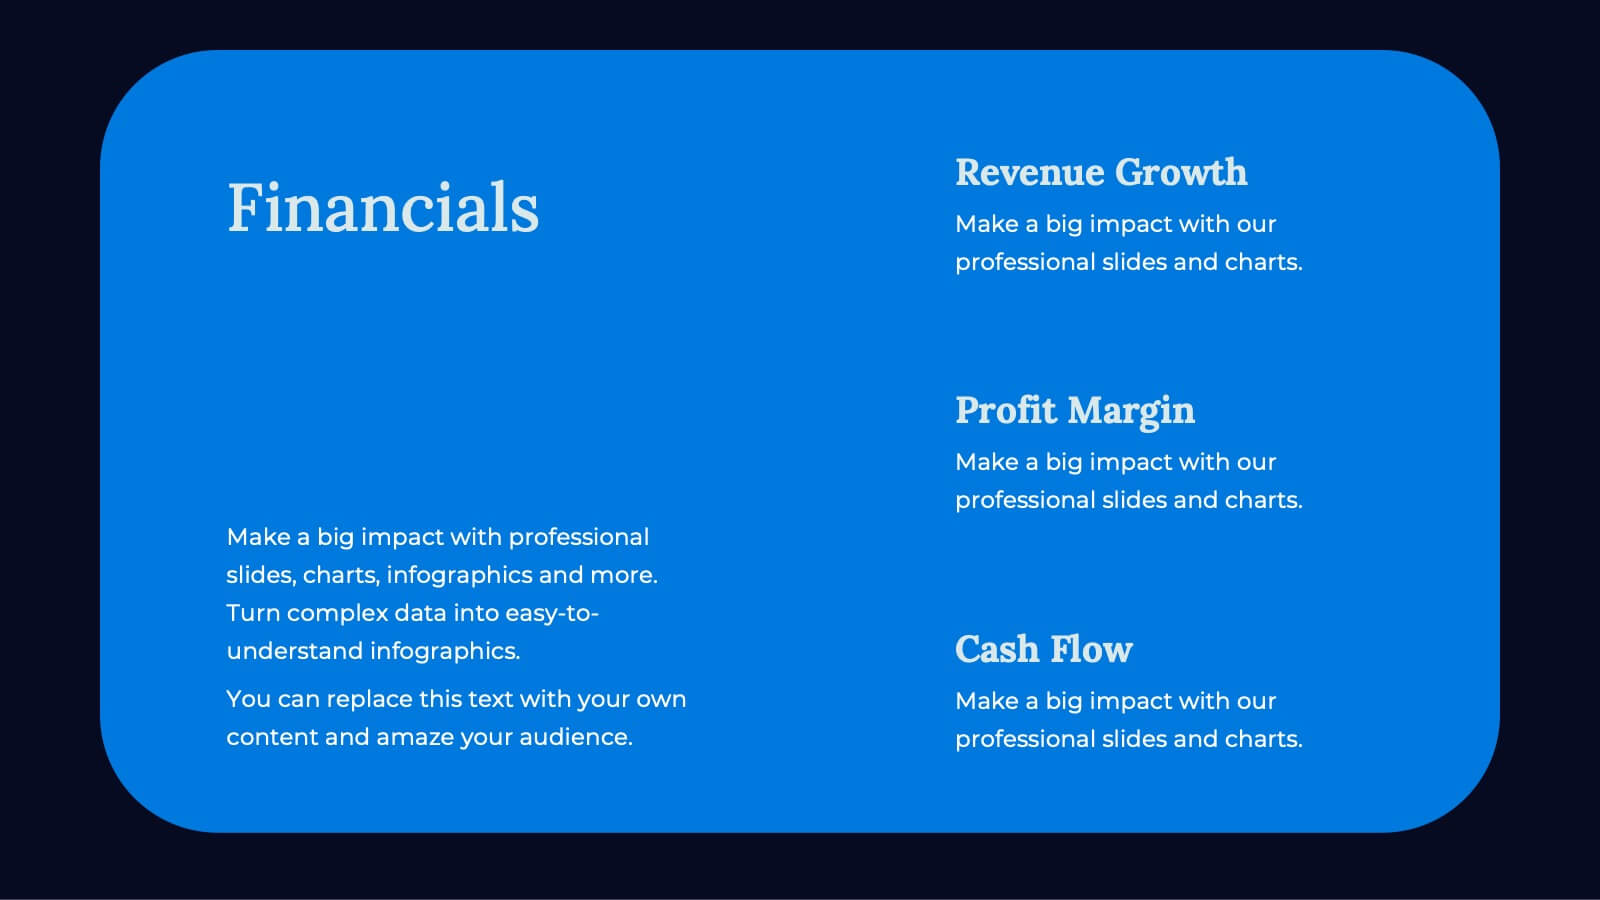
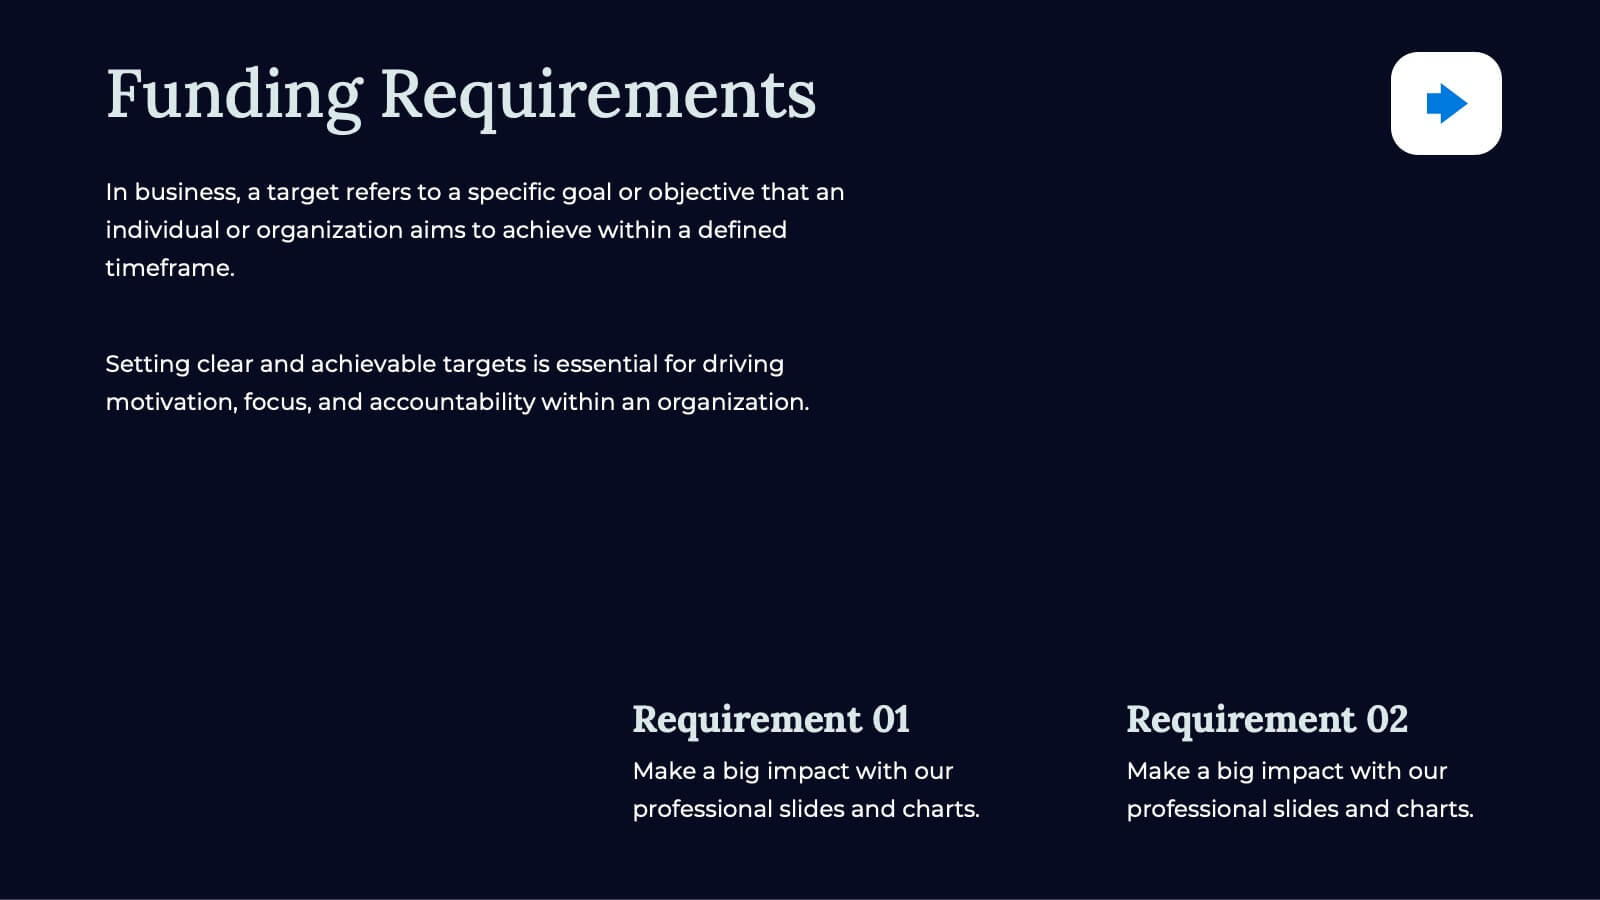
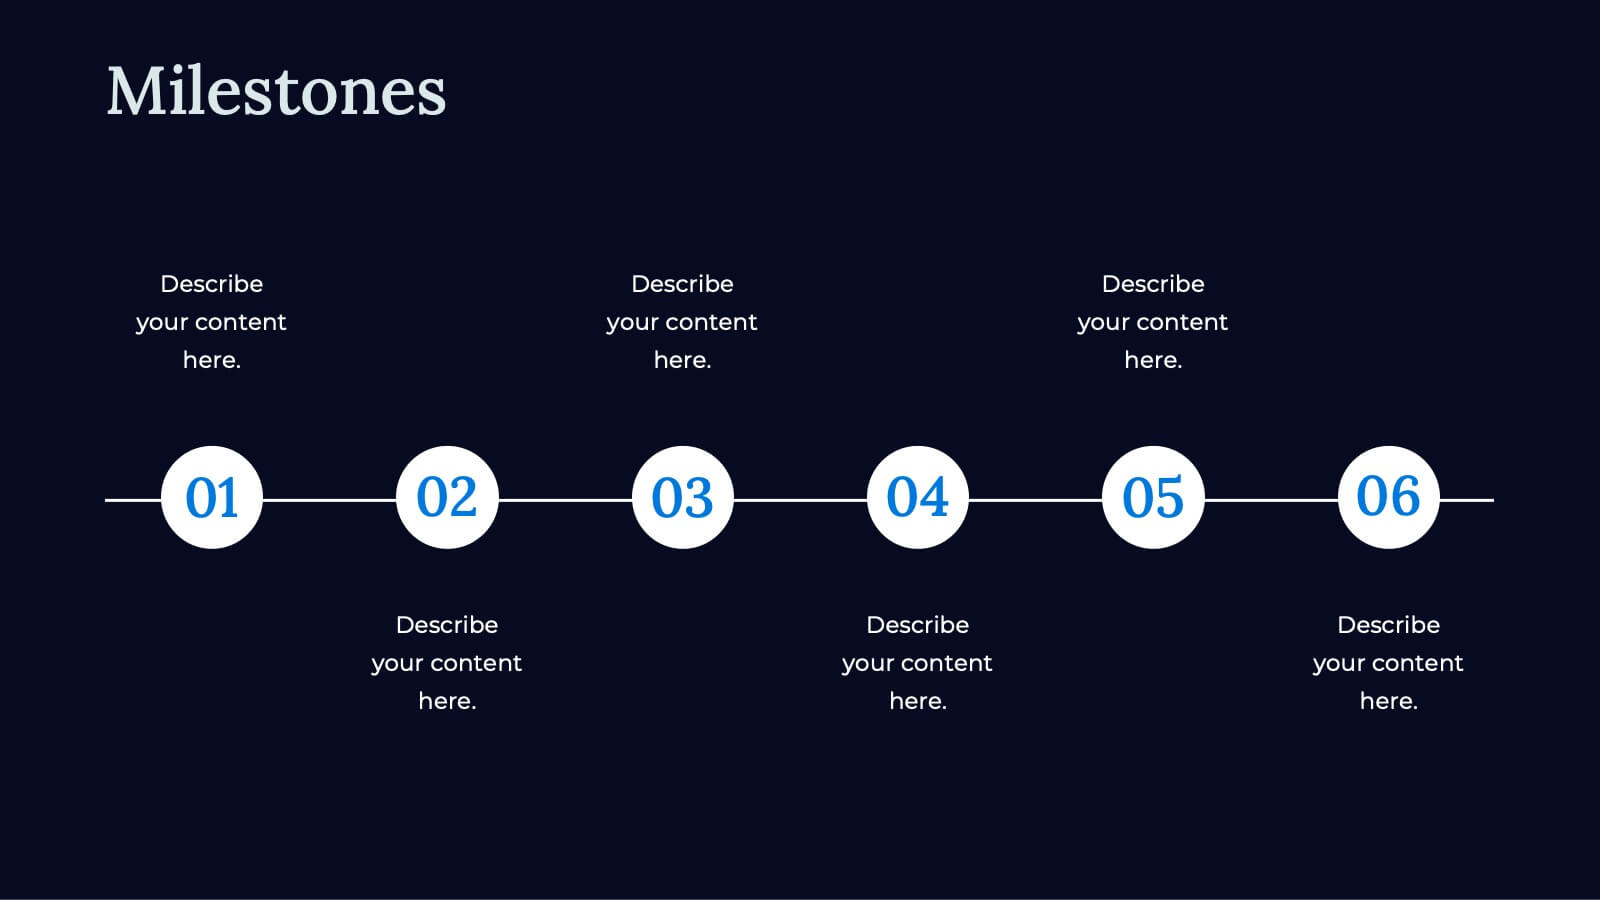
Craft powerful business pitch decks with this sleek template. Present your company overview, problem statement, solutions, and market opportunity. Showcase your business model, revenue model, competitive landscape, and unique selling proposition. Perfect for highlighting financials, growth projections, and funding requirements. Compatible with PowerPoint, Keynote, and Google Slides. Impress investors and stakeholders with clear, concise, and visually appealing presentations.


6 slides
Scrum Team Roles and Sprint Planning Presentation
Visualize your Agile workflow with this Scrum team diagram. Highlight roles, responsibilities, and key sprint planning phases in a clear, circular flow. Ideal for project managers, team leads, or Agile coaches. Fully editable in PowerPoint, Keynote, and Google Slides to support your software development or Agile training presentations.


6 slides
Organizational Change Management Presentation
Visualize transformation with clarity using this structured slide, perfect for outlining your change roadmap, initiatives, or strategic phases. The layout features six labeled steps with icons and editable text for seamless communication of your process—from awareness to adoption. Ideal for HR leaders, consultants, and operations managers. Fully editable in PowerPoint, Keynote, and Google Slides.


7 slides
Value Chain Activity Infographic Presentation
A Value Chain Infographic is a visual representation of the various activities and processes that a company uses to create and deliver a product or service to its customers. This template is a perfect way to analyze a company's competitive advantage by breaking down its activities into primary and support activities. This template includes a series of connected components, each representing a activity or process in the value chain. This infographic includes diagrams, charts, and other visual elements to help explain the flow of goods and services through the various stages of the value chain.


5 slides
Business KPI Performance Presentation
Bring your business results to life with a clear, modern layout designed to showcase key metrics and performance goals. Perfect for tracking growth, progress, and success indicators, this visual design helps make data easy to understand and engaging. Fully editable in PowerPoint, Keynote, and Google Slides.