


Features
- 6 Unique slides
- Fully editable and easy to edit in Microsoft Powerpoint, Keynote and Google Slides
- 16:9 widescreen layout
- Clean and professional designs
- Export to JPG, PDF or send by email


Do you have any questions?
Recommend


7 slides
Leadership Skills Infographic
Leadership skills encompass a range of abilities and qualities that enable an individual to guide, motivate, and manage a team or group of people effectively. Embark on this joyful adventure through the realm of leadership skills, and let the vibrant colors and engaging design of our leadership skills infographic spark the leader within you. Compatible with Powerpoint, Keynote, and Google Slides. This template is designed to allow you to lead with a commitment to excellence. Roam through the realms of teamwork and collaboration, learning how to unite diverse individuals towards a common goal.


23 slides
Pulse Project Status Report Presentation
This vibrant and sleek report template delivers a powerful visual impact while ensuring clear communication. Perfect for tracking progress, reviewing key metrics, and analyzing client feedback, it covers everything from project highlights to competitor insights. Compatible with PowerPoint, Keynote, and Google Slides, this template elevates every report presentation with professional flair!


21 slides
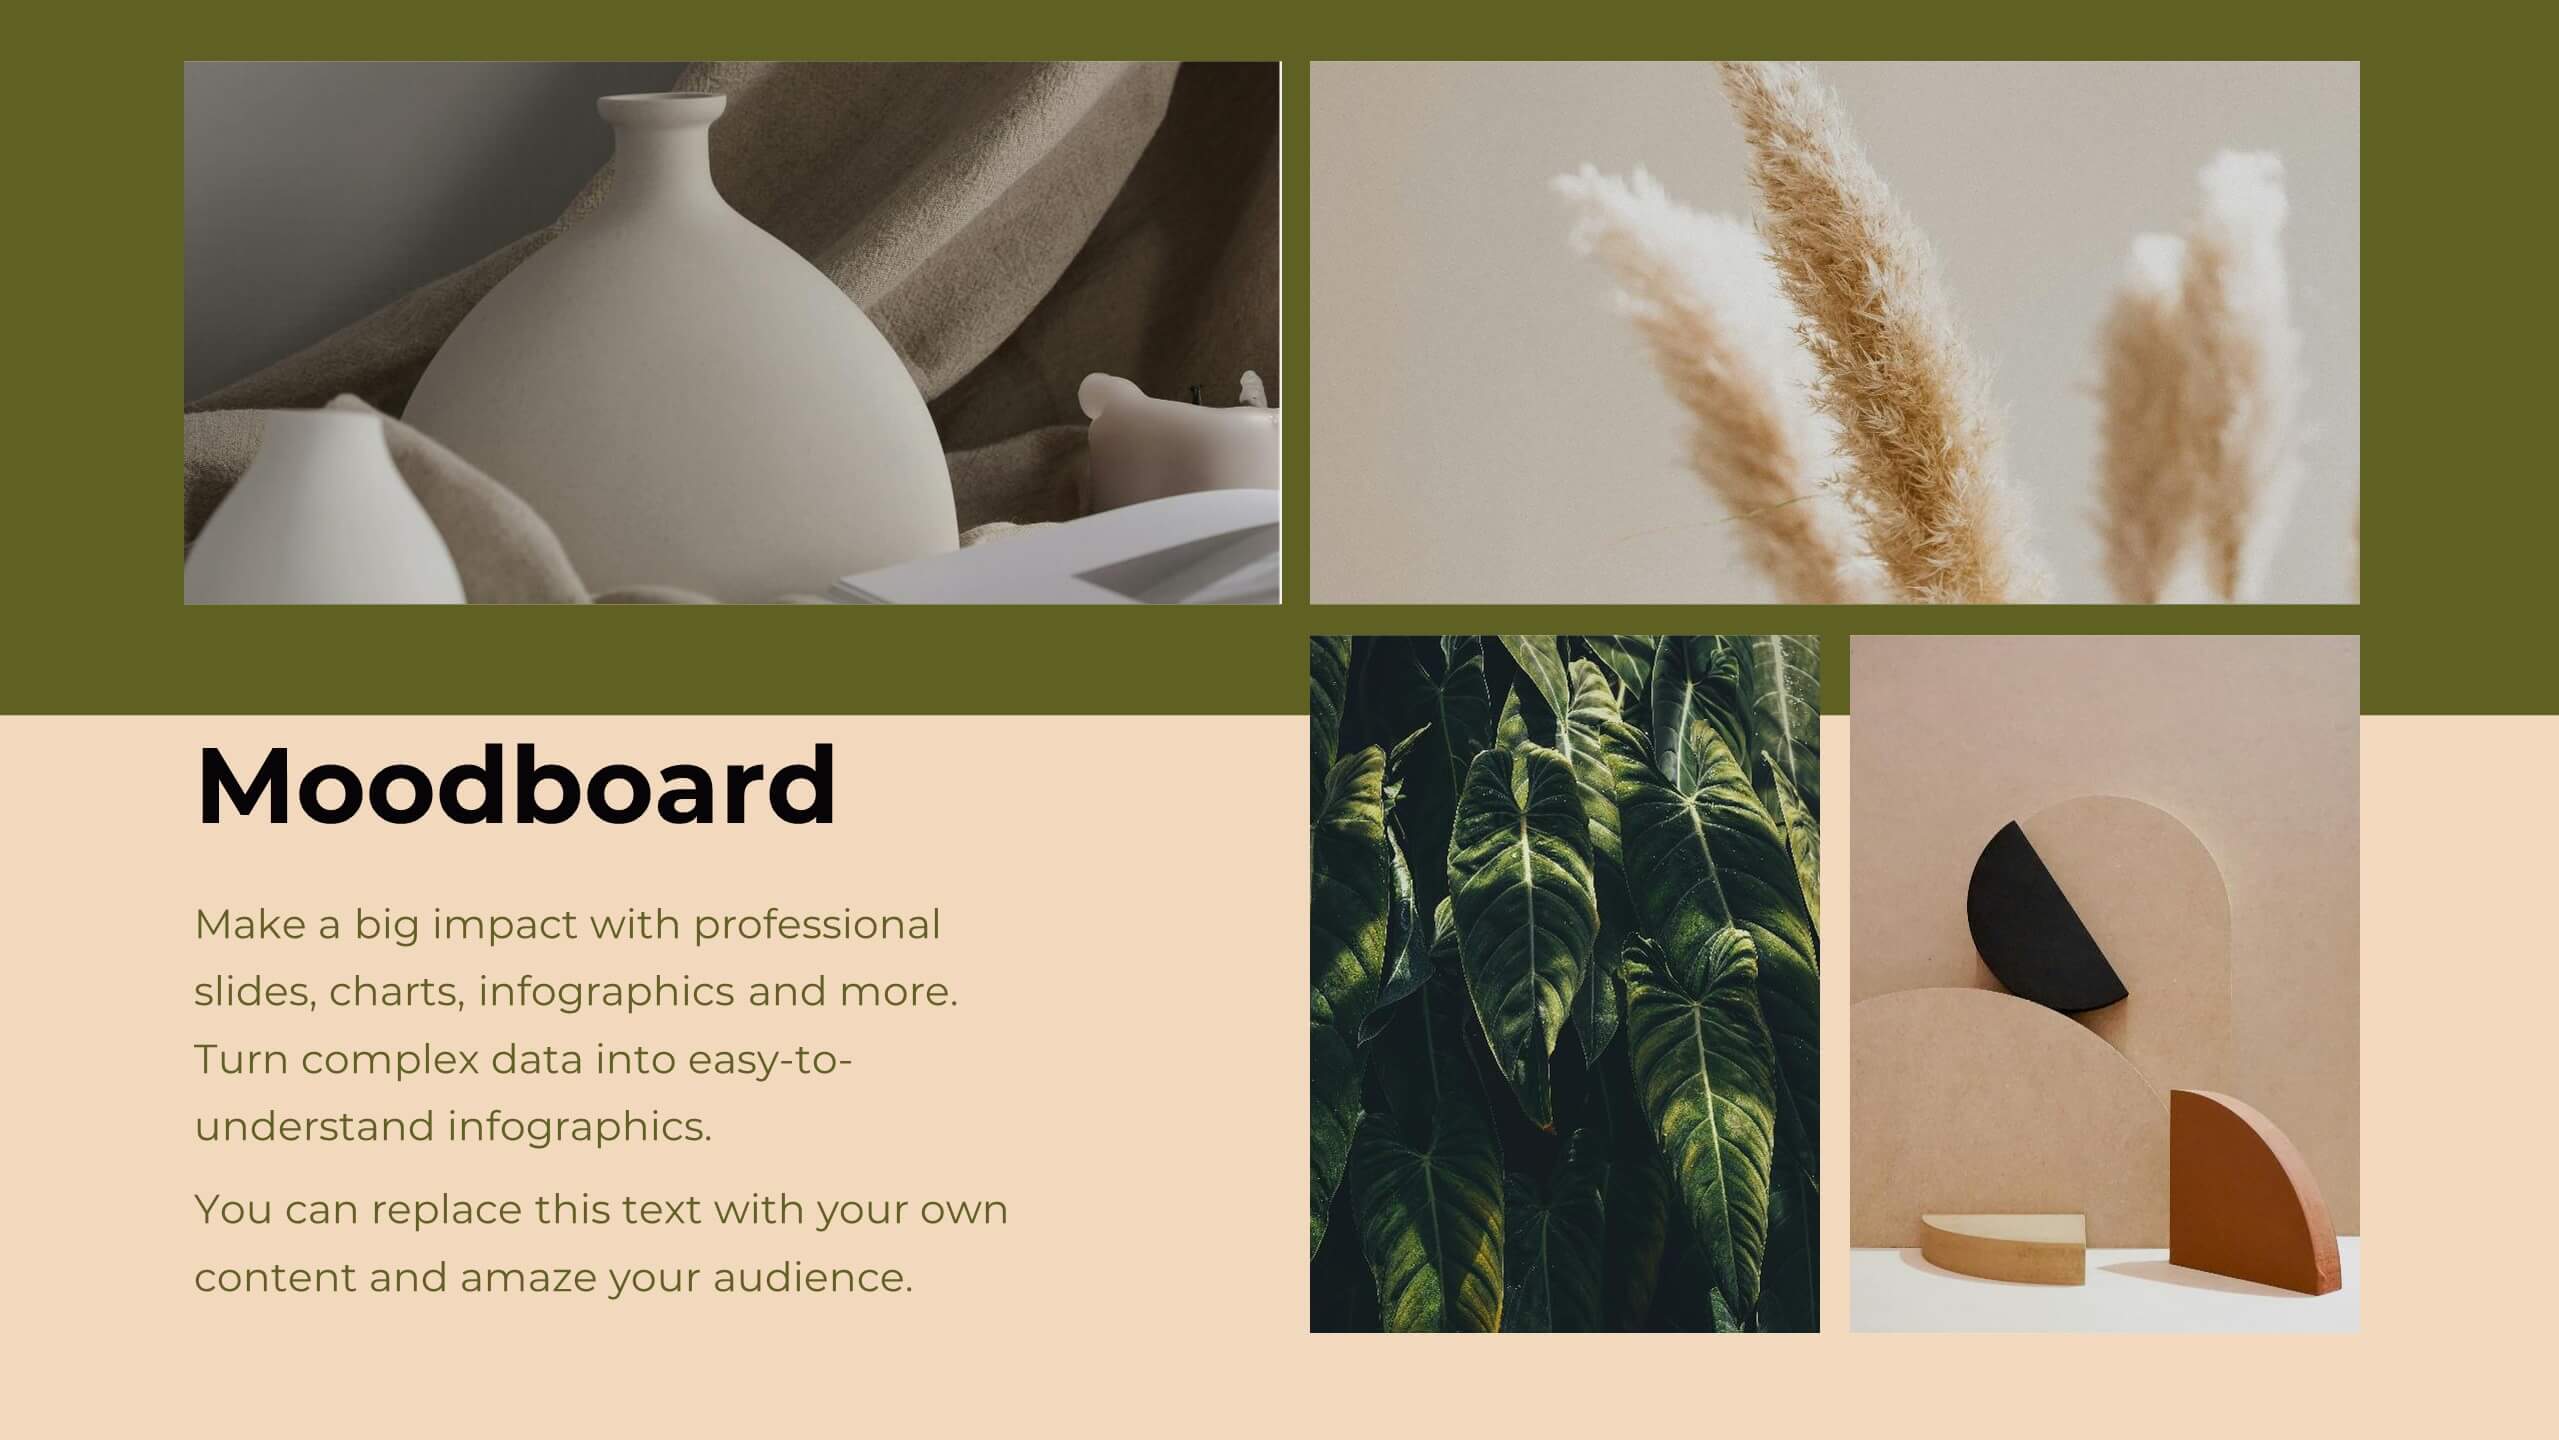
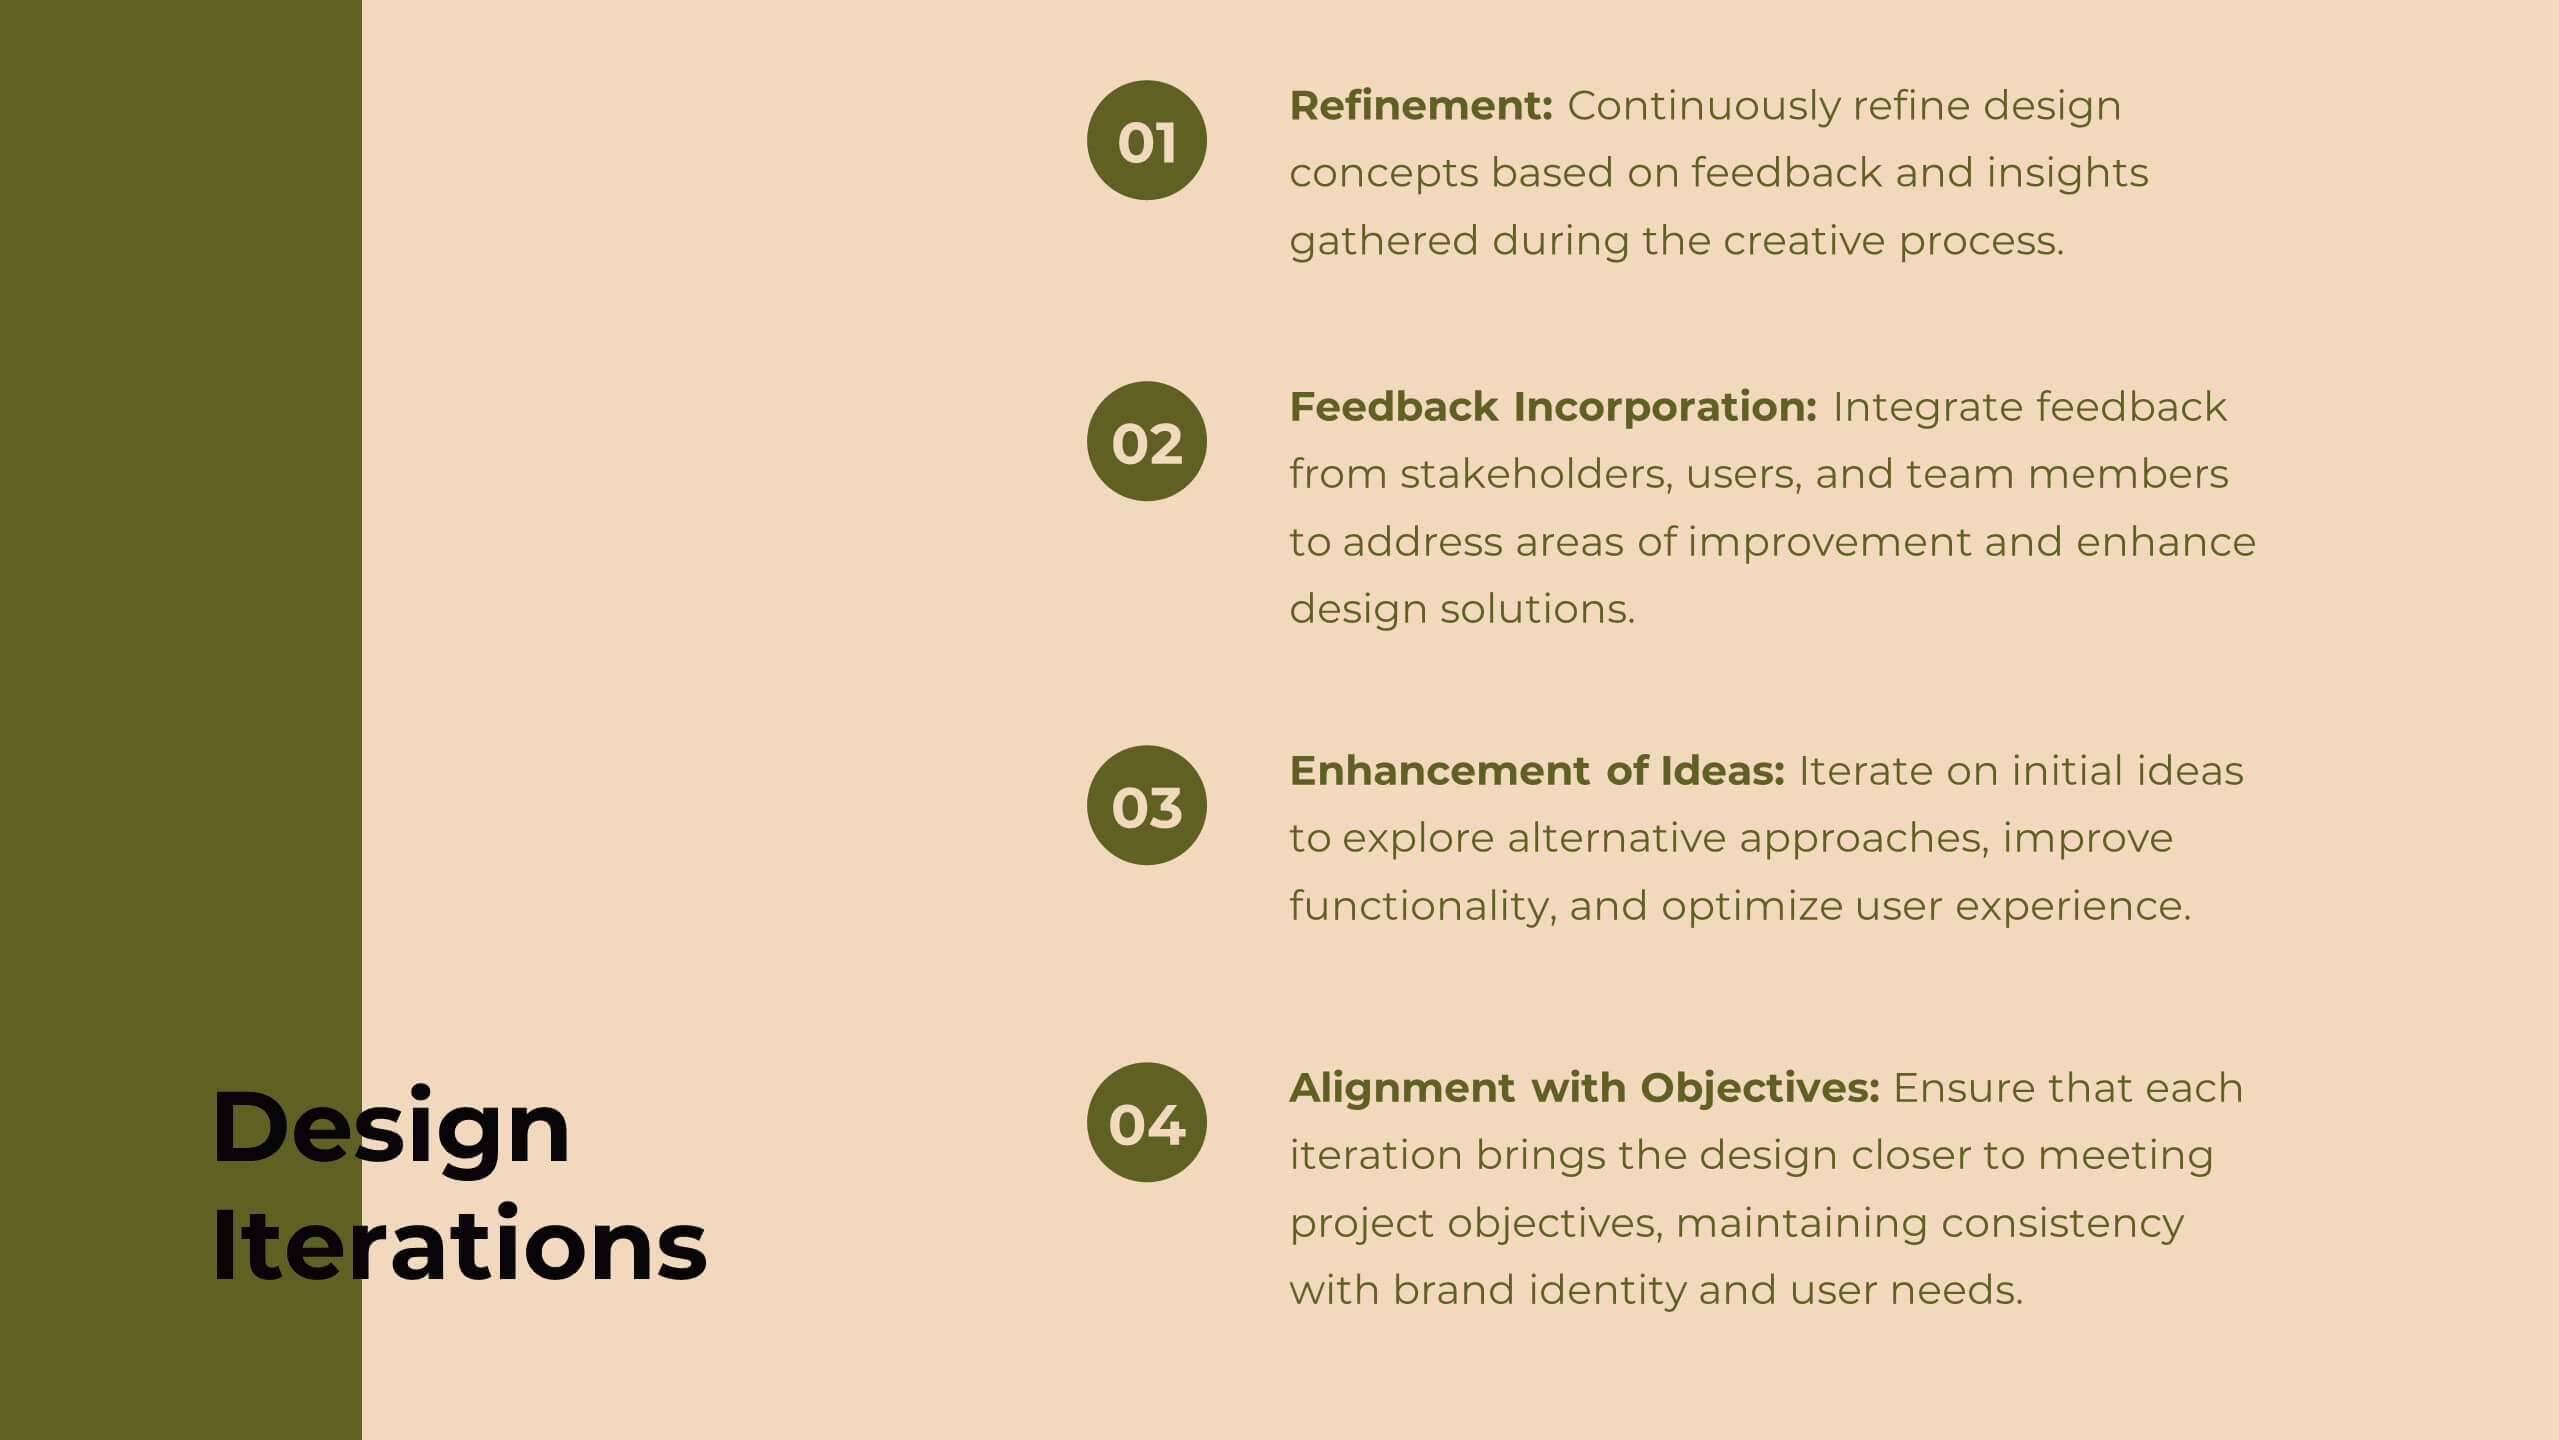
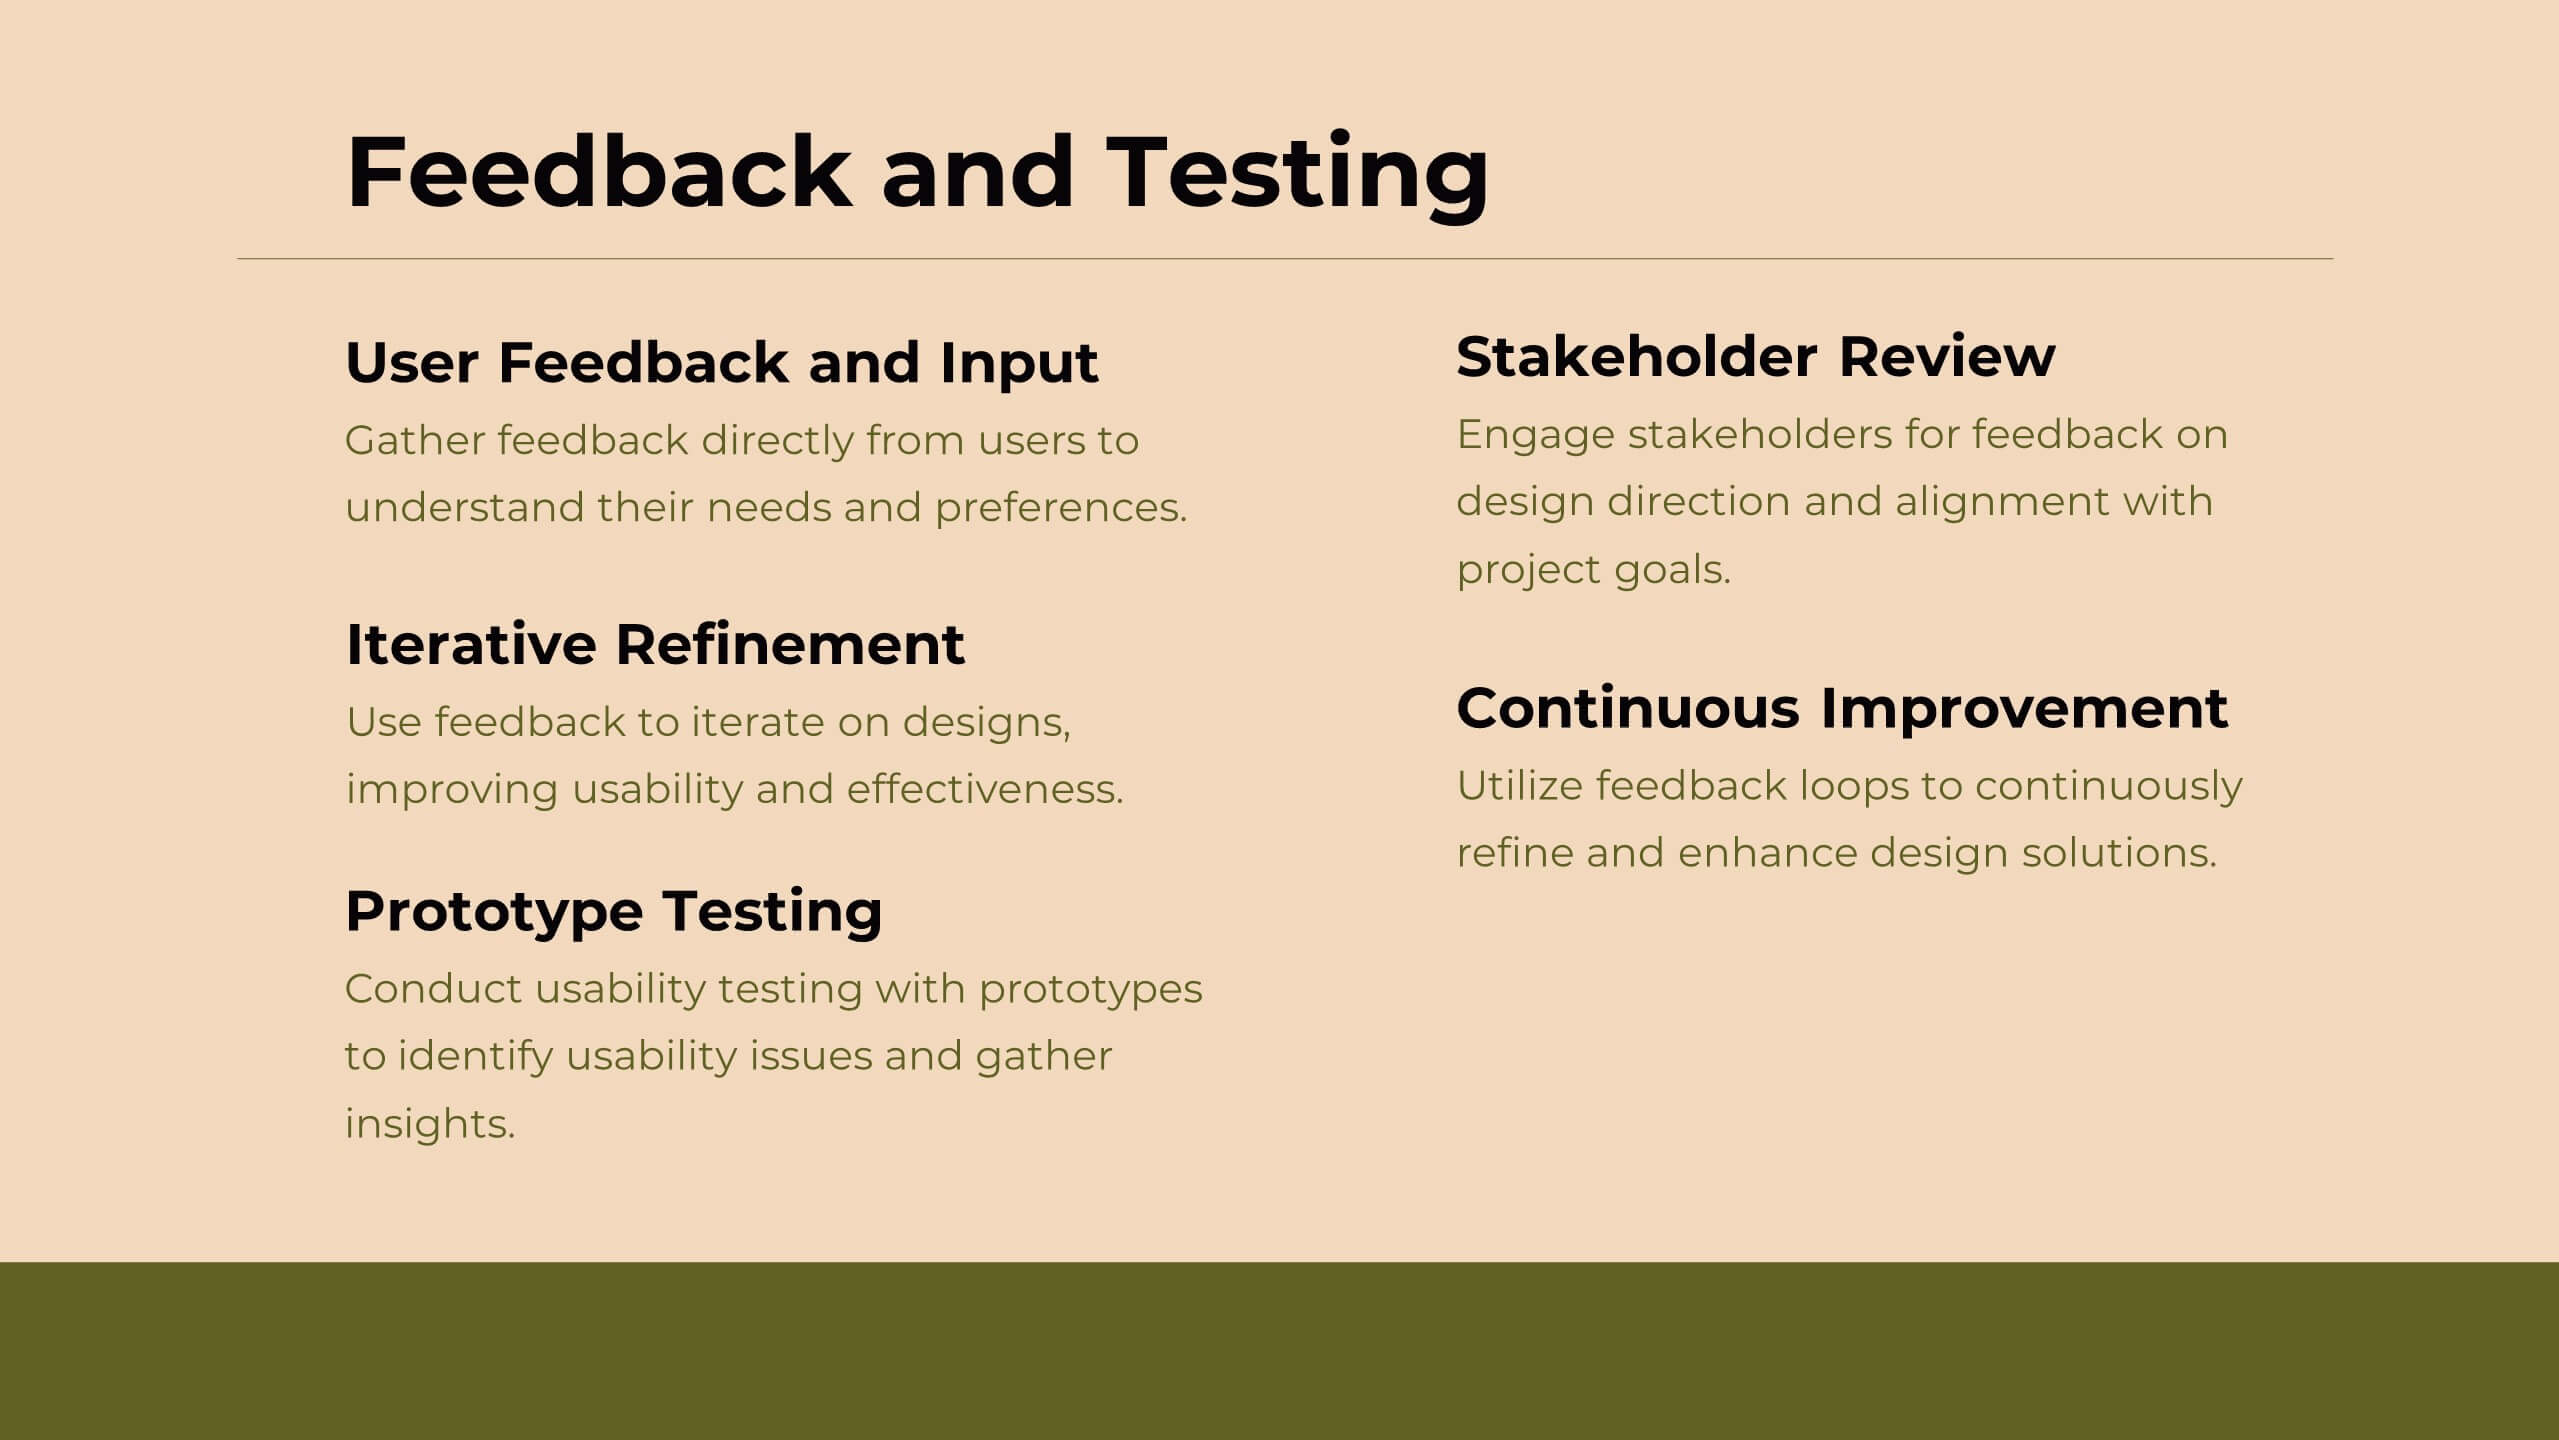
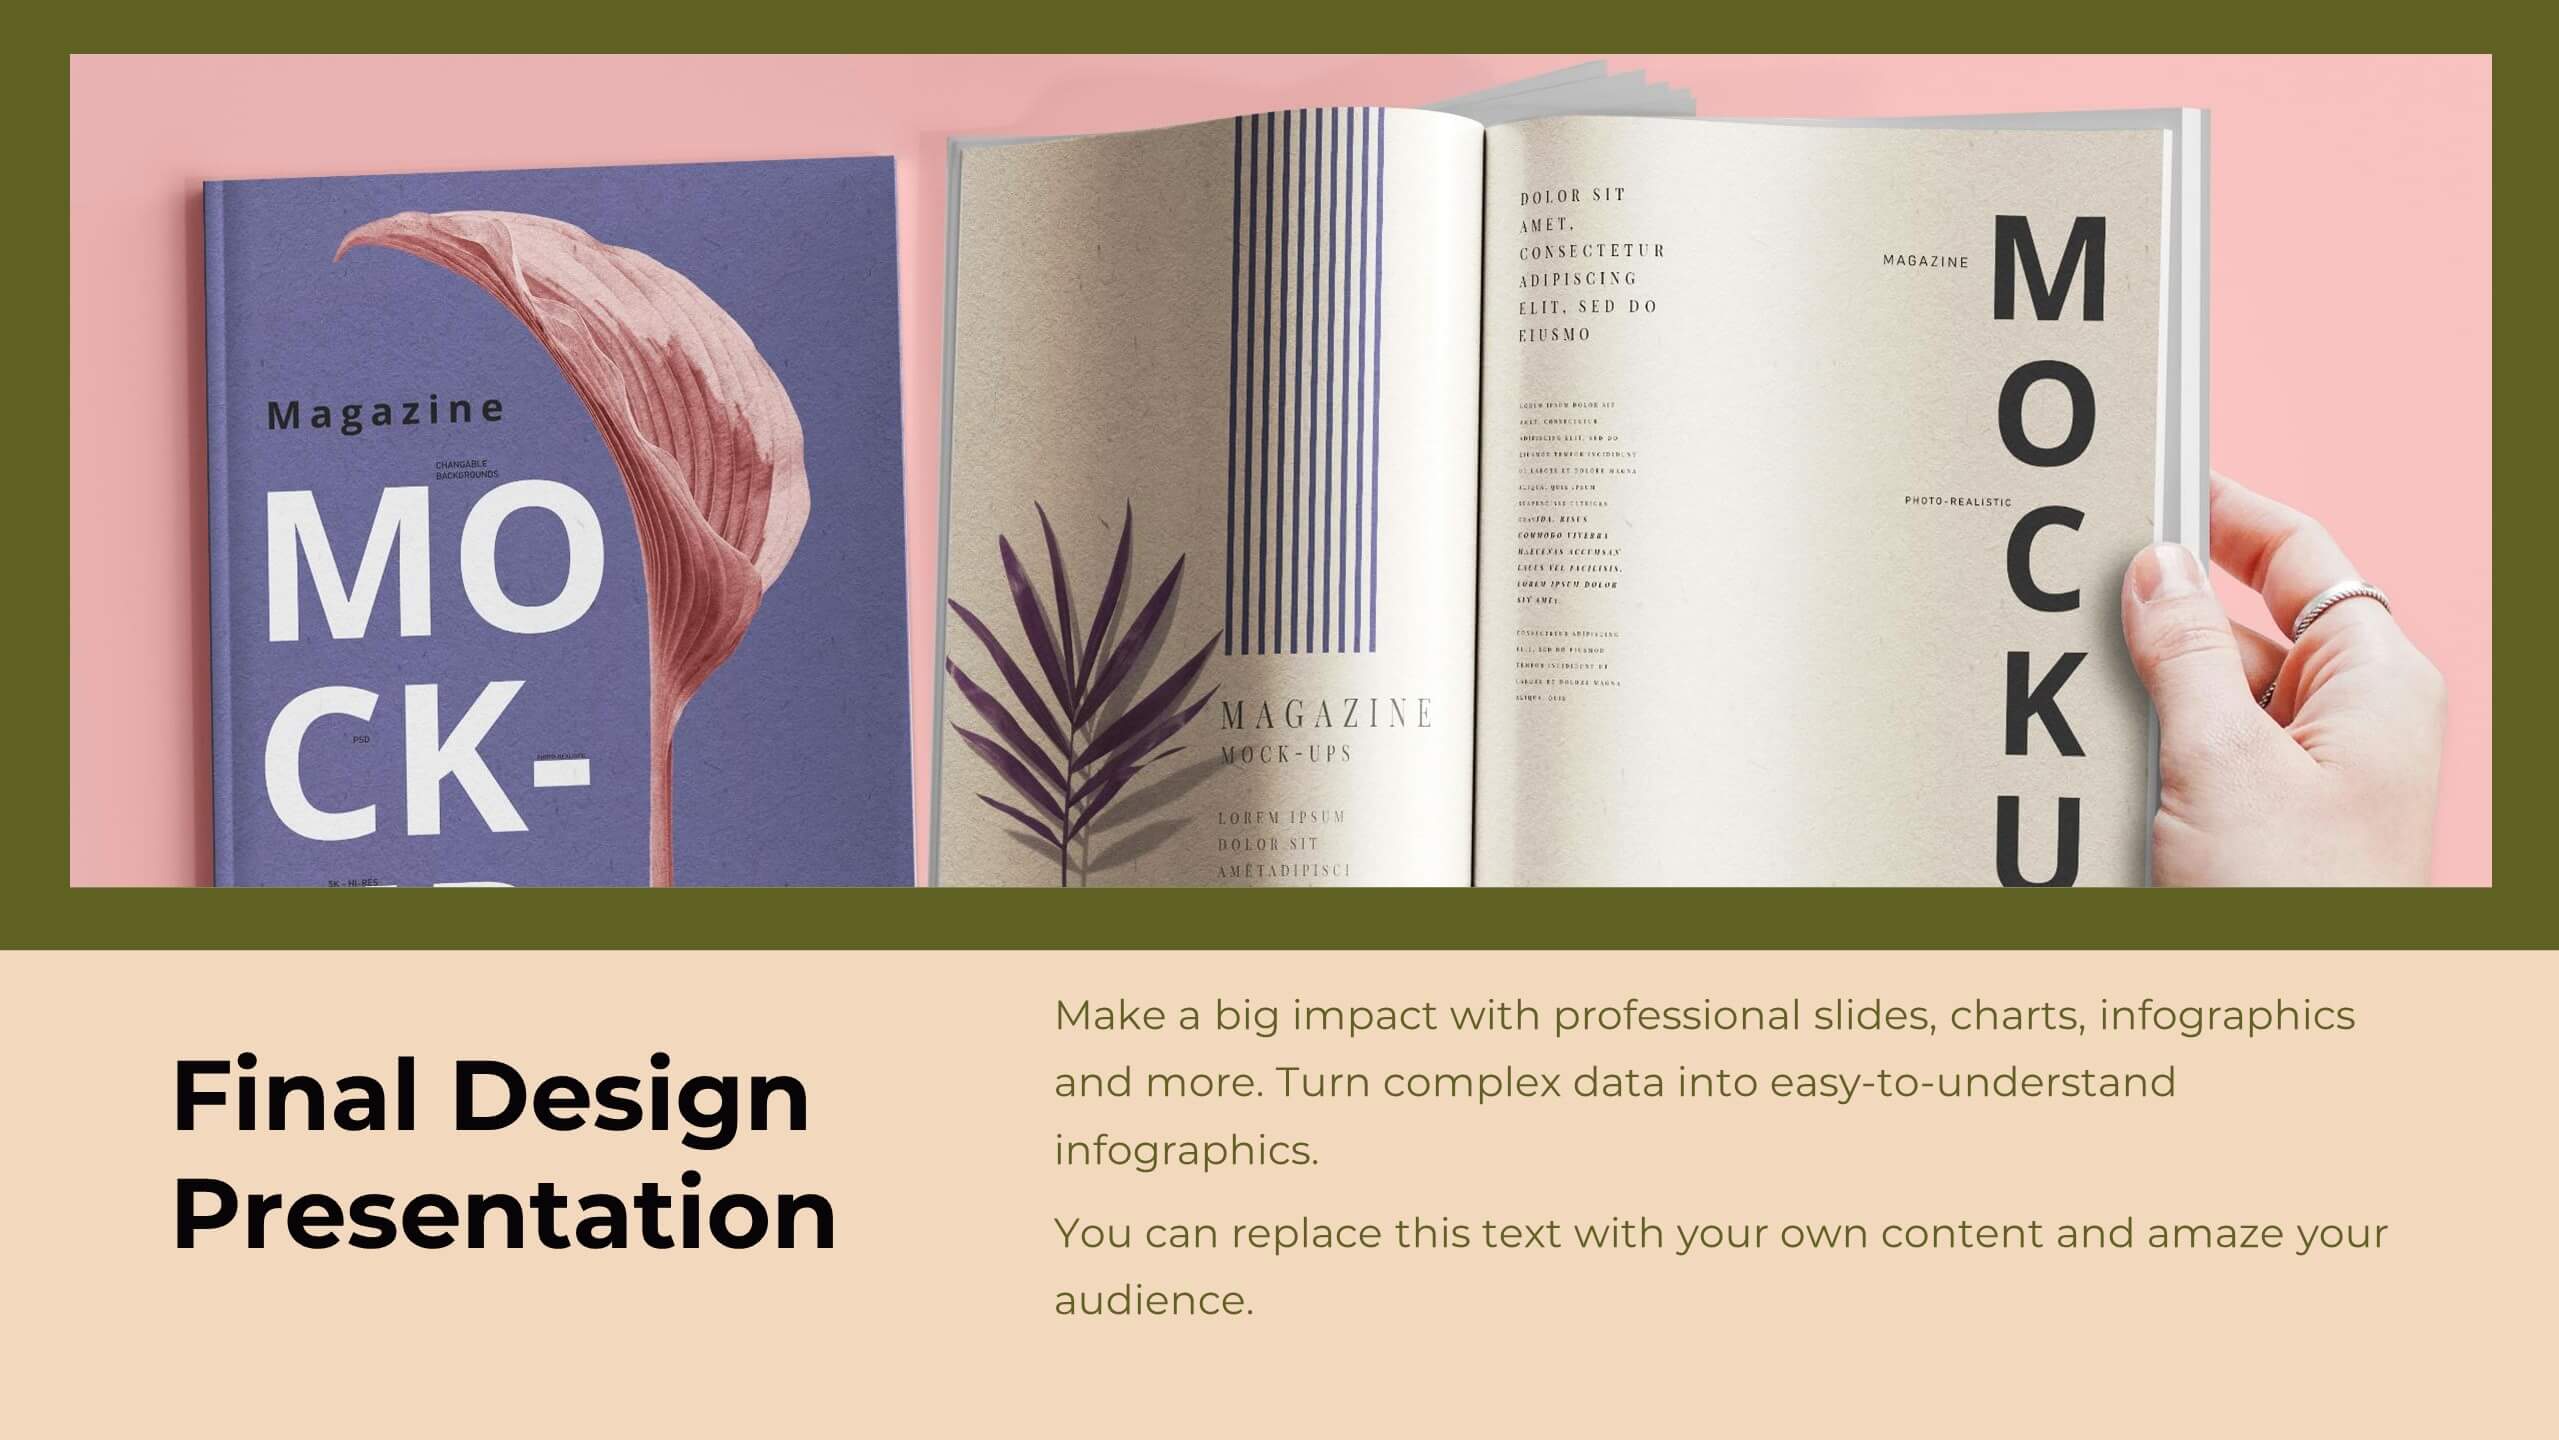
Delta Design Strategy Proposal Presentation
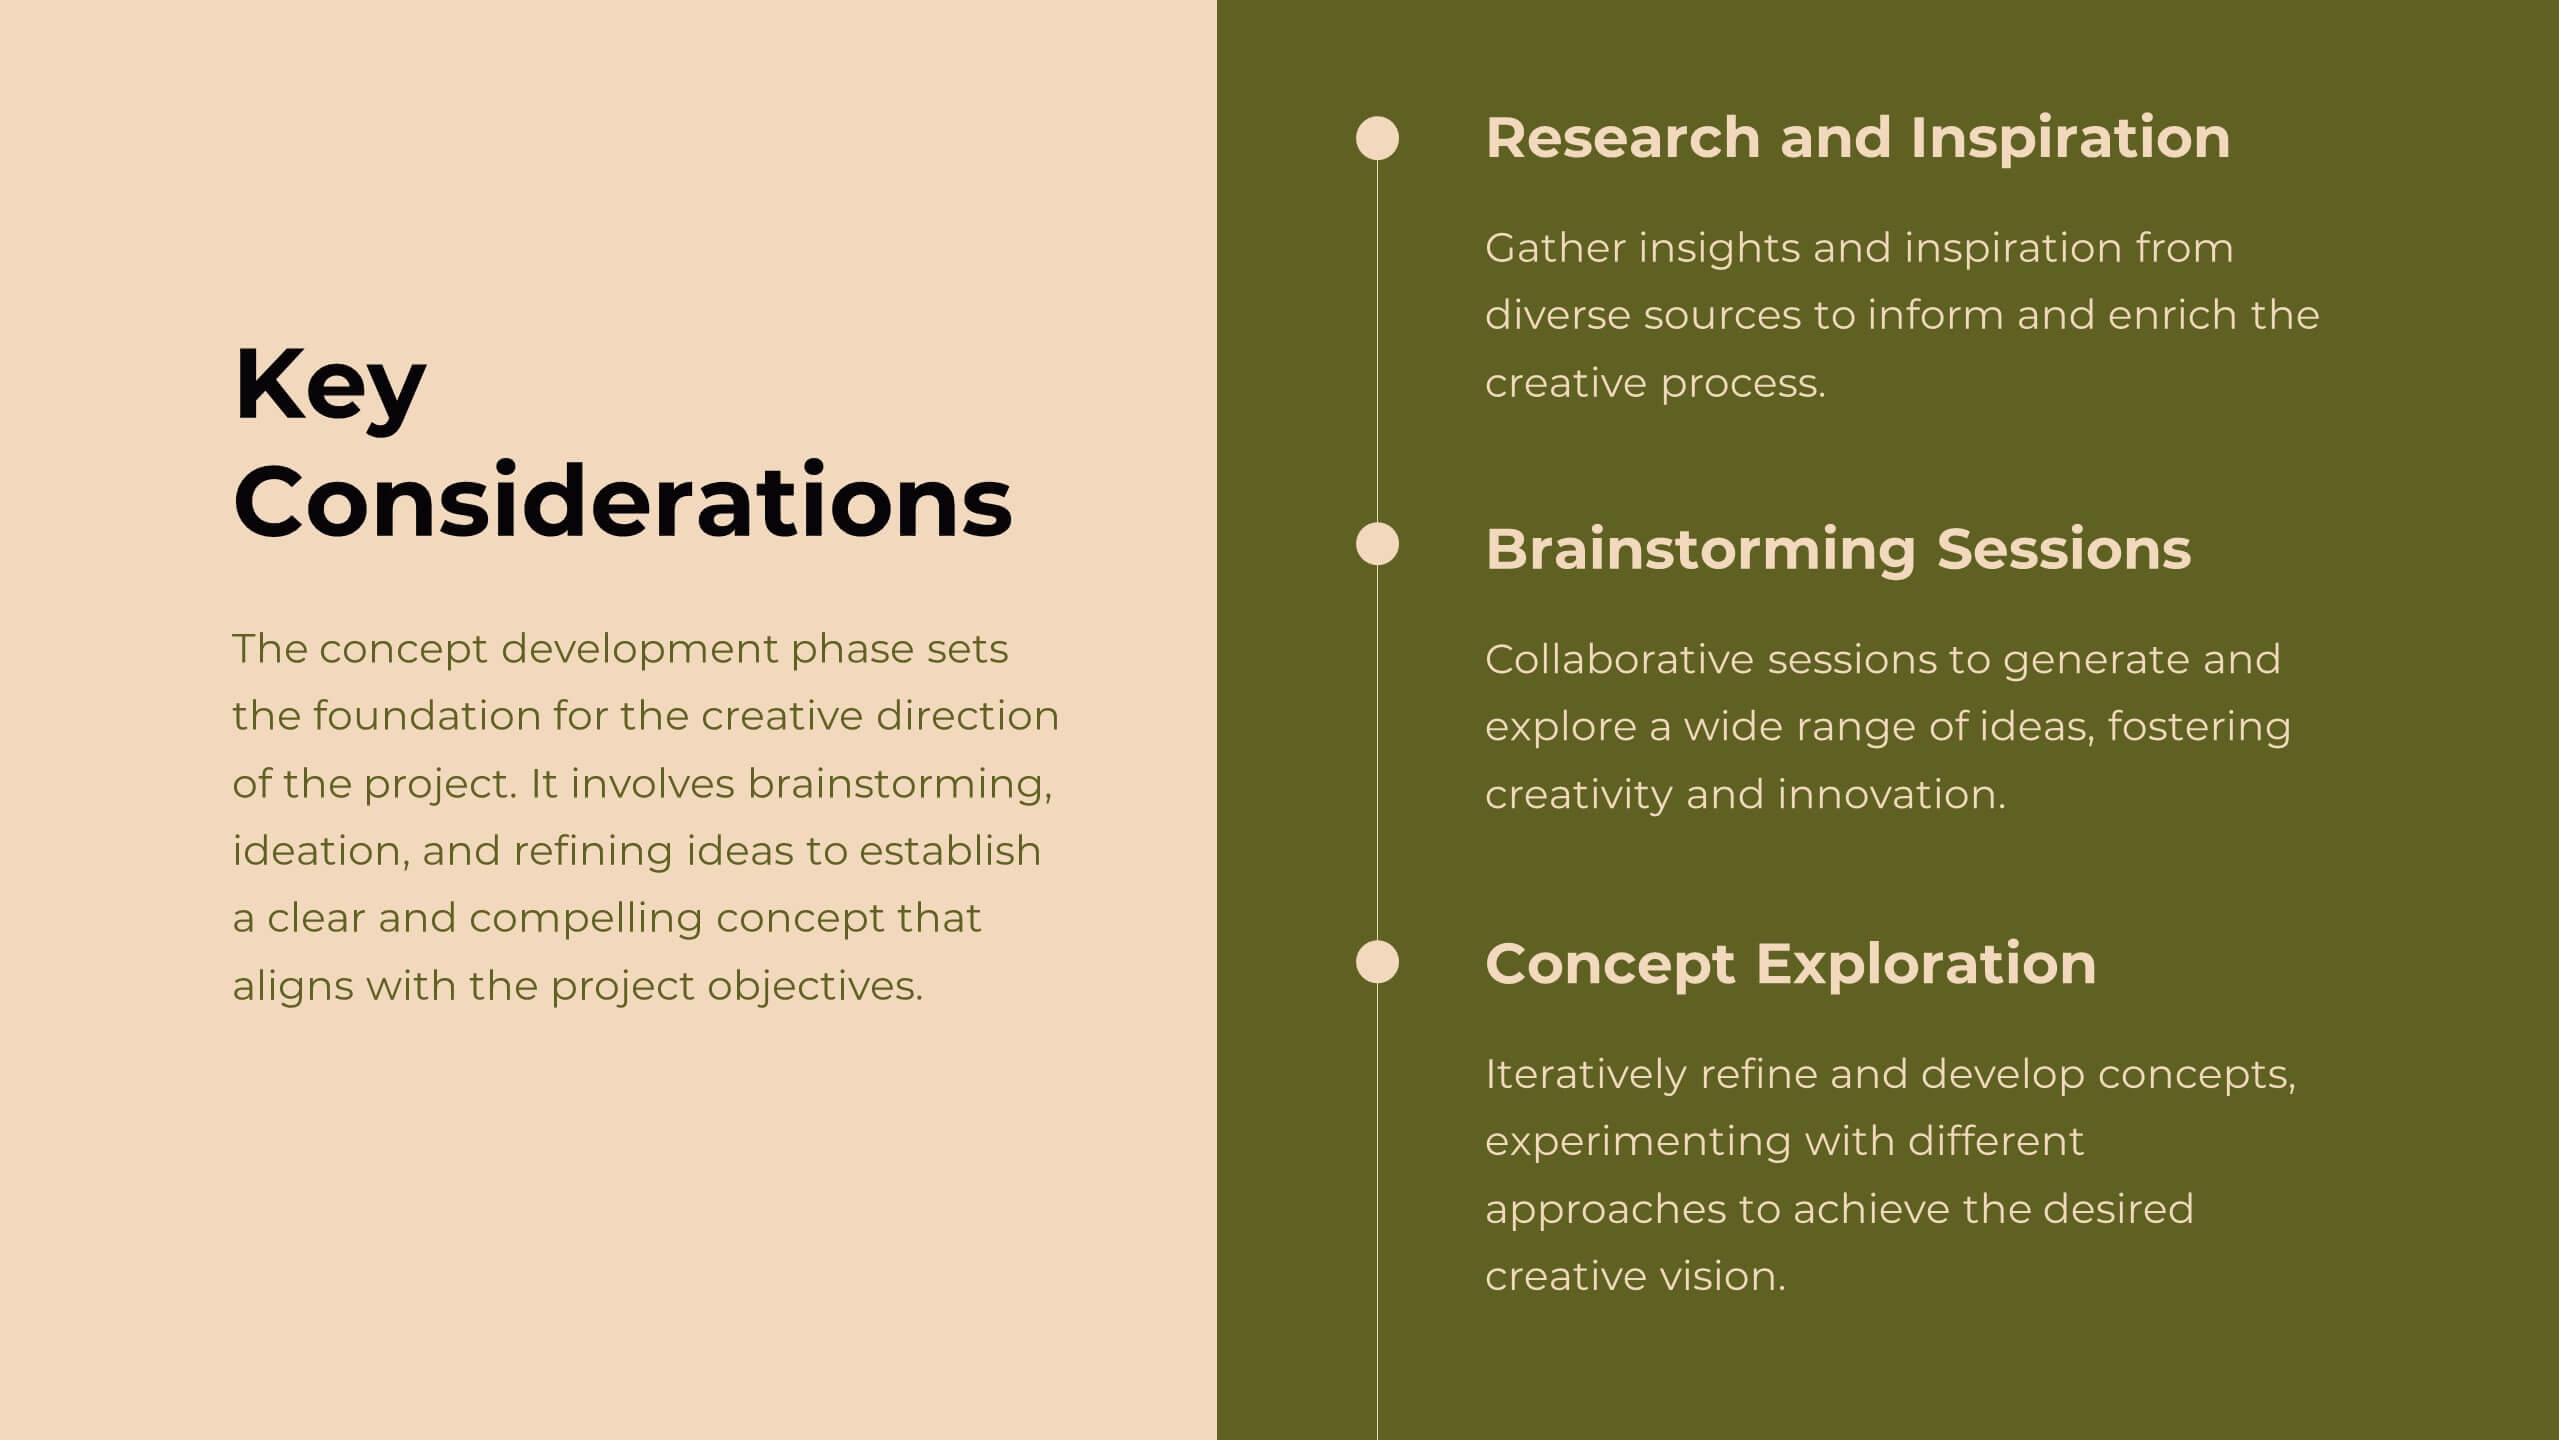
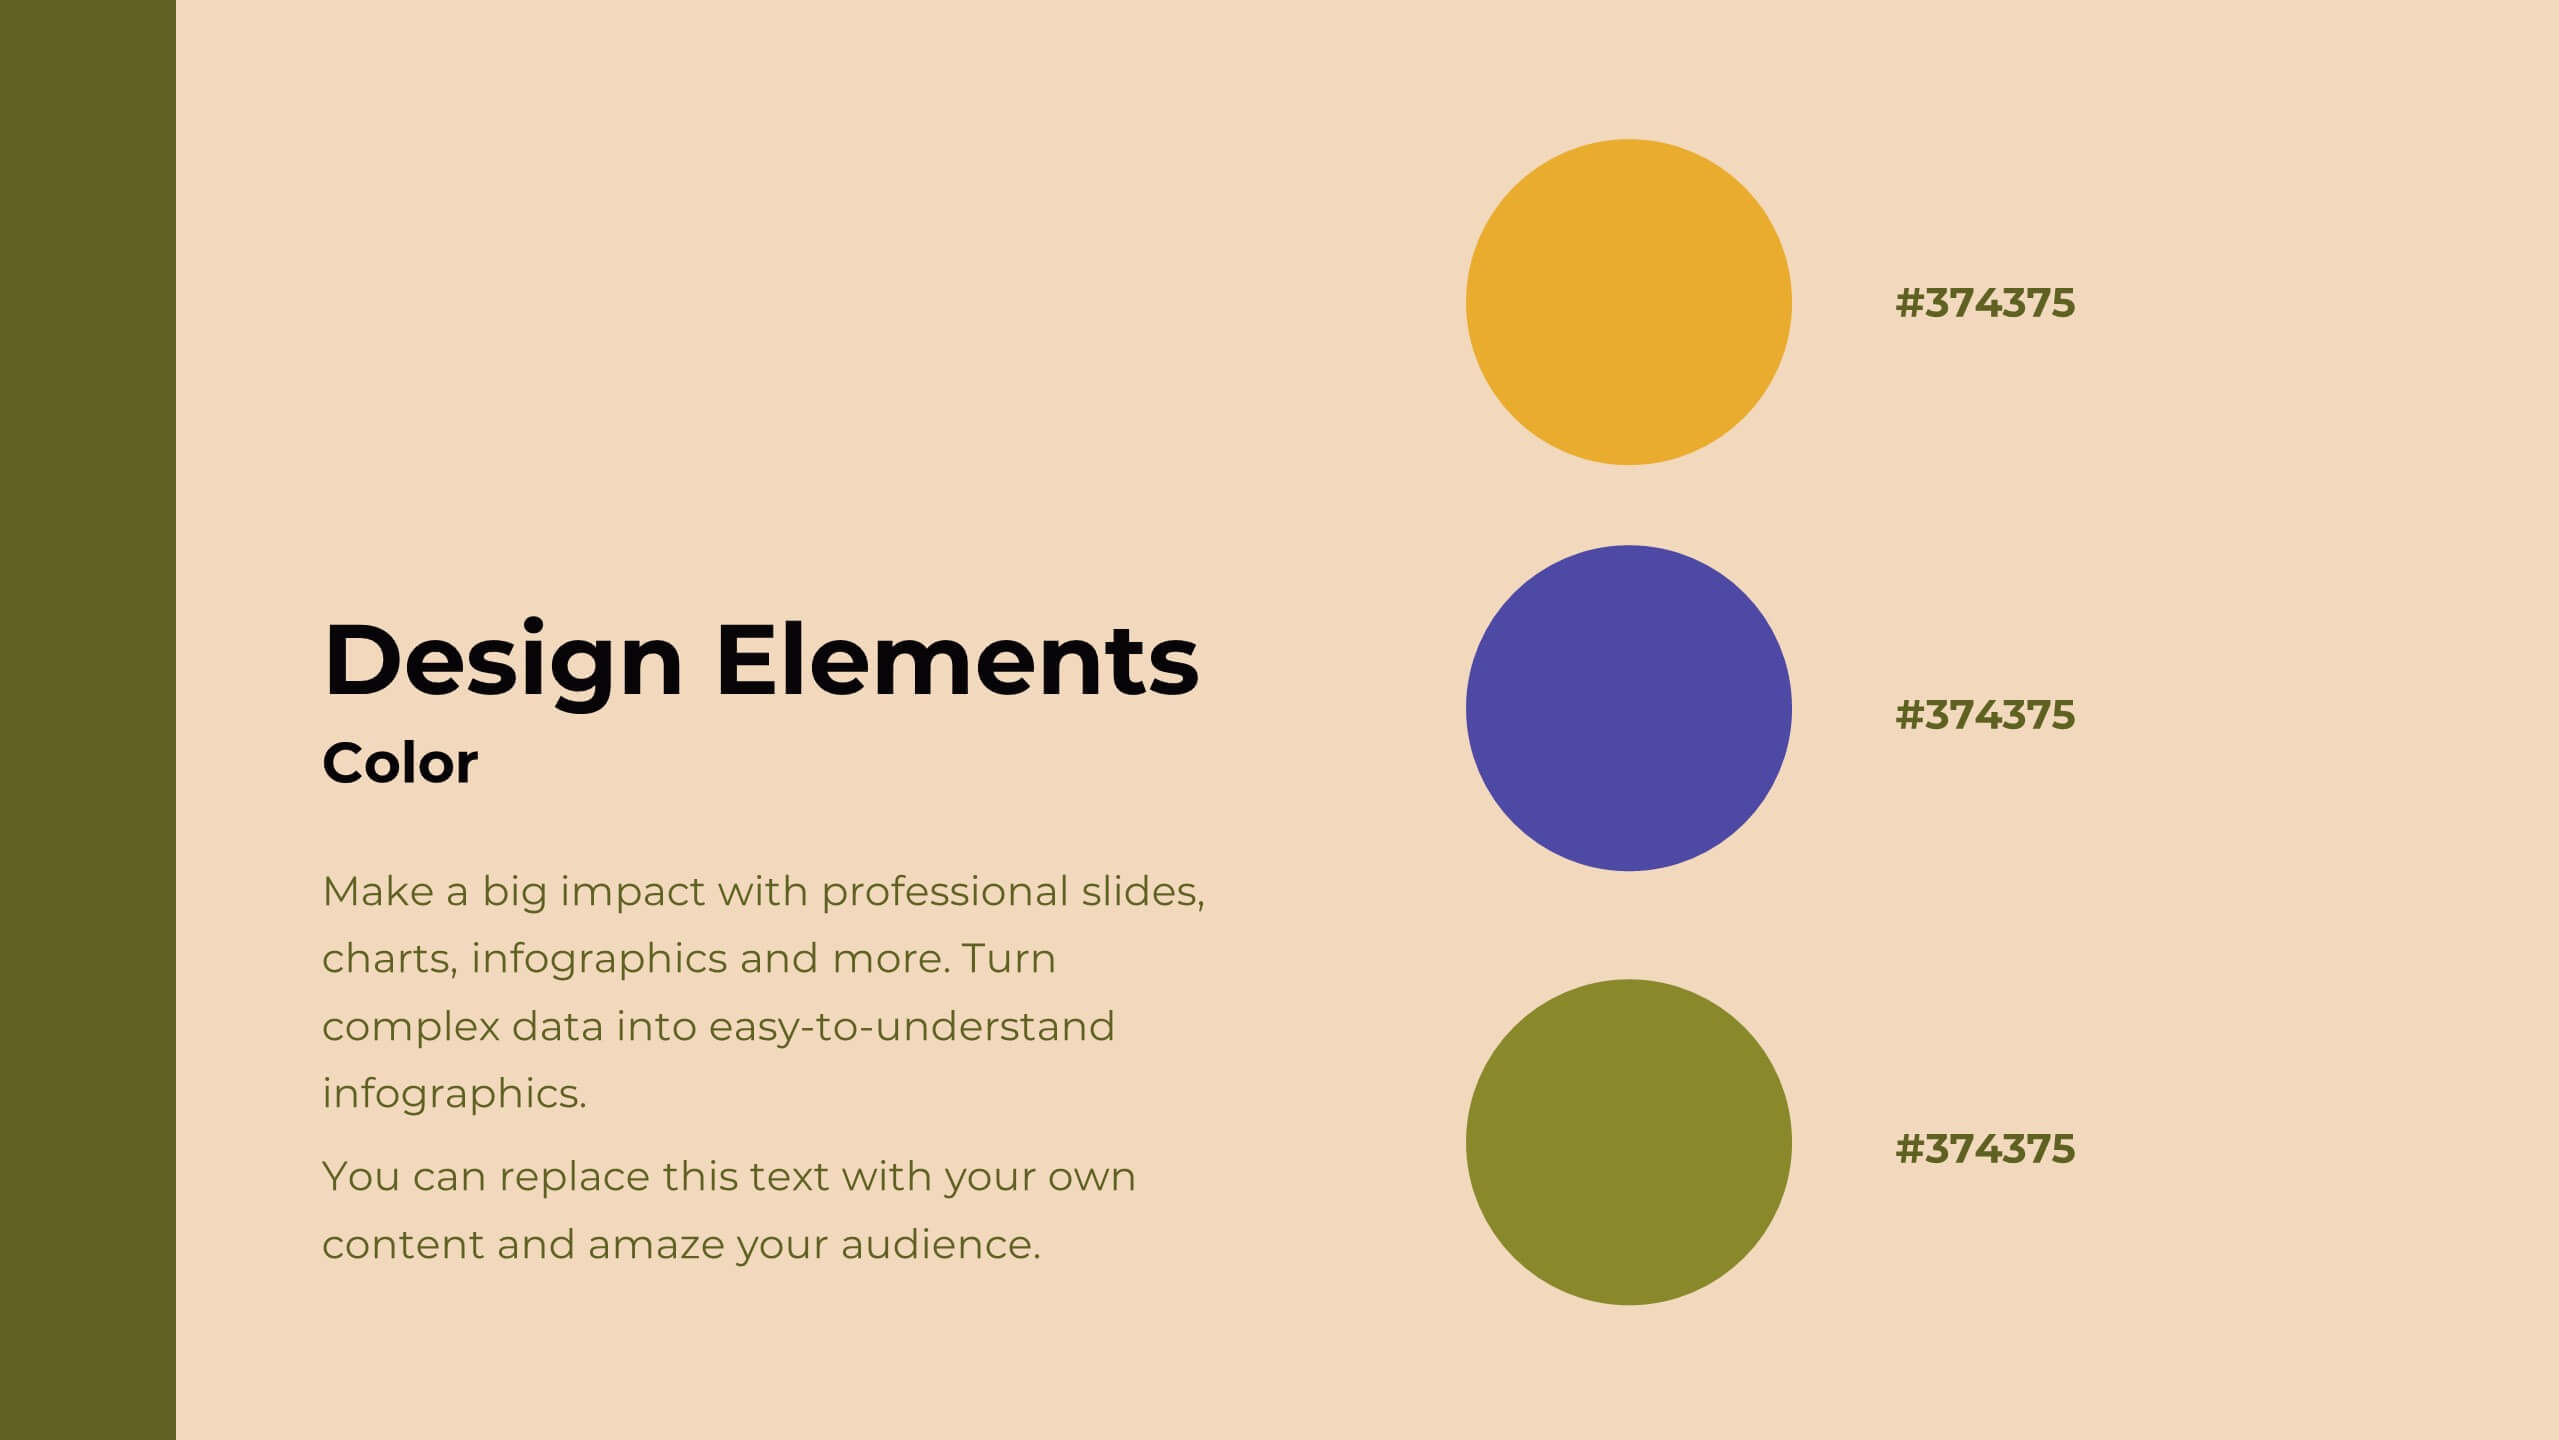
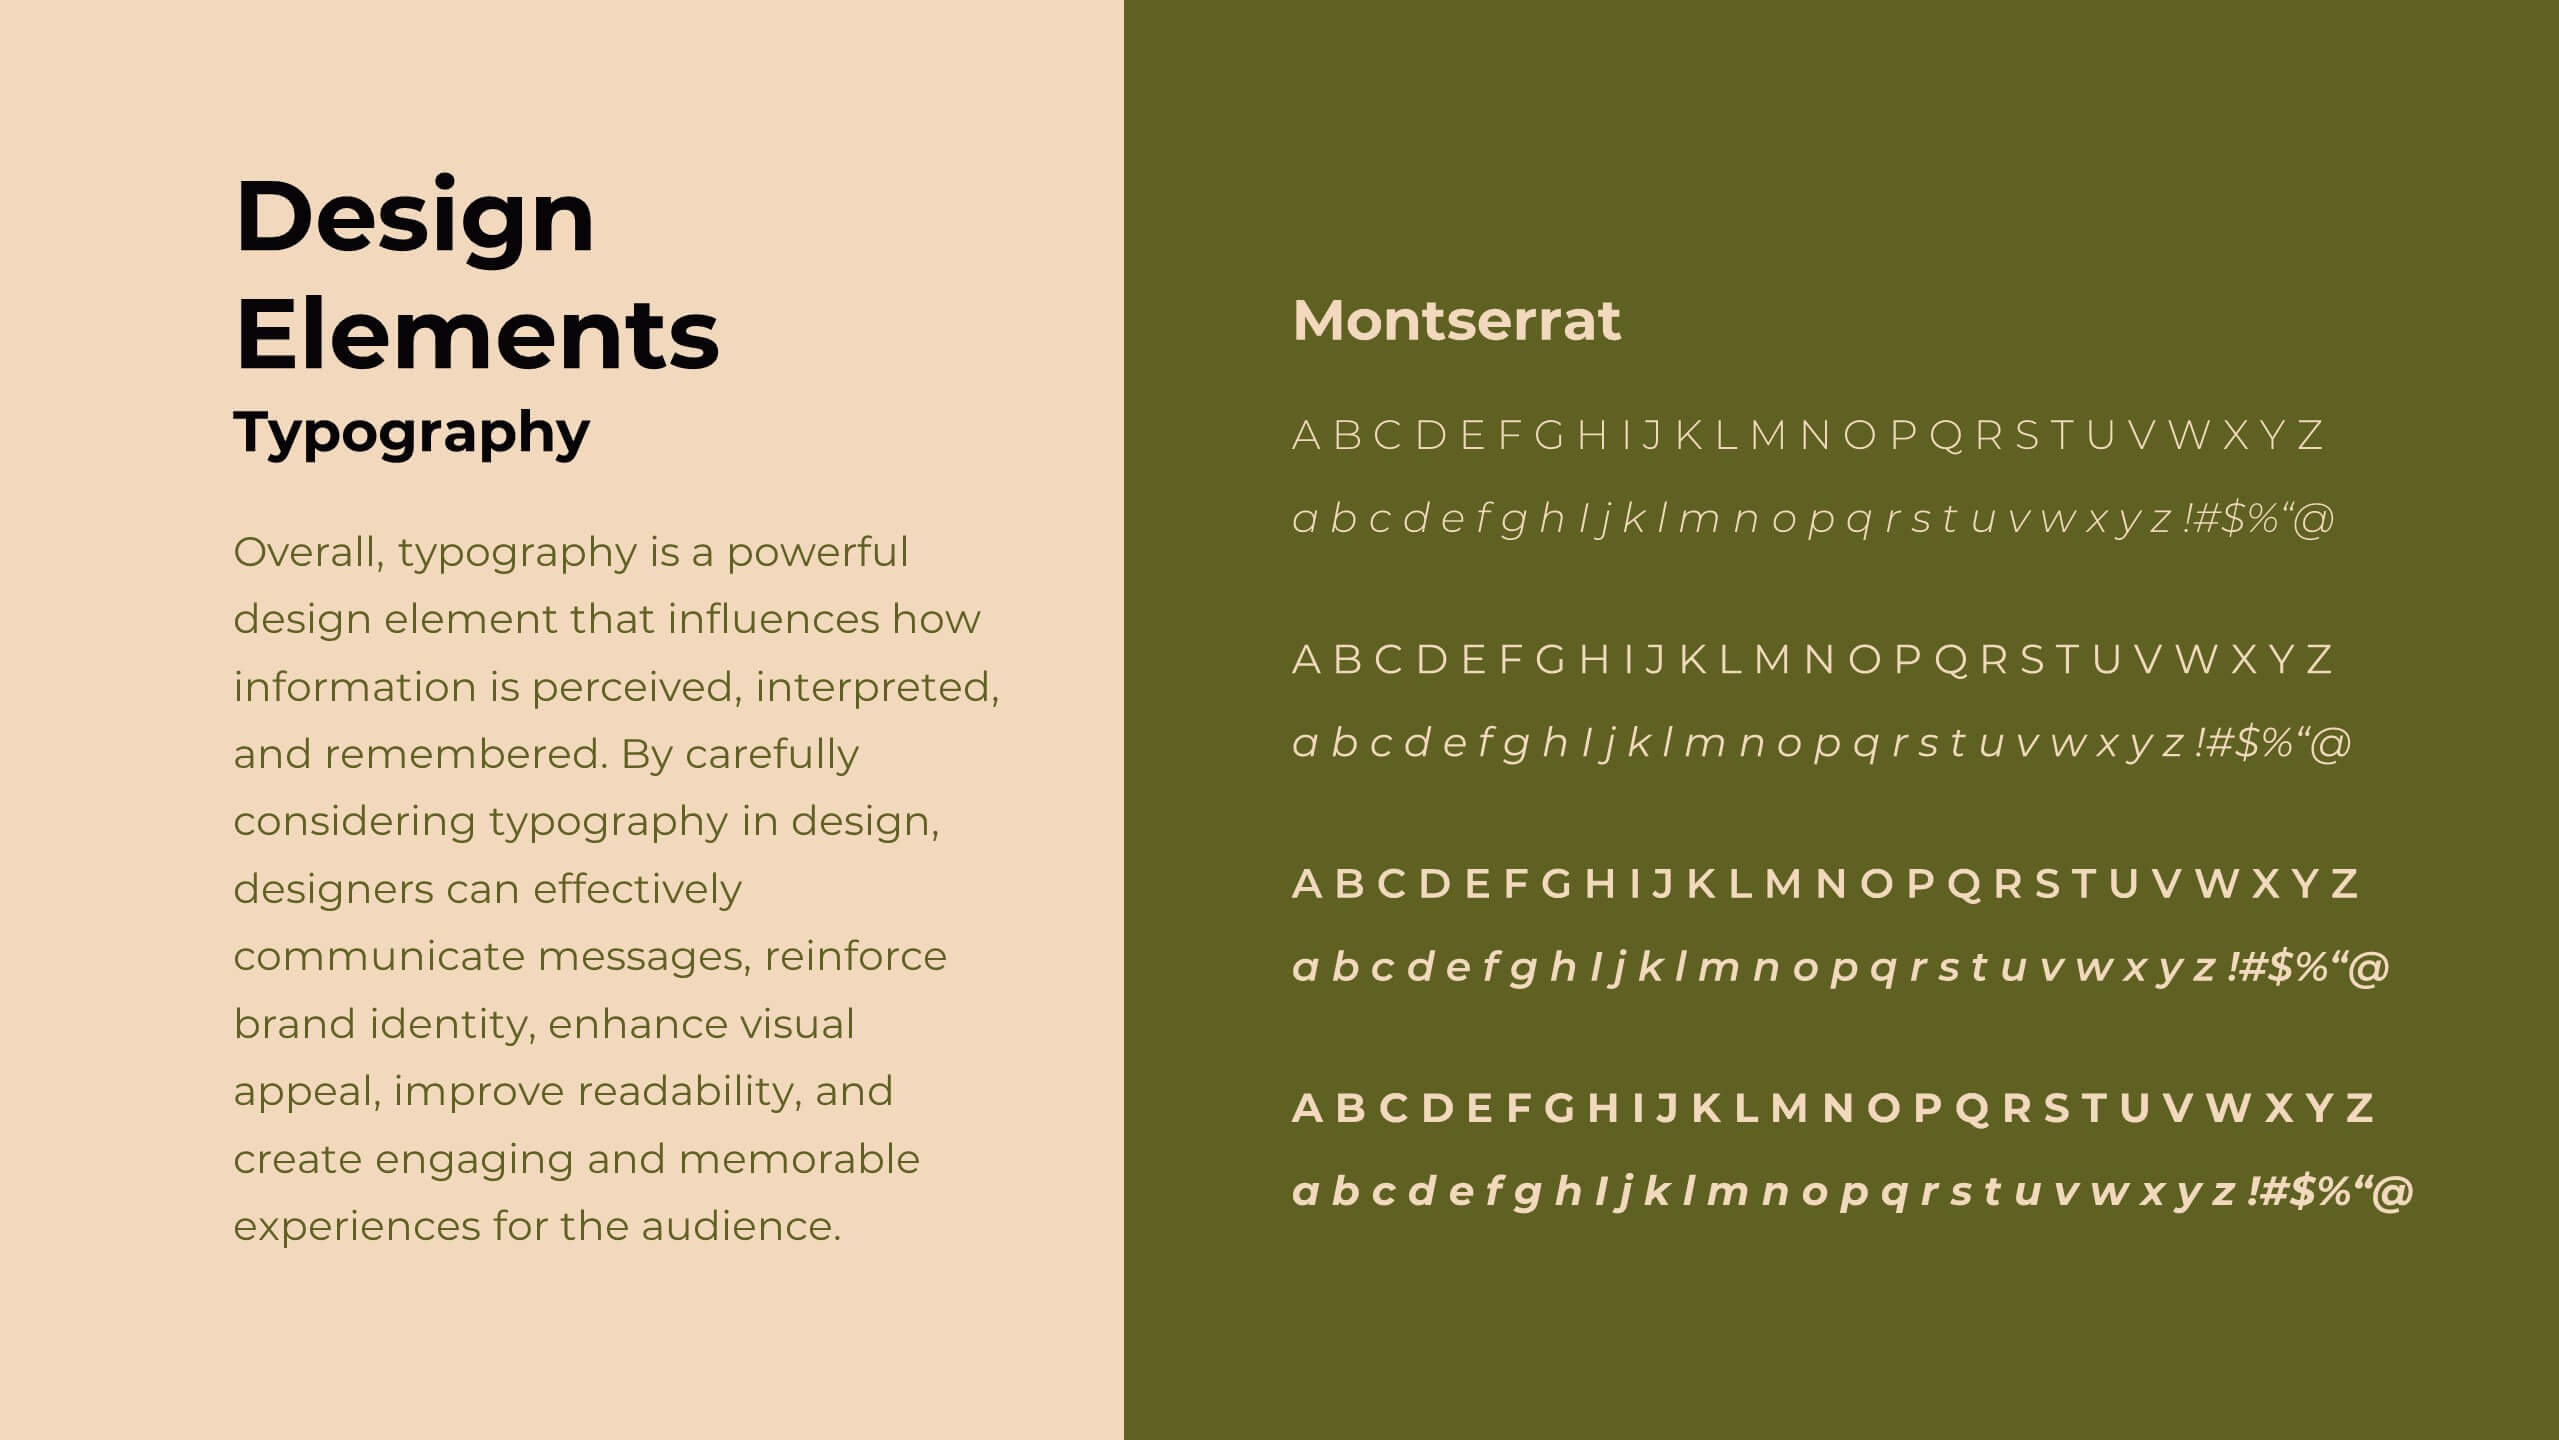
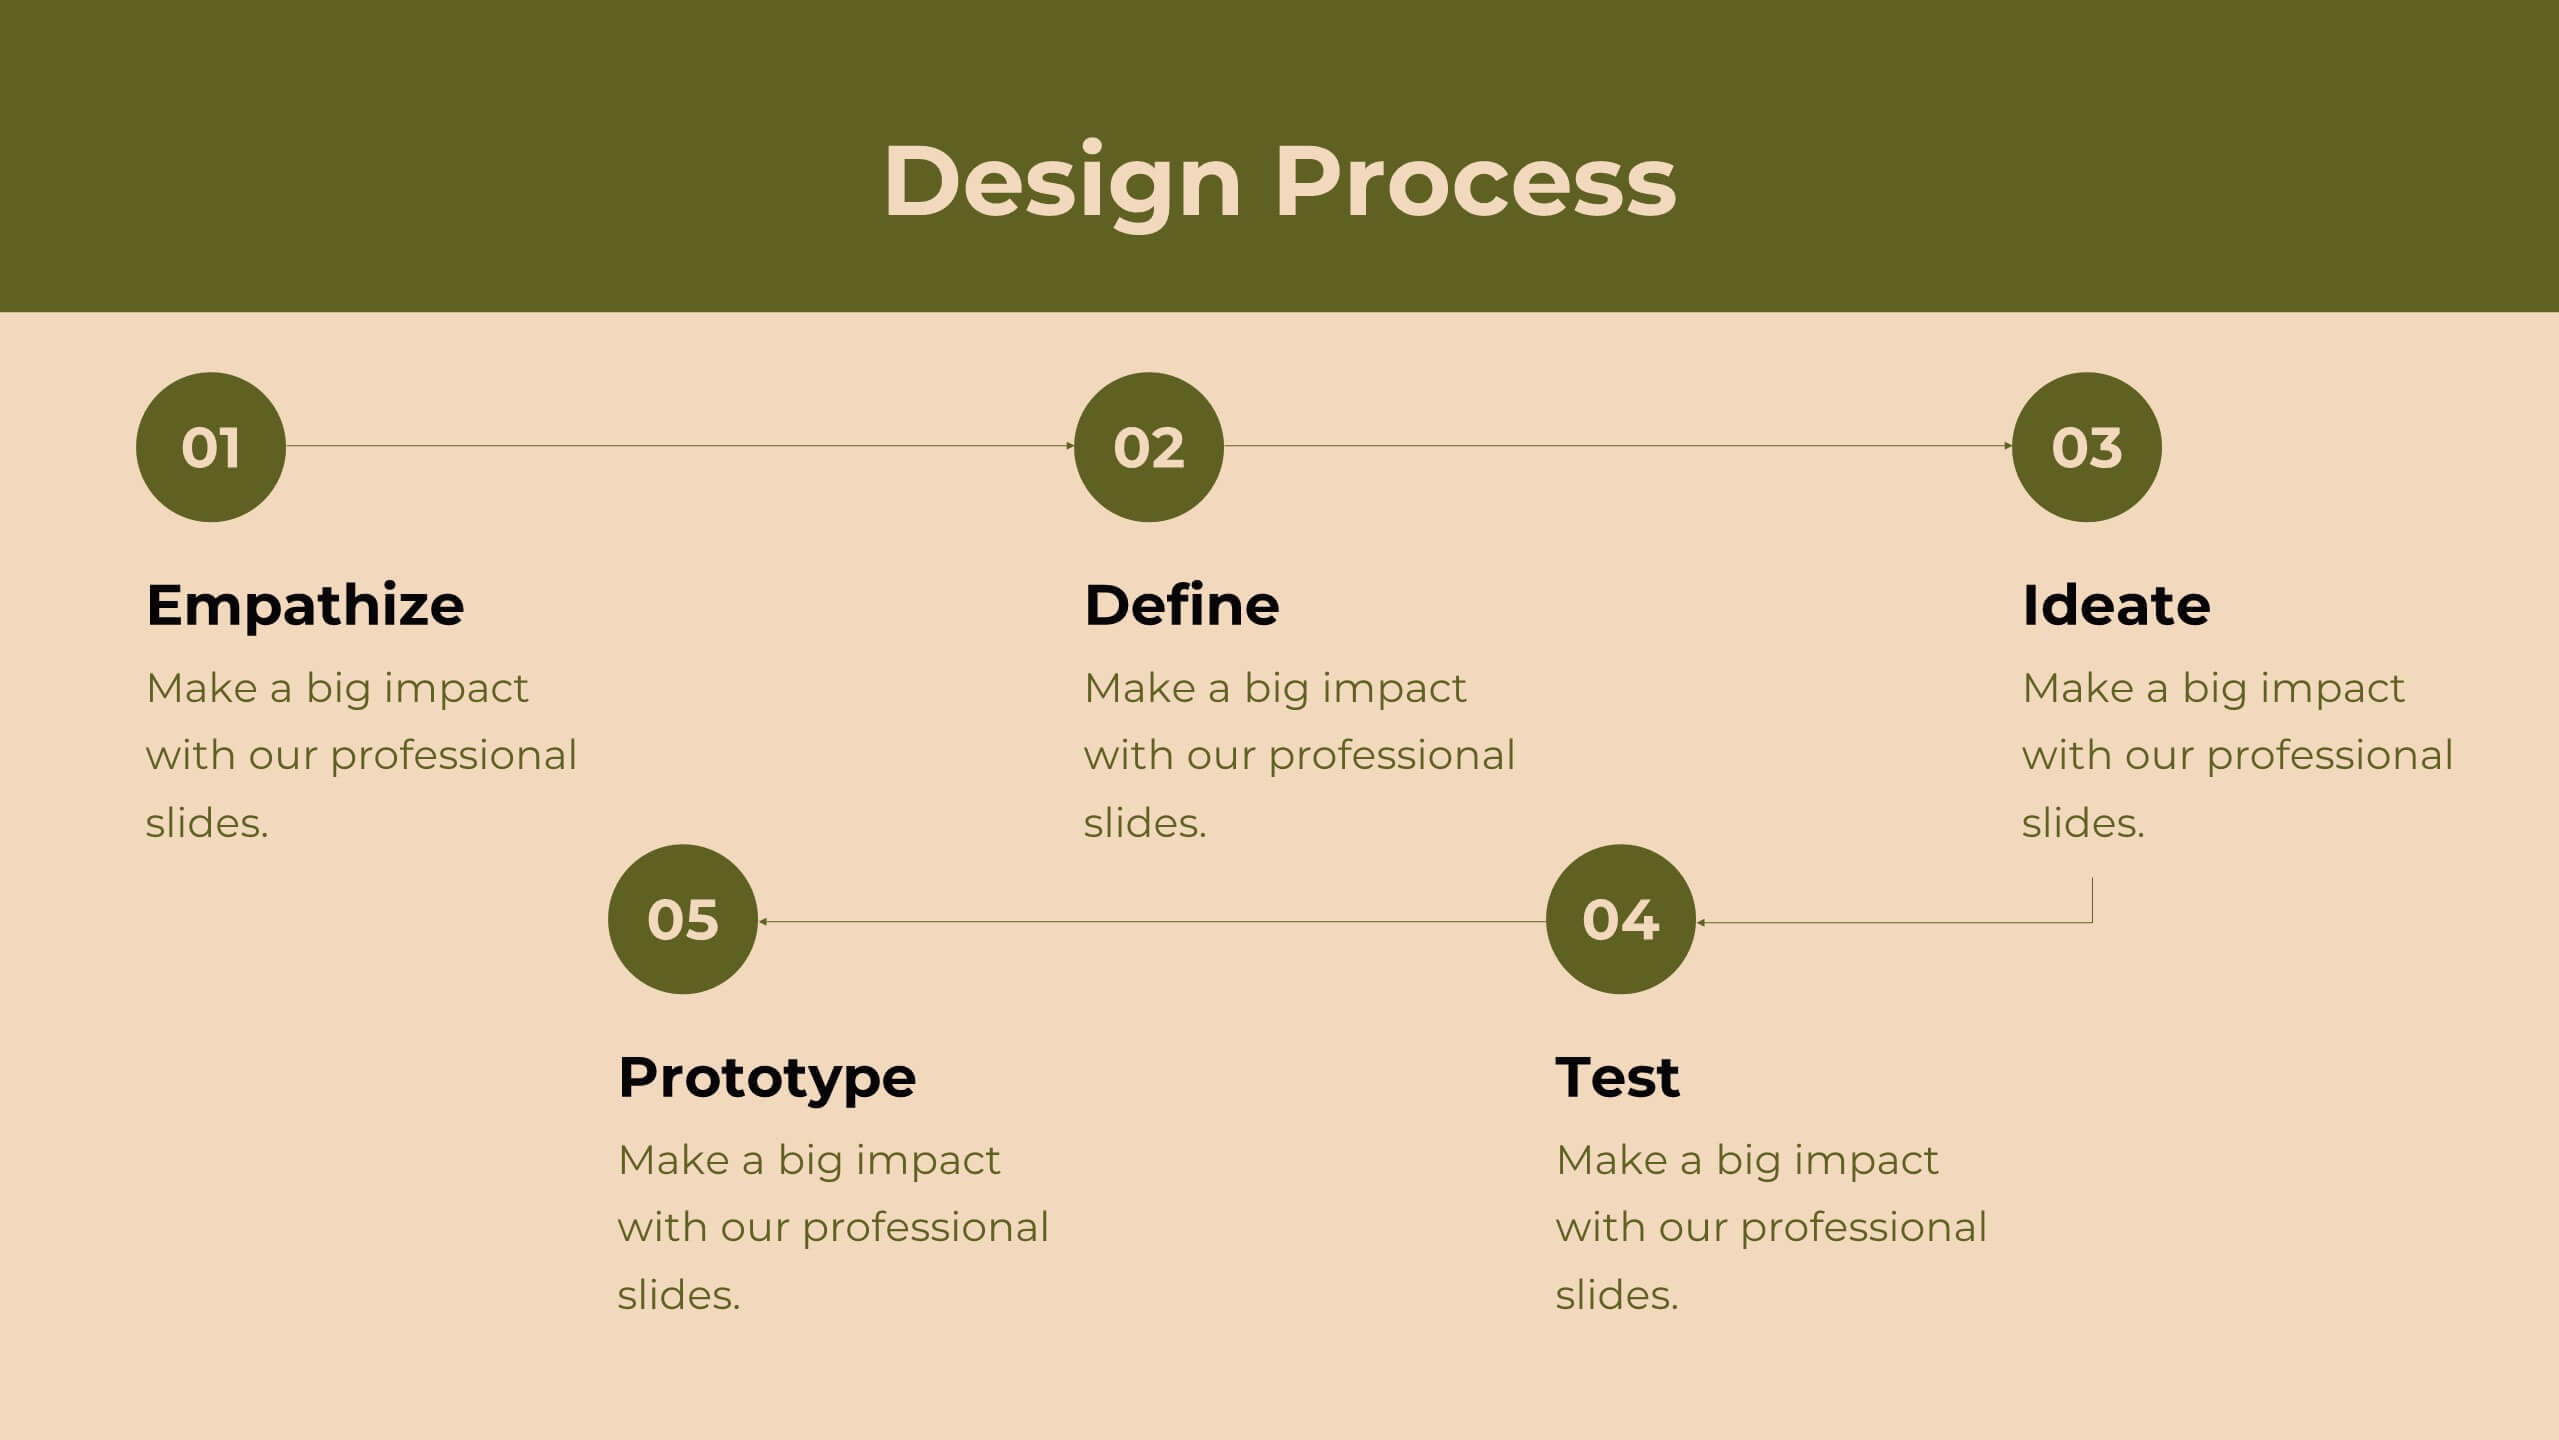
Transform your design strategy with this elegant proposal template! Perfect for presenting design briefs, target audience insights, and concept development. Ideal for designers and creative teams aiming to align vision and execution. Compatible with PowerPoint, Keynote, and Google Slides, this template ensures your design strategy is clear, professional, and compelling. Elevate your projects today!


6 slides
State-by-State Business Distribution Map Presentation
Visualize regional performance with this State-by-State Business Distribution Map template. Ideal for showcasing business coverage, sales territories, or demographic trends across the U.S. Each state is color-coded for clarity, with editable text and icons. Fully compatible with PowerPoint, Keynote, and Google Slides—perfect for executives, marketers, or analysts.


4 slides
IT Security Best Practices Presentation
Strengthen your digital defense with this IT Security Best Practices template. Designed for IT professionals, security teams, and business leaders, this slide visually presents key security measures, compliance protocols, and risk management strategies. Featuring a modern security framework with a step-by-step progression, it effectively illustrates data protection, encryption, and system resilience. Fully editable and compatible with PowerPoint, Keynote, and Google Slides for seamless customization.


6 slides
Process Cycle Wheel Slide Presentation
Give your workflow a visual rhythm with this clean, circular layout designed to highlight every stage of a process with clarity and style. Perfect for showcasing cycles, systems, or strategies, it keeps your message organized and engaging. Fully editable and compatible with PowerPoint, Keynote, and Google Slides.


2 slides
Small Business Success Illustrations
Get your business on the right track with our small business success illustrations pack! These illustrations will help you with your next business presentation and make it more engaging and catchy. Fully compatible with Powerpoint, Keynote, and Google Slides. You can use these in your website, blog or social media posts. Turn your vision into a reality—download the small business success illustrations pack today!


6 slides
Supply Chain Management Strategy Presentation
Enhance your logistics planning with the Supply Chain Management Strategy template. This visually structured design simplifies key supply chain components, from procurement to distribution, making it ideal for analysts and operations teams. Fully customizable and compatible with PowerPoint, Keynote, and Google Slides for a seamless and professional presentation experience.


2 slides
Engaging Opening Introduction Presentation
Make a lasting first impression with this Engaging Opening Introduction Slide. Designed for professional presentations, networking events, and business pitches, this slide offers a modern, structured layout with a dynamic image section and clear text area. Fully customizable in PowerPoint, Keynote, and Google Slides, you can easily adjust colors, fonts, and content to match your brand.


7 slides
Iceberg Model Infographic Presentation
Iceberg diagrams are versatile, multi-purpose infographics that can be used to show all the factors that will affect your company. It is a great way to visualize information and organize it into one place. With this template, you’ll have the perfect way to analyze your vision and drive growth. The iceberg is used to divide and give detailed information that can be valuable in planning your strategy. Analyze, evaluate and provide data on a specific product or service. This eye-catching template is compatible with PowerPoint, Keynote and Google Slides and includes customizable photo layouts.


23 slides
Ignifis Investor Pitch Presentation
Capture investor interest with this dynamic and professional pitch deck presentation template. It includes essential slides such as company overview, problem statement, revenue model, competitive landscape, financials, and growth projections. Designed for clarity and impact, it's fully customizable and perfect for securing funding. Compatible with PowerPoint, Keynote, and Google Slides.


7 slides
Bowtie Strategy Mapping Presentation
Turn your strategies into a clear visual roadmap with a bold, connected flow that highlights every stage of your process. This presentation helps you organize goals, actions, and outcomes in a structured, engaging layout. Fully editable and compatible with PowerPoint, Keynote, and Google Slides for seamless customization.


6 slides
Concept Web with Spider Diagram Layout Presentation
Map out complex ideas with clarity using the Concept Web with Spider Diagram Layout Presentation. This dynamic radial format is perfect for showing interrelated components, skills analysis, or performance metrics at a glance. Ideal for brainstorming, strategy, or education—fully editable in Canva, PowerPoint, Keynote, and Google Slides.


6 slides
Strategic Business Objective Mapping Presentation
Clearly define your strategic focus with this Strategic Business Objective Mapping slide. Designed to display six core objectives around a central theme, it’s ideal for visualizing business goals, departmental priorities, or key initiatives. Fully customizable in PowerPoint, Canva, and Google Slides for seamless team collaboration.


10 slides
Corporate Framework and Structure Presentation
Clearly define your corporate framework and structure with this professional infographic template. Ideal for executives, team leaders, and project managers, this slide visually organizes organizational hierarchy, roles, and key responsibilities in a clean and structured layout. Fully editable in PowerPoint, Keynote, and Google Slides, allowing seamless customization for your company's needs.


6 slides
Concept Matching Puzzle Infographic
Visualize interconnected ideas with the Concept Matching Puzzle Infographic Presentation. Shaped like a head silhouette, this infographic uses five interlocking puzzle pieces to highlight the synergy of concepts—ideal for training, teamwork, decision-making, or idea development. Each segment is icon-tagged and paired with text for clarity. Fully editable in PowerPoint, Keynote, and Google Slides.


5 slides
Brainstorming Spider Chart Presentation
Turn your ideas into action with a clean, modern design that keeps every thought connected and easy to follow. This presentation helps teams brainstorm, organize concepts, and refine strategies with clarity and flow. Fully editable and compatible with PowerPoint, Keynote, and Google Slides for seamless collaboration.