


Features
- 4 Unique slides
- Fully editable and easy to edit in Microsoft Powerpoint, Keynote and Google Slides
- 16:9 widescreen layout
- Clean and professional designs
- Export to JPG, PDF or send by email


Do you have any questions?
Recommend


6 slides
AIDA Diagram
The AIDA Diagram is a simple and effective marketing tool used to guide the design of advertising and promotional materials with the goal of attracting and retaining customers. AIDA stands for Attention, Interest, Desire, and Action, and it represents the four stages a potential customer goes through when exposed to marketing content. This infographic template is a classic marketing and advertising framework used to understand and guide the consumer's journey through the buying process. This infographic is completely customizable and compatible with Powerpoint, Keynote, and Google Slides.


7 slides
Safety Infographics Presentation Template
Our safety infographic is a visual representation of information related to safety, designed to present important safety concepts and practices in a simple and visually appealing way. Safety infographics are used to promote safety in various settings, such as workplaces, public spaces, schools, and homes. This template will present your information in the form of images, charts, graphs, and other visual elements. The main goal of our safety infographics is to help you increase safety awareness and promote safe behavior. Present safety information in an engaging and easily understandable format!


7 slides
Cognitive Psychology and Decision Making Presentation
Navigate the intricate relationship between thought processes and decision-making with our 'Cognitive Psychology and Decision Making' presentation template. Ideal for educators, psychologists, and business strategists, this template provides a structured way to explain how cognitive functions influence decisions. Enhance your next seminar or workshop with this visually engaging template, compatible with PowerPoint, Keynote, and Google Slides.


7 slides
Company Title Infographic
This collection of slides is designed to vividly present company profiles and services, utilizing a dynamic color palette of blue, yellow, and white to create an engaging viewer experience. Each slide is meticulously crafted to cater to specific content, enhancing the presentation's overall effectiveness and appeal. Starting with the "Empathy Map" slide, it offers a detailed insight into customer perceptions and experiences, essential for tailoring services to meet client needs. The "SEO Report" slide focuses on showcasing quantifiable data, critical for evaluating marketing success. A dedicated "Portfolio" slide highlights past achievements, pivotal for attracting potential clients and investors by demonstrating proven capability and success. Further slides like "What We Do" and "Objectives" provide clear, straightforward layouts that detail the company’s primary activities and strategic goals, respectively. The "Projects" slide offers a glimpse into current and prospective projects, illustrating ongoing development and future aspirations. Ideal for stakeholder briefings, marketing pitches, or internal reviews, these templates support companies in communicating a cohesive and comprehensive narrative of their operational scope and strategic direction.


6 slides
Targeted Segment Analysis and Mapping Presentation
Highlight your market focus with the Targeted Segment Analysis and Mapping Presentation. This circular layout is perfect for breaking down five audience segments, using subtle icons and visual emphasis for clarity. Ideal for marketers, strategists, and business analysts presenting niche targeting. Fully editable in Canva, PowerPoint, Keynote, and Google Slides.


4 slides
Brain Function Breakdown Chart Presentation
Bring clarity to complex thinking with a visual layout that highlights key mental processes in a clean, engaging way. This presentation helps you explain cognitive functions, organize insights, and break down information into easy-to-follow sections. Perfect for education, training, or research. Fully compatible with PowerPoint, Keynote, and Google Slides.


21 slides
Minoan Project Timeline Presentation
Step back in time with this beautifully crafted Minoan-inspired presentation, perfect for outlining your project timeline! With an elegant design and clear structure, this template helps you showcase key milestones, deadlines, and deliverables in a visually stunning way. Keep your project on track. Compatible with PowerPoint, Keynote, and Google Slides.


7 slides
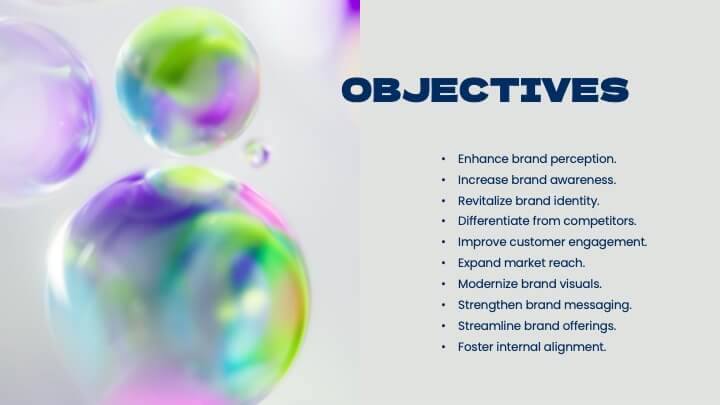
Objective Infographic Presentation Template
Our Objective Infographic template is designed to visually highlight the key points of a business plan and help you get your message across. With this template's simple layout and bold illustration, you can convey the most important parts of your plan in a way that is straightforward and compelling. This infographic template has been created to help you illustrate the key goal of your project. A clear and attractive infographic, this eye-catching template can be used to create interesting informative content. This will captivate your audience and keep them interested in what you have to say.


5 slides
Sports Performance Analysis Presentation
Visualize athletic metrics and improvement strategies with this Sports Performance Analysis slide layout. Designed around a dynamic running figure, it uses labeled circular markers (A–D) to clearly break down four key insights or action points. Perfect for sports reviews, training breakdowns, or coaching sessions. Fully editable in PowerPoint, Keynote, and Google Slides.


22 slides
Simple Pitch Deck Presentation
Streamline your pitch process with this no-frills Pitch Deck template, designed for clear communication and powerful impact. From the get-go, the cover slide clearly announces your purpose, inviting audiences into your business narrative. The template smoothly transitions from one slide to the next, each one a stepping stone in building your case — from problem to solution. It includes a neatly organized table of contents, thought-provoking mission and vision statements, and data-rich slides for a deep dive into your business metrics. Each section, marked with bold, numbered headers, keeps your presentation on track and your audience engaged. A final 'Thank You' slide adds a touch of professionalism, and the credits section ensures that your sources are transparently acknowledged. This pitch deck is ideal for startups and businesses looking to capture attention and convey their story succinctly.


5 slides
Breast Cancer Prevention Infographics
Breast Cancer is a serious disease that affects millions of people worldwide. These infographics are visual representations of information that provide tips and strategies to help prevent breast cancer. These infographics include statistics about breast cancer, risk factors, and preventative measures that can be taken to reduce the risk of developing the disease. You can also use these to provide information on screening and early detection, such as mammograms and self-exams. The visuals in these infographics may include icons, images, graphs, and charts to make the information easy to understand.


10 slides
Process Flow Chart Presentation
Visualize your process with clarity using the Process Flow Chart Presentation. Featuring a central hexagon design branching out into four sequential steps, this layout is perfect for showcasing workflows, procedures, or business strategies. Color-coded options and dark/light theme variations add versatility. Fully customizable in PowerPoint, Keynote, and Google Slides.


6 slides
Social Science Infographics
The "Social Science" infographic template is an intellectually stimulating and visually engaging tool, thoughtfully designed for PowerPoint, Keynote, and Google Slides. This template is a brilliant resource for educators, researchers, and students who seek to present the multifaceted aspects of social sciences in a clear and compelling manner. This template skillfully encompasses various disciplines within social science, such as anthropology, sociology, psychology, and political science. It presents key theories, methodologies, and findings in an organized and digestible format. This makes it an invaluable aid for academic presentations, research proposals, or educational discussions, facilitating a deeper understanding of human society and social relationships. The design is as thought-provoking as the subject it represents, with a color scheme that stimulates intellectual curiosity while maintaining clarity and focus. This not only enhances the visual appeal of the presentation but also complements the analytical and reflective nature of social science. Whether used in a lecture hall, a conference, or a study group, this template ensures that the complex world of "Social Science" is presented in an engaging, informative, and visually captivating manner.


23 slides
Fama Business Idea Pitch Deck Presentation
Present your business idea with this impactful pitch deck, covering key areas like problem statement, solutions, competitive landscape, financials, and growth projections. With a bold design, it effectively showcases your startup’s value proposition. Compatible with PowerPoint, Keynote, and Google Slides for dynamic and professional investor presentations.


4 slides
Idea Generation for Business Development Presentation
Visualize your brainstorming process with this dynamic lightbulb-themed slide. Perfect for showcasing strategic thinking, innovation pipelines, or development stages. With colorful icons and space for four key points, it’s easy to tailor in PowerPoint, Keynote, or Google Slides. Ideal for entrepreneurs, startups, and corporate ideation sessions. Clean, modern, and impactful.


5 slides
Movie Ages and Eras Infographics
Movies can be categorized into different ages and eras based on various factors such as technological advancements, storytelling techniques, cultural influences, and industry trends. This infographic template explores the different ages and eras in the history of cinema. It provides an overview of significant periods and movements in filmmaking, allowing viewers to understand the evolution and impact of movies over time. This template is perfect for film enthusiasts, students of film studies, or anyone interested in exploring the history and evolution of cinema. Compatible with Powerpoint, Keynote, and Google Slides.


7 slides
Process Table Infographic
Unveil the intricacies of any process with our process table slide infographic. Situated on a clean white base, the design flourishes with a spectrum of green for growth, purple for innovation, blue for consistency, and orange. With its detailed infographics, symbolizing icons, and flexible image placeholders, this template offers a structured representation of step-by-step processes, from initiation to completion. Perfectly calibrated for Powerpoint, Keynote, or Google Slides. An indispensable tool for business analysts, operations managers, educators, or anyone looking to streamline and visualize processes.