


Features
- 6 Unique slides
- Fully editable and easy to edit in Microsoft Powerpoint, Keynote and Google Slides
- 16:9 widescreen layout
- Clean and professional designs
- Export to JPG, PDF or send by email


Do you have any questions?
Recommend


6 slides
Network Solution Infographic
Network Solution refers to a system of interconnected components or entities that work together to achieve a specific purpose, whether that's communication, collaboration, or something else. This infographic template can be a powerful way to visually represent various aspects of a network, whether it's a computer network, social network, or any interconnected system. This is fully customizable and compatible with Powerpoint, Keynote, and Google Slides. This allows you to keep the infographic visually appealing, informative, and easy to understand. The goal is to help your audience grasp complex network concepts at a glance.


8 slides
Simplified Step-by-Step Process Plan Presentation
Break complex workflows into clear, manageable steps with the Simplified Step-by-Step Process Plan Presentation. Designed with a clean vertical timeline and alternating flag-style indicators, this template guides viewers through four distinct phases—ideal for process explanations, onboarding flows, or project milestones. Each step features a matching icon and space for concise descriptions to keep your message clear and structured. Fully editable in PowerPoint, Keynote, and Google Slides.


5 slides
Energy and Natural Resources Infographics
Energy and natural resources are essential components of modern societies and economies. These vertical infographics are designed to showcase key information about energy sources, natural resources, and their impact on the environment. This template is ideal for educational purposes, awareness campaigns, environmental organizations, and companies in the energy sector. The visuals display the different types of renewable energy, such as solar, wind, hydro, geothermal, and biomass, along with their benefits and growth potential. This is fully customizable and compatible with Powerpoint, Keynote, and Google Slides.


5 slides
Investment Strategy and Growth Planning Presentation
Visualize your growth strategy using this clean and modern infographic layout. Each pawn-shaped graphic highlights key steps in your investment plan, ideal for financial planning, business development, or progress tracking. Fully customizable in PowerPoint, Google Slides, and Keynote—perfect for presenting strategic priorities and actionable insights with visual impact.


5 slides
Key Data and Performance Numbers Slide
Visualize data with impact using the Key Data and Performance Numbers Slide Presentation. This infographic-style layout features a central pie chart and five bold percentage callouts, making it ideal for presenting insights, progress, or KPIs. Easily customize the colors, titles, and text in PowerPoint, Keynote, or Google Slides.


21 slides
Mythspire Market Research Presentation
This market research template offers a clean design for presenting objectives, data collection, analysis, and findings. Perfect for showcasing research methodologies, visualizations, and actionable recommendations. Fully customizable and ideal for business or academic presentations. Compatible with PowerPoint, Keynote, and Google Slides.


6 slides
Thank You Note Infographic
Make every thank you memorable with this stylish template, designed to elevate your messages of gratitude. Each slide combines bold design elements, vibrant colors, and thoughtful layouts to ensure your message not only conveys thanks but also leaves a lasting impact. Customize the slides to match any occasion, from professional acknowledgements to personal notes of appreciation. Ideal for anyone looking to express gratitude with a modern twist, this template suits a variety of contexts—celebrating team achievements, thanking customers for their business, or acknowledging event attendees. Its flexibility allows it to fit seamlessly into both digital and print mediums, enhancing emails, social media posts, or traditional thank you cards. Add a personal touch to your expressions of thanks, creating a distinctive and engaging experience that strengthens connections and underscores your appreciation with elegance and flair.


4 slides
Business Planning Framework Presentation
Turn big ideas into actionable strategies with this modern and structured presentation layout. Perfect for mapping goals, aligning priorities, and showcasing step-by-step planning processes, it helps you communicate strategy with clarity and confidence. Fully editable and compatible with PowerPoint, Keynote, and Google Slides for easy customization and professional results.


6 slides
Multi-Layer Diagram Presentation
Illustrate Complex Processes with Ease using this Multi-Layer Diagram Presentation template. Designed for business strategies, IT architectures, data structures, and organizational hierarchies, this layered diagram helps break down multi-step processes in a clear and structured way. Fully customizable and available for PowerPoint, Keynote, and Google Slides, this template ensures your message is both impactful and visually appealing.


20 slides
Solar Beam Sales Proposal Presentation
Supercharge your sales presentation with the Solar Beam Sales Proposal template! This vibrant and dynamic template is designed to capture attention and drive home your key points with flair. Start with a bold introduction, then seamlessly guide your audience through your company overview, product/service details, and target market analysis. Highlight your sales objectives, showcase your team, and provide compelling customer testimonials. With dedicated slides for pricing strategies, sales collateral, and performance metrics, you’ll have all the tools you need to make a persuasive pitch. The template also includes sections for discussing future opportunities, action plans, and a Q&A session to address any final questions. Its modern, professional design ensures that your proposal stands out in any setting. Fully customizable and compatible with PowerPoint, Keynote, and Google Slides, this template is your go-to for creating impactful sales presentations that leave a lasting impression.


6 slides
Market Trends Heat Map Visualization Presentation
Analyze market trends with an intuitive heat map infographic. This visualization helps identify patterns, strengths, and risks using color-coded data blocks. Perfect for financial analysis, competitive research, and industry forecasting. Fully customizable and compatible with PowerPoint, Keynote, and Google Slides for seamless integration into your presentations.


26 slides
Summer Sale Presentation
Soak up the bright, sunny vibes of a presentation template that’s perfectly tailor-made for the lively summer season. Its radiant design, infused with the essence of summer sales and tropical aesthetics, is a perfect match for retail campaigns, travel promotions, or any topic that aims to bring the sizzle of summer into a room. Bright colors, playful graphics, and beach-inspired backgrounds set the stage for vibrant storytelling, whether you're introducing a seasonal team, showcasing hot vacation spots, or highlighting the latest summer fashion. The template not only captures the casual, cheerful spirit of the season but also ensures that your content makes a splash with clear, concise data displays and infographics. It’s a breeze to use across various platforms like PowerPoint, Keynote, and Google Slides, ensuring your summer message is as refreshing as a cool ocean wave.


8 slides
Machine Learning Overview Presentation
The "Machine Learning Overview" presentation template features a central circular design that effectively illustrates the interconnectedness of various components in machine learning processes. Each segment of the circle is dedicated to a key area such as data acquisition, algorithm development, model training, validation, and deployment, which are critical to understanding and executing machine learning projects. This visual arrangement makes it easy to follow and is ideal for educational environments or professional settings where clarity and concise information delivery are essential.


5 slides
Agile Scrum Task Board Workflow Presentation
Simplify your Agile process with this task board workflow diagram. Clearly outline backlog, sprint planning, task execution, and delivery steps in a visually engaging format. Perfect for Agile teams, project managers, or software developers. Fully customizable in PowerPoint, Keynote, and Google Slides to fit your sprint and scrum documentation needs.


21 slides
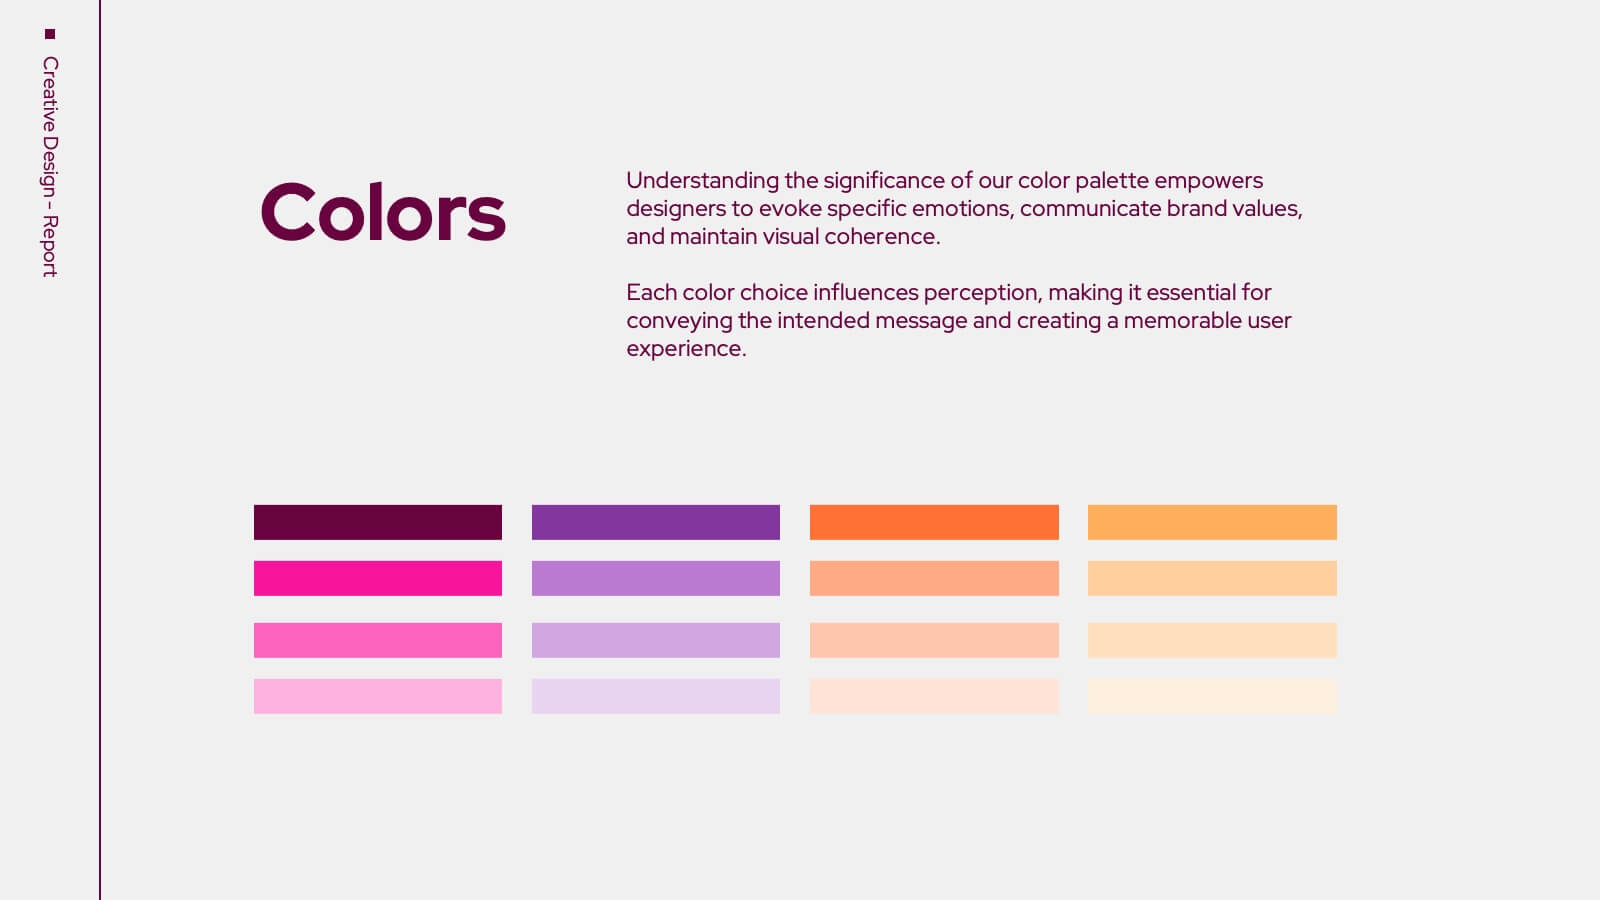
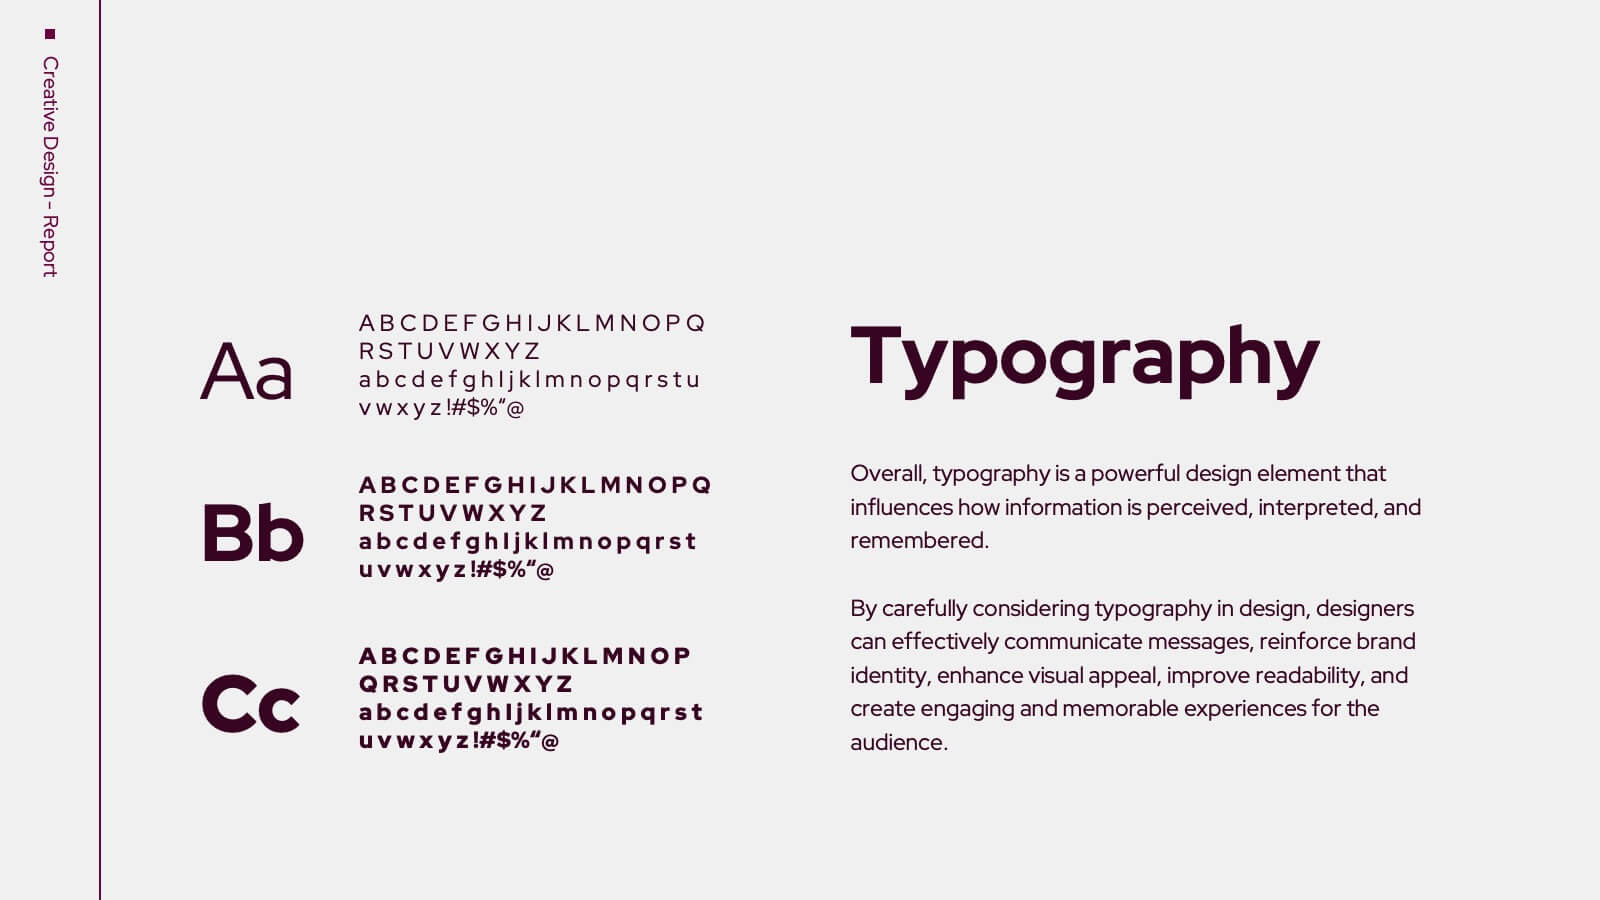
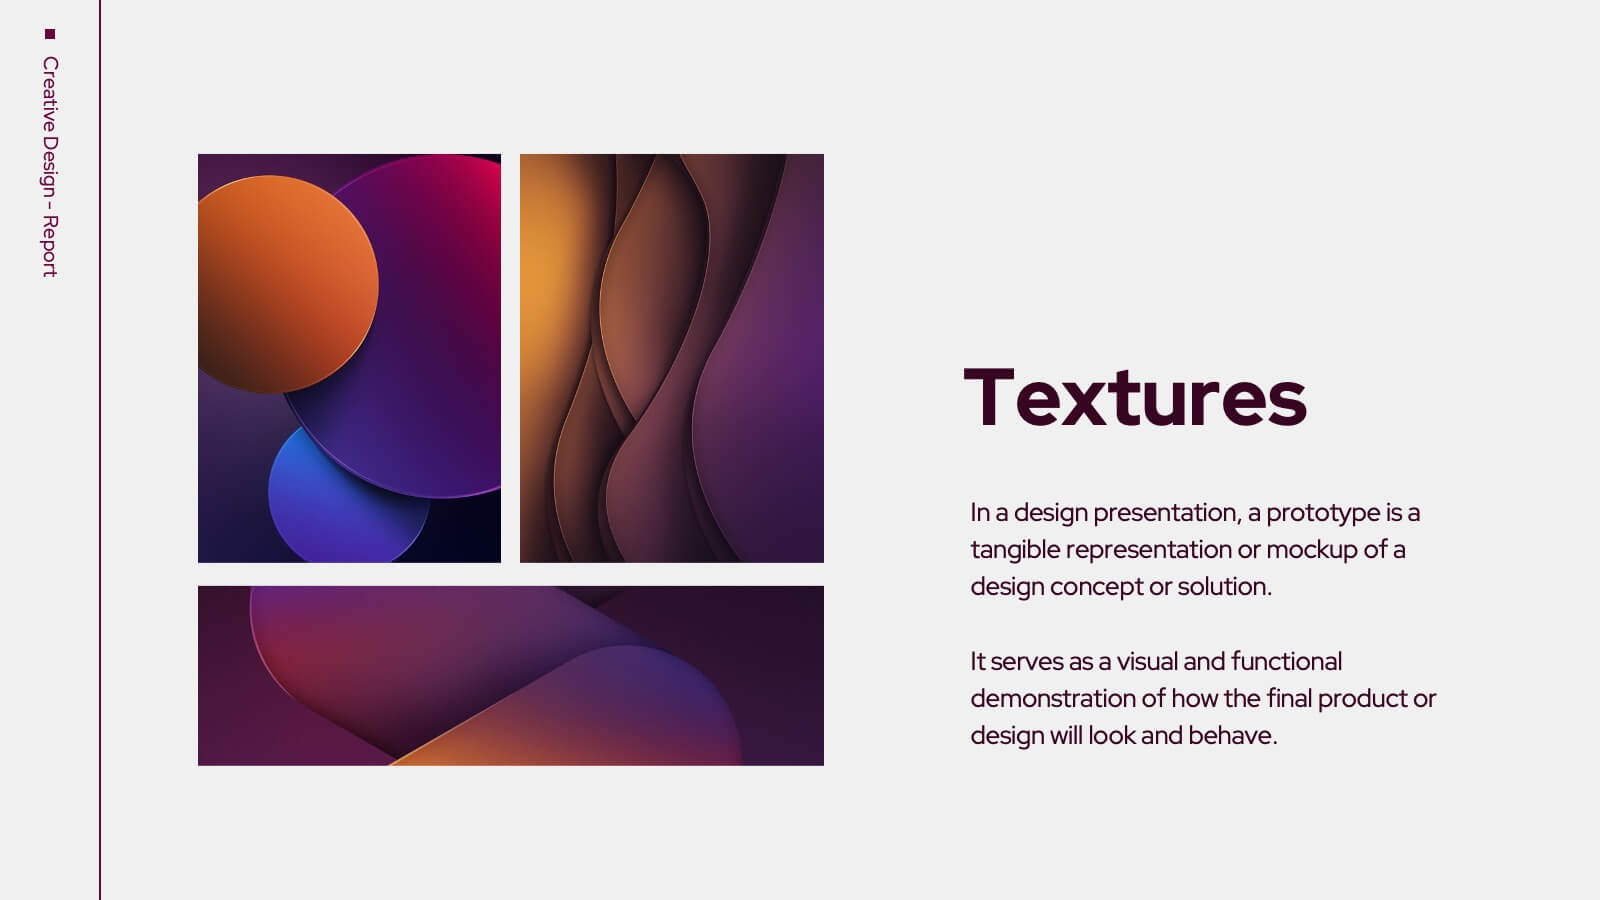
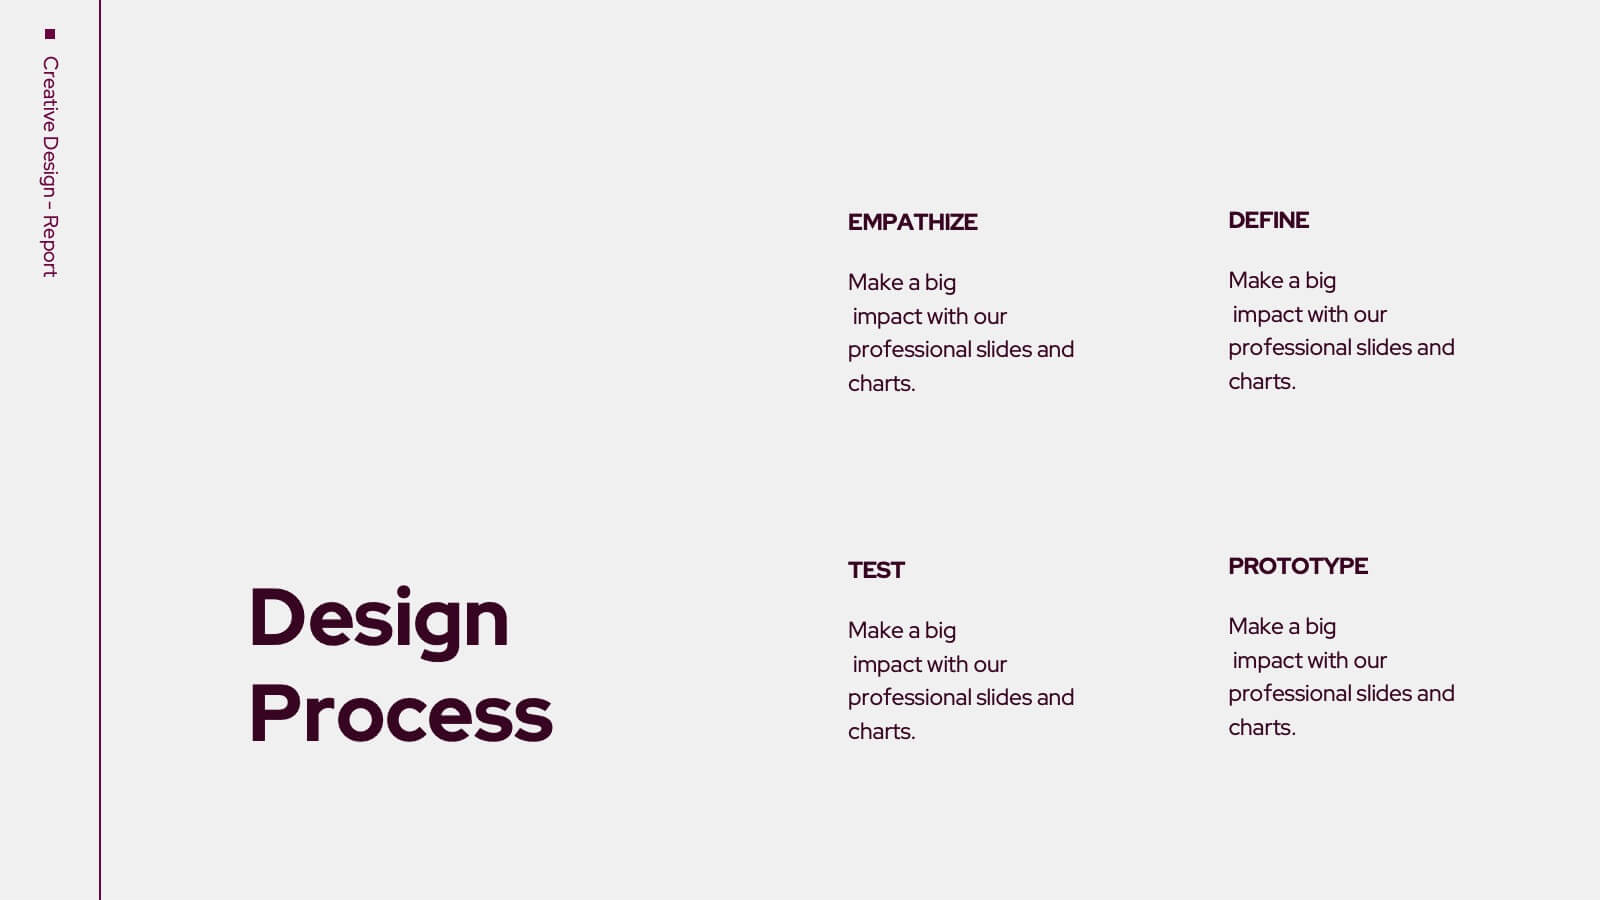
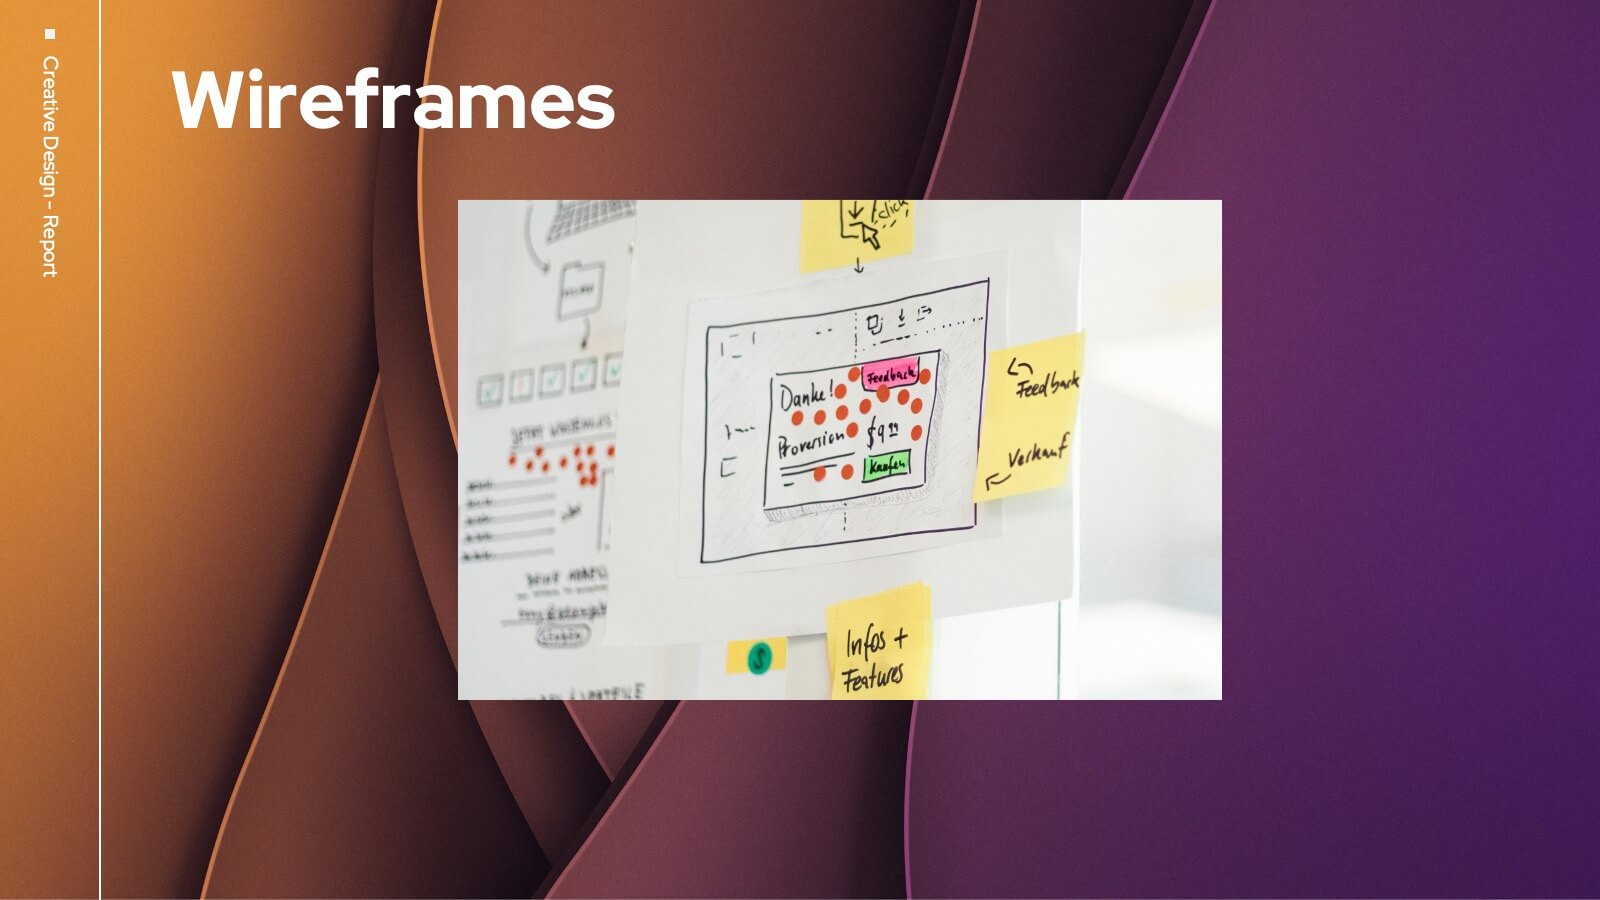
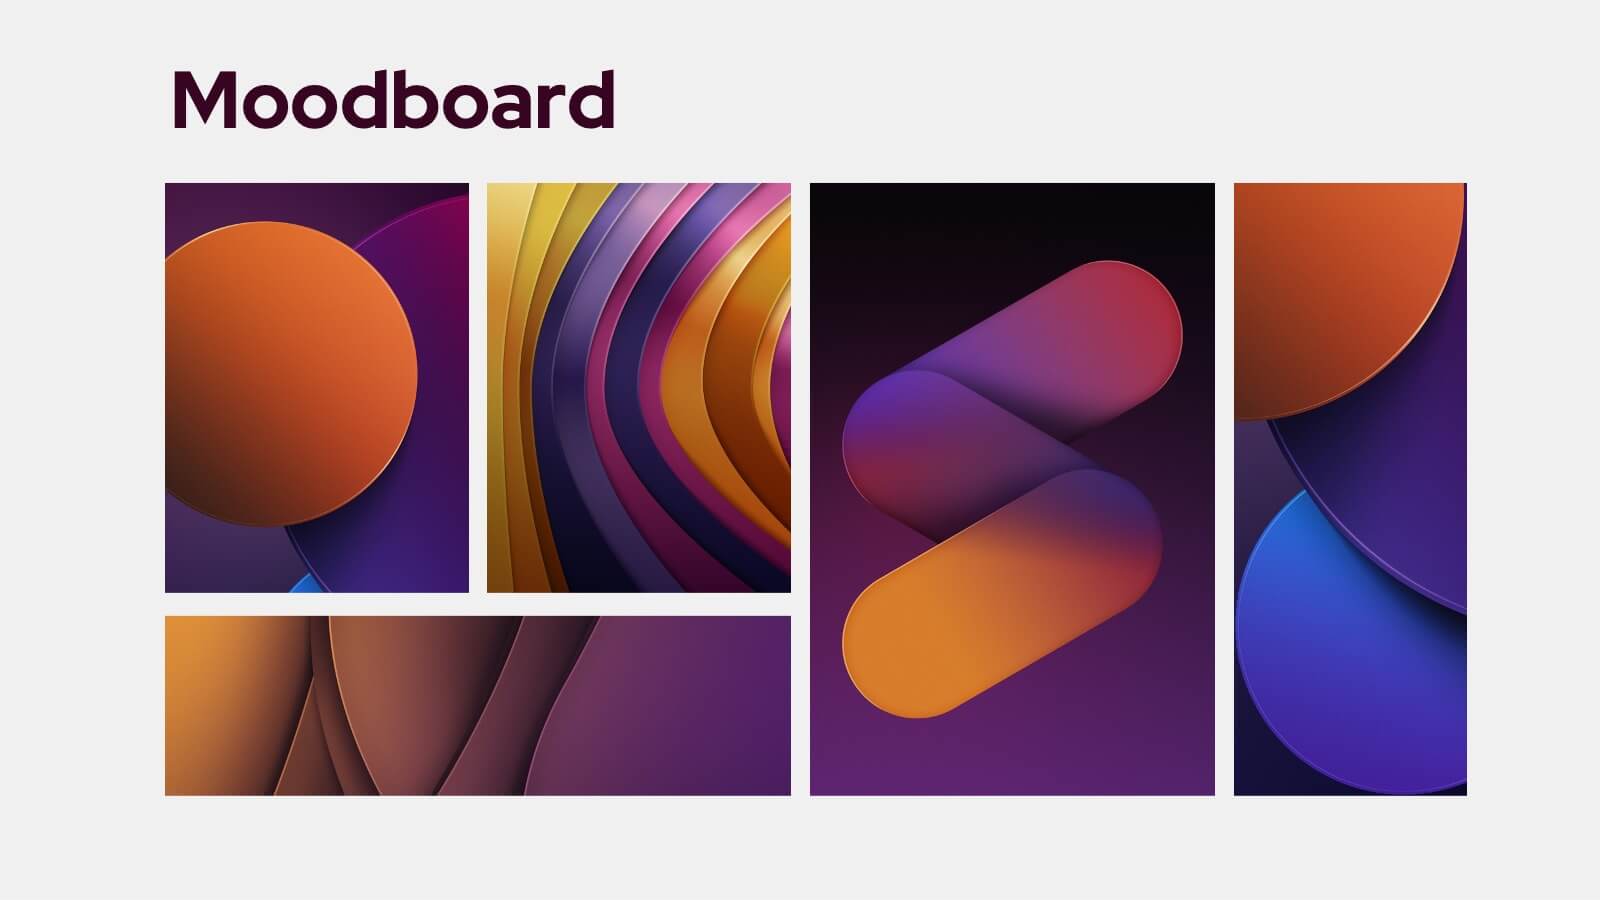
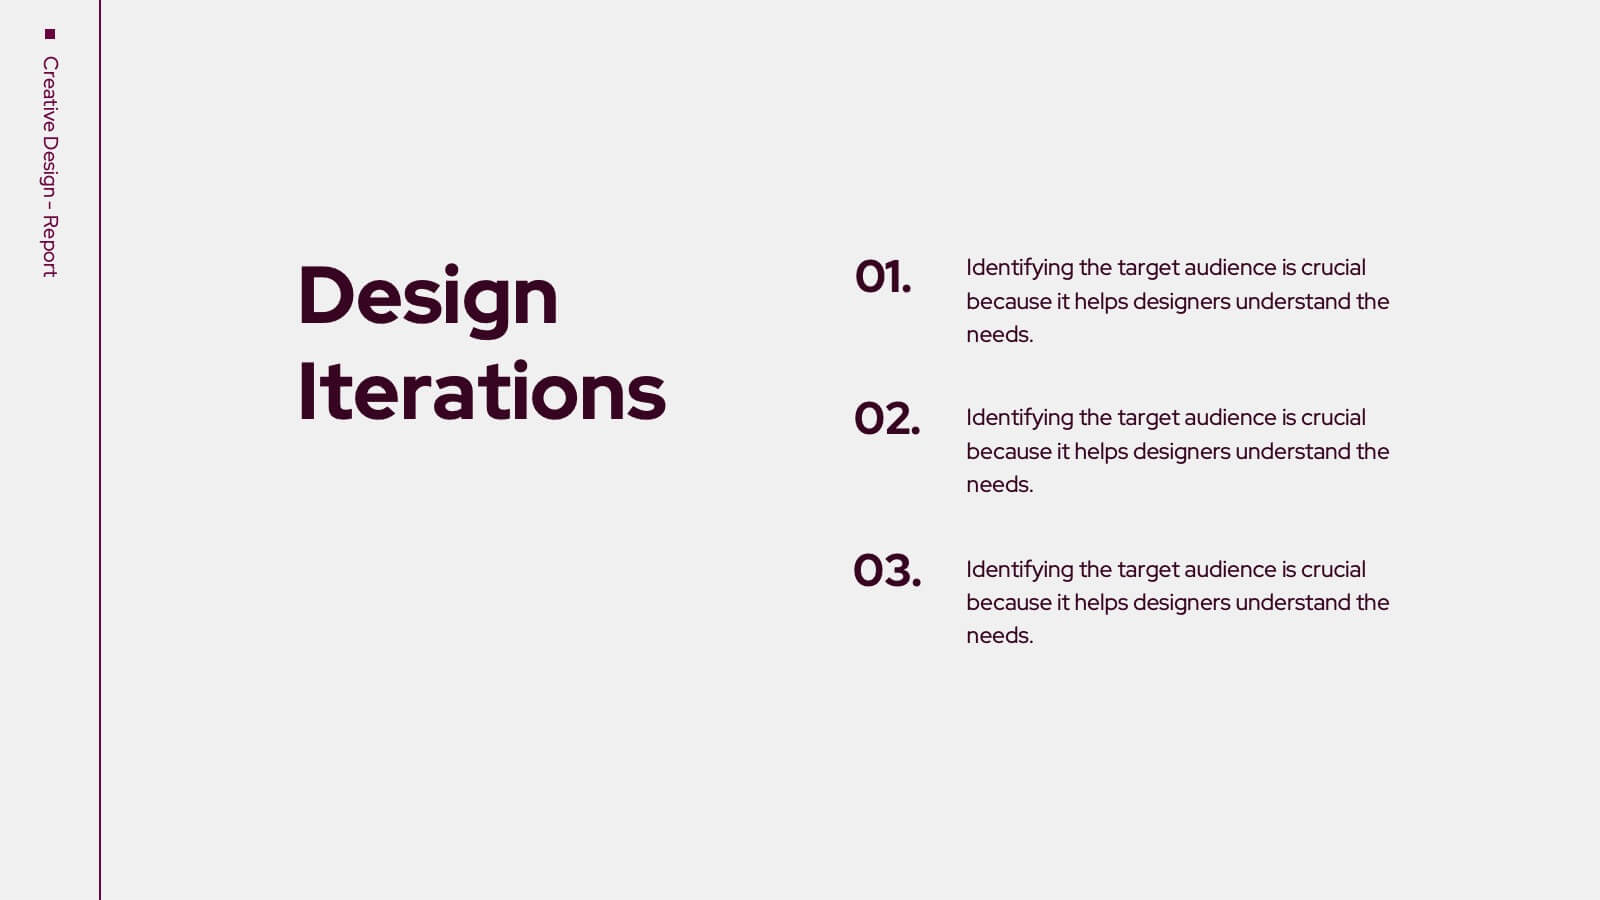
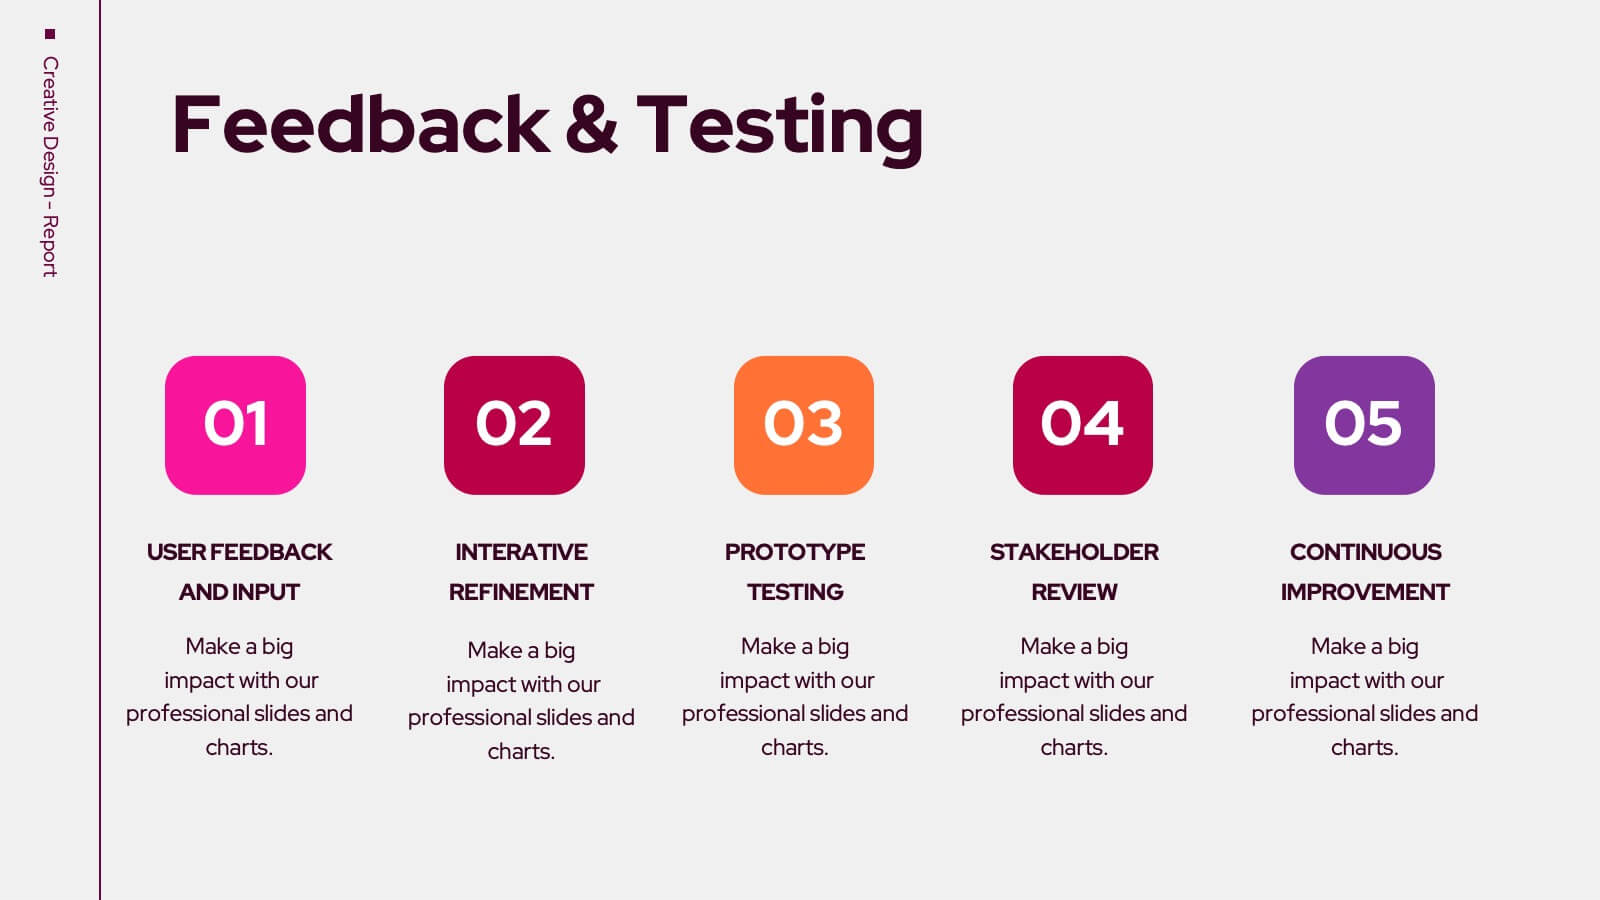
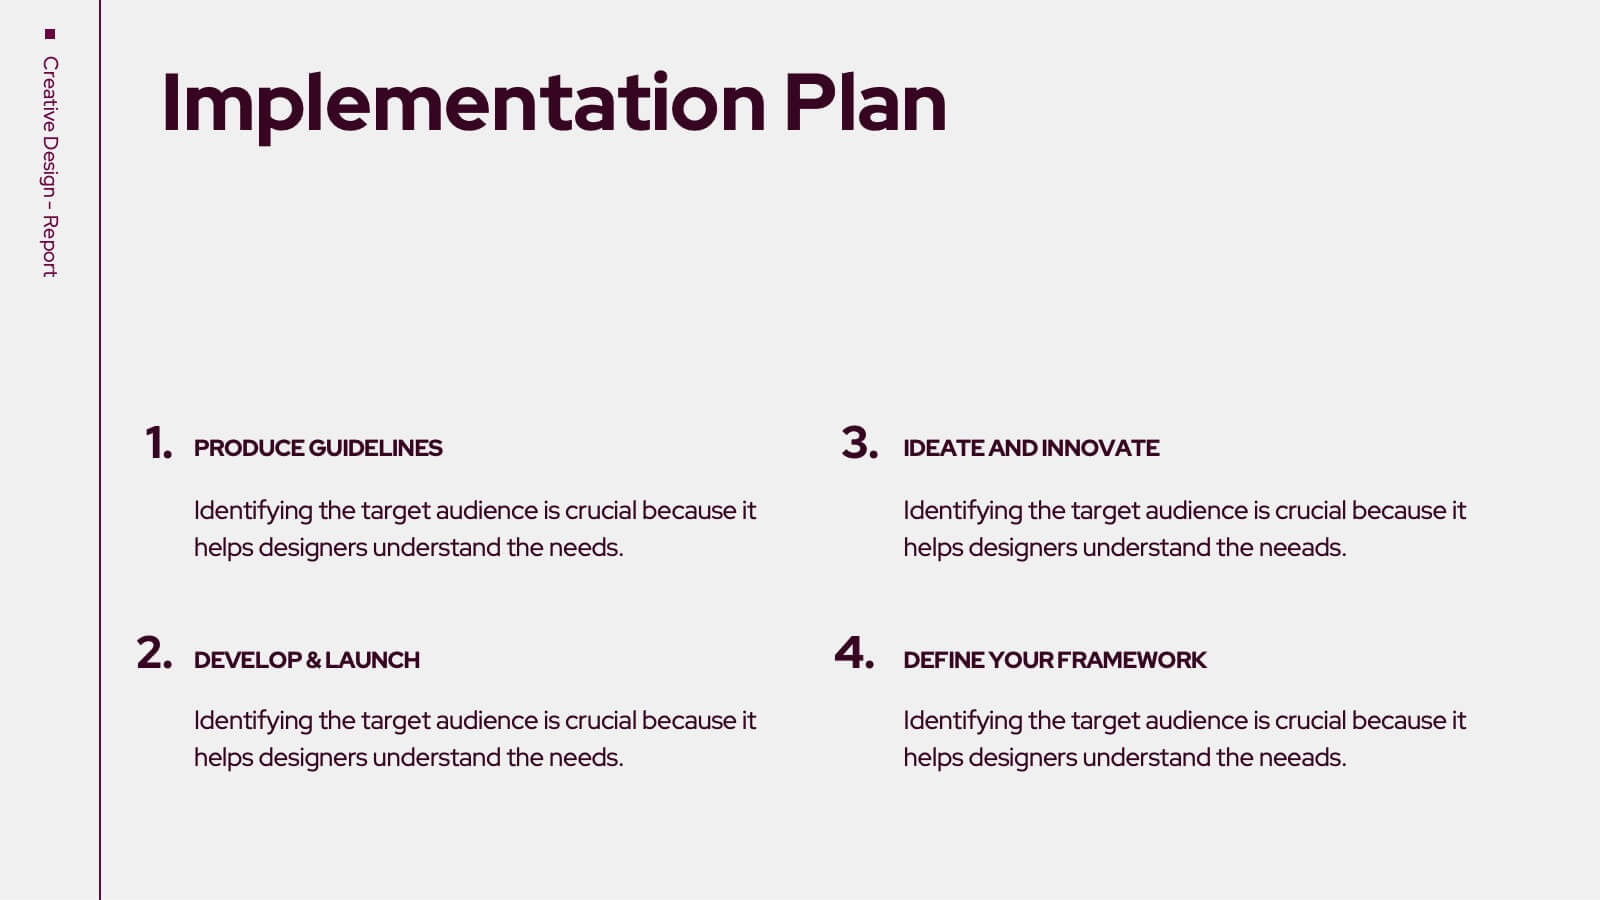
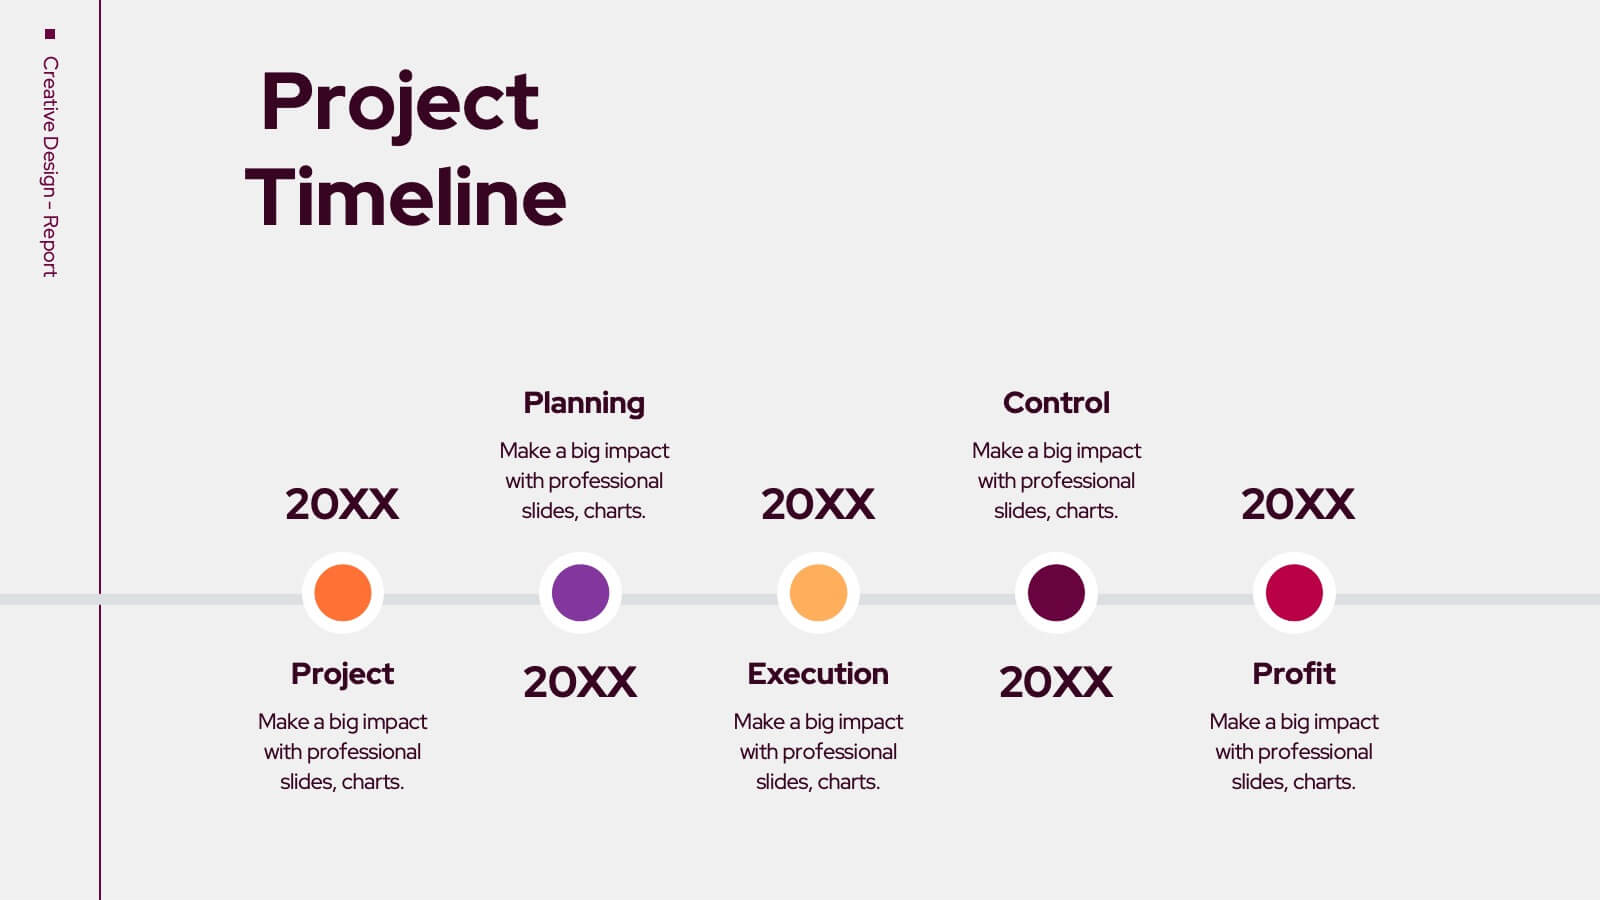
Trojan Creative Design Report Presentation
Unleash your creativity with this striking Trojan-inspired presentation template! Ideal for showcasing your design projects, this presentation enables you to highlight key concepts, inspirations, and visual elements effectively. Its engaging layout ensures your ideas shine through, captivating your audience. Compatible with PowerPoint, Keynote, and Google Slides for seamless presentations.


5 slides
Eco-Friendly Business Strategy Slides Presentation
Inspire sustainable growth with a clean, modern presentation built for eco-conscious businesses. Perfect for outlining green initiatives, corporate responsibility goals, or environmental strategies, it helps you communicate ideas with clarity and impact. Fully editable and compatible with PowerPoint, Keynote, and Google Slides for a seamless, professional presentation experience.


7 slides
One-Page Startup Model Canvas
Launch and refine your business idea with clarity using the One-Page Startup Model Canvas Presentation. This slide presents all key startup elements—Partners, Activities, Value Propositions, Customer Segments, Revenue Streams, and more—in a smart puzzle-piece layout that simplifies complex planning. Perfect for founders and pitch decks. Fully customizable in PowerPoint, Keynote, and Google Slides.