


Features
- 4 Unique slides
- Fully editable and easy to edit in Microsoft Powerpoint, Keynote and Google Slides
- 16:9 widescreen layout
- Clean and professional designs
- Export to JPG, PDF or send by email


Do you have any questions?
Recommend


6 slides
Progress Monitoring Infographic
Progress monitoring provides insights into whether a project is on track, identifies any areas of concern or challenges, and informs decision-making. This infographic template is a visual representation of how to effectively monitor and track progress in various projects, tasks, or initiatives. This infographic aims to provide a clear overview of the steps and strategies involved in monitoring progress to ensure that goals are being met. This infographic is designed to provided insights into whether a project is on track, identifies any areas of concern or challenges, and informs decision-making to ensure successful project management.


10 slides
SWOT and Competitor Comparison Presentation
Turn insights into strategy with a clean, visual layout designed to compare strengths, weaknesses, opportunities, and threats side by side. This professional presentation helps teams evaluate competitors and identify growth opportunities clearly. Compatible with PowerPoint, Keynote, and Google Slides for easy editing and seamless presentation delivery.


3 slides
Search Engine Optimization Strategy Presentation
Stand out in your next presentation with this dynamic visual breakdown of digital visibility tactics. Perfect for marketers, business owners, or SEO specialists, this colorful circular infographic highlights the key pillars of a search strategy in a way that's both professional and easy to follow. Compatible with PowerPoint, Keynote, and Google Slides.


6 slides
ABC Alphabet Infographic
An "Alphabet Infographic" is a visually engaging way to present the letters of the alphabet along with corresponding words or images that start with each letter. This type of infographic is often used in educational settings to teach young children the alphabet and basic vocabulary. Display the letters of the alphabet in a clear and appealing layout. You can arrange them in rows or columns, using a bold and easily readable font. Use colorful and child-friendly illustrations for the images associated with each letter. This will make the infographic more captivating and engaging for young learners.


21 slides
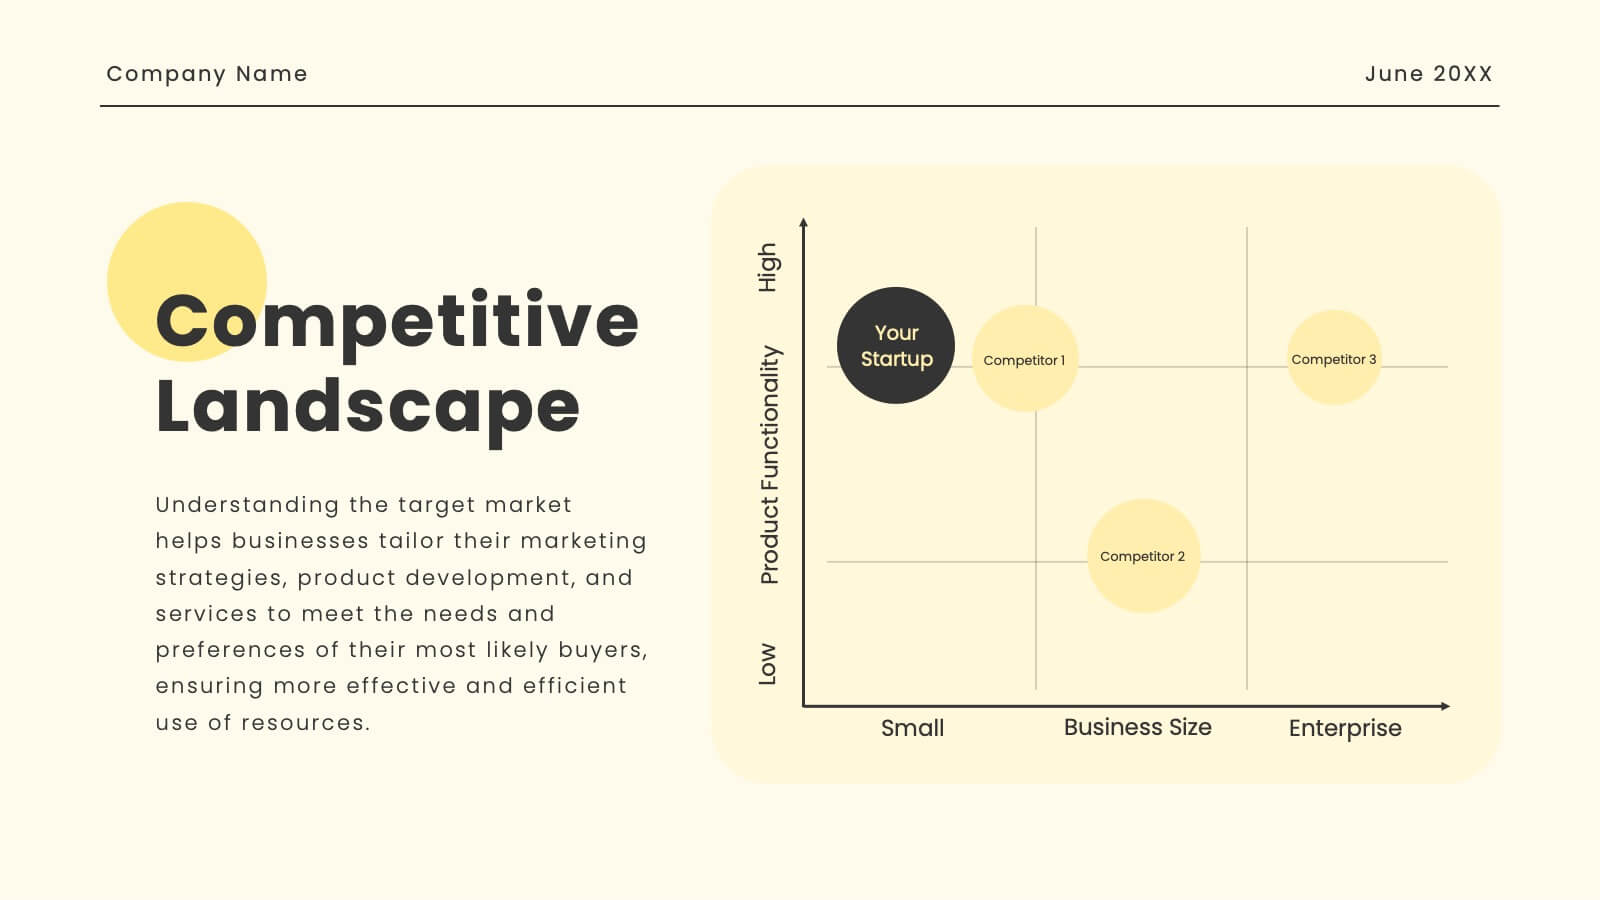
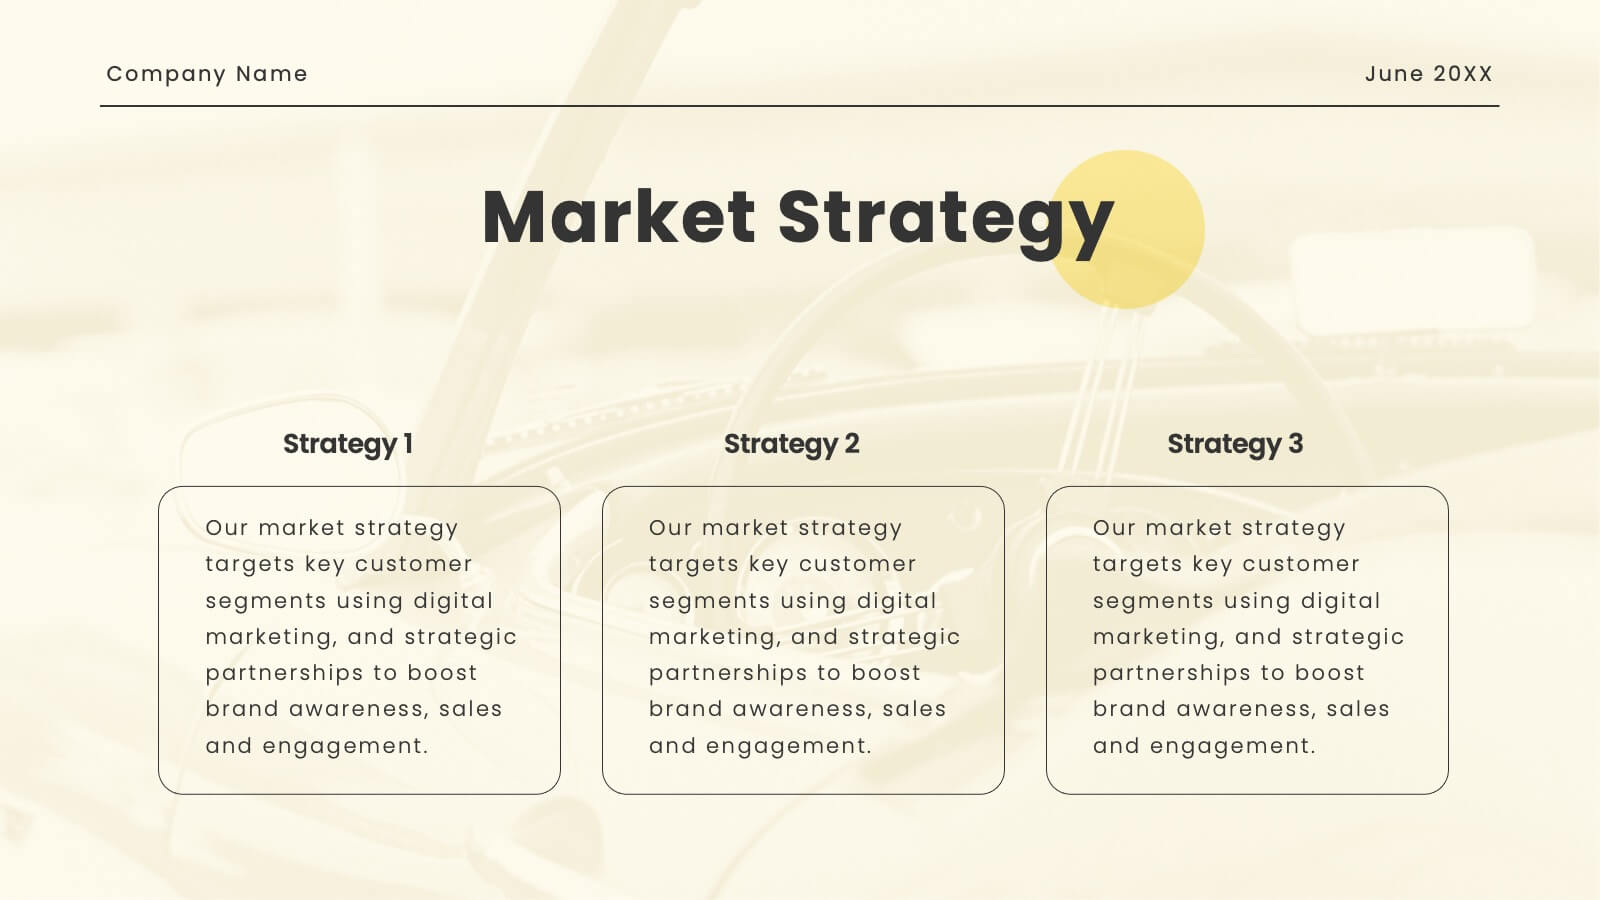
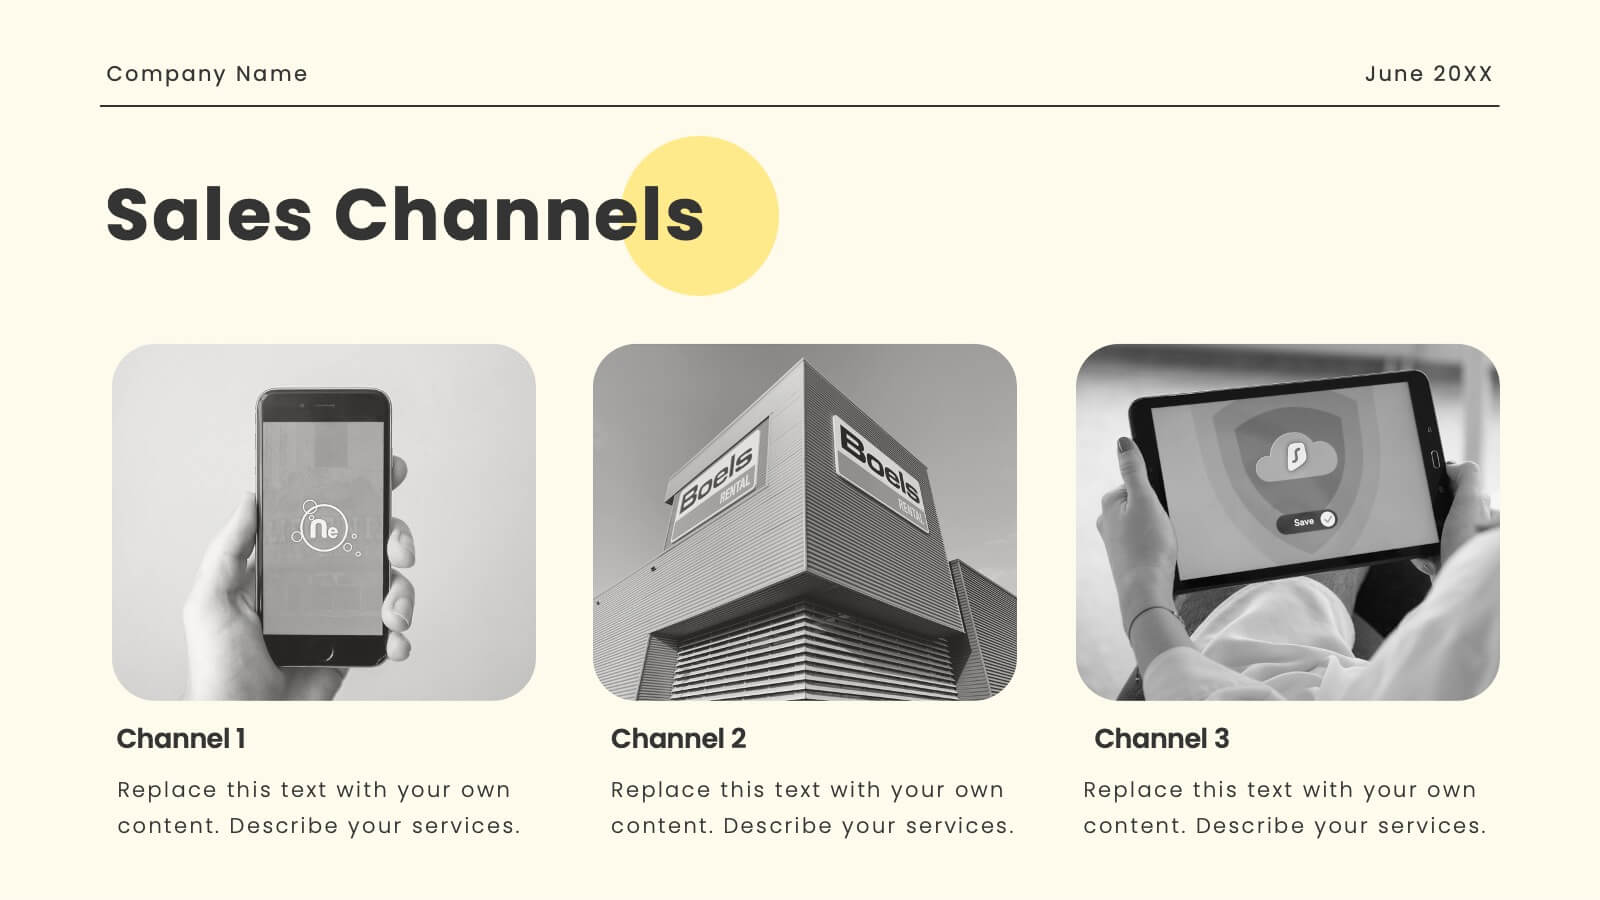
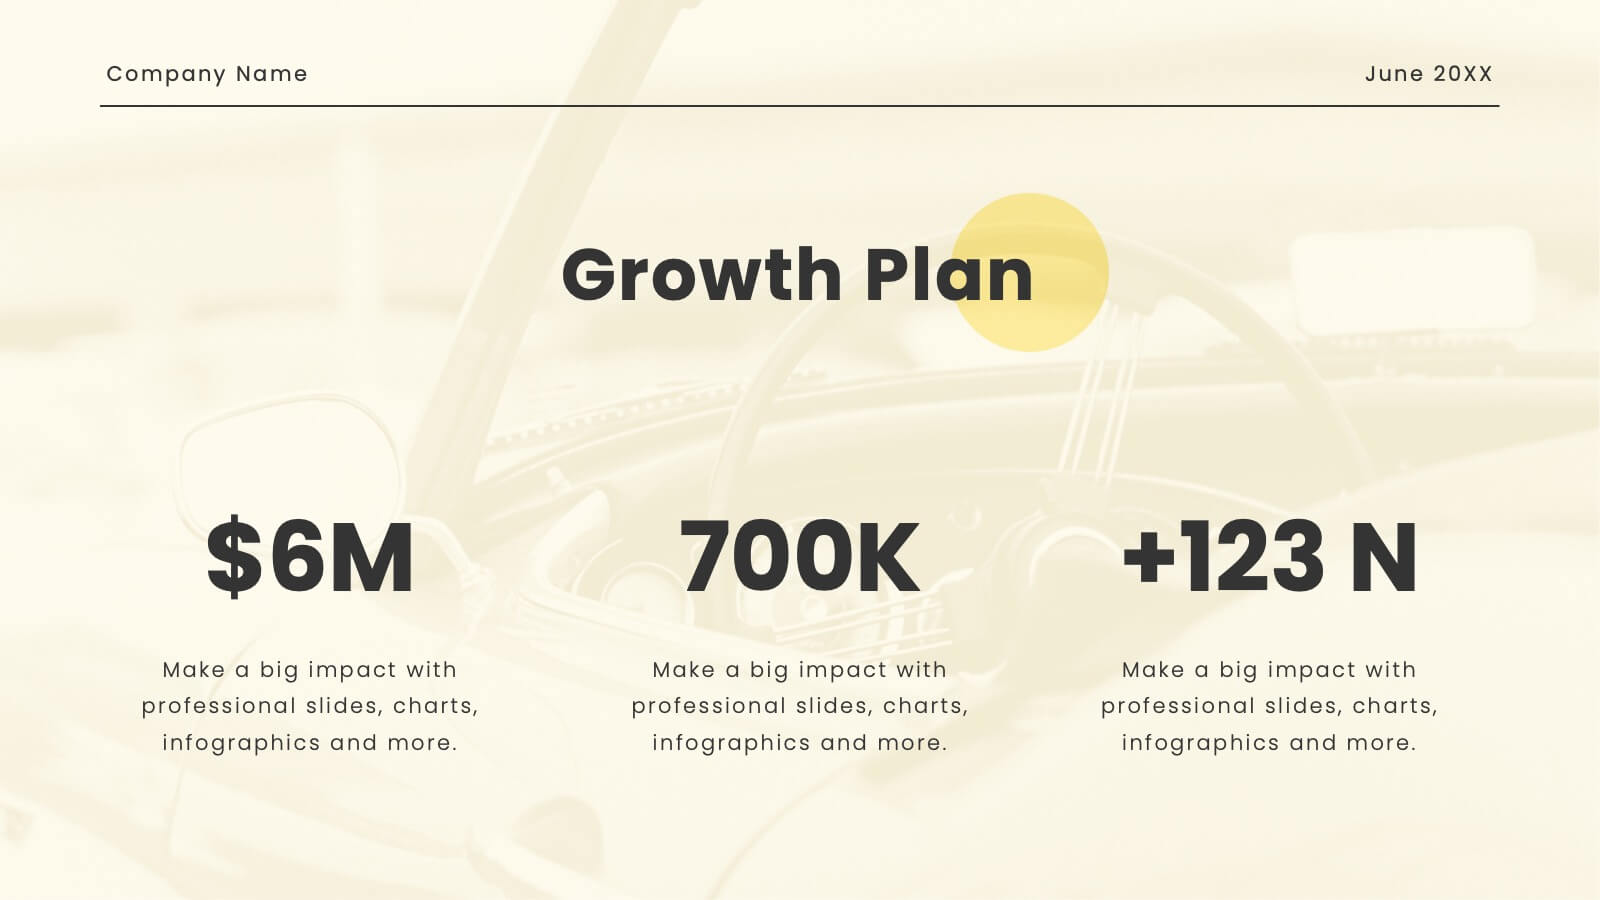
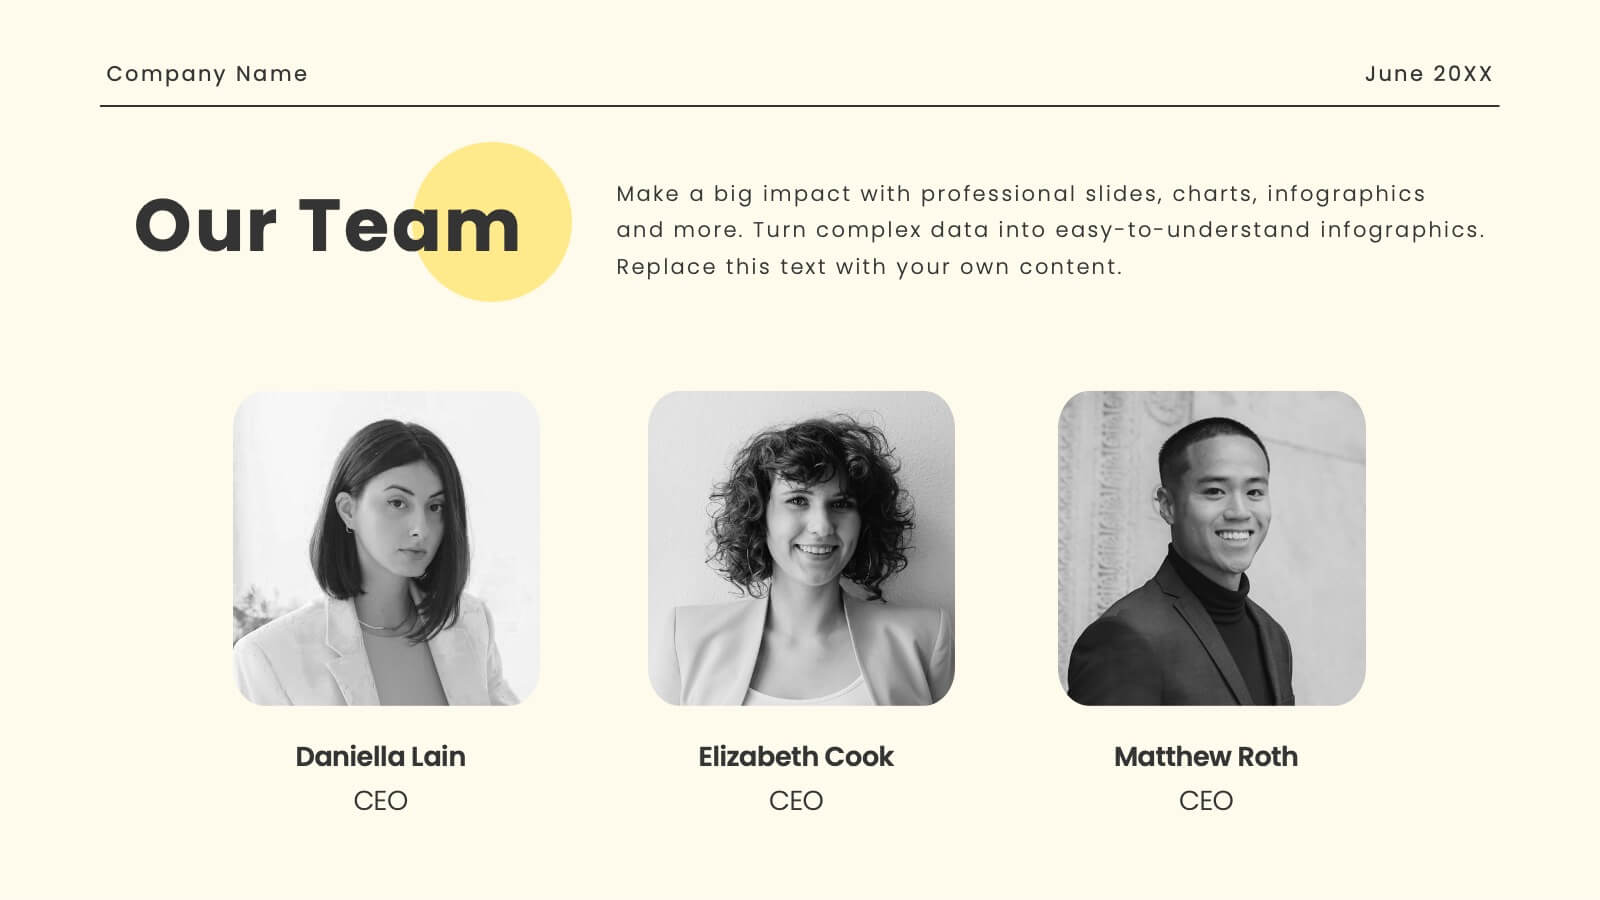
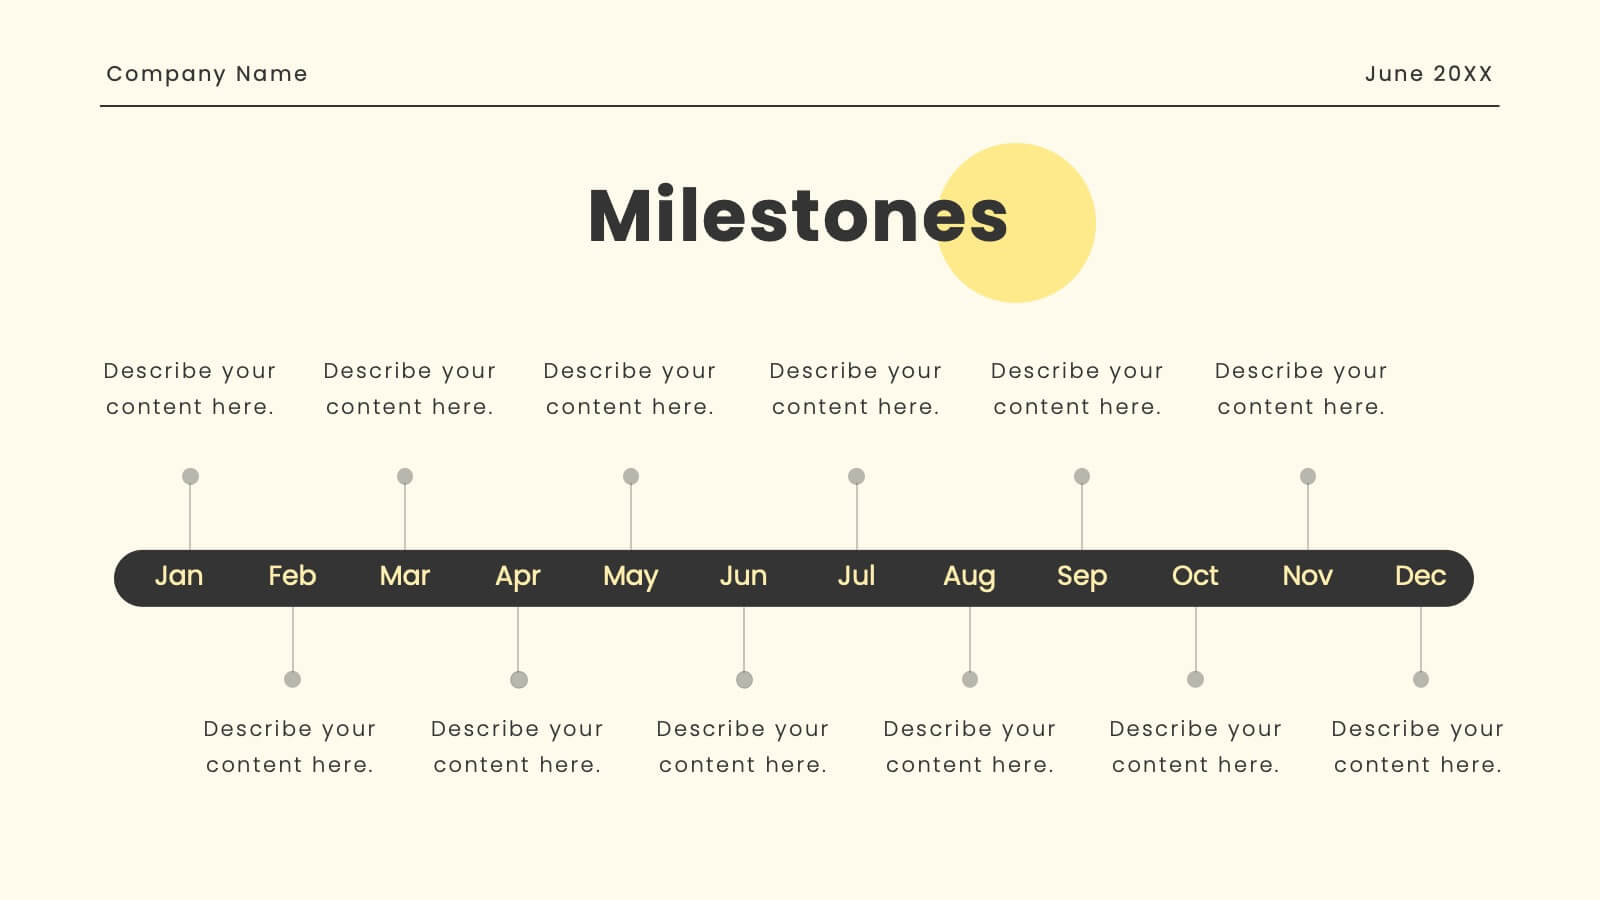
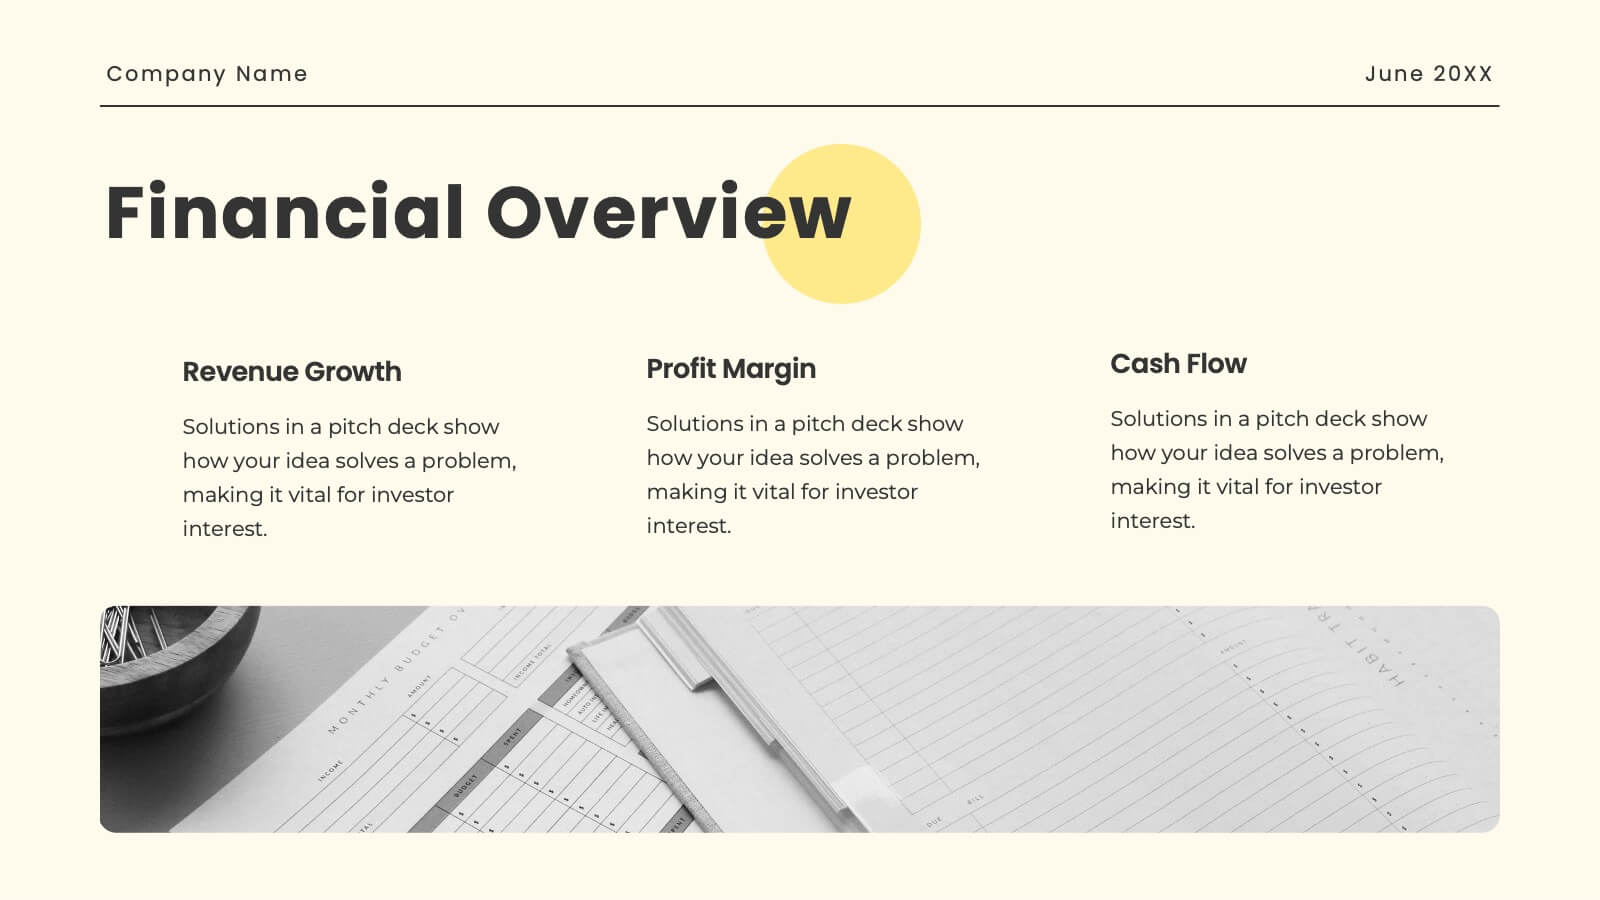
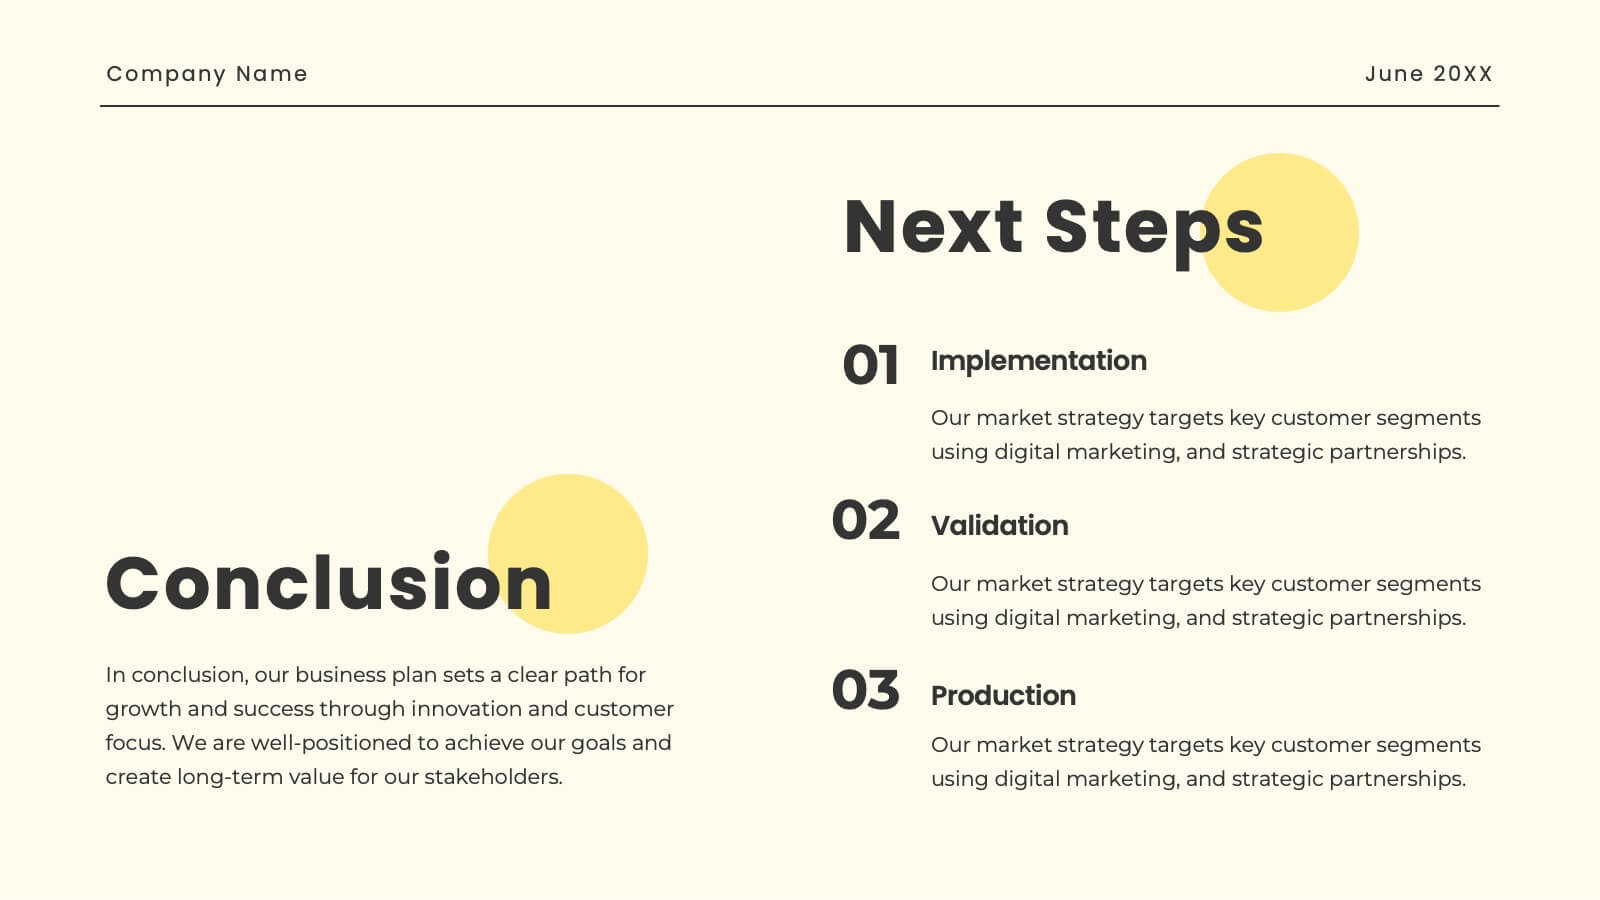
Oasis Startup Business Plan Presentation
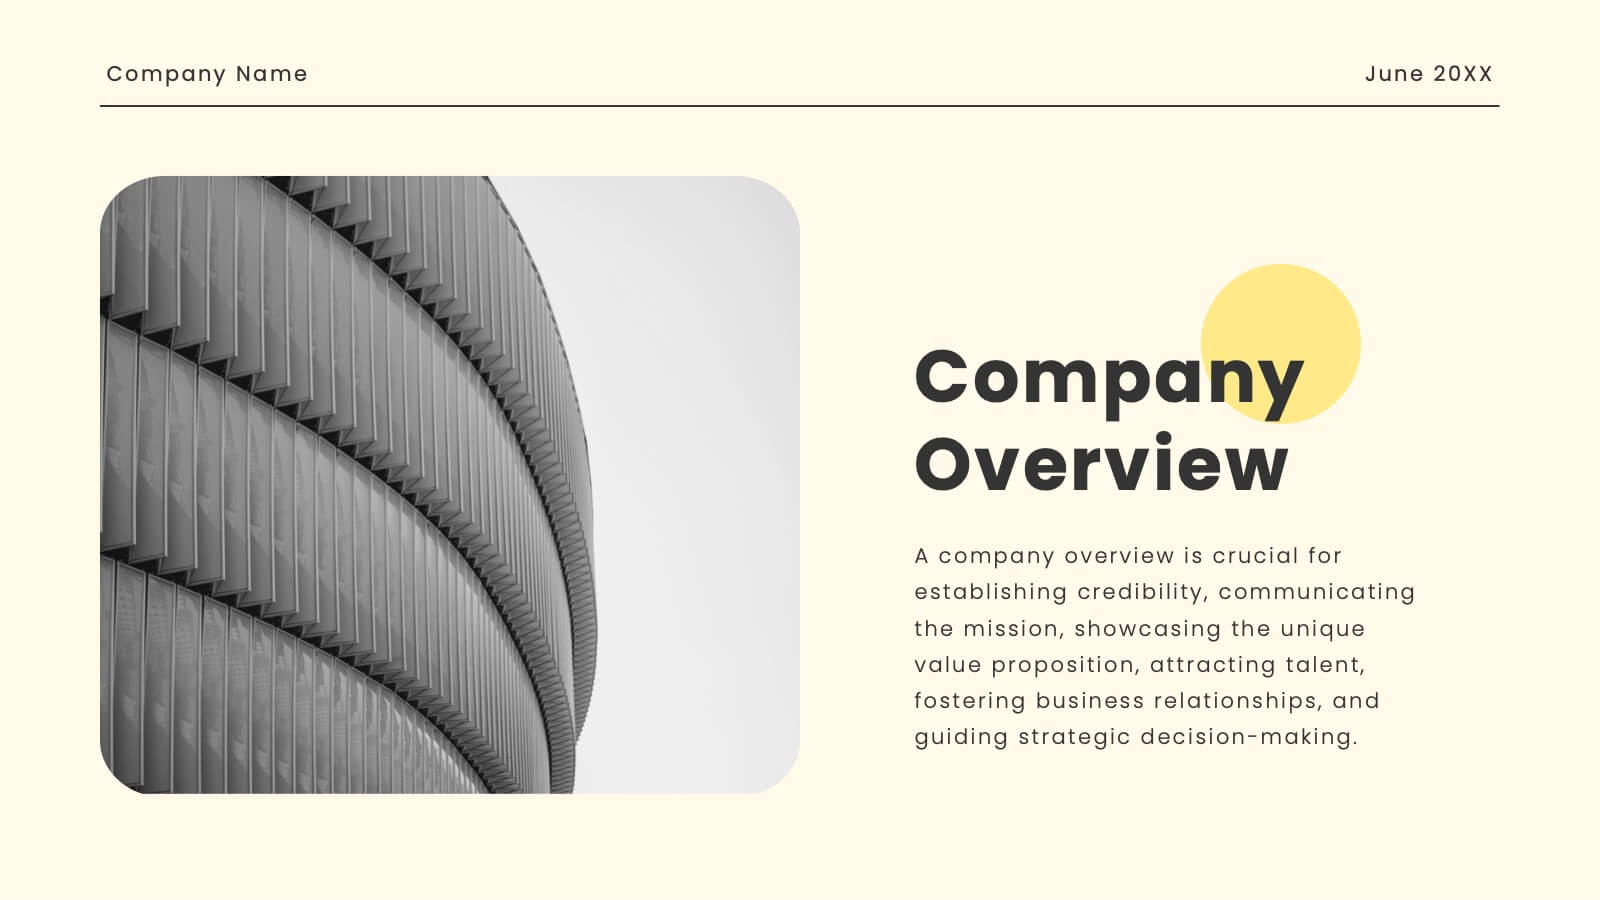
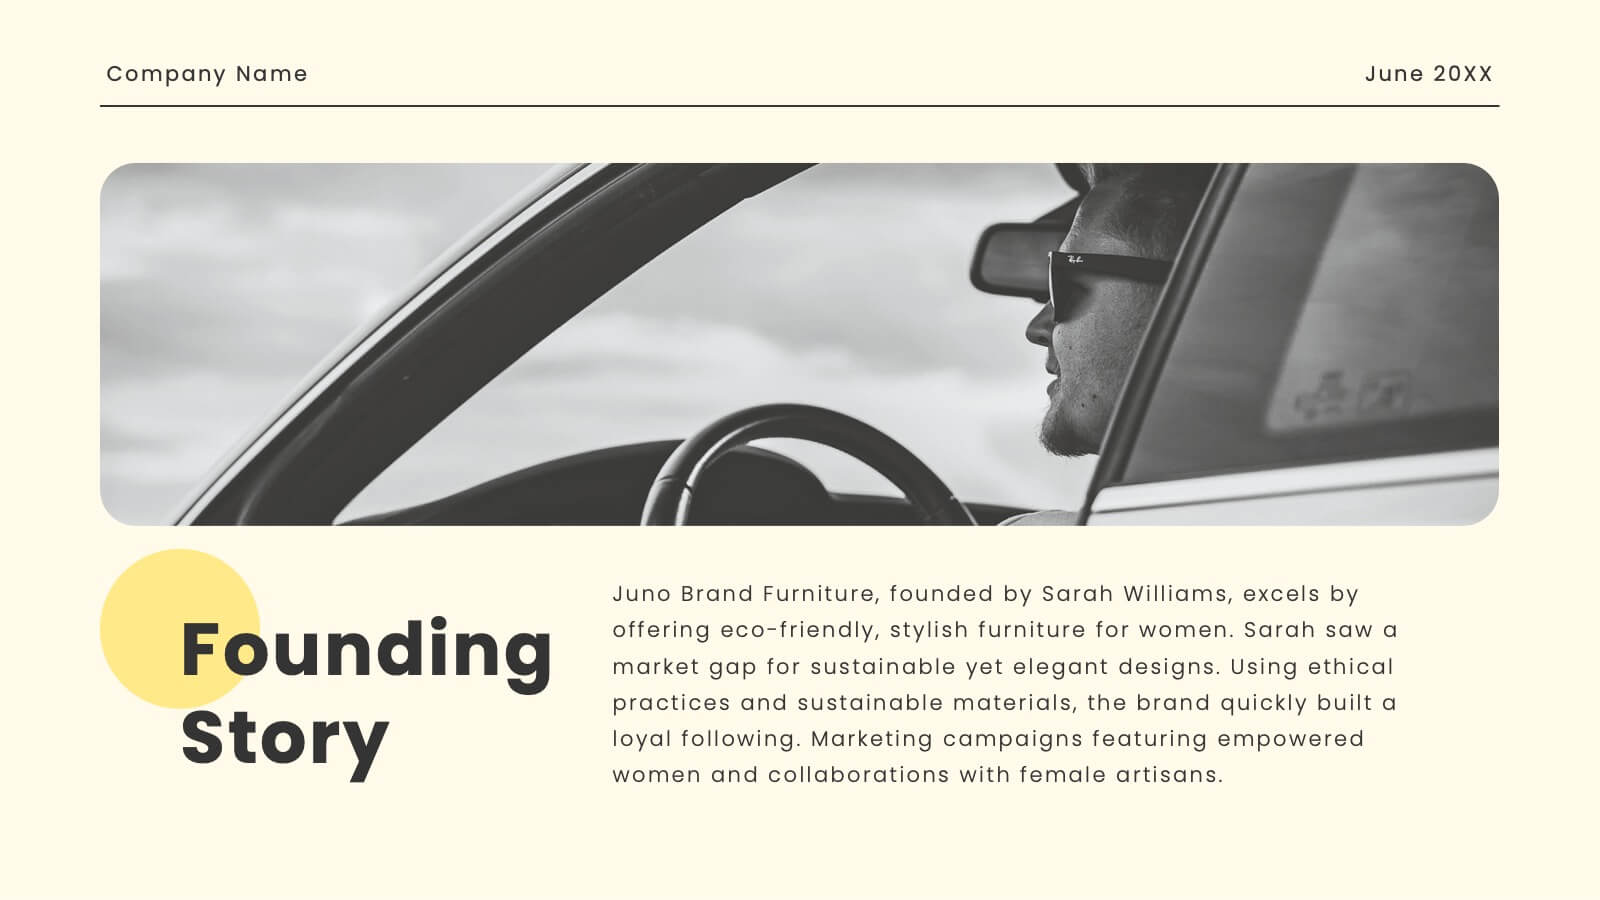
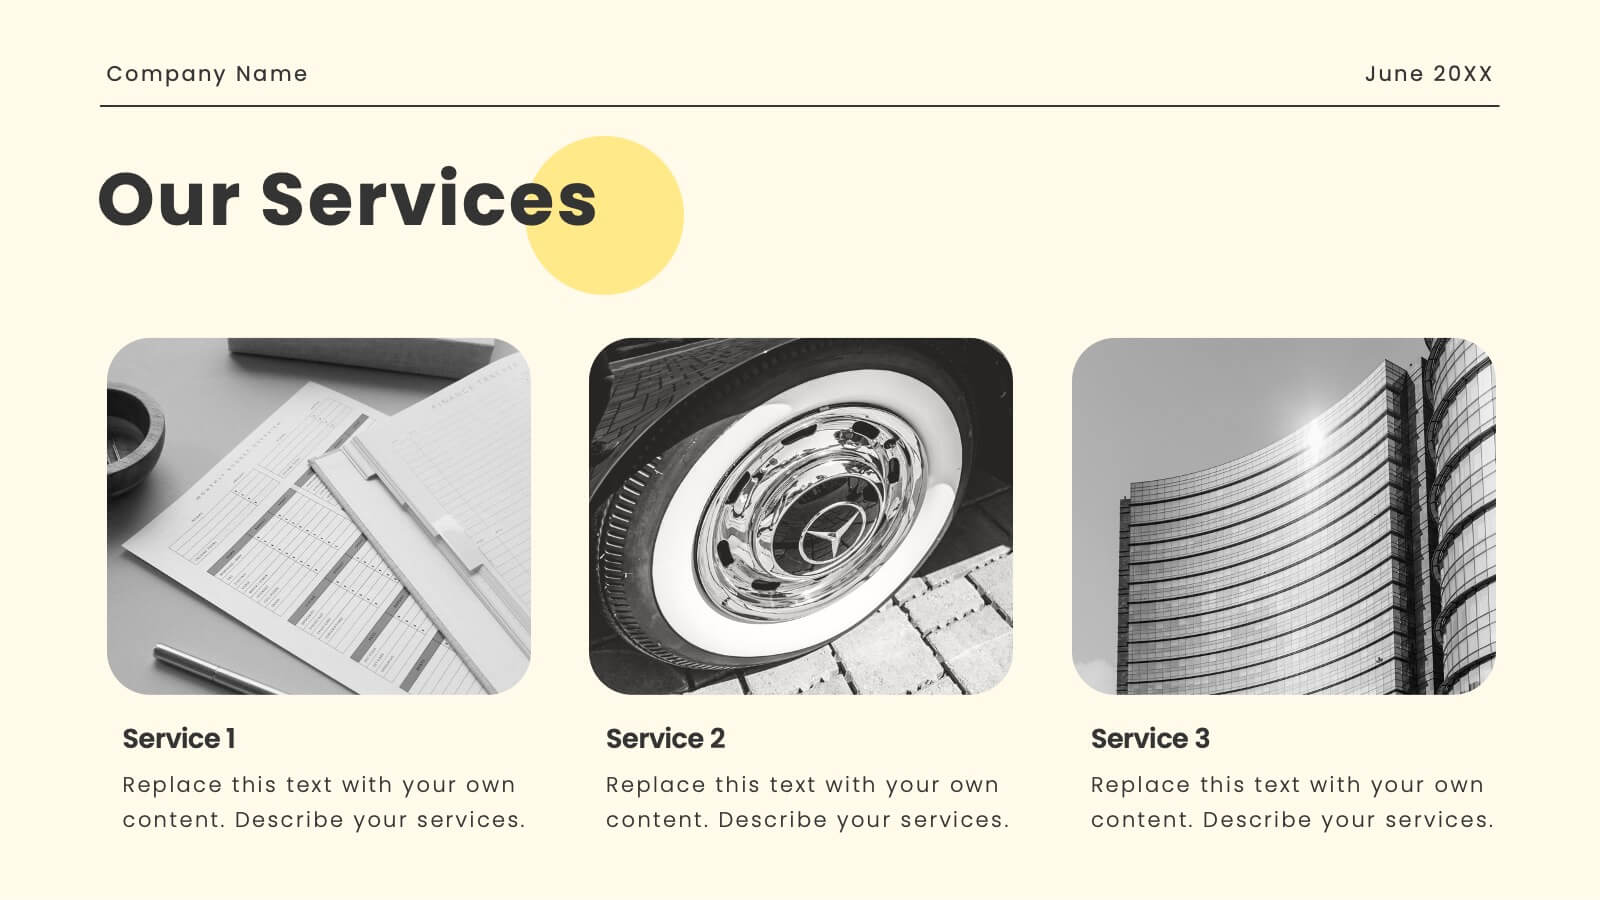
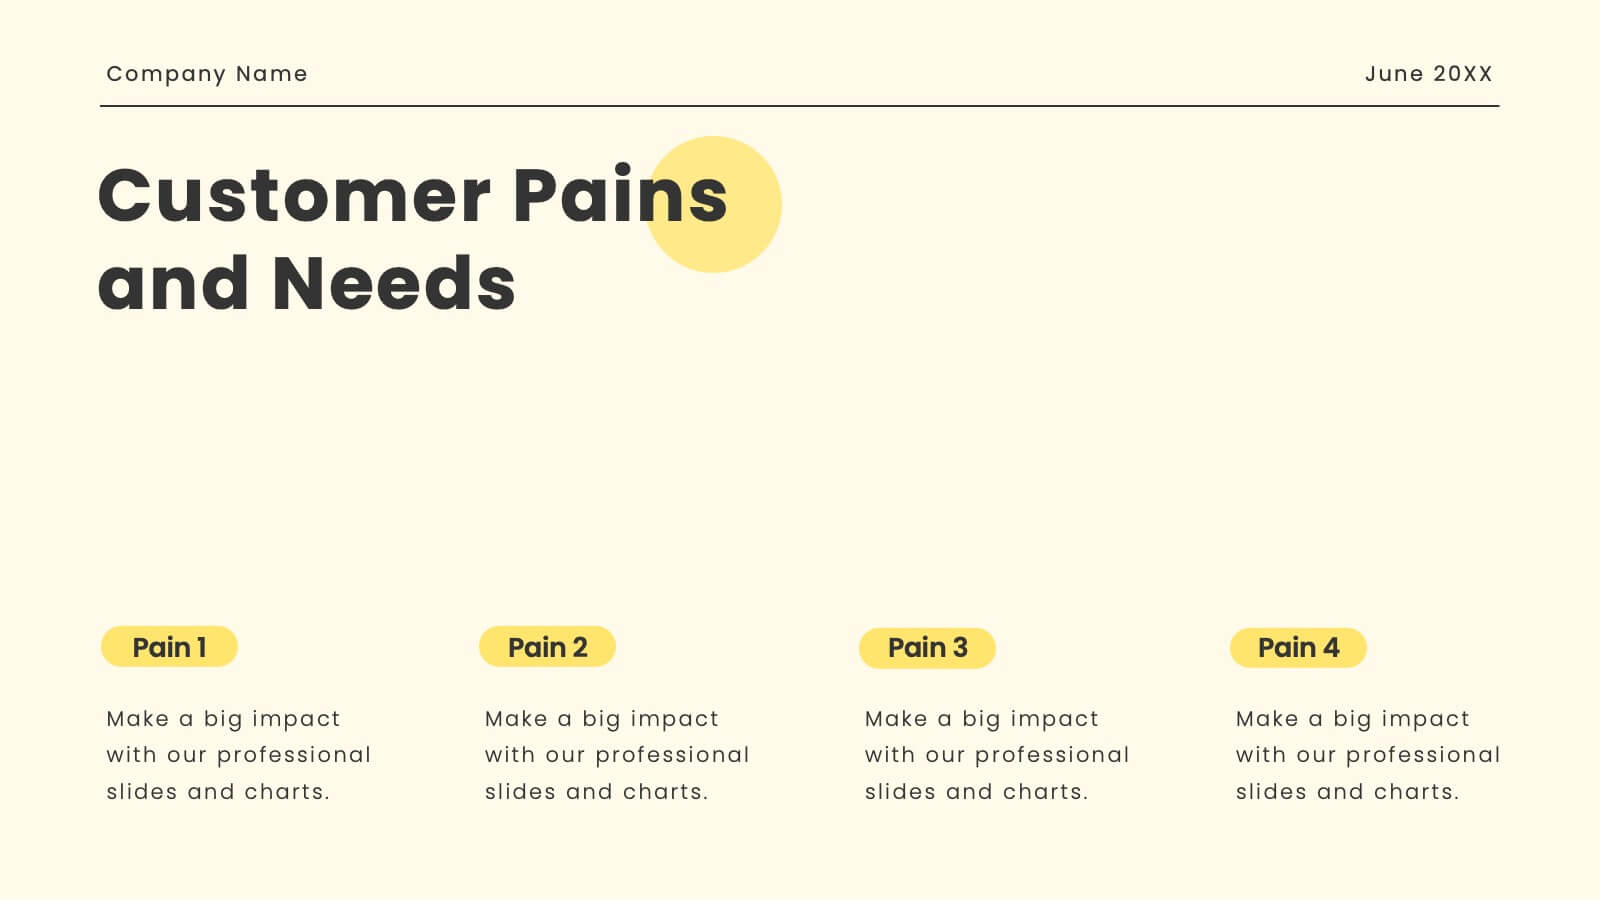
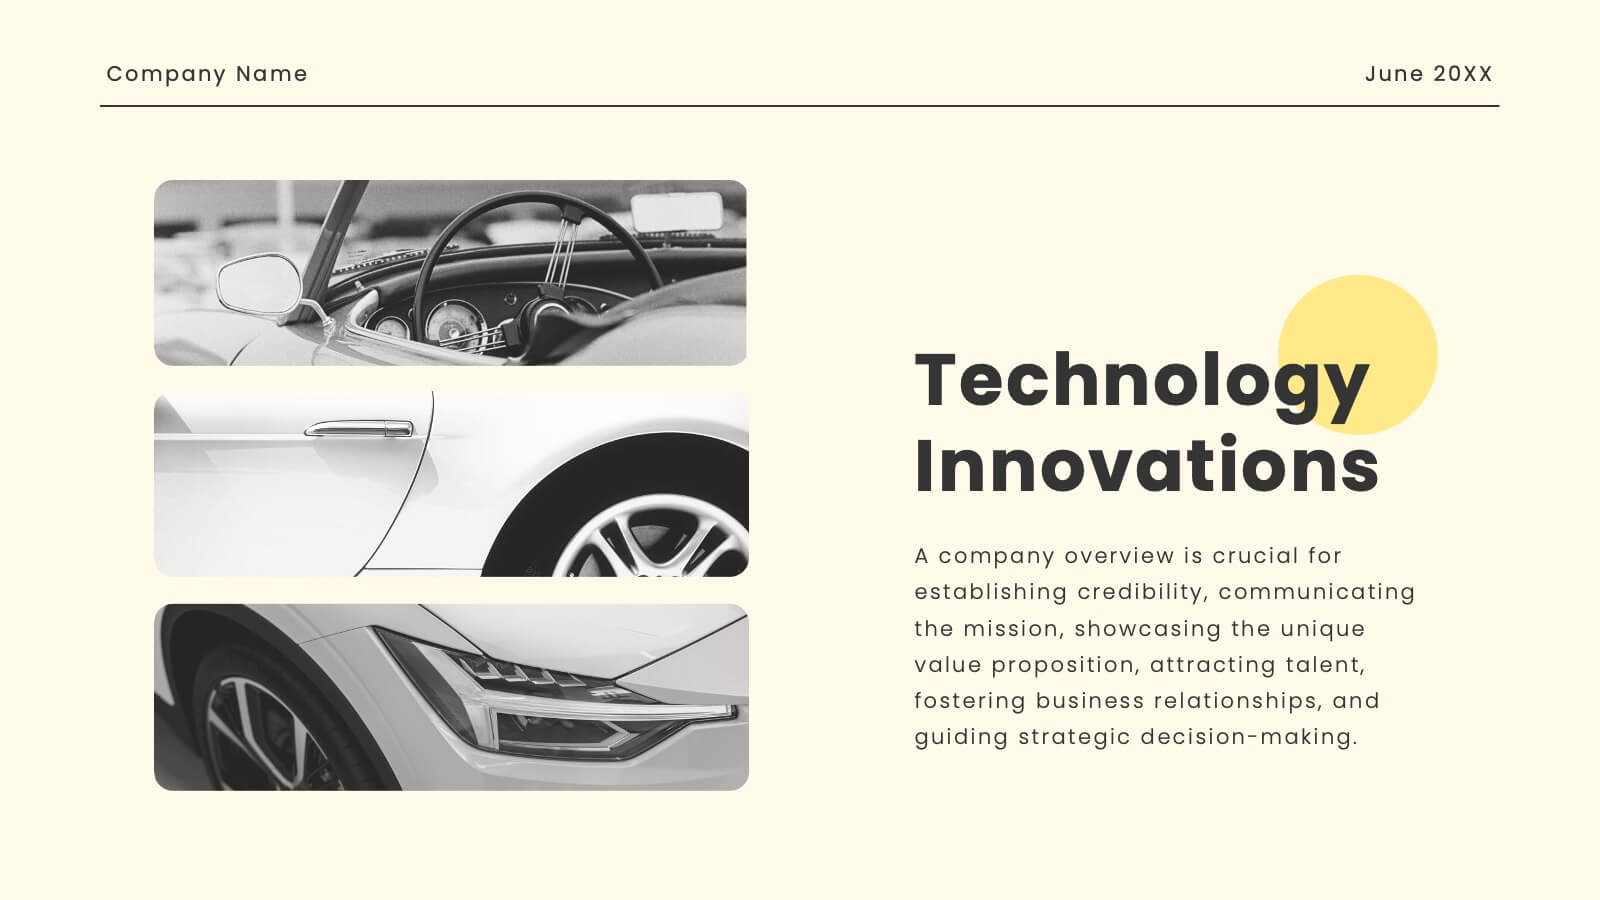
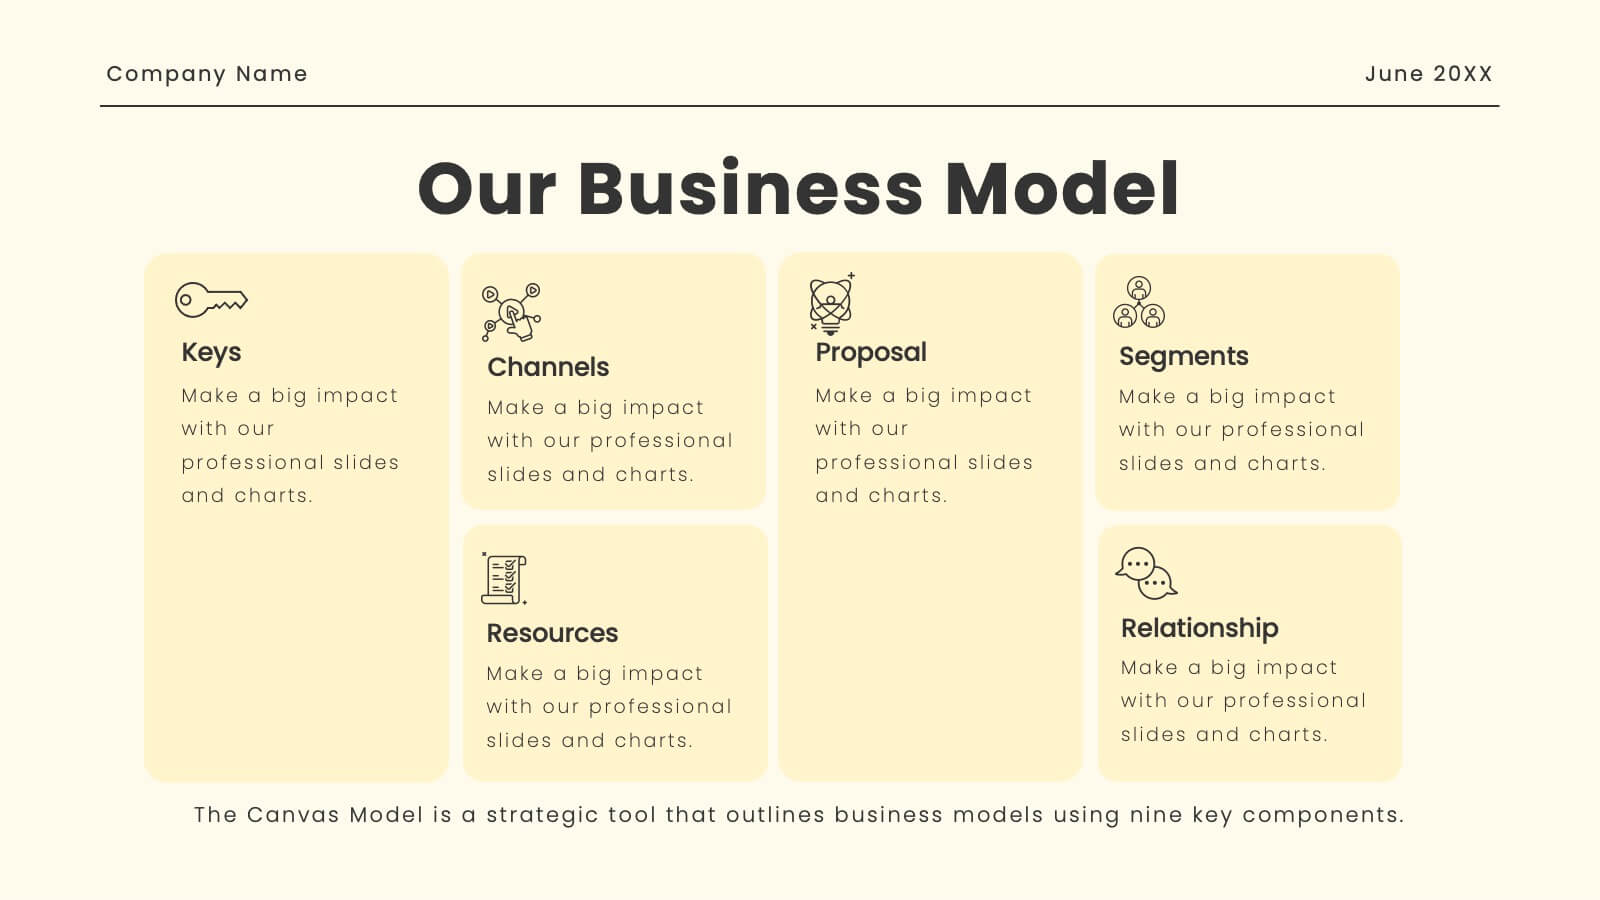
Present your corporate business plan with confidence! This template includes sections for company overview, mission, vision, services, target market, and more. Showcase your market strategy, sales channels, growth plan, and financial overview. Perfect for conveying a professional and comprehensive business plan. Compatible with PowerPoint, Keynote, and Google Slides. Impress your audience today!


7 slides
Self-sufficient Environmental Infographic
In an era where sustainability is paramount, understanding self-sufficiency in environmental contexts has never been more crucial. Our refreshing infographic, adorned in crisp whites, lush greens, with subtle black nuances, delves deep into this pivotal subject. Crafted to be both educational and engaging, this infographic sheds light on the essentials of eco-friendly independence. It's a must-have tool for educators, environmental enthusiasts, policy-makers, and individuals aiming for a green footprint. Seamlessly integrated with PowerPoint, Keynote, and Google Slides, our infographic invites you to explore, educate, and empower for a more sustainable tomorrow.


6 slides
Puzzle Project Infographic
A puzzle infographic is a visual representation that combines the elements of a puzzle with informational content. This infographic template uses puzzle pieces or puzzle-related design elements to convey different sections or components of information. Each puzzle piece represents a specific section or element of the information being presented. The puzzle pieces act as sequential elements, guiding your viewer through the information in a logical and engaging manner. This infographic is visually appealing and use colors, illustrations, icons, and other design elements to enhance the overall presentation.


7 slides
Social Media Engagement Infographic
Social media is the most influential tool in today's world. This infographic template is a great way to share the benefits of your services in an easy-to-read format that's sure to get your audience excited about what you have to offer. Whether you're looking to promote a new product line or simply want to provide information to your customers so they can make informed decisions, this infographic will be perfect for your needs. This infographic will help you understand how to use social media to engage with your audience and drive traffic to your site. Fully customizable and compatible with Powerpoint, Keynote, and Google Slides.


5 slides
Relationship Mapping Diagram Presentation
Bring clarity to complex connections with this clean and modern visual layout designed to map relationships, processes, or ideas effortlessly. Perfect for presentations that require structure and flow, it balances simplicity with professionalism. Fully customizable and compatible with PowerPoint, Keynote, and Google Slides for seamless design flexibility.


6 slides
Competitor Benchmark Analysis Table Presentation
Visually compare competitors with this structured benchmark analysis template. Perfect for business strategy, market research, or product comparison presentations. Features colorful indicators and editable labels to showcase performance, differentiation, or KPIs. Fully customizable in PowerPoint, Keynote, and Google Slides—ideal for marketing teams, consultants, or competitive landscape reviews.


12 slides
Alphabet Learning and Education Presentation
Introduce concepts creatively with this bold "A"-shaped infographic designed for education topics. Each segment of the letter highlights a numbered point, making it ideal for step-by-step instructions, learning stages, or literacy development. Use it to simplify complex ideas visually. Fully editable in PowerPoint, Keynote, and Google Slides.


6 slides
SCRUM Framework Infographics
The "SCRUM Framework" infographic template is a dynamic and insightful tool, meticulously crafted for PowerPoint, Keynote, and Google Slides. This template is essential for project managers, agile coaches, and development teams striving to elucidate the intricacies and benefits of the SCRUM methodology in their projects. This template adeptly breaks down the SCRUM framework into its core components: roles, events, and artifacts. It showcases the iterative process of product development, sprint planning, daily stand-ups, sprint reviews, and retrospectives. The visual representation of SCRUM roles – Product Owner, SCRUM Master, and Development Team – along with the flow of activities, makes it an indispensable resource for SCRUM training, agile transformation initiatives, and team workshops. The design is as agile as the methodology it represents, with a color scheme that encourages clarity, focus, and energy. This not only makes the presentation visually compelling but also reinforces the principles of transparency, inspection, and adaptation that are central to SCRUM. Whether used in corporate training, team onboarding, or educational settings, this template ensures that the "SCRUM Framework" is communicated with precision, clarity, and visual flair.


7 slides
McKinsey Business Infographic
The McKinsey 7S Model is a management model developed by consulting company McKinsey & Company. This infographic template offers a framework to analyze and align various internal aspects of an organization to ensure its success and effectiveness. Compatible with Powerpoint, Keynote, and Google Slides. Customize the content, design, and visuals to craft an engaging and informative infographic that showcases McKinsey & Company's global impact and expertise in transforming businesses. This business infographic should serve as a snapshot of McKinsey's core strengths and values.


6 slides
Talent Acquisition and Recruitment Presentation
Showcase your hiring process with clarity using this Talent Acquisition and Recruitment slide. Designed with a stack of resumes and a 5-step vertical layout, it's perfect for outlining stages such as job posting, candidate sourcing, interviews, and selection. Each section includes icons and editable titles to match your specific recruitment flow. Compatible with PowerPoint, Keynote, and Google Slides for easy customization.


4 slides
Investment Planning and Risk Guide
Simplify your financial presentation with the Investment Planning and Risk Guide Presentation. This 3-step visual layout walks viewers through the key stages of financial decision-making, from initial capital to potential return. Perfect for illustrating risk assessment, investment flow, or budgeting strategies. Fully editable in PowerPoint, Keynote, and Google Slides.


7 slides
Framework Documentation Infographic
A framework infographic presents a framework for organizing and understanding complex information, to provide an overview of the key elements and relationships between them. This template is designed to break down your large amounts of information into smaller, more manageable parts. This infographic can be used in fields such as business, marketing, and strategy, as well as in education and research. Use it to explain complex concepts, theories, and models, and to provide a visual representation of how elements fit together. This can take a variety of forms, including flowcharts and diagrams.


25 slides
Draco Photography Portfolio Template Presentation
Showcase your photography portfolio with this dynamic template! Highlight your projects, style, client testimonials, and awards. Includes sections for pricing, services offered, and social media links. Ideal for photographers to create impactful presentations. Compatible with PowerPoint, Keynote, and Google Slides.