


Features
- 3 Unique Slides
- Fully editable and easy to edit in Microsoft Powerpoint, Keynote and Google Slides
- 16:9 widescreen layout
- Clean and professional designs
- Export to JPG, PDF or send by email


Do you have any questions?
Recommend

23 slides
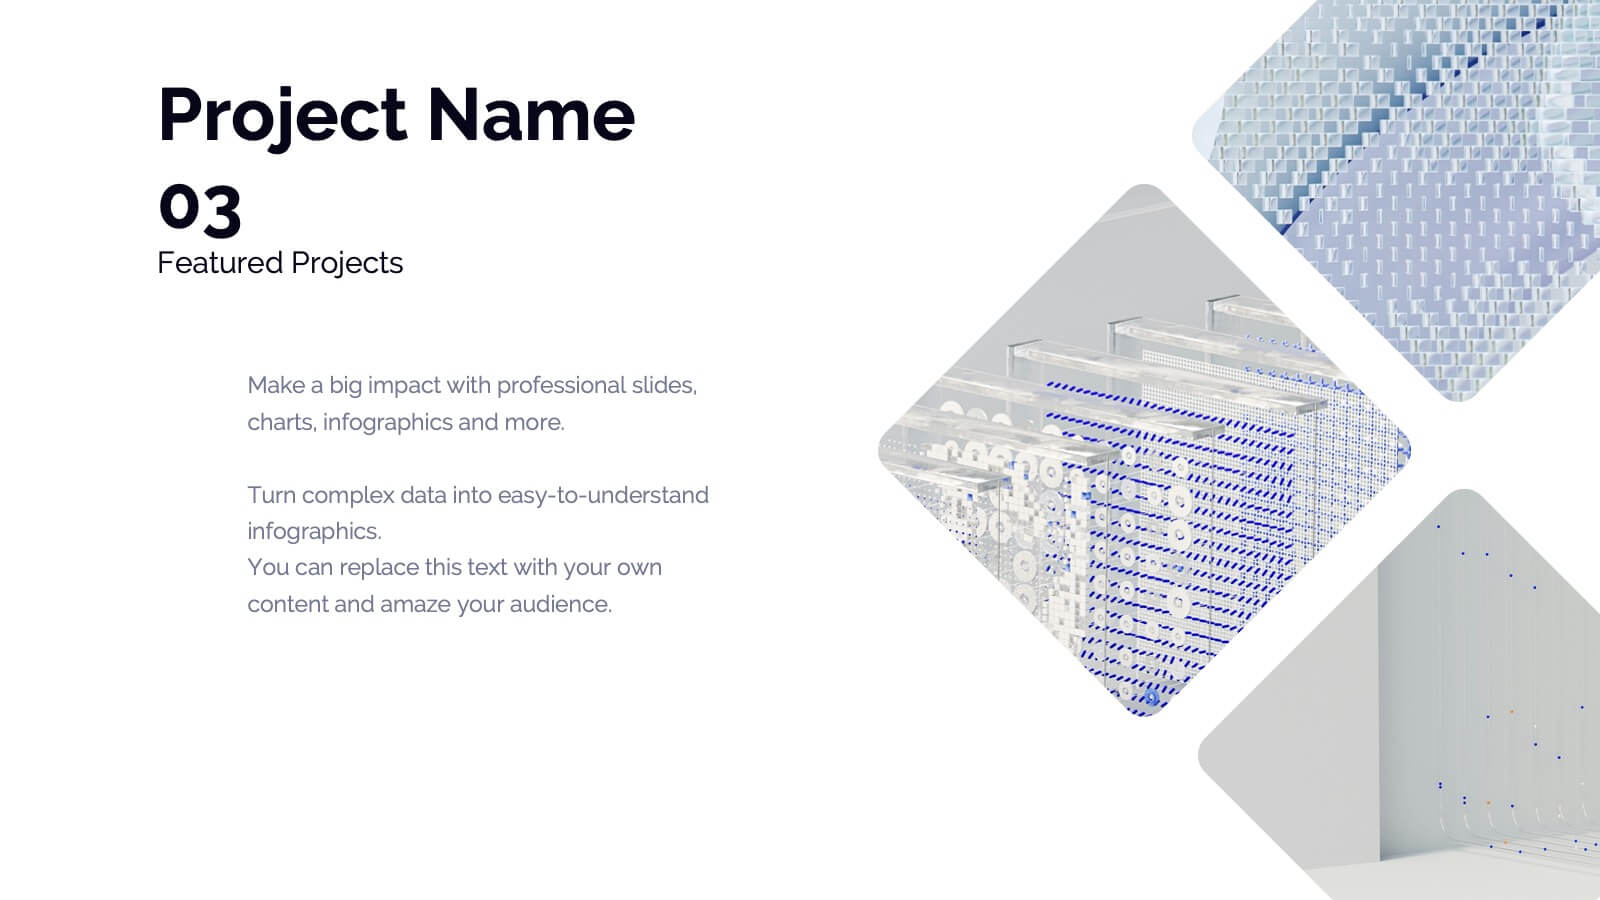
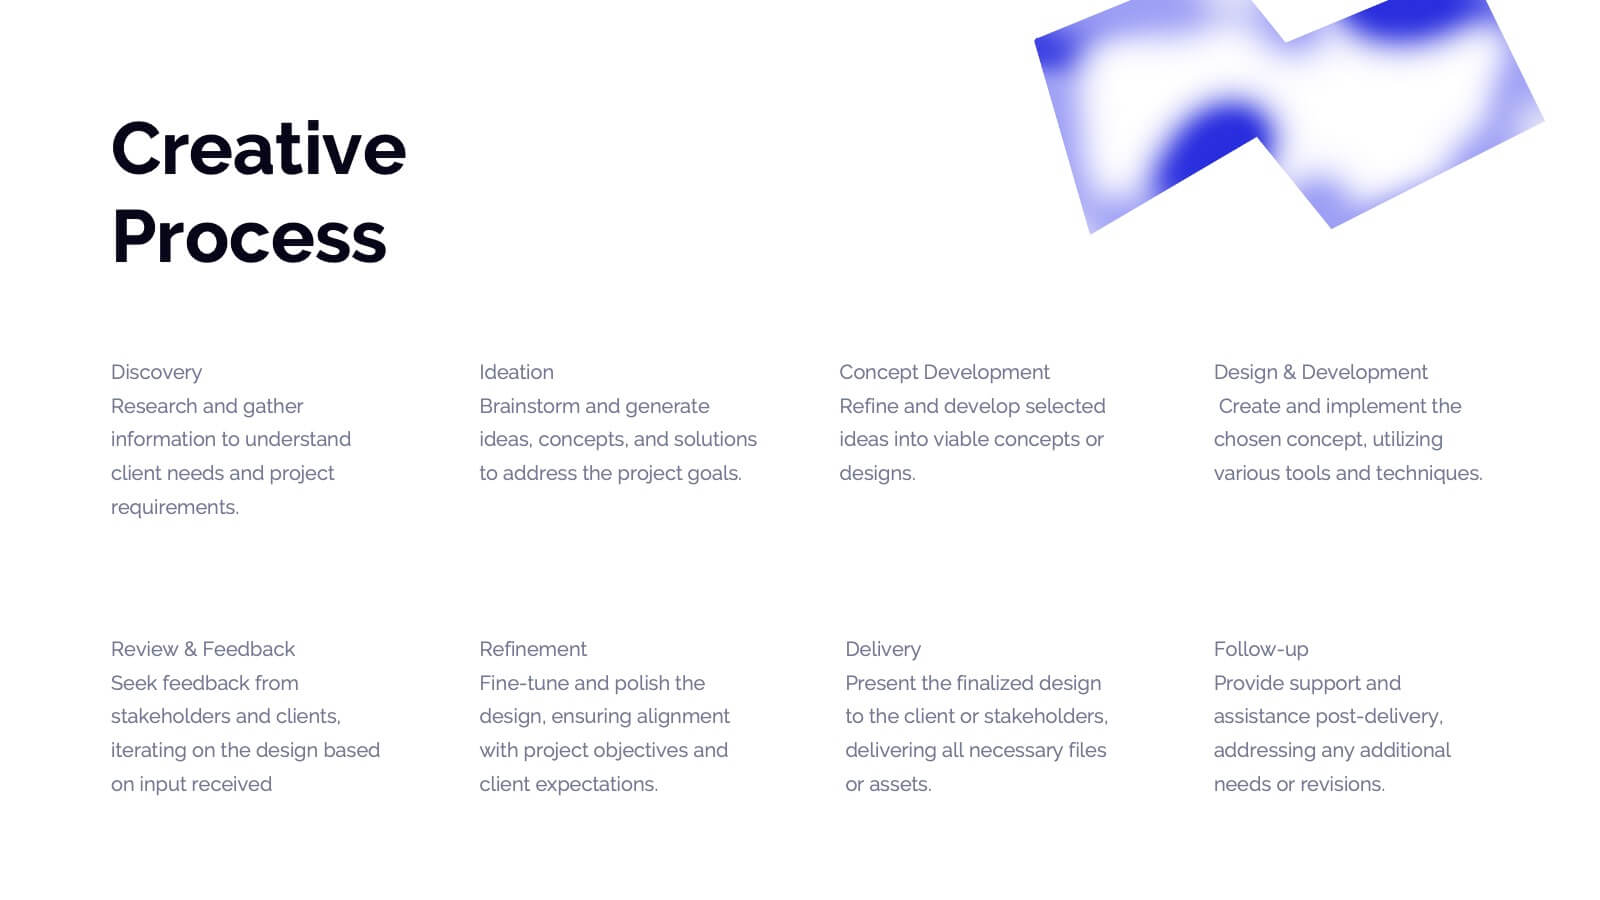
Dryad Photography Portfolio Template Presentation
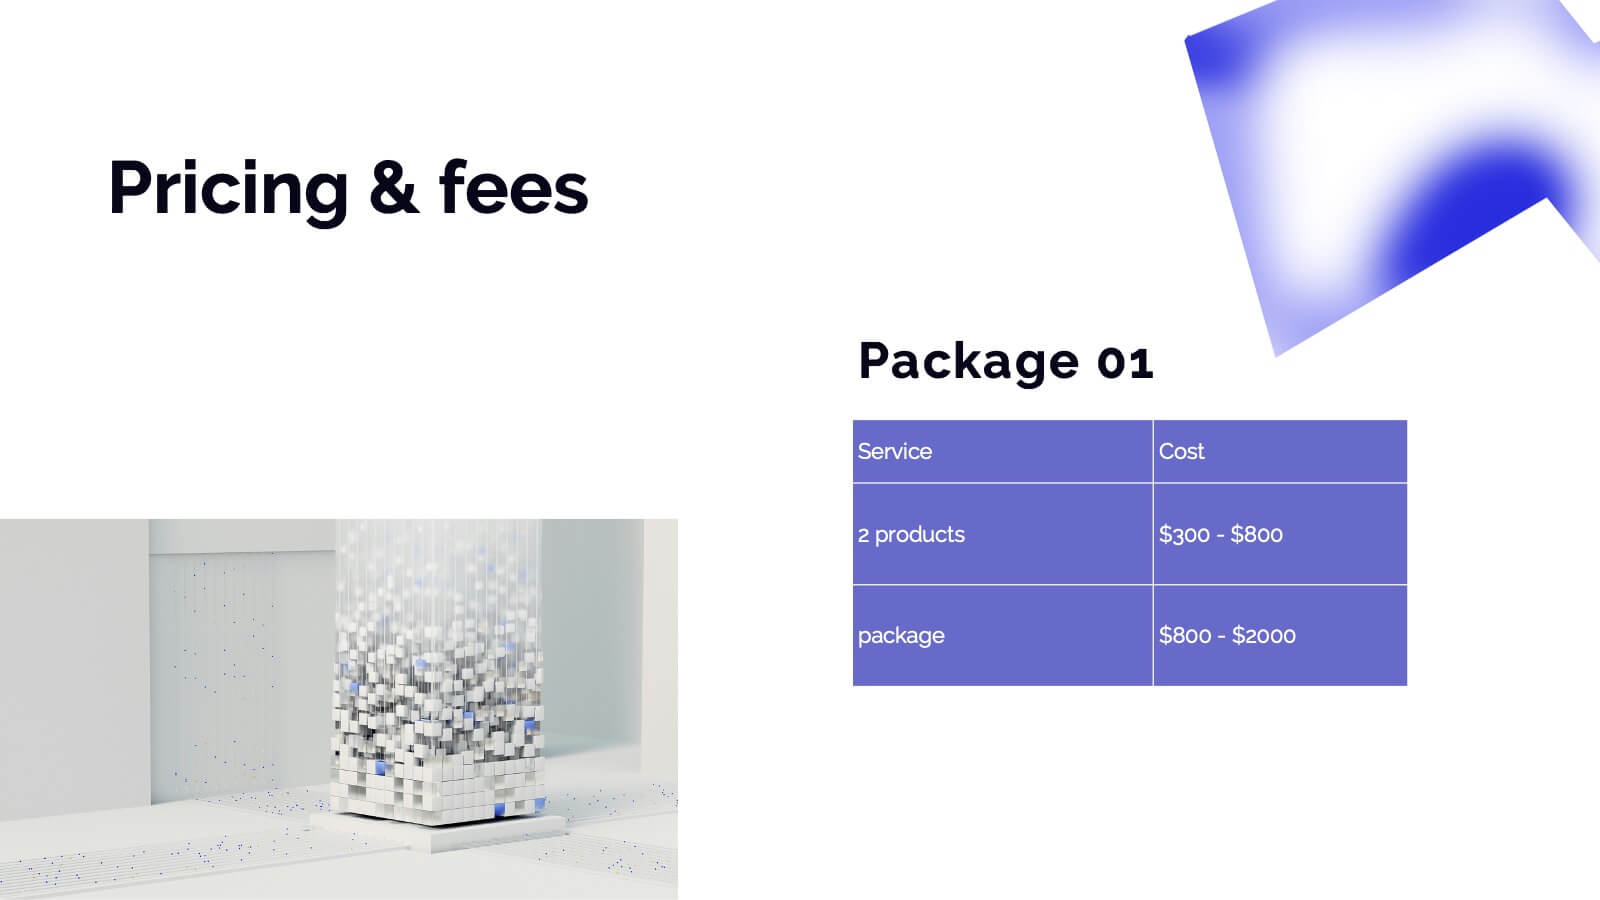
Showcase your photography skills with this elegant and professional portfolio presentation template! Perfect for highlighting your projects, style, and creative process, this template covers everything from client testimonials to pricing and services offered. It’s ideal for photographers wanting to present their work with style and clarity. Compatible with PowerPoint, Keynote, and Google Slides for effortless sharing and presentations.


5 slides
5-Level Risk Management Plan Presentation
Turn complex strategies into clear, visual steps with this sleek layered layout designed for analyzing and mitigating potential risks. Each level helps you outline priorities, assess impact, and communicate safety measures effectively. Fully compatible with PowerPoint, Keynote, and Google Slides, making customization fast, professional, and presentation-ready.


5 slides
Market Improvement Trends and Expansion in Oceania Map Presentation
Present your market insights with clarity using this Oceania-focused expansion map. Highlight four key regions with callouts and data pointers, ideal for tracking growth trends, regional strategies, or entry points. Fully editable and compatible with PowerPoint, Keynote, and Google Slides—perfect for strategic planning, investor decks, and regional market analysis.


26 slides
Modern Company Profile Striped Presentation
Present your company with style, our modern company profile presentation, is the perfect template to showcase your business in a contemporary and stylish way. This template combines professionalism with a touch of flair and striped elements, making it ideal for modern businesses looking to make a lasting impression. Ideal for tech startups, creative agencies, or a professional service firms, this presentation will help you convey your company's professionalism. Fully customizable and compatible with Powerpoint, Keynote, and Google Slides. This makes it easy for potential clients, partners, and investors to reach out!


6 slides
Cloud Computing Basics Presentation
Bring clarity to the digital world with this sleek and modern template designed to explain online data systems and cloud structures. Perfect for showcasing storage models, connectivity, and IT workflows with simplicity and style. Fully editable and compatible with PowerPoint, Keynote, and Google Slides for seamless customization.


8 slides
Governance and Compliance Framework
Streamline your compliance reporting with this triangle-based governance framework slide. Featuring three core pillars—Risk, Strategy, and Leadership—this layout visually connects your organizational roles, responsibilities, and regulatory measures. Each corner is paired with numbered titles and editable icons, perfect for illustrating audits, policies, or internal controls. Fully editable in PowerPoint, Keynote, and Google Slides.


4 slides
Healthcare Medical Infographic Presentation
Bring your healthcare insights to life with a clean, calming design that makes complex medical data easy to follow. This presentation highlights key health metrics, patient information, and wellness topics using simple visuals and structured layouts for clarity. Fully compatible with PowerPoint, Keynote, and Google Slides.


7 slides
Root Cause Analysis Infographic Presentation Template
Root cause analysis is a method of problem solving that identifies the cause of an issue and tries to prevent similar issues from happening again. Root cause analysis can be used in any industry, including IT, manufacturing, telecommunications, industrial process control, accident analysis and healthcare to eliminate misunderstandings. This template is perfect if you need an essential problem-solving method. This root cause analysis template includes a helpful timeline to keep track of items that cross through each stage in the process, and a diagram of all the possible causes.


6 slides
Travel Itinerary and Budget Planning Presentation
Plan trips with precision using this visually organized circle-based infographic. With six labeled sections and travel-themed icons, this layout helps you outline schedules, expenses, and key milestones clearly. Perfect for tour operators, travel bloggers, or itinerary services, this slide ensures information is both engaging and easy to follow. Fully editable in PowerPoint, Keynote, and Google Slides.


7 slides
Business People Management Infographic
Business people refer to individuals involved in the world of commerce and trade, encompassing various roles within the business landscape. This Infographic is an illuminating and dynamic template designed to guide you through the art and science of managing human capital within the business sphere. Explore the key aspects of effective people management and elevate your organizational success by harnessing the power of your workforce. Compatible with Powerpoint, Keynote, and Google Slides. Discover the art of leading and engaging your team, and witness the transformation as your organization excels and grows, driven by the power of effective people management!


6 slides
Matrix Diagram Business Analysis Infographic
Streamline your business analysis with our Matrix Diagram Infographic Template. This versatile tool is designed for clarity and impact, helping you compare and contrast various data points. Whether you're assessing risks, evaluating performance, or categorizing information, our template provides a visually appealing and easy-to-understand matrix layout. Compatible with PowerPoint, Google Slides, and Keynote, it's the perfect addition to your business presentations. With its customizable design, you can tailor the colors, shapes, and text to fit your specific needs. Use this template to bring a professional edge to your strategic planning and stakeholder communication.


4 slides
Creative Title Slide Templates Presentation
Make a bold first impression with the Creative Title Slide Templates Presentation. Featuring a sleek, split-layout design with glowing blue abstract waves, this template combines modern aesthetics with functional clarity. Circular icons on the side offer quick visual cues for business categories or departments. Ideal for keynote introductions or professional project kickoffs. Compatible with PowerPoint, Keynote, and Google Slides.


20 slides
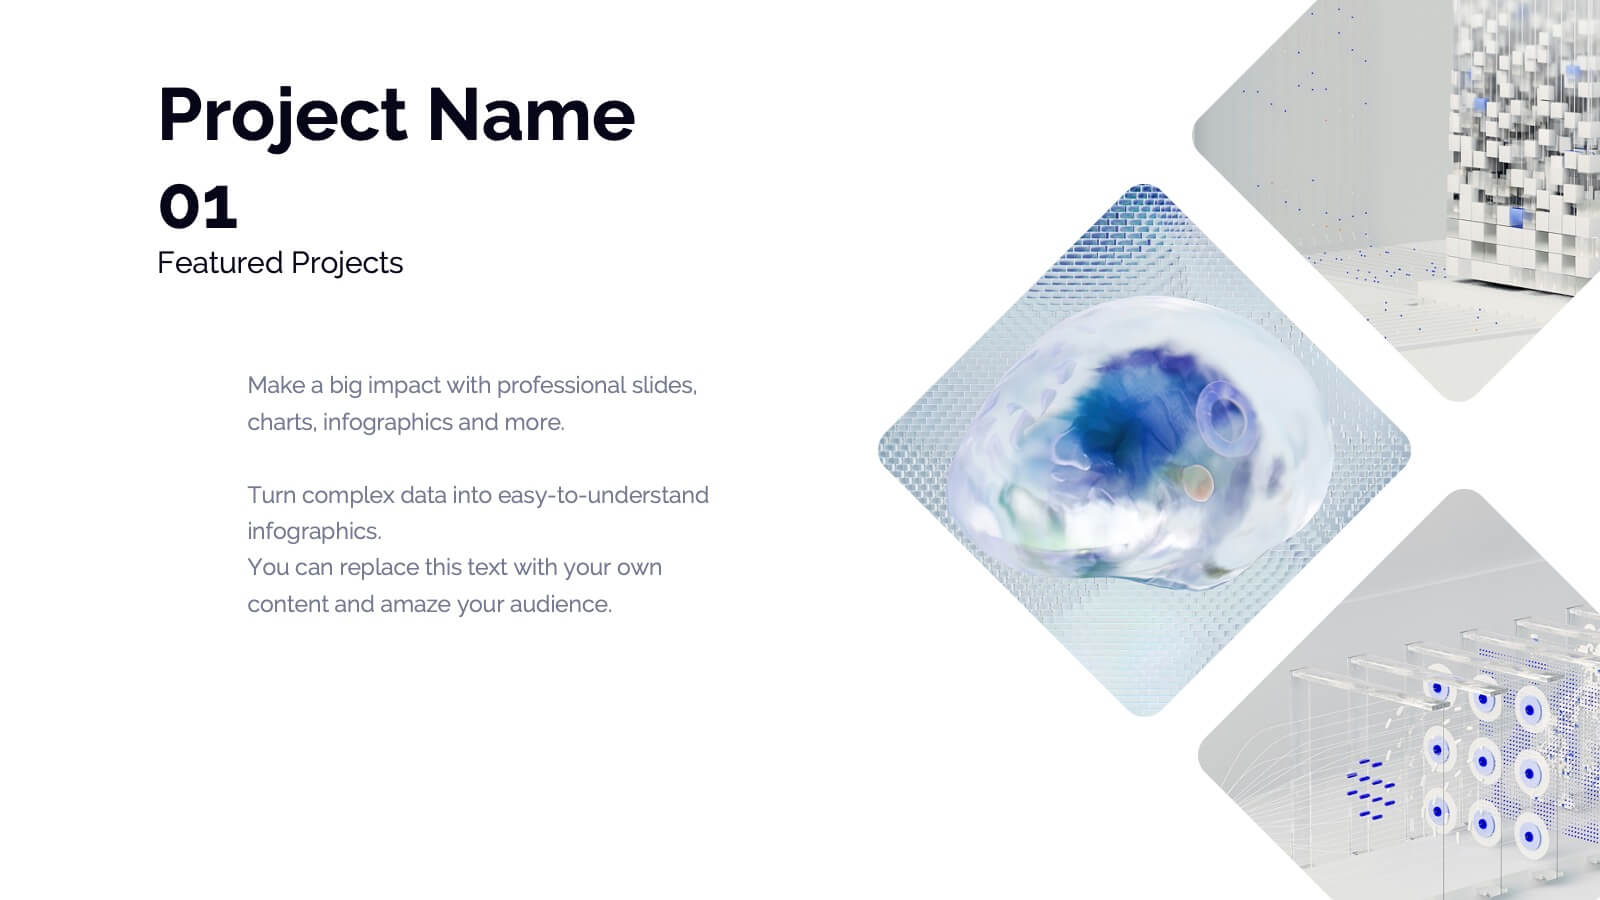
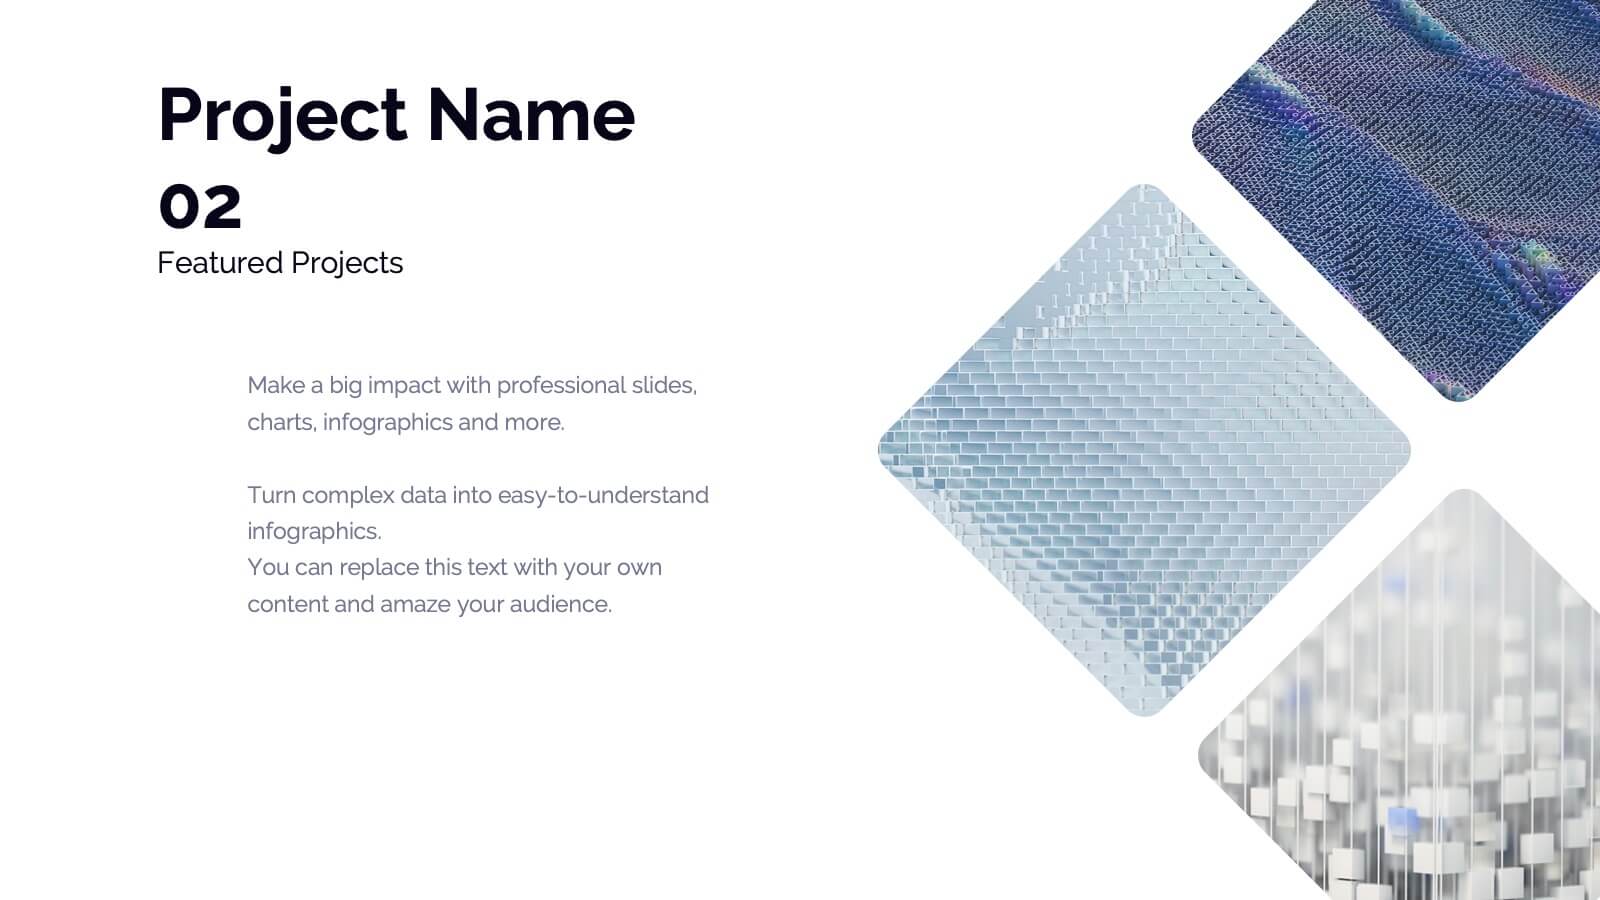
Harmony Sales Forecast Presentation
Elevate your sales forecasting presentations with this vibrant and engaging template! Designed to captivate your audience, it covers all critical areas such as objectives, strategy, performance metrics, and opportunities. Keep your team motivated with visually striking layouts and an easy-to-follow structure. Compatible with PowerPoint, Keynote, and Google Slides for seamless integration!


4 slides
Highlighting Key Business Benefits Presentation
Unlock your brand's value with the Highlighting Key Business Benefits Presentation. This modern slide layout uses a visual key concept to emphasize four essential advantages, helping your audience quickly grasp your core offerings. Ideal for sales pitches, service overviews, or value proposition discussions. Fully editable and compatible with PowerPoint, Keynote, and Google Slides.


5 slides
Marketing Concepts Infographics
Marketing Concepts refer to the various strategies and philosophies that guide the marketing efforts of businesses and organizations. Our marketing concept infographics are visual representations of the different marketing concepts and strategies that businesses use to promote their products or services. These infographics can cover a wide range of marketing topics, including target audience, product positioning, branding, advertising, and video marketing. The purpose of these infographics is to provide a easy-to-understand overview of key marketing concepts that businesses can use to drive sales and increase brand awareness.


4 slides
Customer-Focused Benefit Breakdown Presentation
Put your audience at the center with the Customer-Focused Benefit Breakdown Presentation. This slide design features a spotlight-style layout that emphasizes user-centric advantages and clearly communicates your value propositions. Ideal for marketing plans, sales strategies, or user journey analysis. Fully customizable and compatible with PowerPoint, Keynote, and Google Slides.


26 slides
Jenzen Presentation Template
Jenzen is a modern multi-purpose template with warm tones for coaching and investing. Jenzen is suitable for all types of businesses Its slide designs can be used in conjunction with each other, making it perfect for sharing information about the various services available to customers. It's easy to use, resulting in high quality presentations. Its slide designs can be used with each other to create more elaborate presentations complete with charts, images and text boxes. It's simple yet stylish design makes it easy for anyone to use and is for both personal use as well as professional use.