


Features
- 4 Unique slides
- Fully editable and easy to edit in Microsoft Powerpoint, Keynote and Google Slides
- 16:9 widescreen layout
- Clean and professional designs
- Export to JPG, PDF or send by email


Do you have any questions?
Recommend


6 slides
Business Challenge Identification Presentation
Spotting roadblocks has never looked this good! This infographic presentation template helps you map out key pain points across departments or processes, making it easier to analyze, discuss, and resolve challenges visually. It’s a perfect tool for business strategy teams and consultants. Fully compatible with PowerPoint, Keynote, and Google Slides.


7 slides
E-Learning Solutions Infographic
Elevate the e-learning experience with our E-Learning infographic. Featuring a harmonious blend of serene purple and crisp white, this infographic encapsulates the transformative world of digital learning. Tailored for educators, e-learning consultants, and instructional designers, it vividly illustrates the nuances of online education. Incorporated within are ingenious graphics, relevant icons, and dedicated image placeholders, all set to anchor your content and enhance comprehension. Regardless of your preferred platform – PowerPoint, Keynote, or Google Slides – this template is your tool to effectively convey the dynamism of e-learning.


22 slides
Marketing Research Presentation
Streamline your data presentation with our Marketing Research template. It includes comprehensive slides on research objectives, methodology, data analysis, and key findings. Ideal for academic and professional settings, this template is compatible with PowerPoint, Keynote, and Google Slides, enhancing your research presentations with precision and professionalism.


5 slides
Hospital Operations and Services Overview Presentation
Deliver a clear, structured view of healthcare operations with this stethoscope-themed presentation slide. Ideal for medical service breakdowns, hospital department overviews, or care process explanations. Fully customizable in PowerPoint, Keynote, and Google Slides, this layout supports healthcare professionals, administrators, and educators aiming to present medical services with precision and professionalism.


10 slides
Corporate Briefing Schedule Agenda
Present your briefing points clearly with the Corporate Briefing Schedule Agenda Presentation. This linear layout uses bold icons, color-coded sections, and connecting lines to outline four key discussion items—ideal for company meetings, timelines, or project updates. Fully editable in PowerPoint, Keynote, and Google Slides.


5 slides
Strategic Business Case Presentation
Make every proposal stand out with a clear, goal-focused design that simplifies your strategic narrative. Ideal for presenting initiatives, project justifications, or decision-making insights, this layout balances visual clarity with professionalism. Fully compatible with PowerPoint, Keynote, and Google Slides for effortless editing and polished presentations.


21 slides
Creative Sales Pitch Presentation
Boost your sales presentations with this sleek, professional template designed to captivate and inform. With its modern design, clear layout, and strategic use of visuals, this template is perfect for showcasing sales strategies, performance metrics, and future opportunities. Compatible with PowerPoint, Keynote, and Google Slides, it's ideal for seamless use across all devices.


7 slides
Technology Infographic Presentation Template
A technology infographic is a visual representation of information or data related to technology. The purpose of this template is to present your complex information in a simple, easy-to-understand manner. This template contains pre-designed layouts and images that can be used to structure your content in a variety of ways. This template is perfect to use to help explain technology-related topics such as software, hardware, cybersecurity, and more. Infographics are commonly used in the technology industry to help educate people about the latest trends, products, and services.


10 slides
Financial Growth Planning
Visualize your path to financial success with this puzzle-themed Financial Growth Planning template. Each step connects seamlessly to outline investment goals, budgeting strategies, or revenue milestones. Designed for clarity and impact, it's fully editable in PowerPoint, Keynote, and Google Slides for effortless customization.


7 slides
Strategy Investment Wheel Infographic
The Strategy Wheel is a visual tool and framework used in strategic management to help organizations align their strategies, goals, and initiatives. This infographic template is designed to act as your compass, guiding you through the intricate pathways of investment strategies. This template brings forth the core concepts and strategic directions, ensuring you're well-equipped to steer your investment journey effectively. Compatible with Powerpoint, Keynote, and Google Slides. This infographic is depicted as a circular diagram divided into segments, each representing a key aspect of the organization's strategy.


22 slides
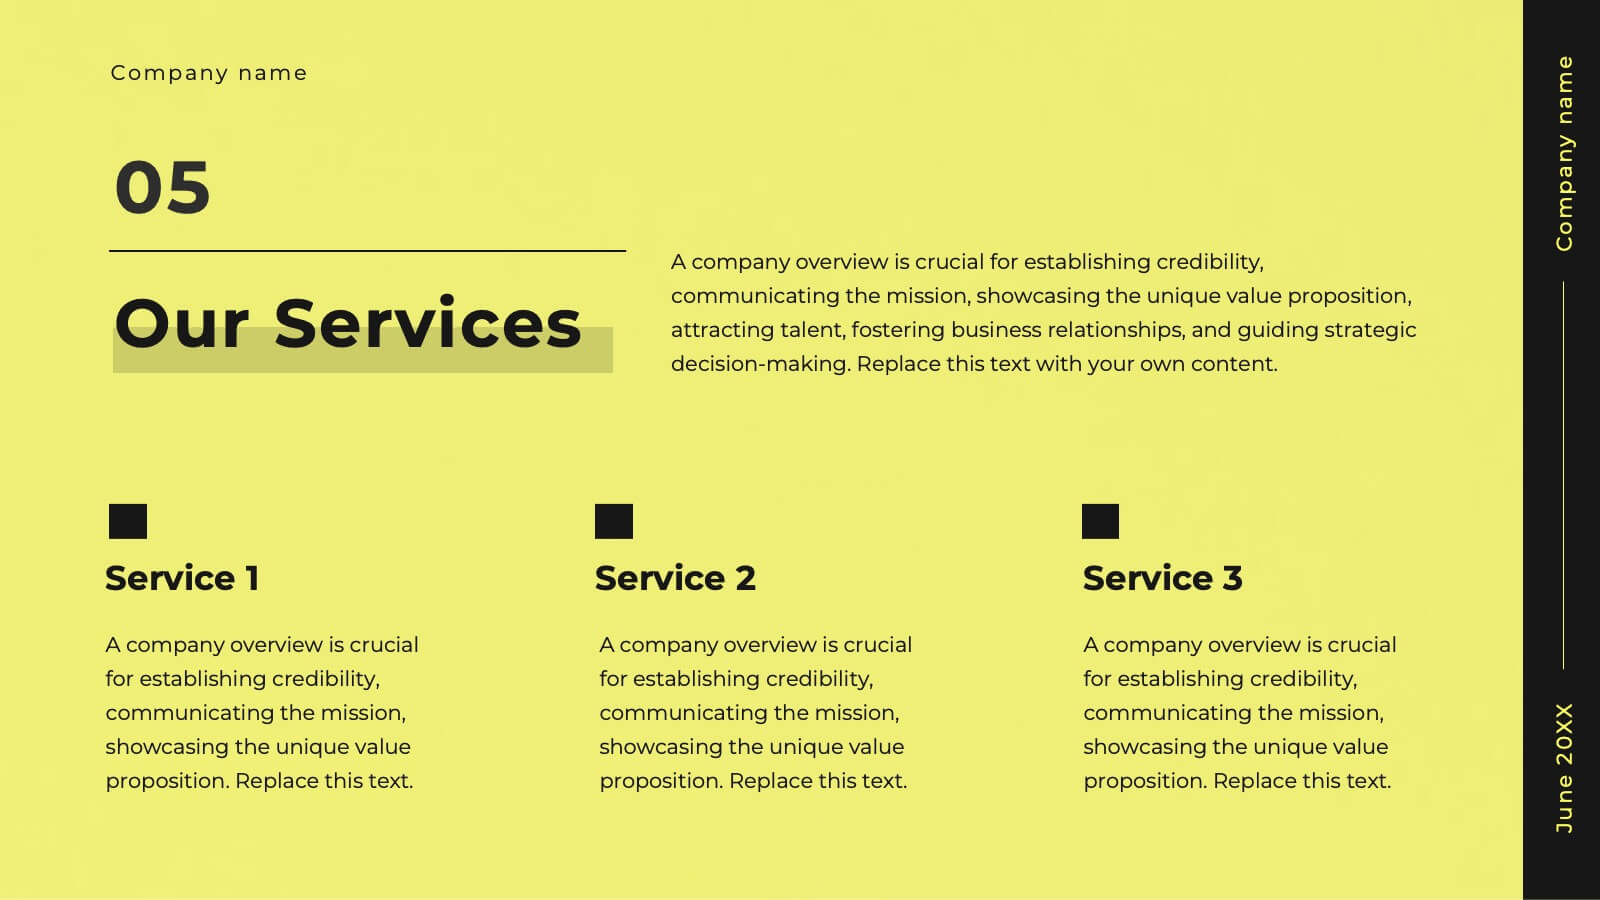
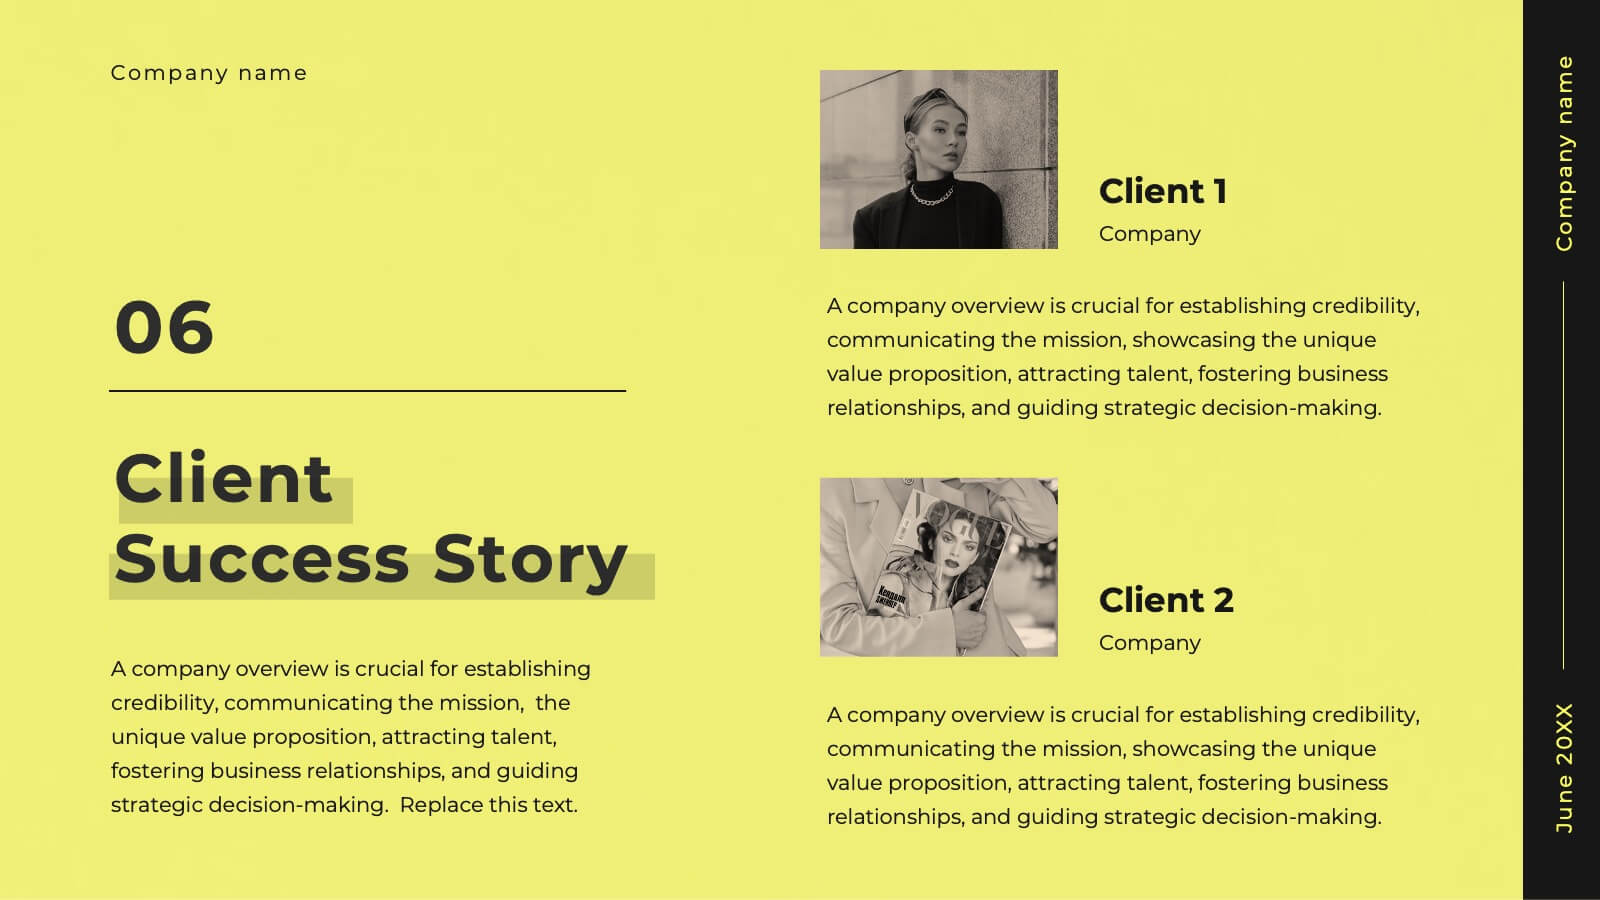
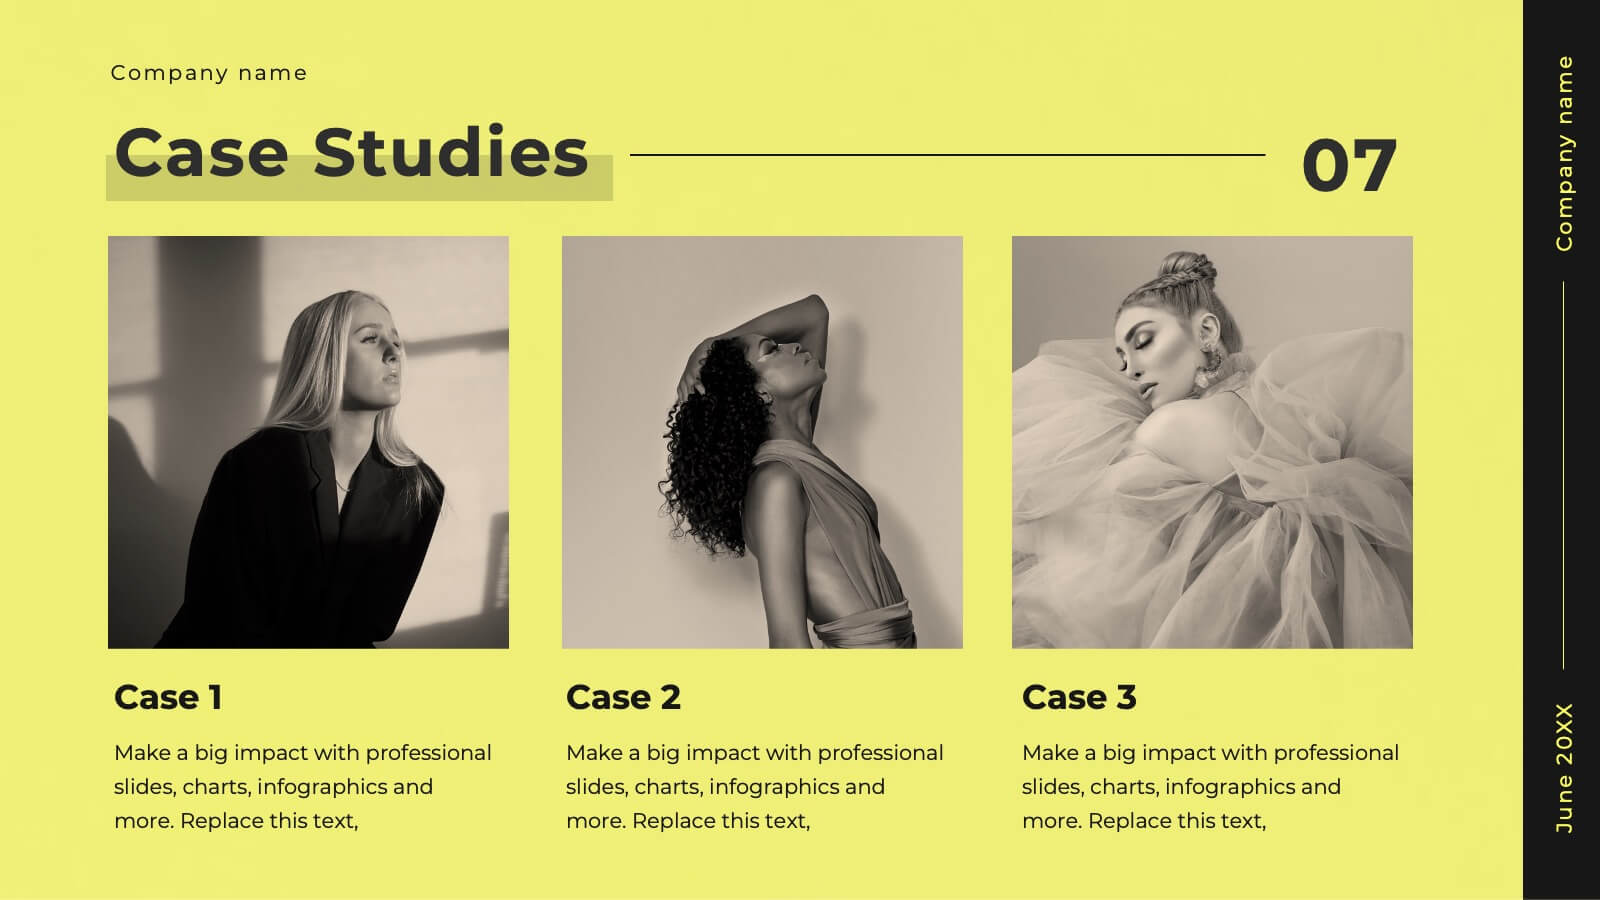
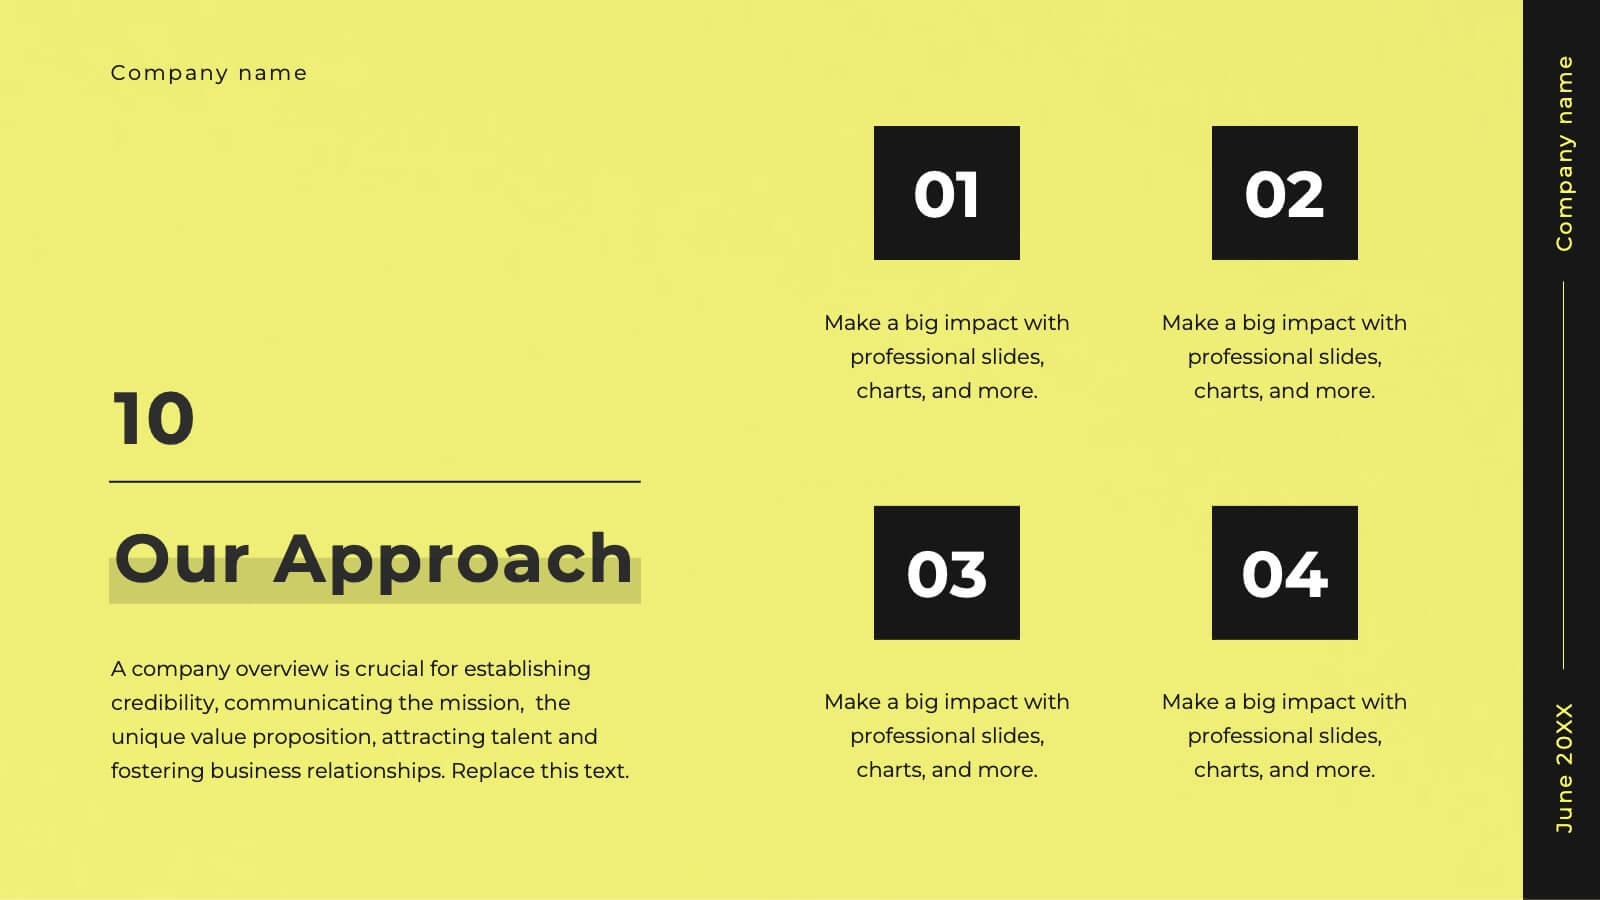
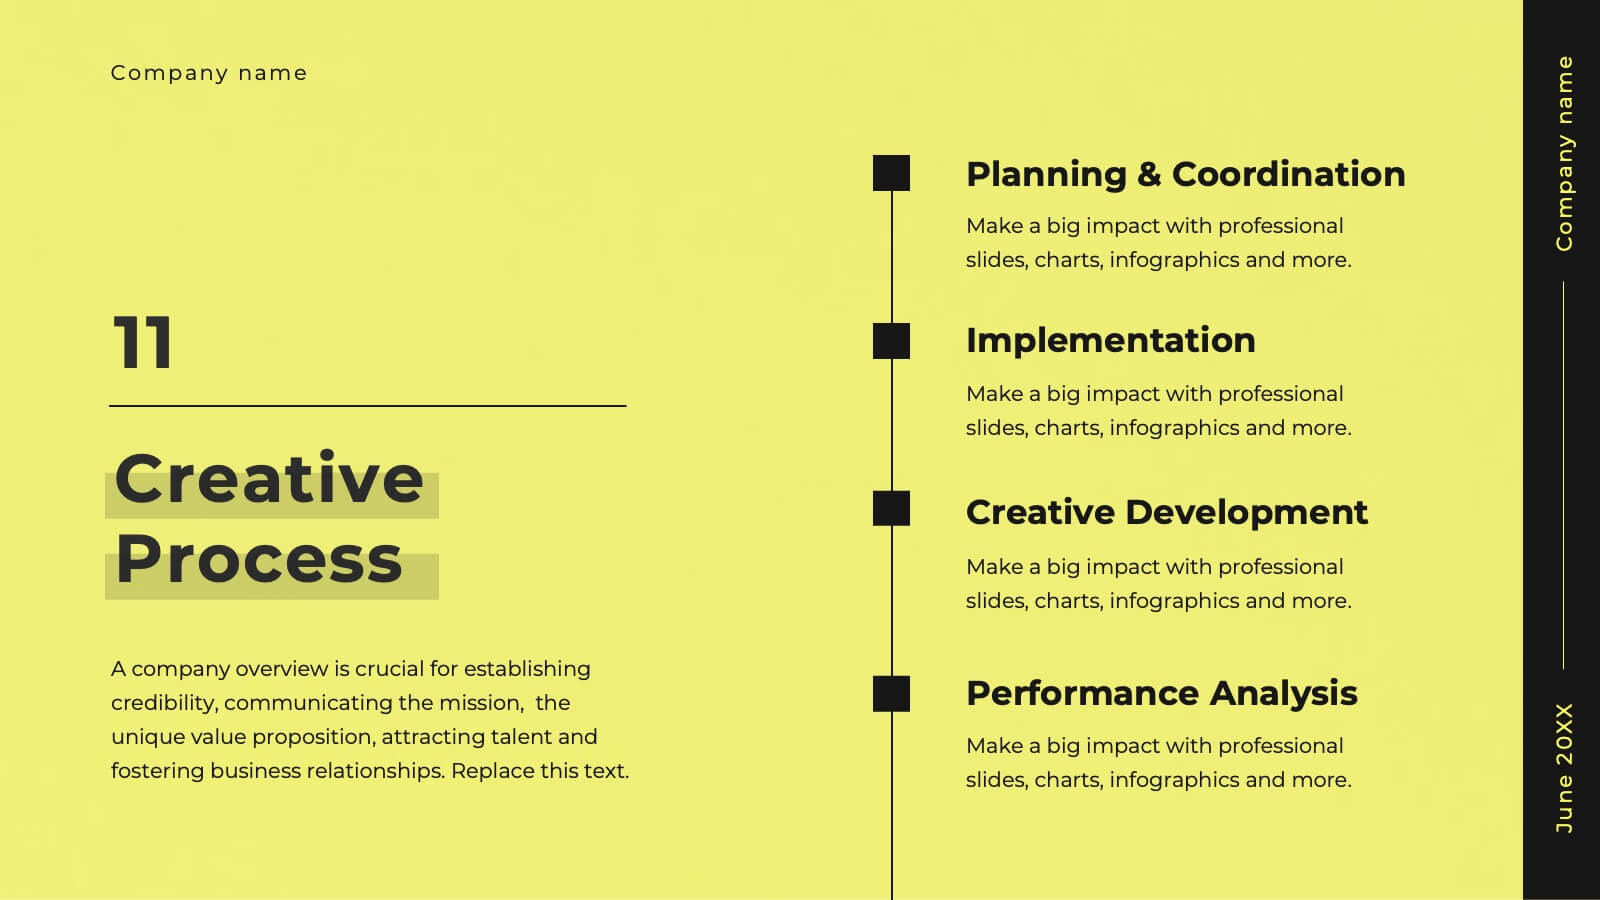
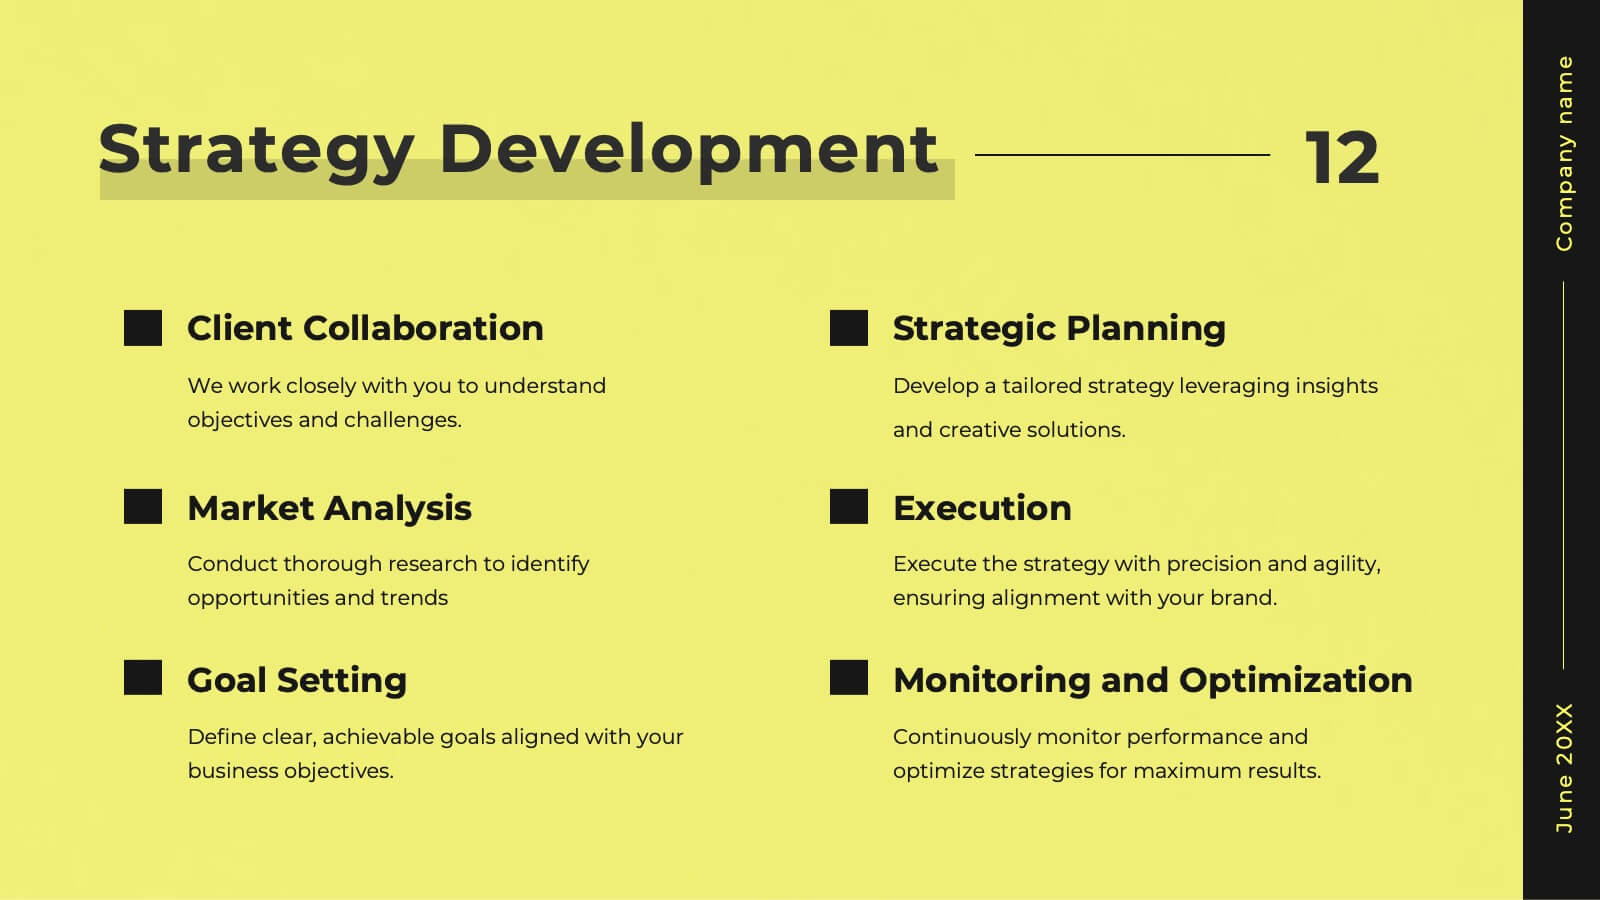
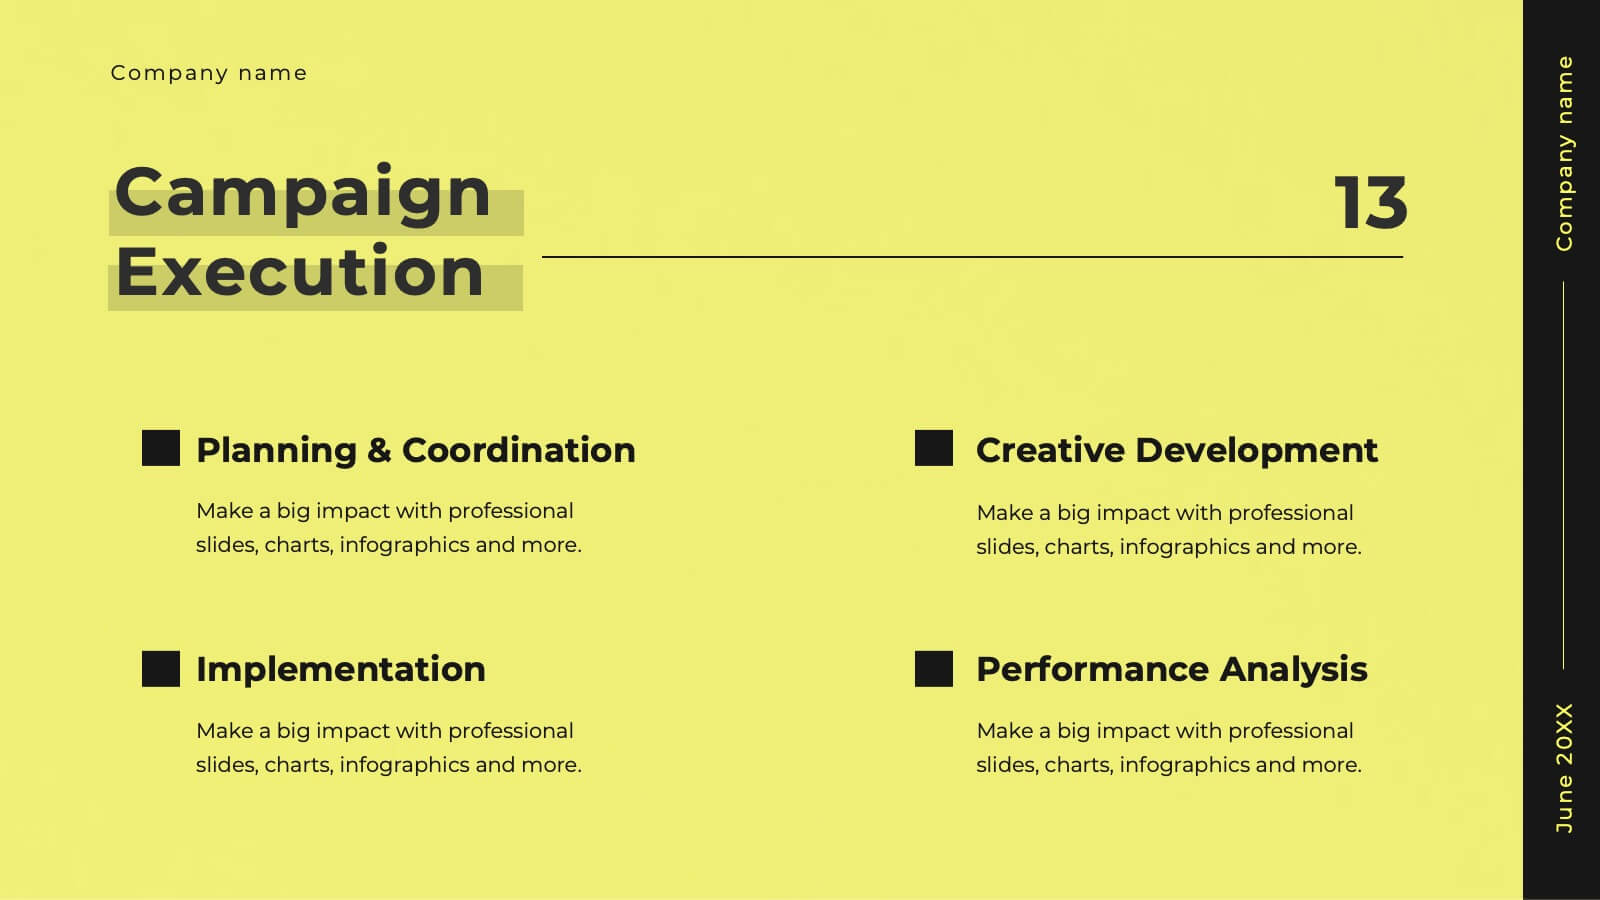
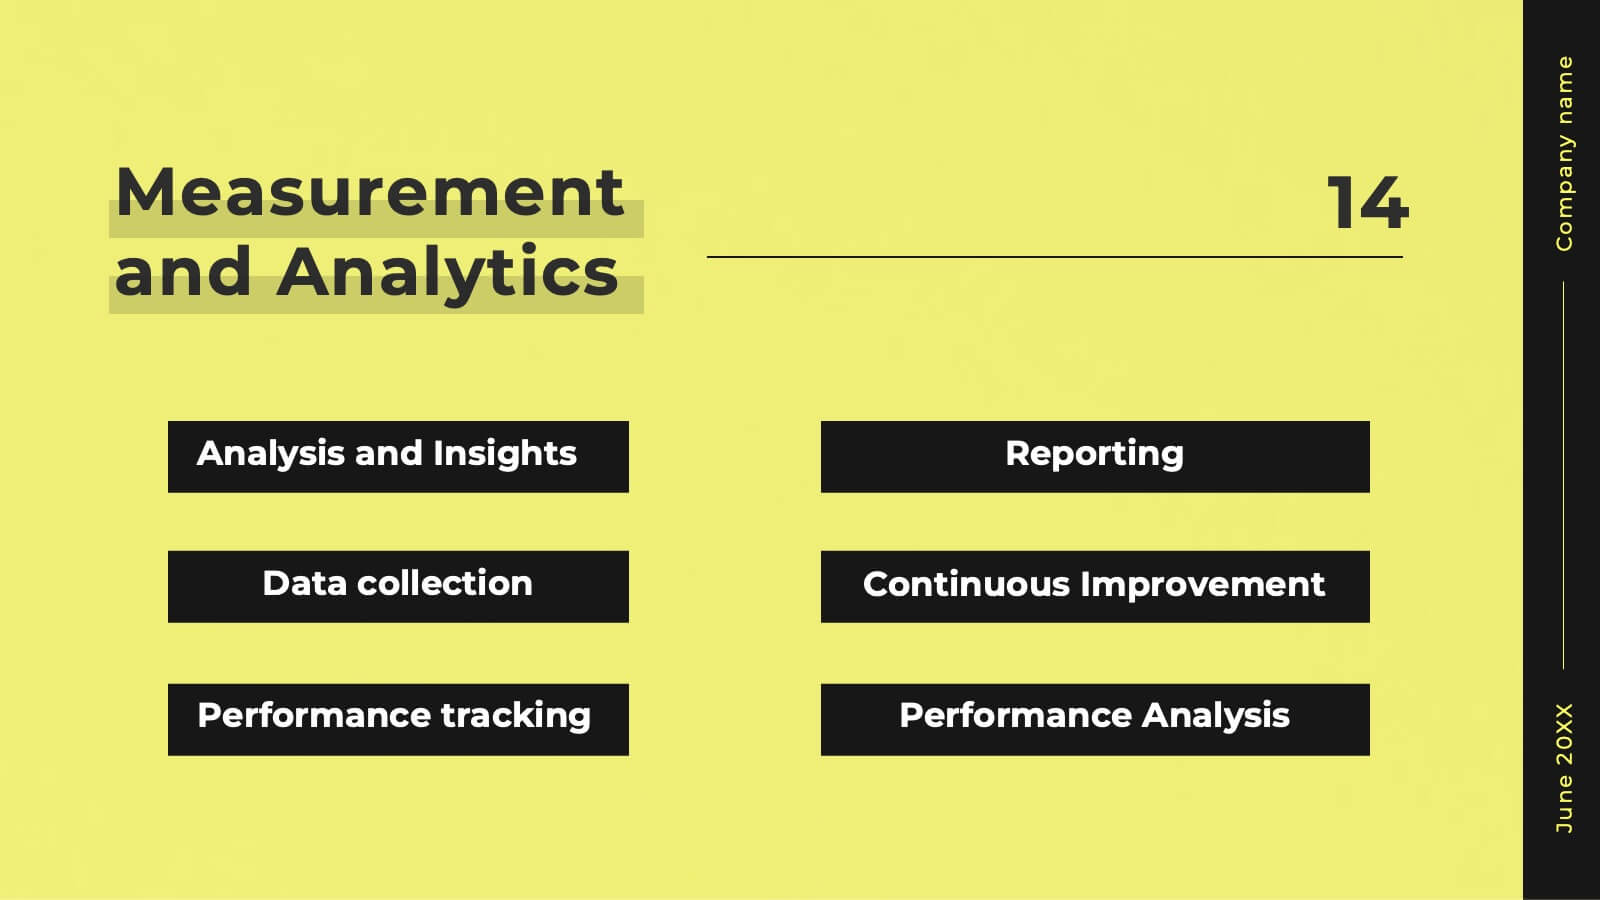
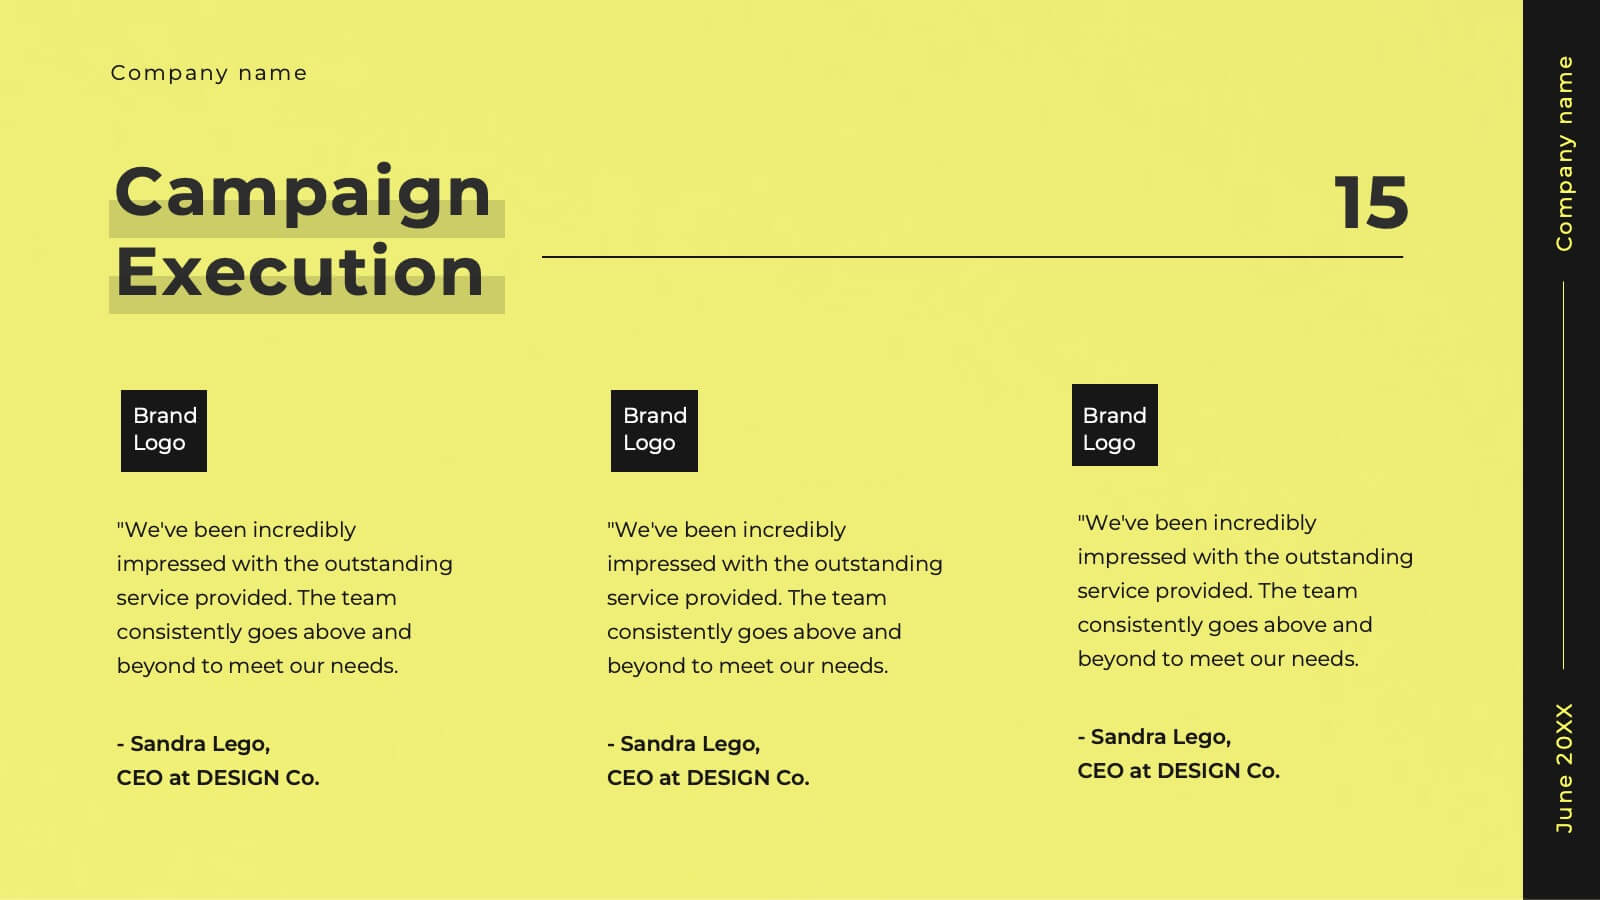
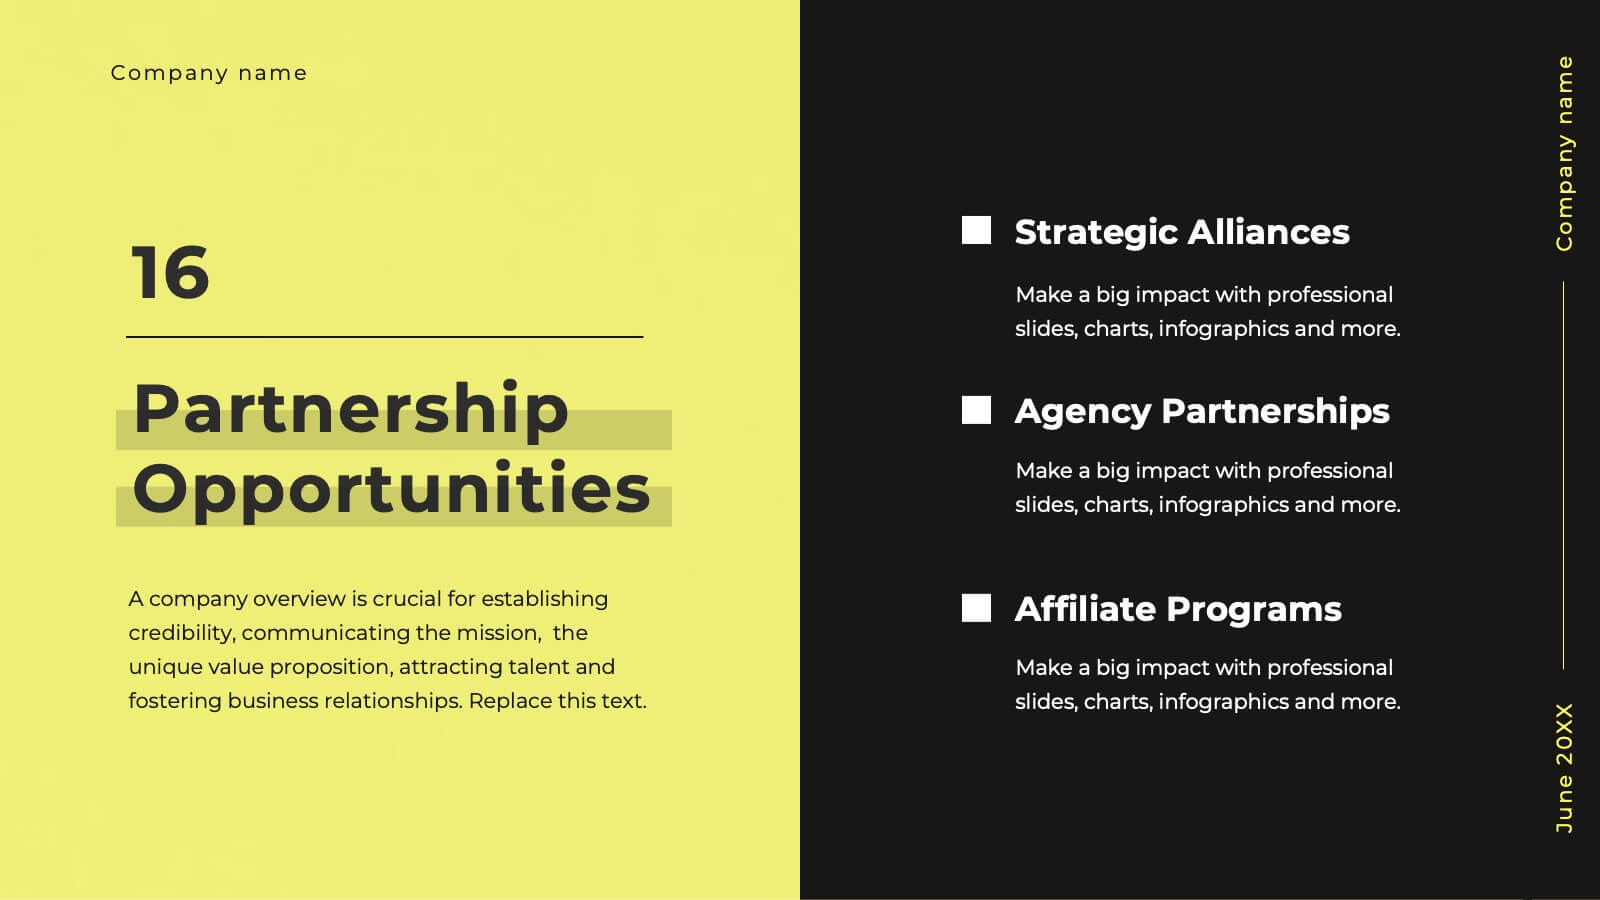
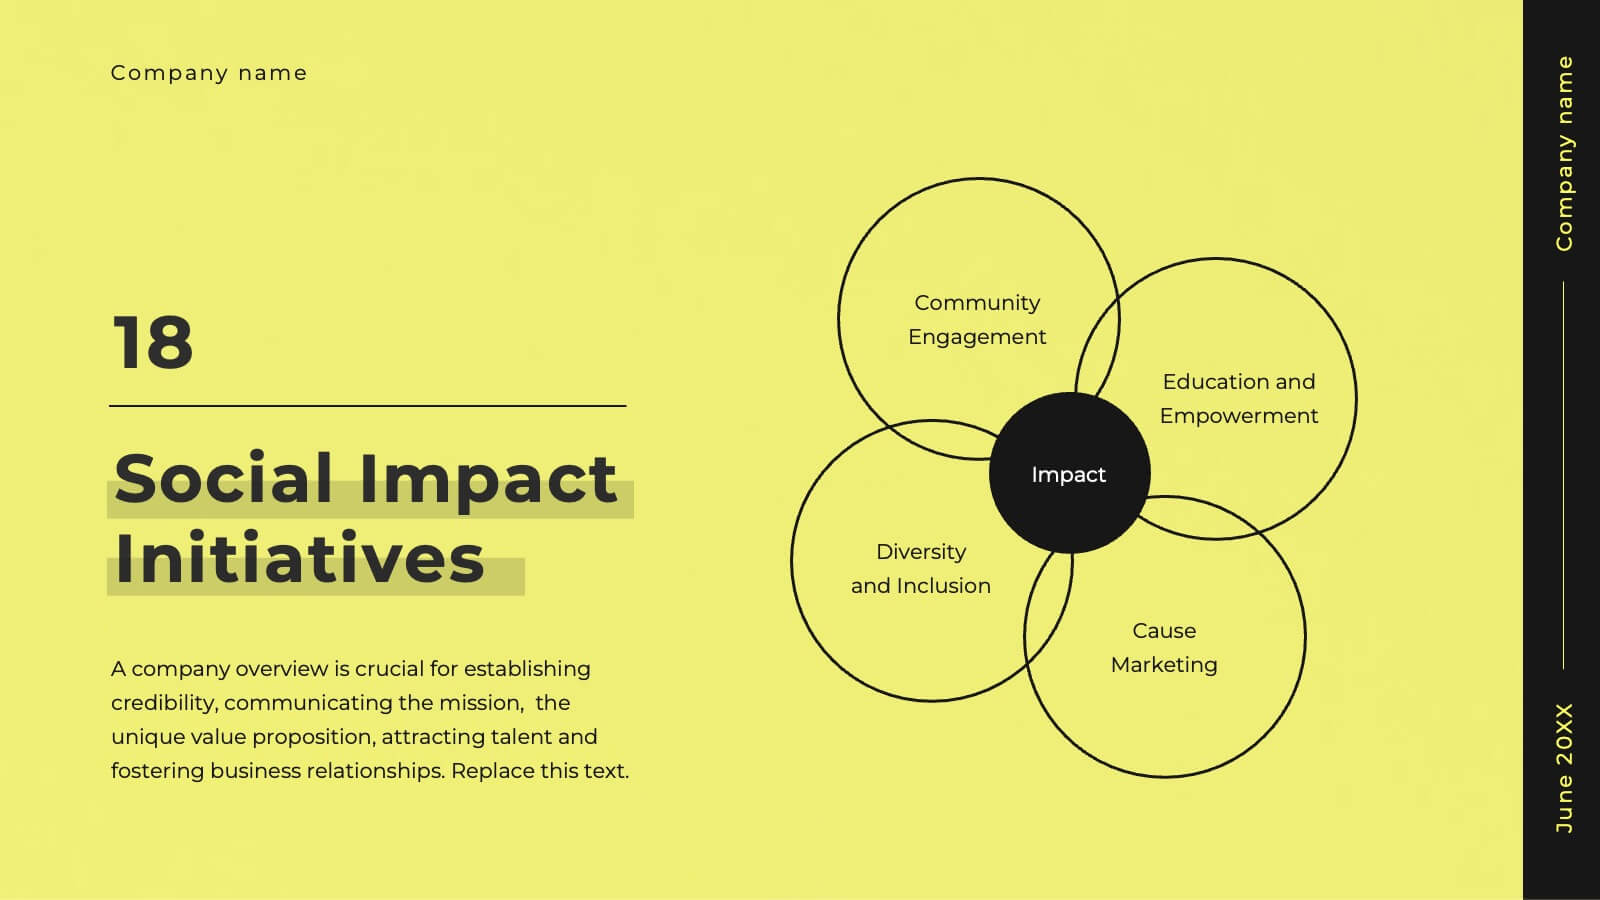
Glimmer Creative Agency Pitch Deck Presentation
Step up your game with this vibrant agency pitch deck template! Ideal for showcasing your services, client success stories, and strategic approach, it includes dynamic slides for market analysis and campaign execution. Engage potential clients with compelling visuals and well-organized content. Compatible with PowerPoint, Keynote, and Google Slides for a smooth presentation experience on any platform.


8 slides
Healthcare Data Analysis Presentation
The "Healthcare Data Analysis Presentation" template offers a streamlined visual representation ideal for communicating complex healthcare data insights effectively. Designed with clarity in mind, it features sleek graphics symbolizing medical elements and clear percentage tags that quantify data in an immediately understandable way. This template facilitates the presentation of key data such as patient outcomes, treatment efficacy, or operational efficiency within healthcare settings. Its visual simplicity makes it an excellent choice for healthcare professionals and administrators who need to convey detailed statistics and results to stakeholders, ensuring that the key points are easily digestible and actionable.


5 slides
Business Strategy Decision Tree Presentation
Streamline your strategic decisions with this Business Strategy Decision Tree template. Designed to visually map out options, outcomes, and key choices, this slide is perfect for business analysts, consultants, and executives. Featuring hierarchical branching with clear icons and customizable sections, it helps illustrate strategic planning, problem-solving, and risk assessment. Fully compatible with PowerPoint, Keynote, and Google Slides for seamless presentation integration.


20 slides
Octave Marketing Proposal Presentation
The Proposal Presentation Template offers a modern, dynamic design to showcase your business strategies, solutions, and goals. Featuring 20 fully editable slides, it covers objectives, methodologies, team expertise, timelines, and budget breakdowns. Perfect for impactful business proposals, it's compatible with PowerPoint, Keynote, and Google Slides for seamless customization.


20 slides
Syntax Creative Design Report Presentation
The Design Presentation Template empowers you to deliver visually stunning and organized presentations. With 20 fully editable slides, it includes sections like design briefs, elements, processes, mood boards, prototypes, and timelines. Tailored for designers and creative teams, it's compatible with PowerPoint, Keynote, and Google Slides for seamless customization and impact.


7 slides
Credit Card Infographic Presentation Template
A Credit card Infographic is a stacked chart showing data visualization of credit card types and associated information, including the number of cards owned by different age groups and gender, as well as overall debt. This infographic allows you to cover the ins and outs of credit cards, from rewards to fees and interest rates. This template will help you understand how credit cards work, while comparing cards based on price and other important factors. This Infographic is the perfect way to visualize data, trends and facts in an engaging way that grabs attention and keeps people reading.


10 slides
Corporate Governance Model Presentation
Bring clarity and structure to complex leadership systems with this clean, modern slide, perfect for explaining how key responsibilities flow across an organization. It helps simplify roles, decisions, and oversight for any business audience. Fully editable and easy to use in PowerPoint, Keynote, and Google Slides.