


Features
- 4 Unique slides
- Fully editable and easy to edit in Microsoft Powerpoint, Keynote and Google Slides
- 16:9 widescreen layout
- Clean and professional designs
- Export to JPG, PDF or send by email


Do you have any questions?
Recommend

22 slides
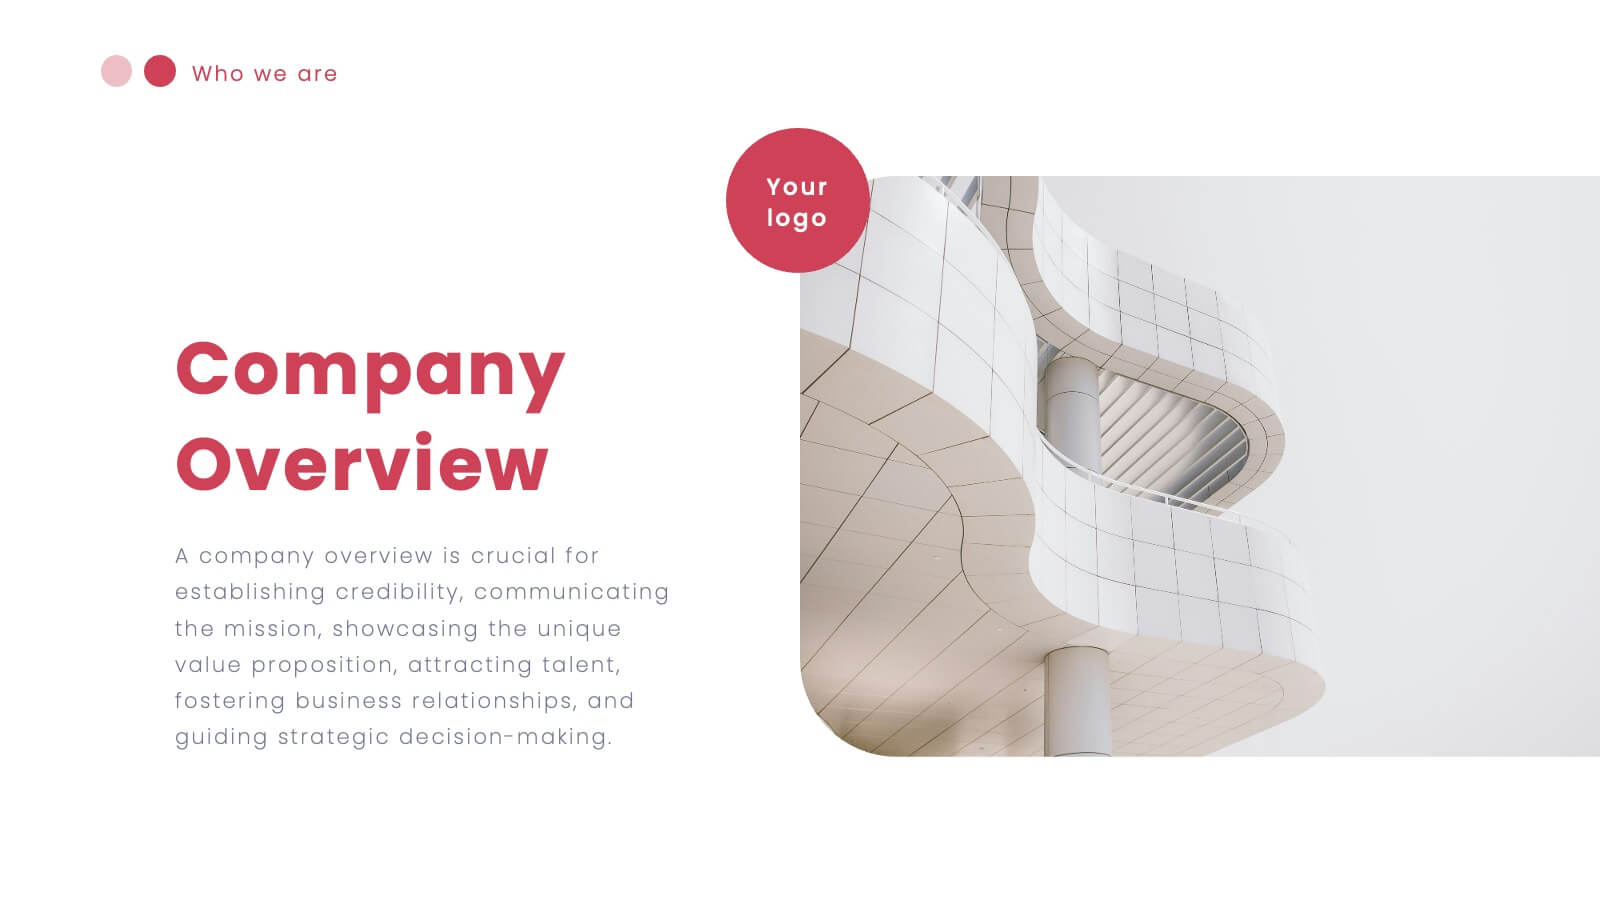
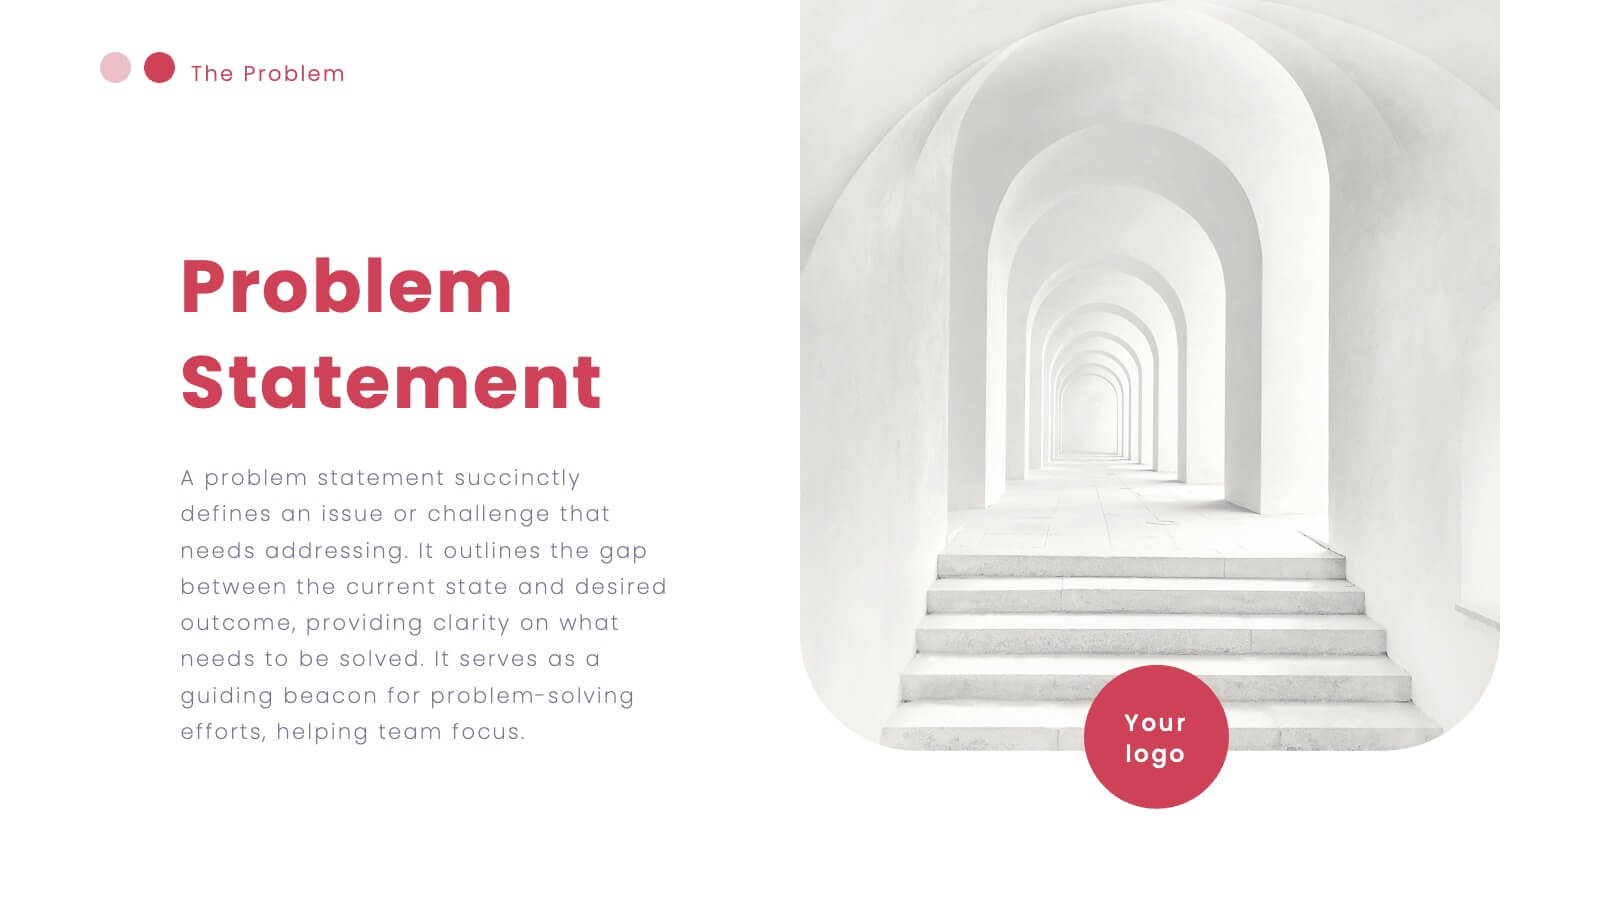
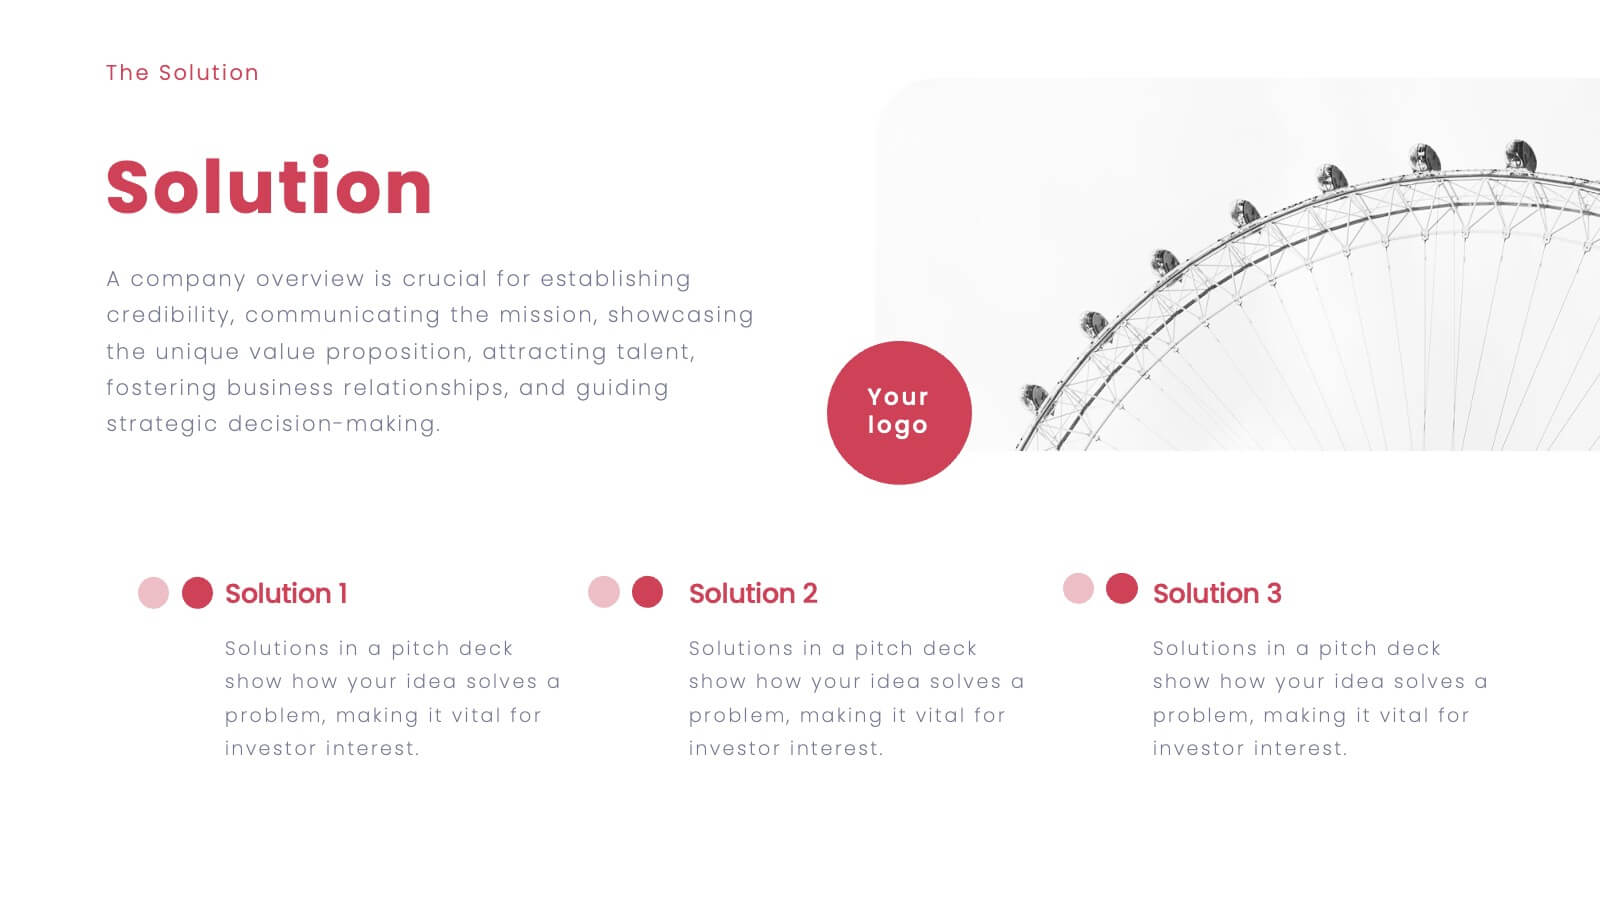
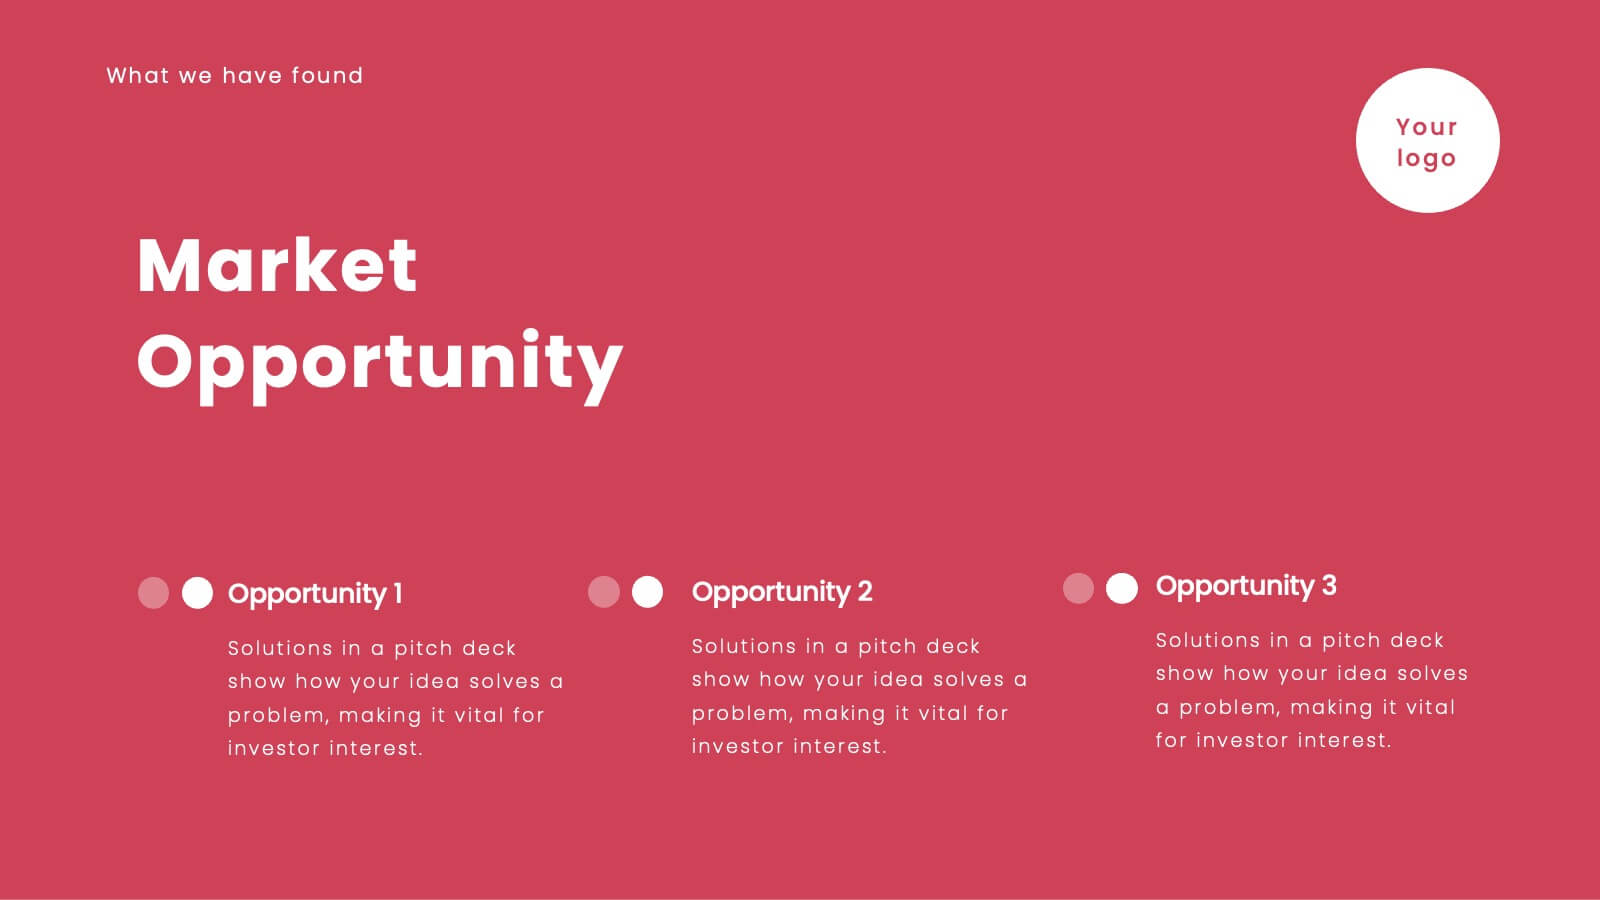
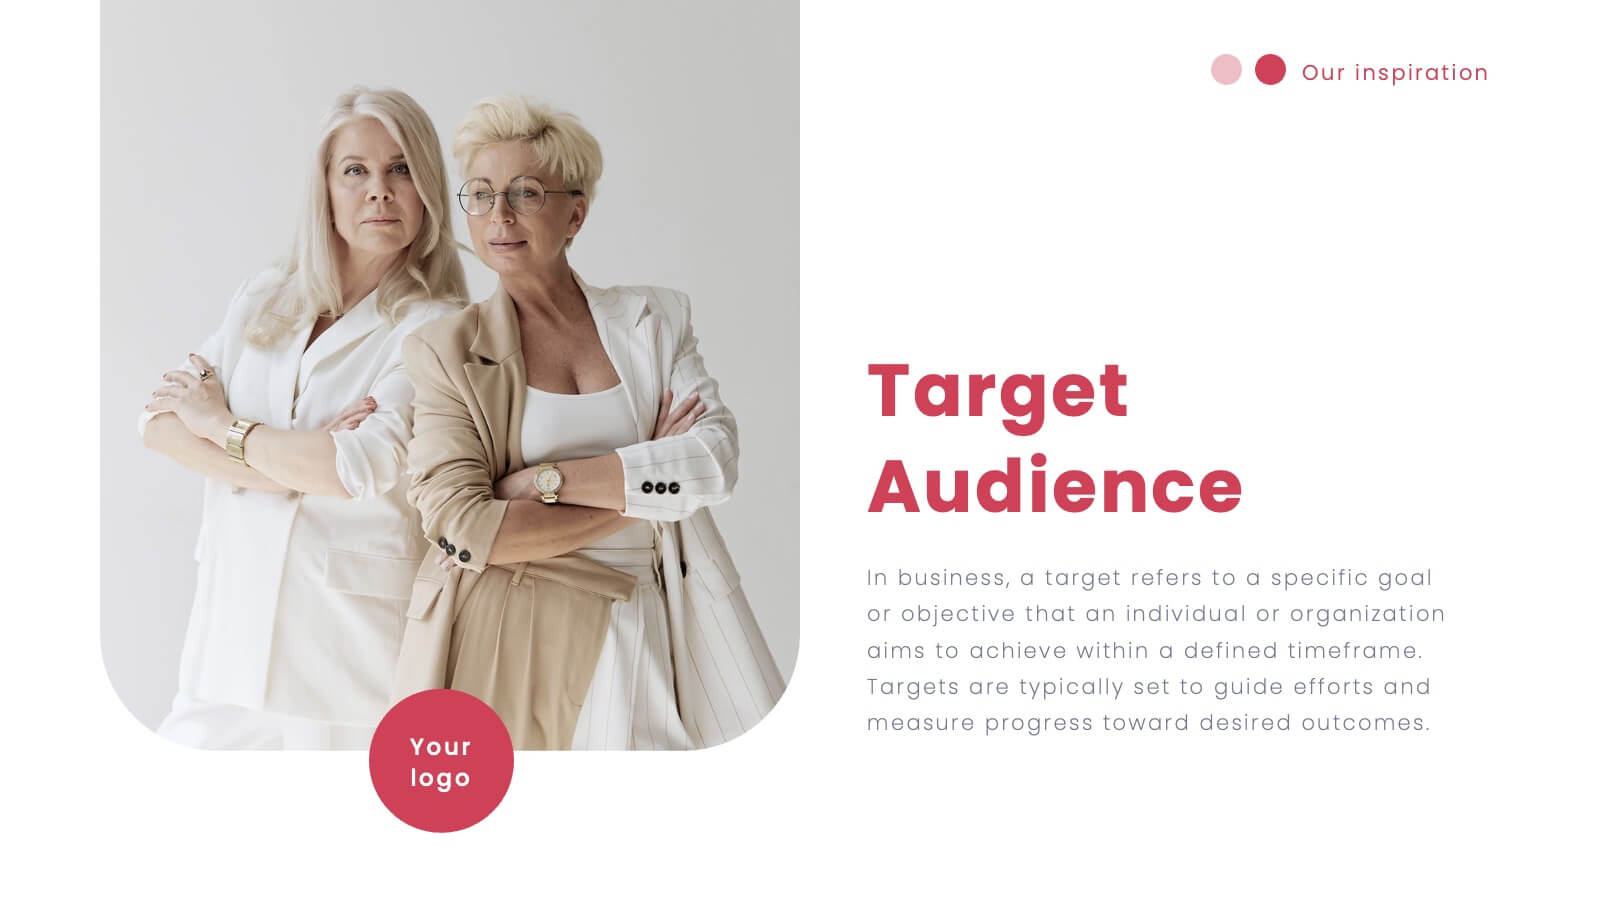
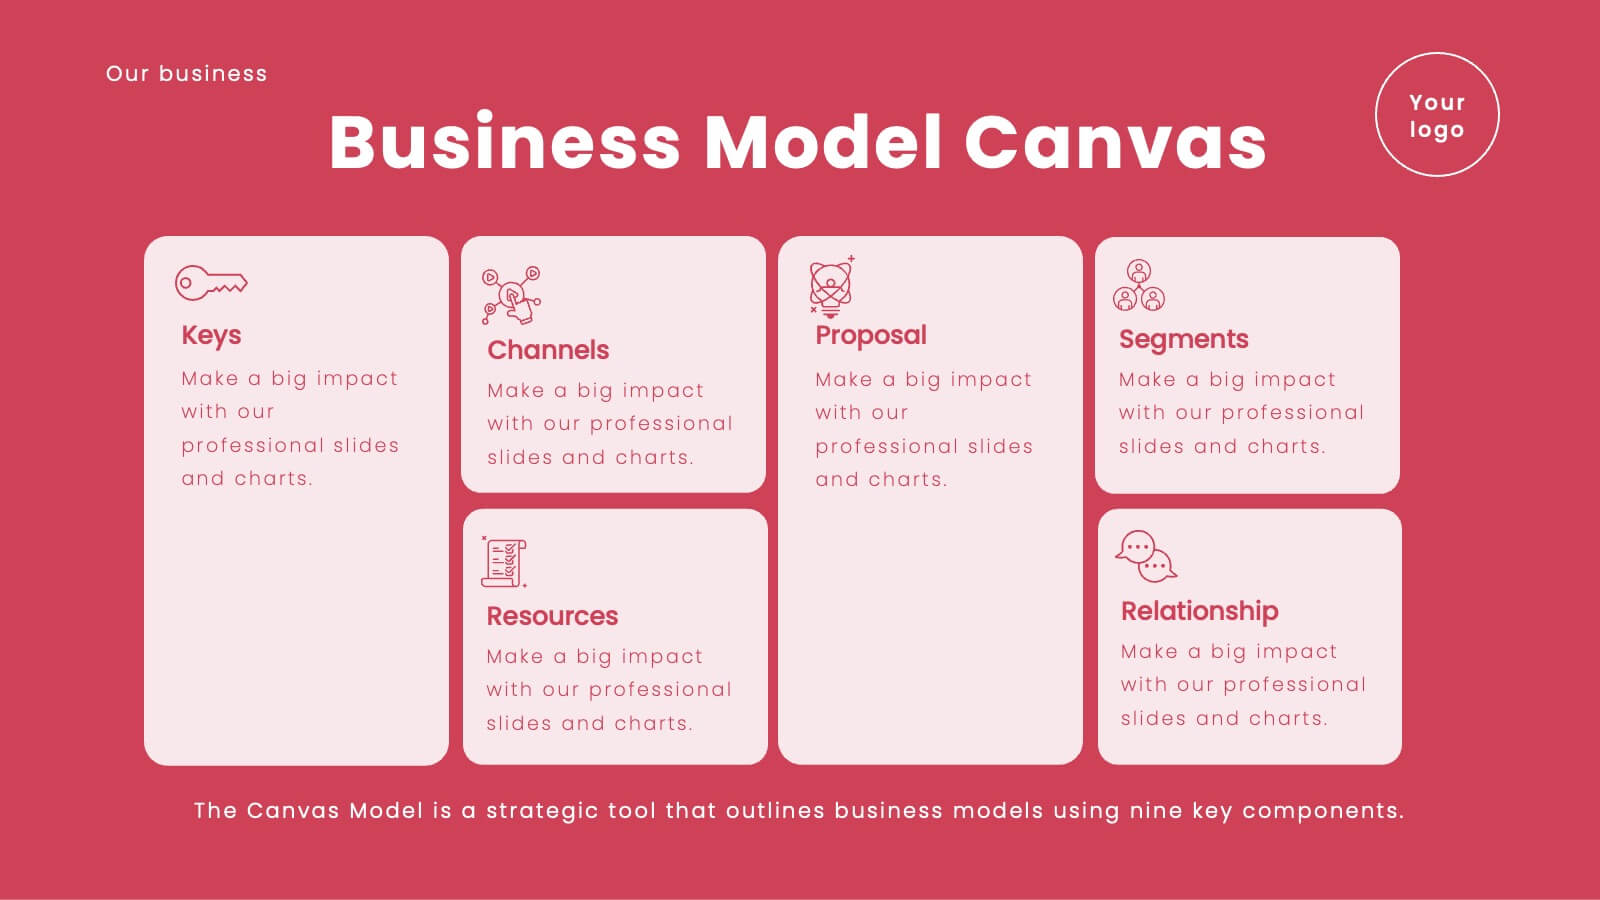
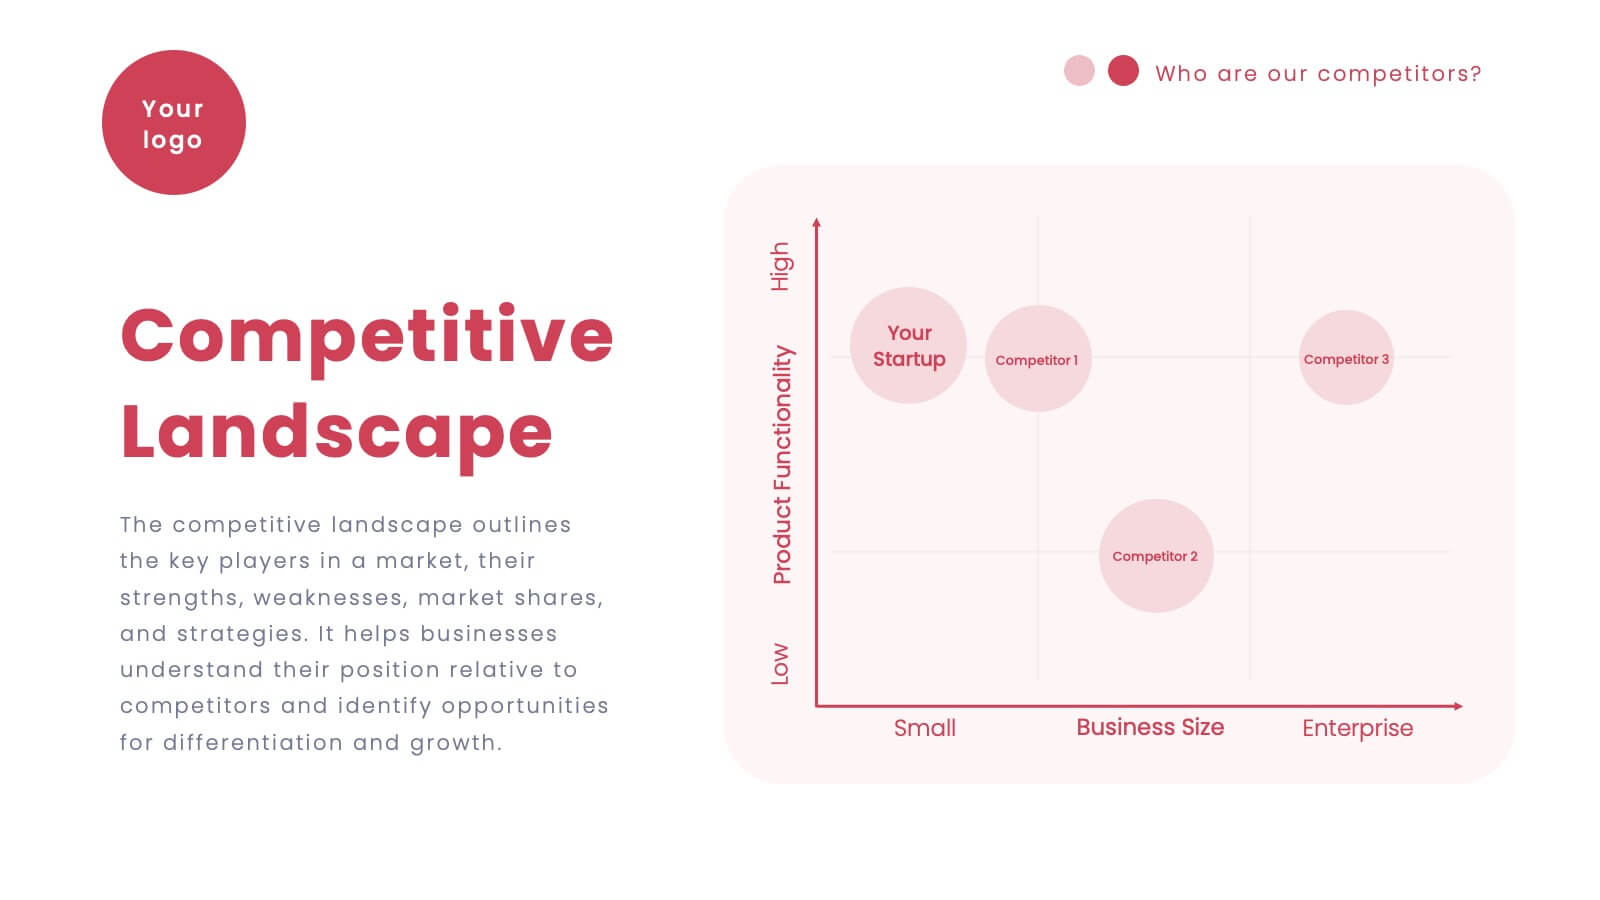
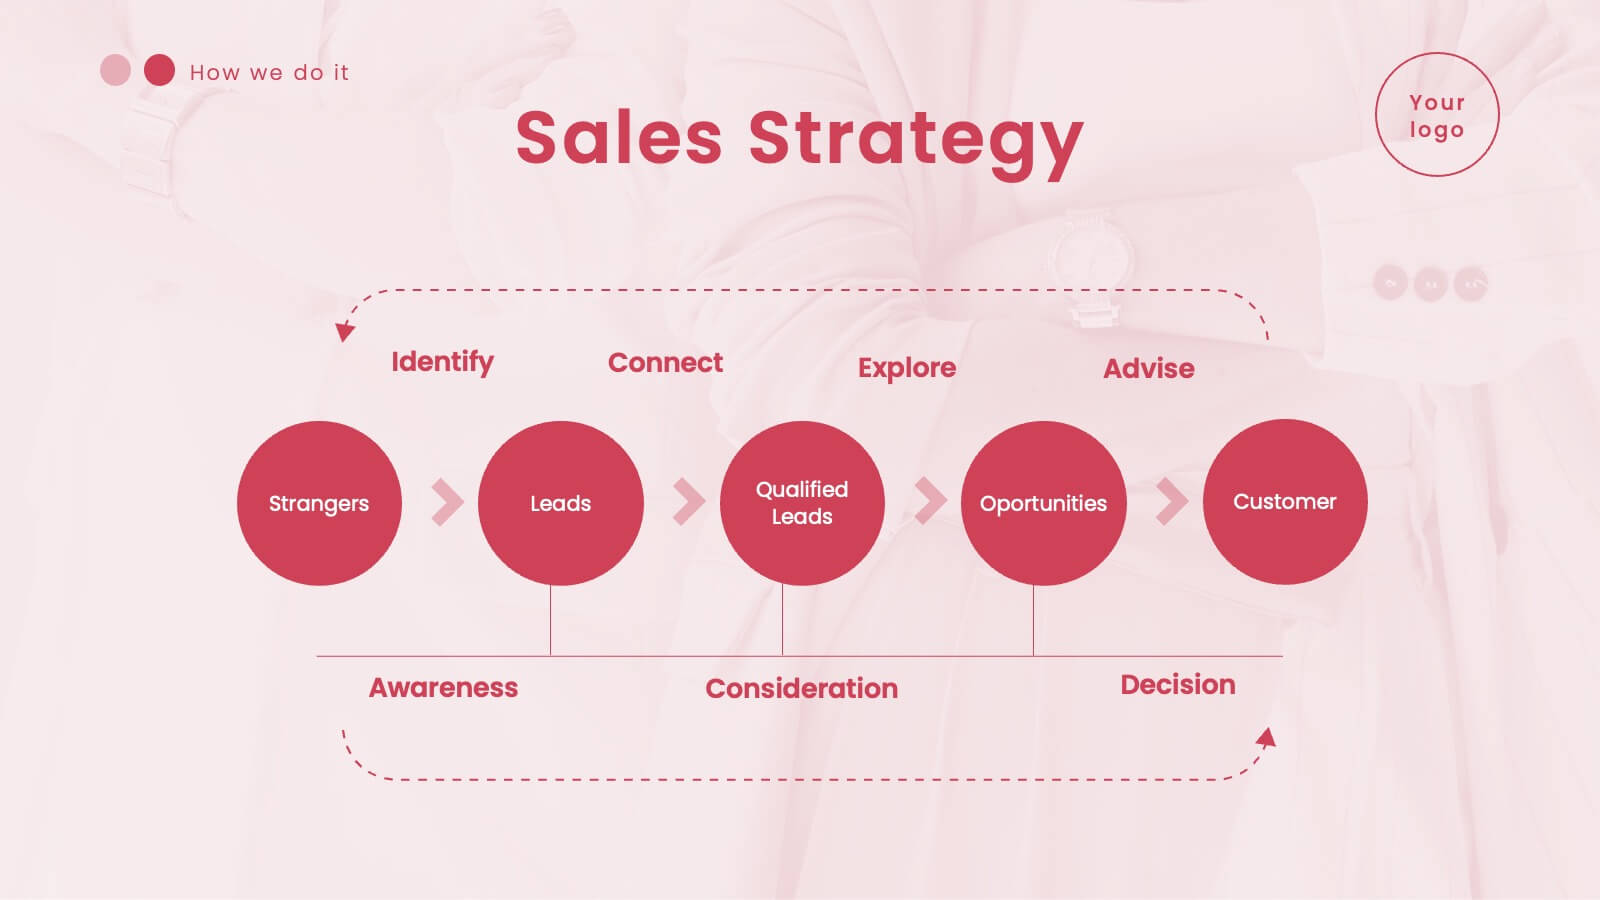
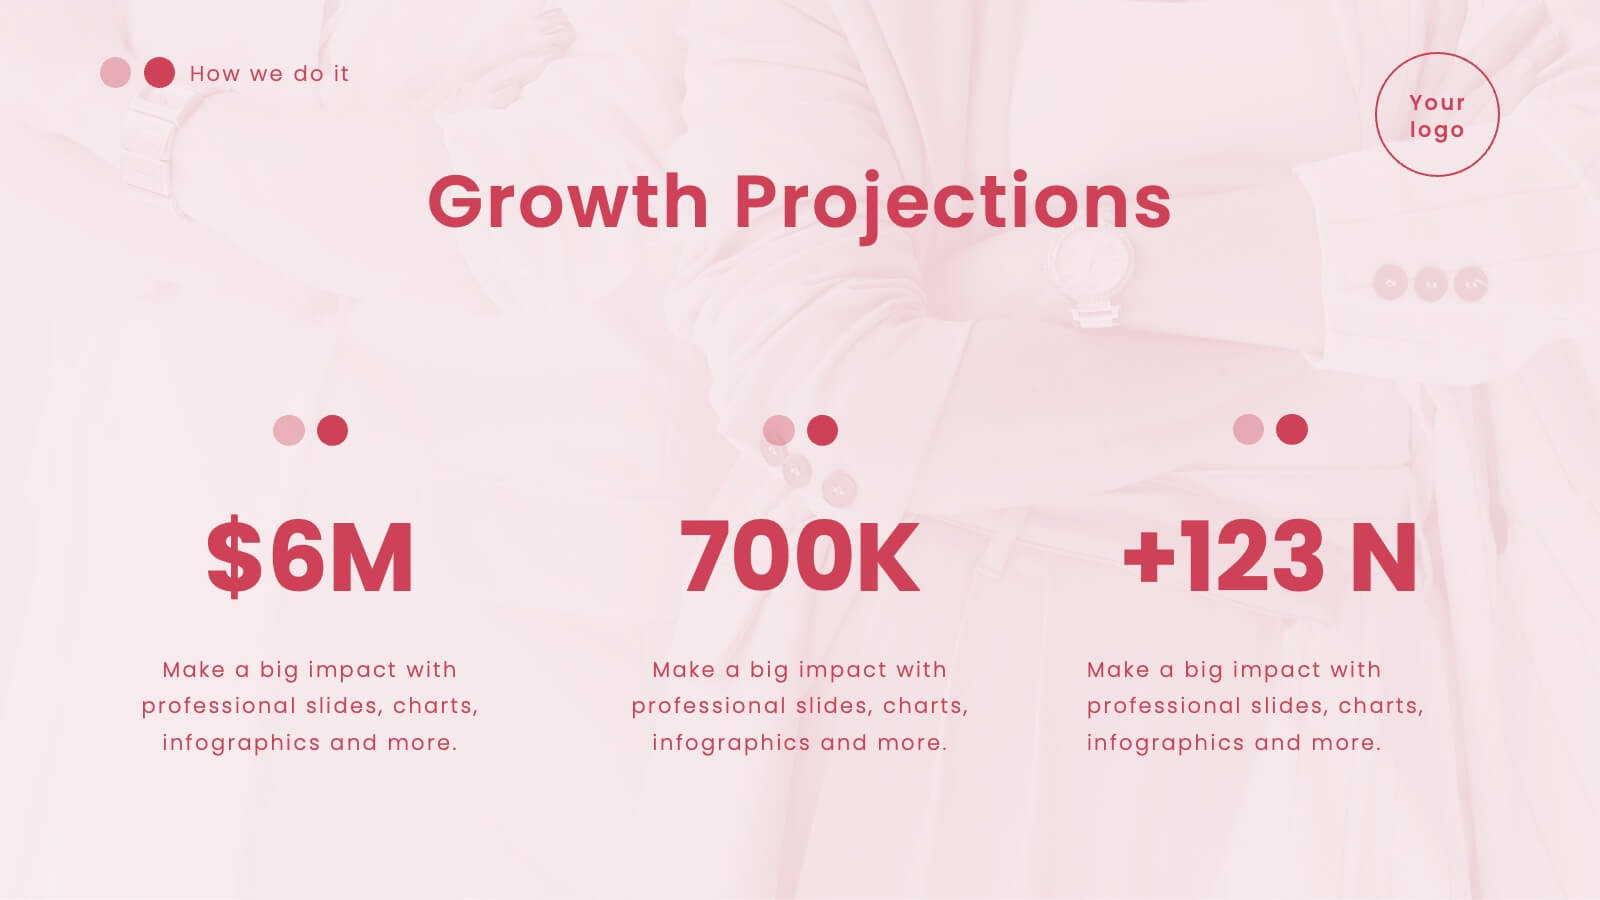
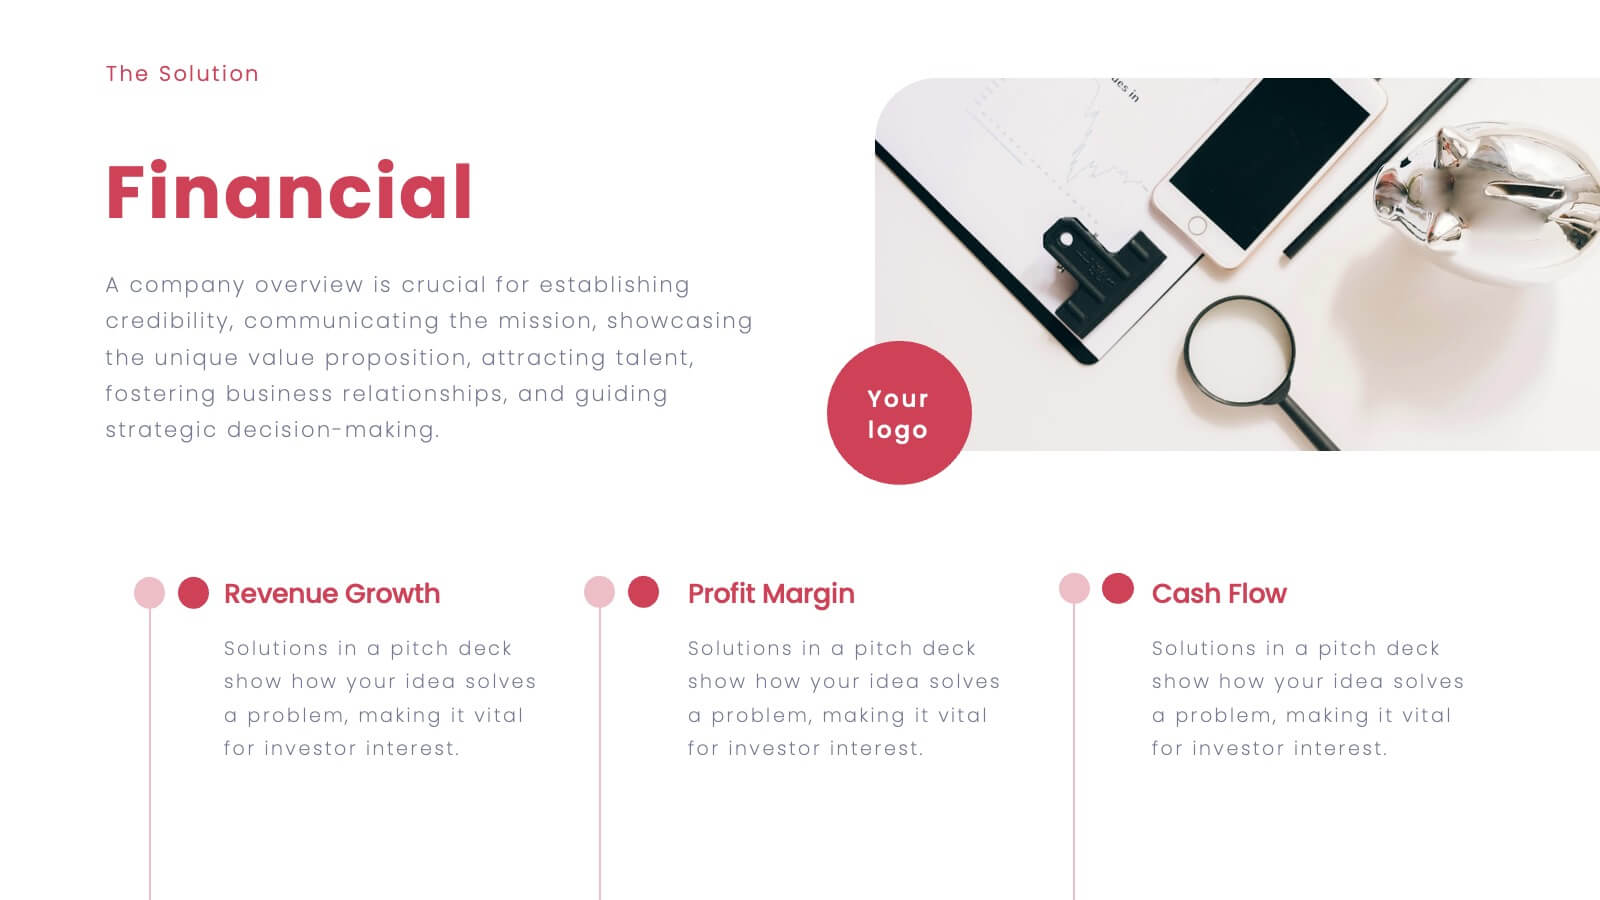
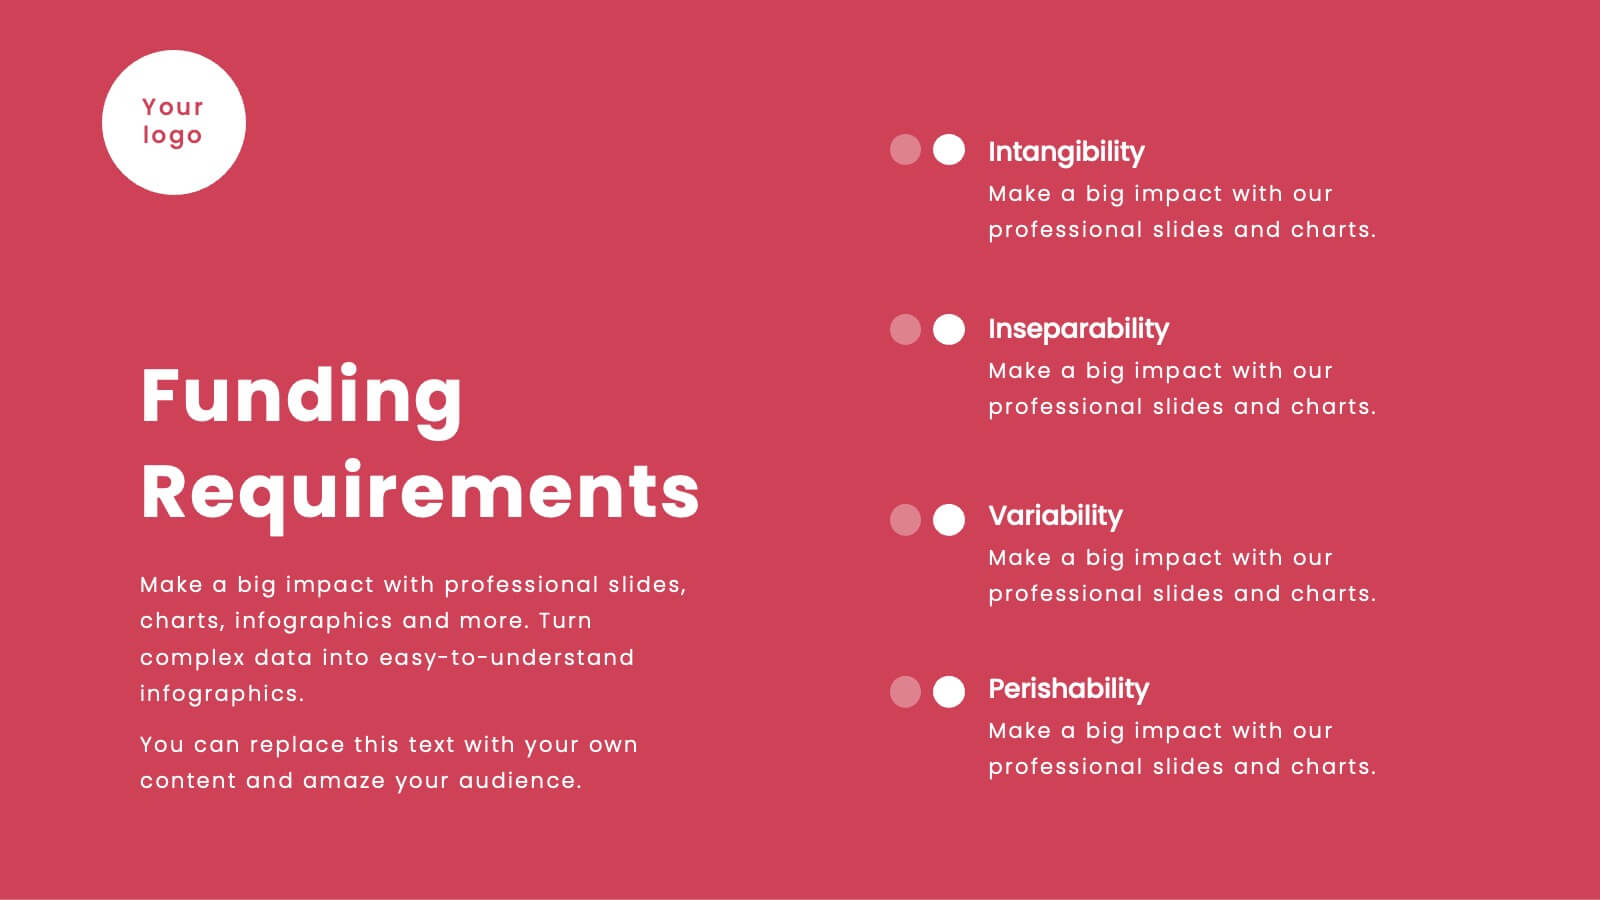
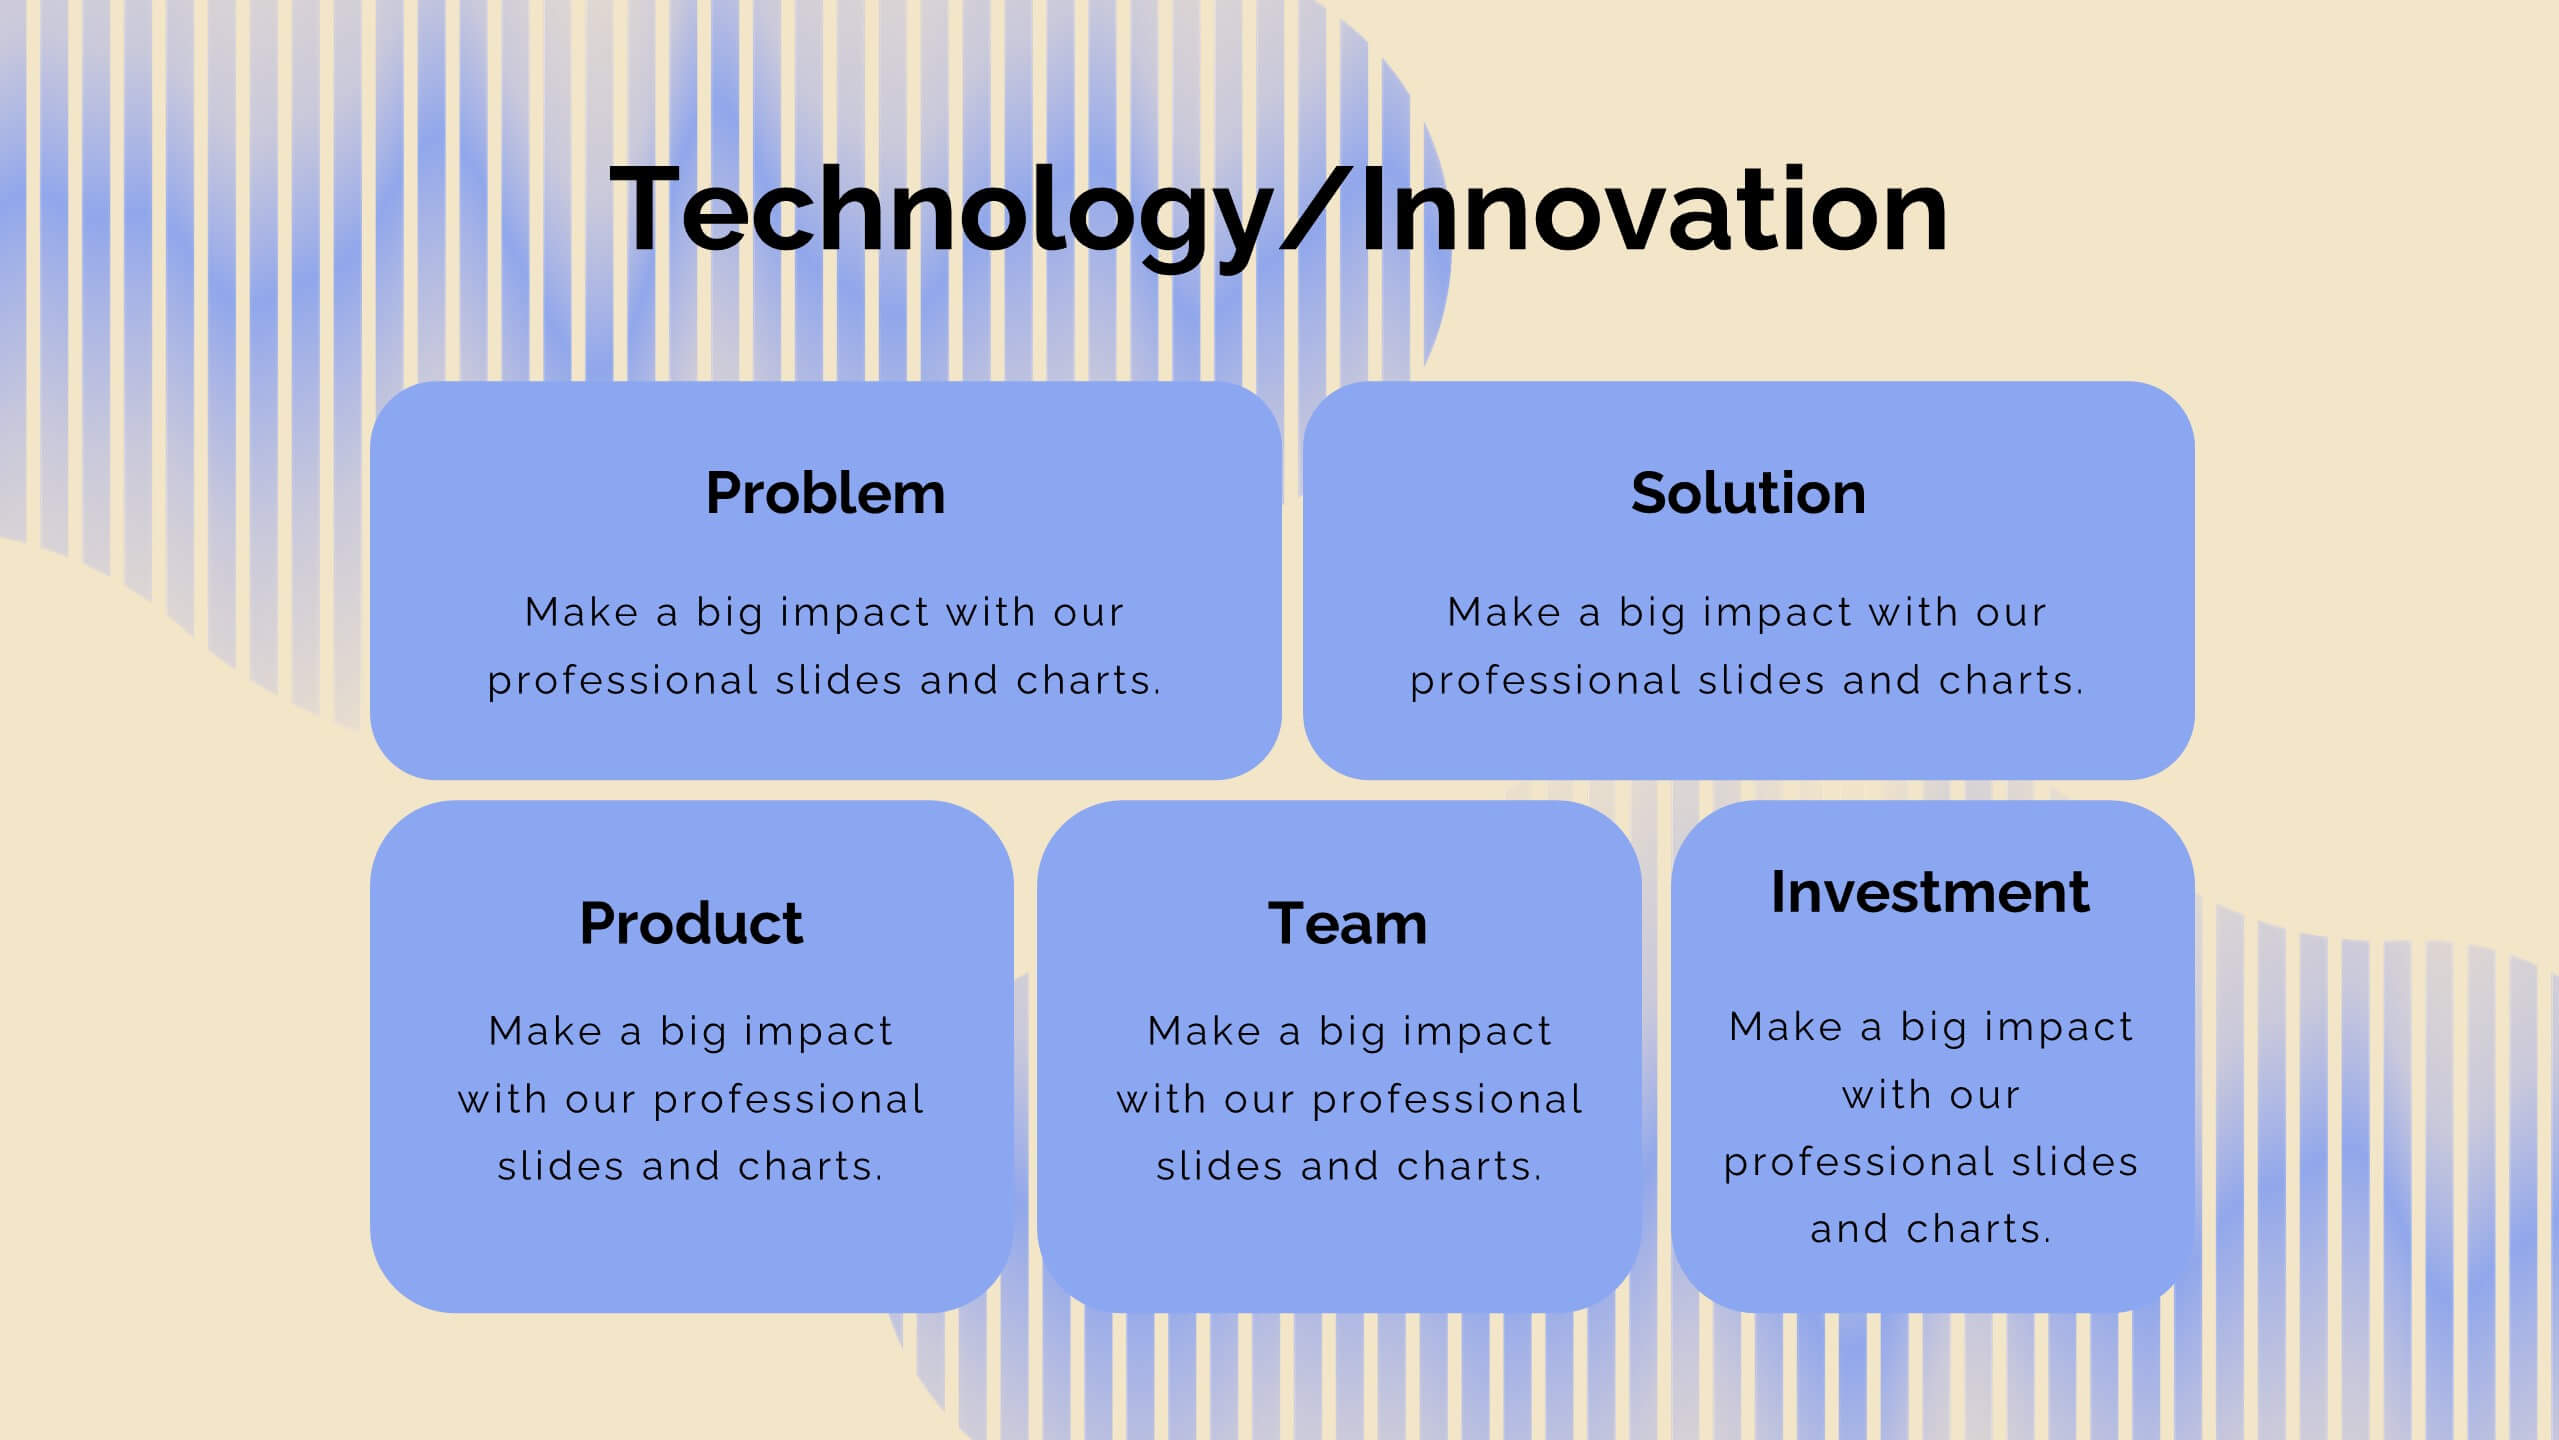
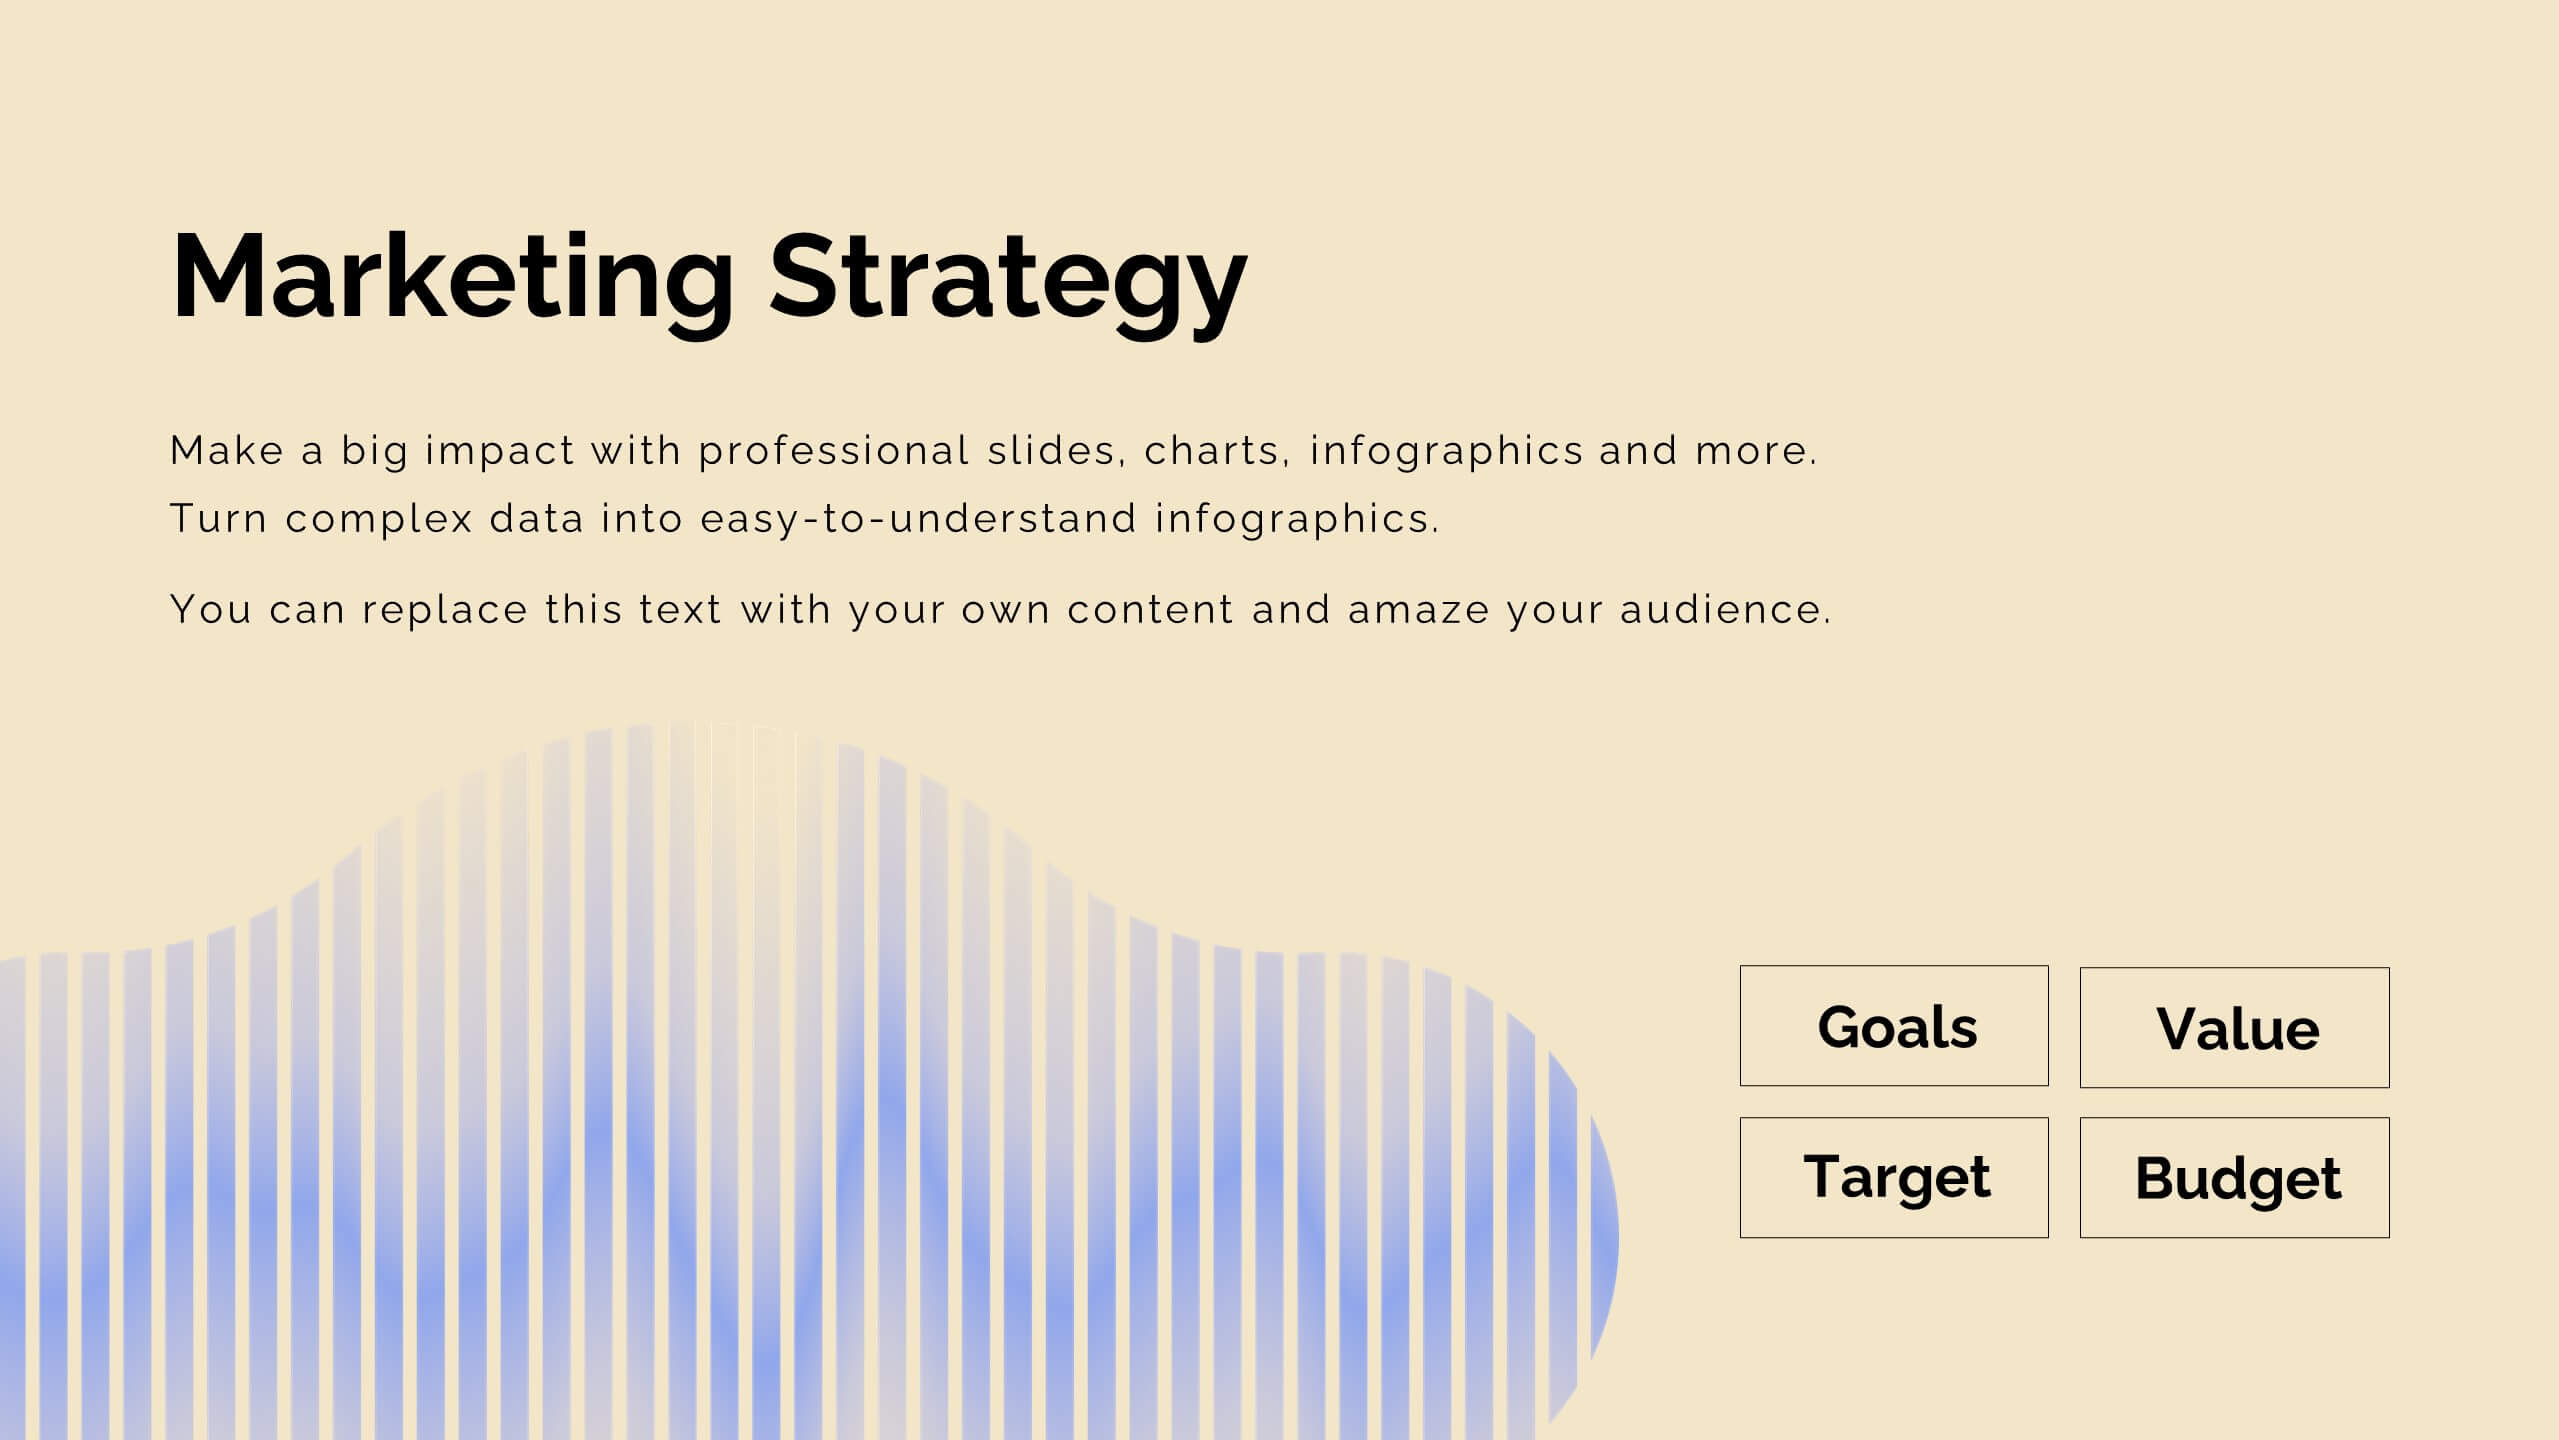
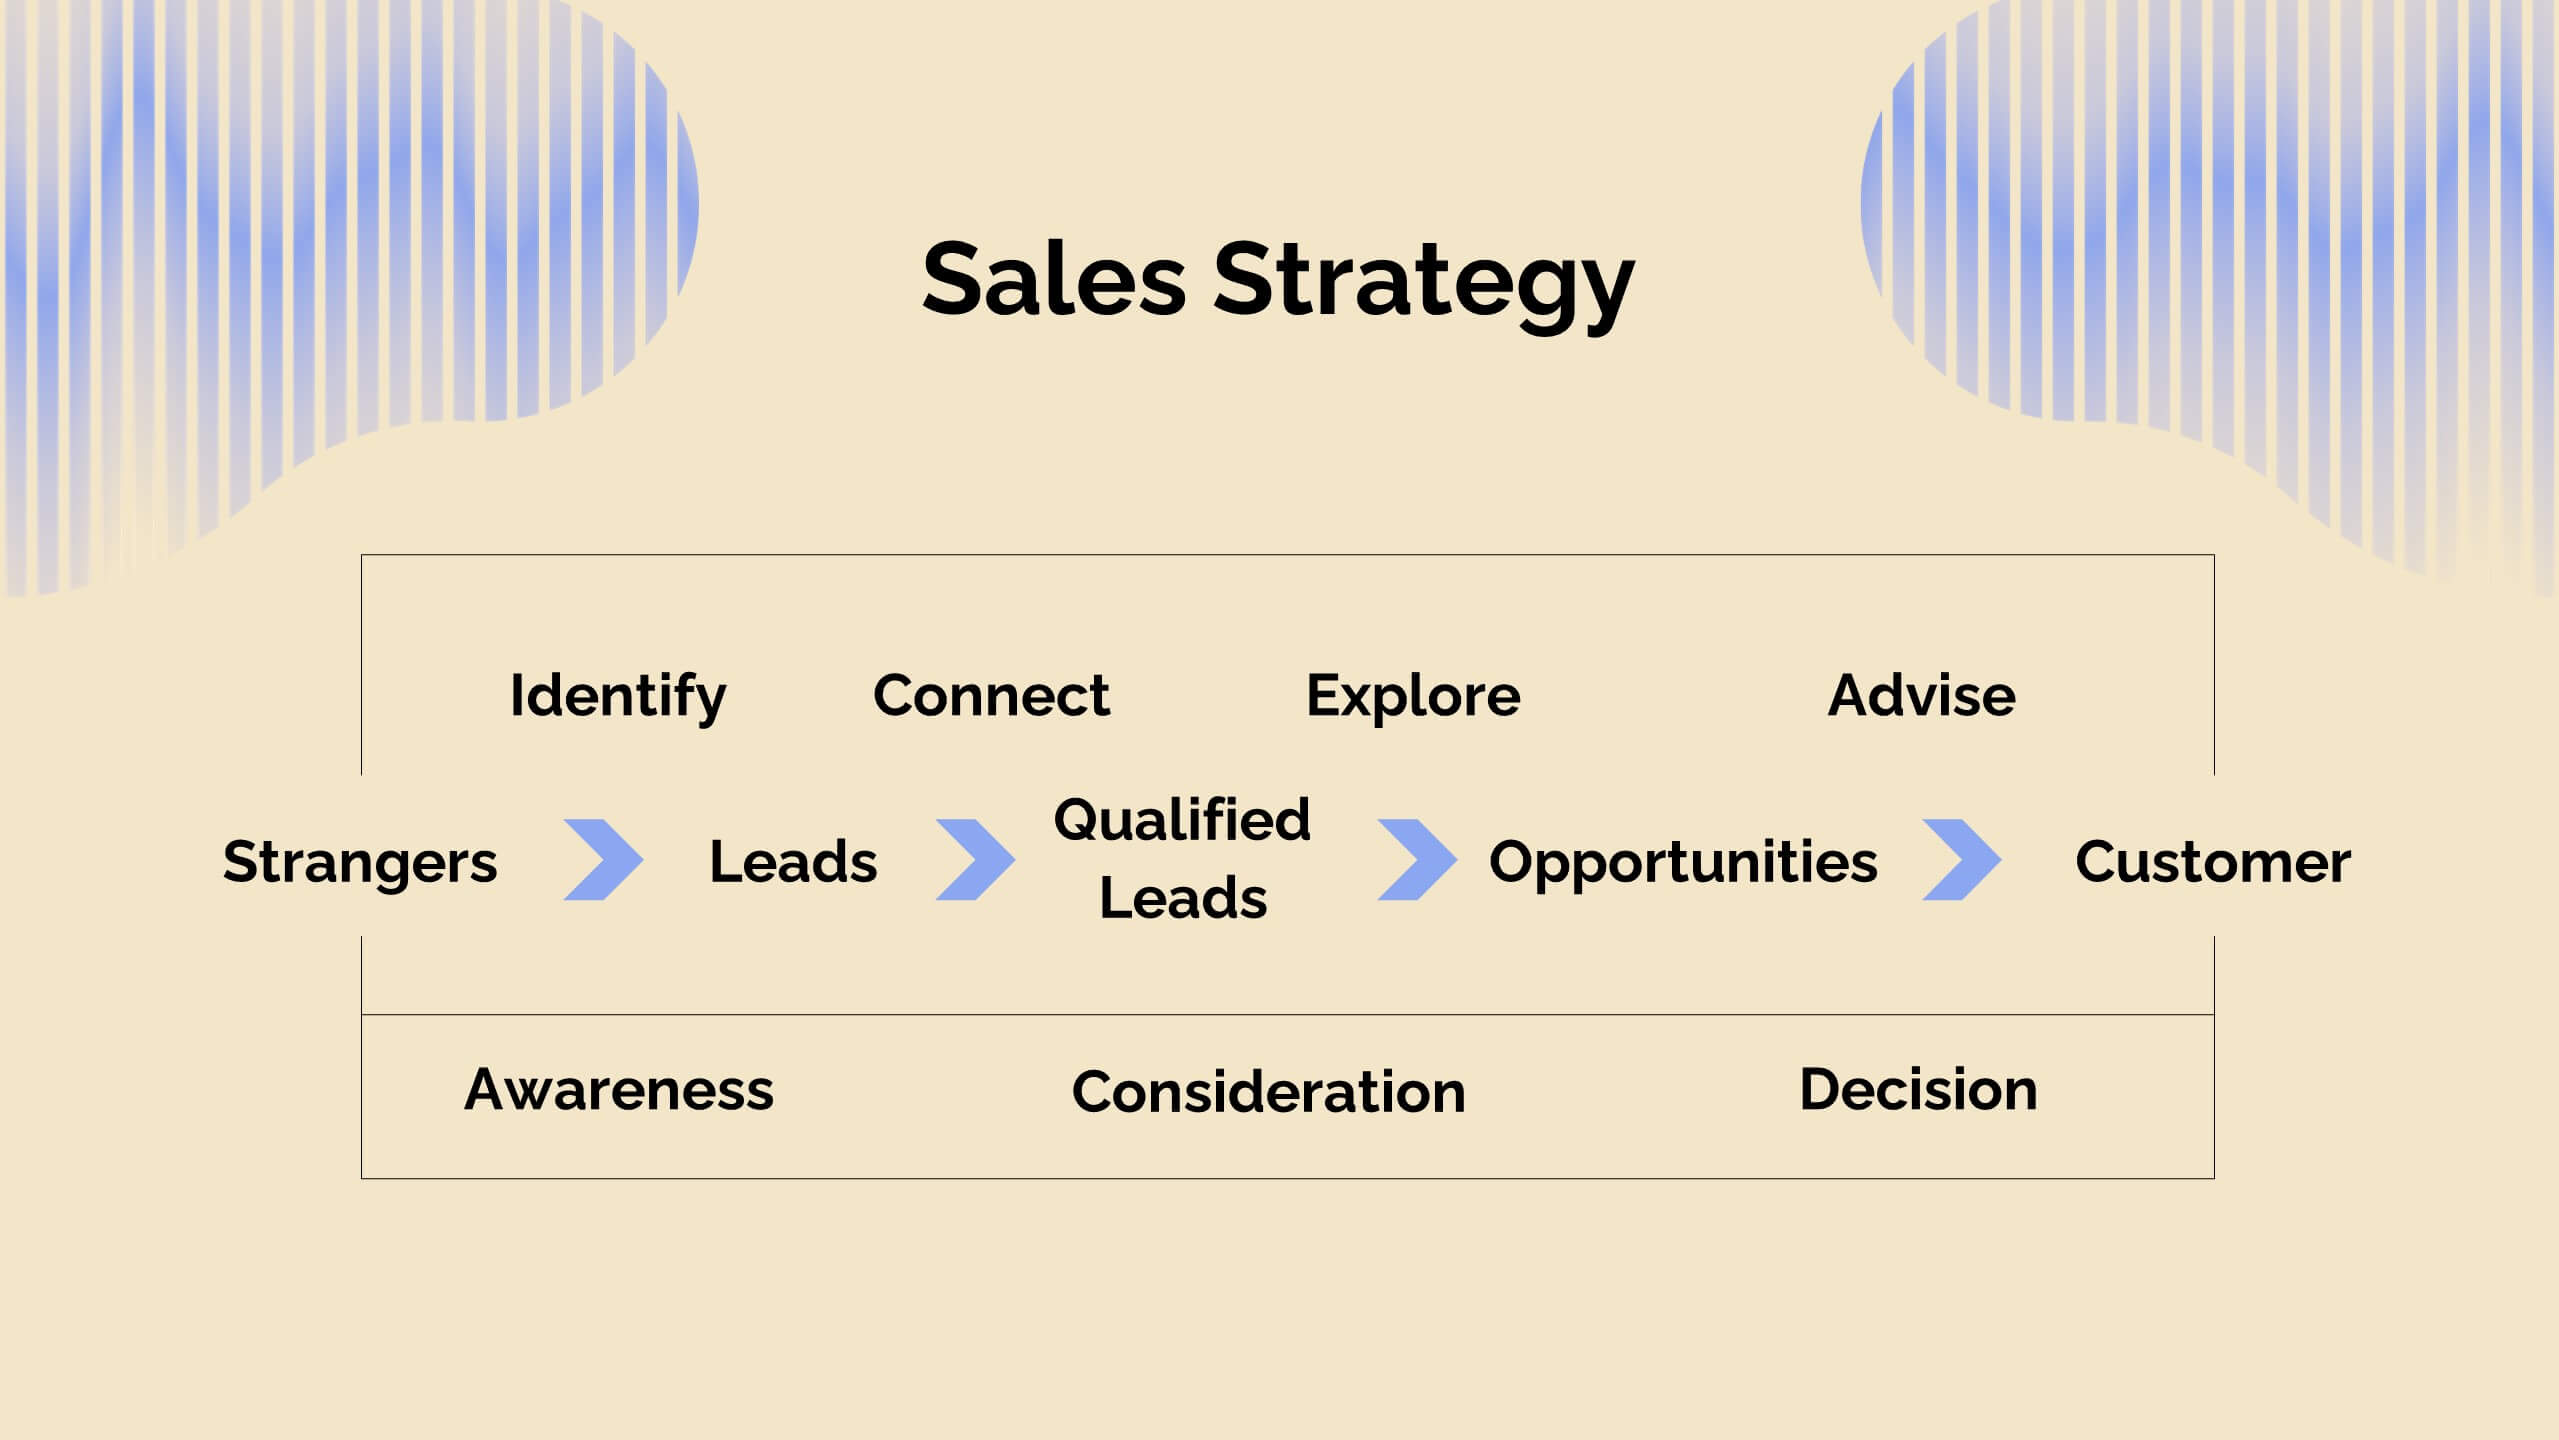
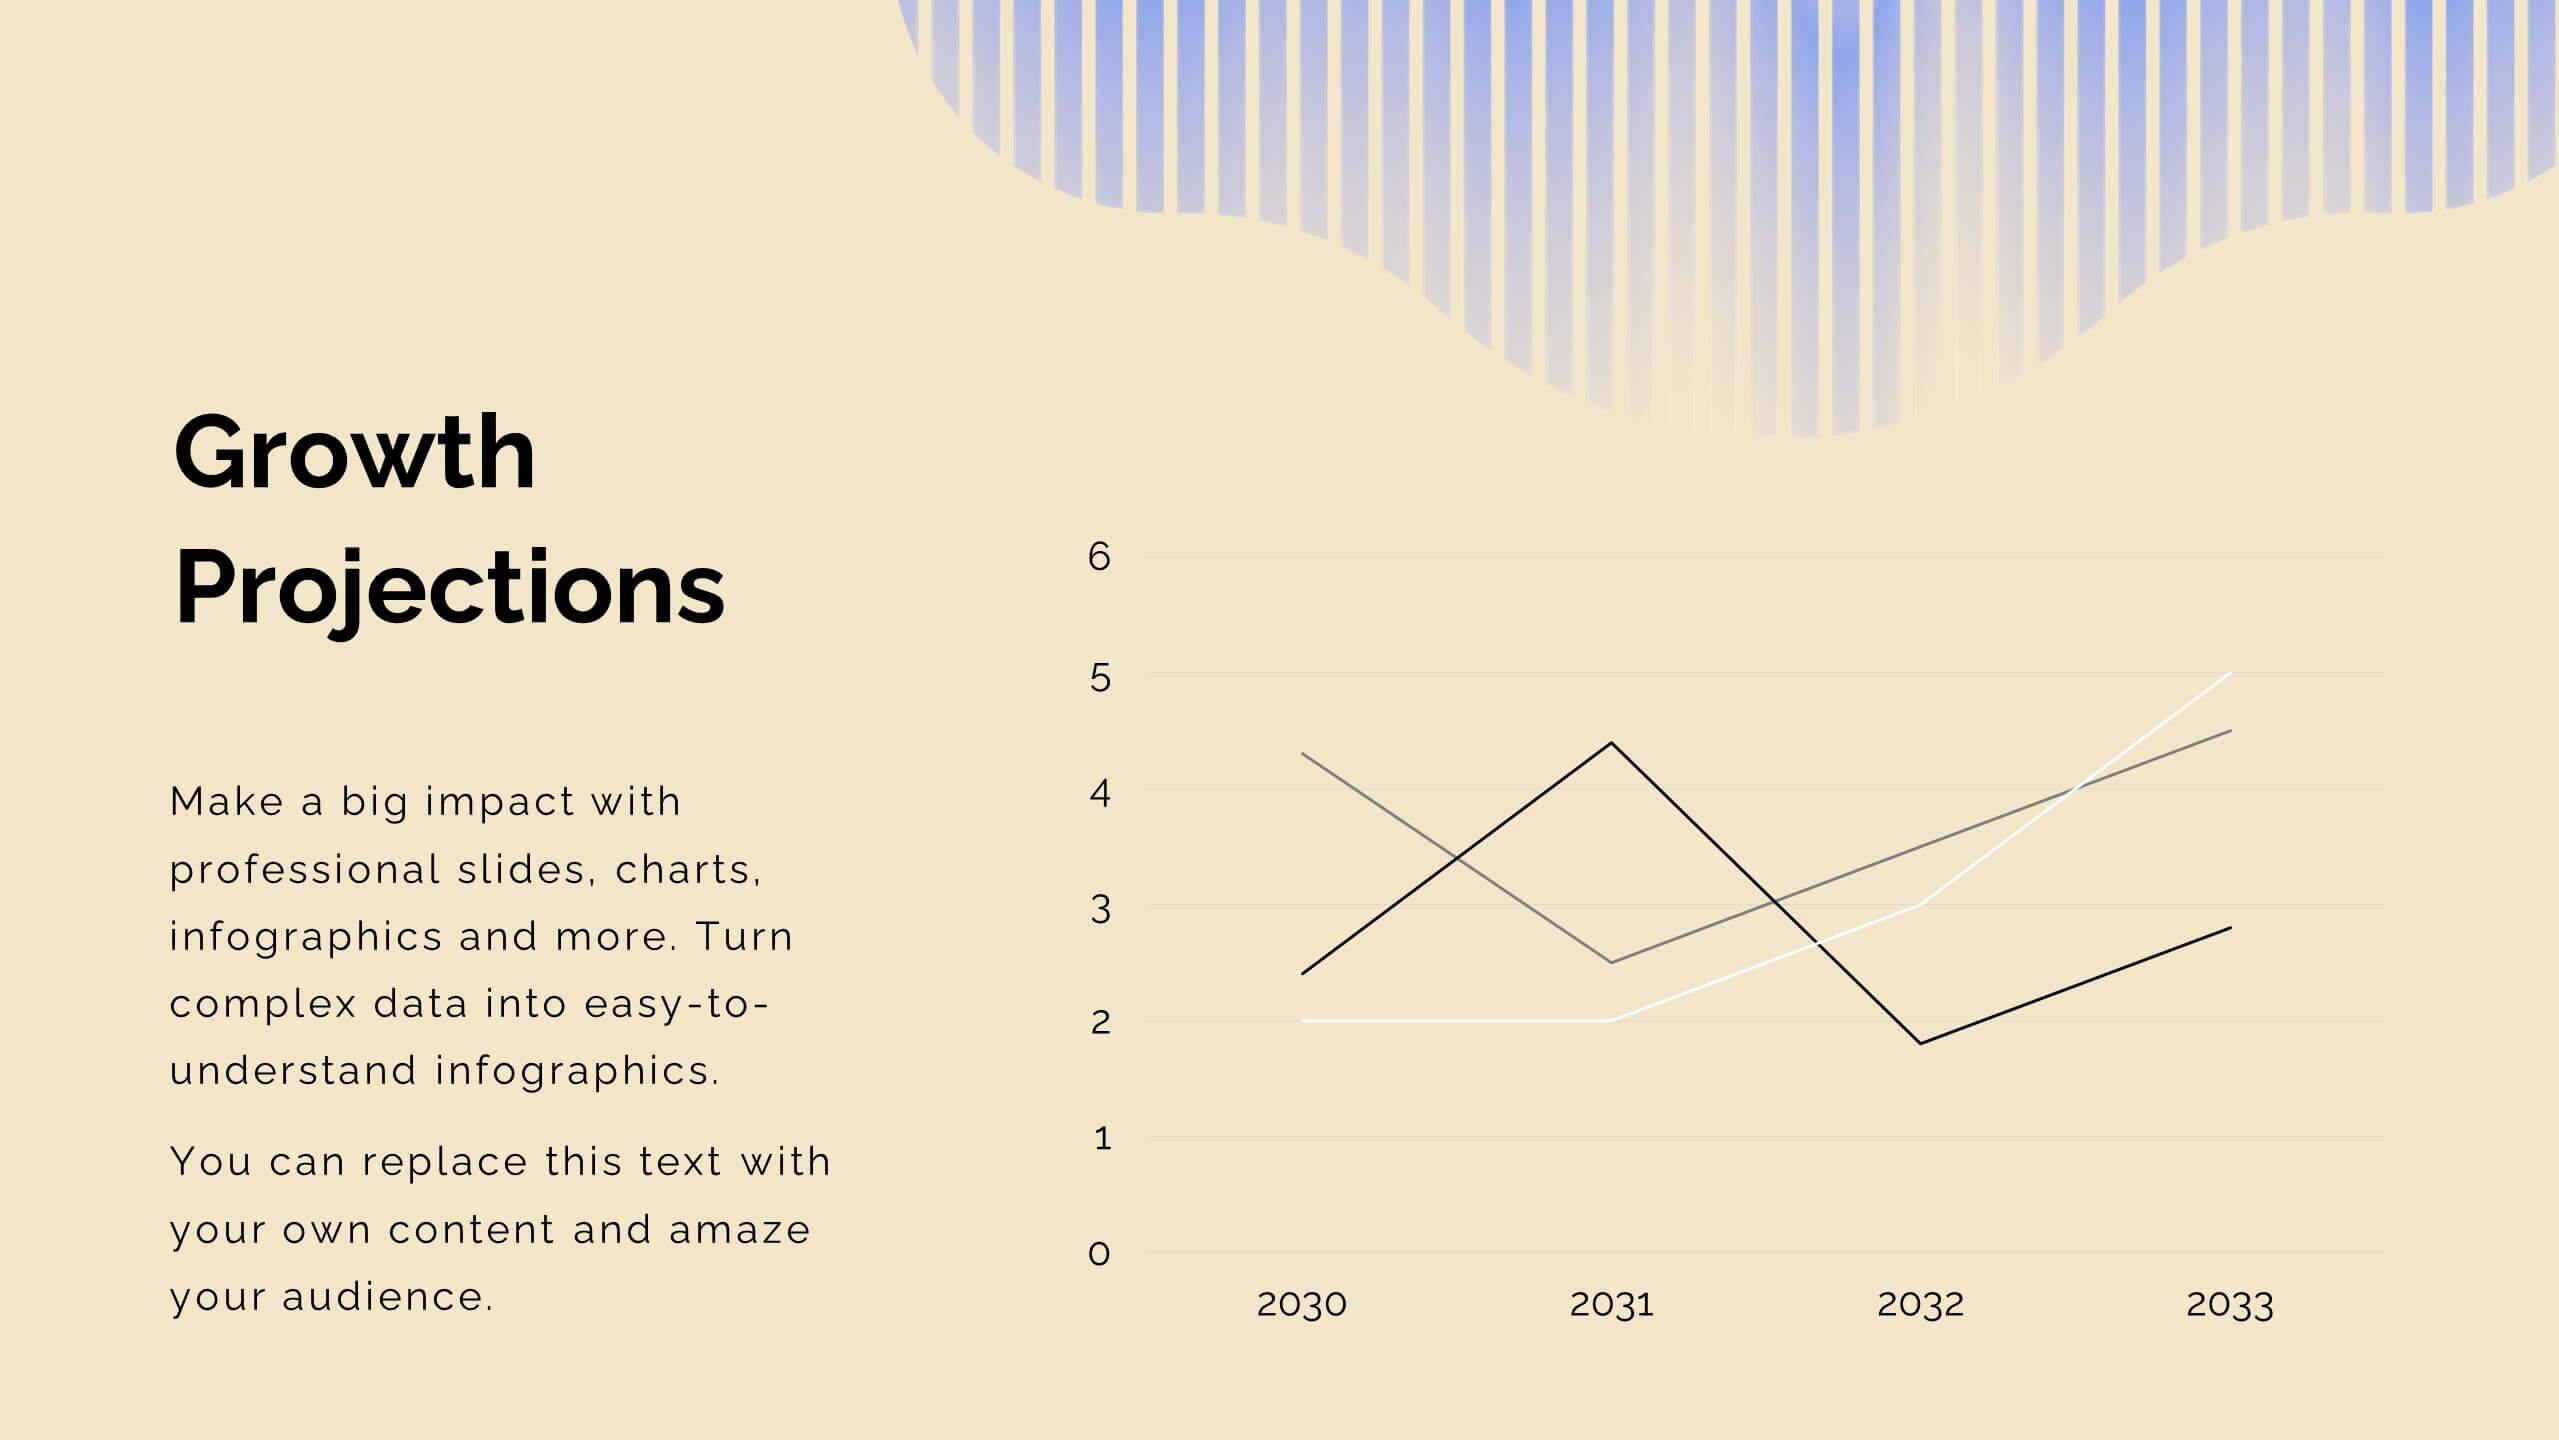
Vortex Startup Pitch Deck Presentation
Launch your ideas into action with this vibrant red pitch deck template, designed to captivate and inform potential investors. It covers everything from company overview to financials and market strategy, ensuring your vision is communicated effectively. Compatible with PowerPoint, Google Slides, and Keynote, this template is perfect for startups seeking to impress and engage.


5 slides
IT Operations Management
Illustrate complex workflows with this gear-themed infographic designed for IT operations management. Each gear represents a key step or stage, perfect for showcasing interconnected processes, system automation, or IT service flow. Easy to customize in PowerPoint, Keynote, and Google Slides. Clean, professional layout with space for icons and concise text.


7 slides
Project Proposal Budget Infographic
Streamline your financial planning with our Project Proposal Budget Templates, designed to present detailed budgeting information clearly and effectively. These templates are tailored to help project managers and financial analysts outline costs, funding sources, and expenditure allocation, ensuring comprehensive budget proposals. Each template is methodically organized to display financial data in an accessible manner. From summarizing overall budgets to detailing individual expense categories, these slides are perfect for conveying financial strategies and expectations. The templates utilize a soothing blue color scheme, which helps maintain clarity and focus, while various charts and tables provide visual representations of numerical data. Fully customizable to align with your specific project requirements, these budget slides can be easily adapted to include your unique financial details and projections. Whether you’re pitching to stakeholders or outlining budget plans internally, these templates provide a solid foundation for your financial presentations.


4 slides
Economic Growth in South America Map Presentation
Gain insights into regional development with the Economic Growth in South America Map template, designed to visualize financial data and economic trends across different areas of the continent. It features a clear map highlighting specific countries, accompanied by customizable bars representing economic indicators in dollar values. This template is excellent for presentations analyzing economic performance and growth opportunities within the continent.


26 slides
Cutting-Edge AI Breakthroughs Presentation
Step into the future with this exciting presentation on cutting-edge AI breakthroughs. Covering advancements in machine learning, automation, ethical AI, and real-world applications, this template helps you present complex innovations with clarity and impact. Fully customizable and compatible with PowerPoint, Keynote, and Google Slides for a seamless and engaging presentation experience.


7 slides
Demographic Data Infographic
Demographic data refers to information that characterizes the composition of a population or a specific group based on various socio-economic factors. Our demographic data infographic is not just a graphic, this is a powerful visualization that explores society and empowers decision-makers to understand, connect, and prosper. Prepare for an exhilarating journey through demographics, where data transforms into meaningful insights. Compatible with Powerpoint, Keynote, and Google Slides. This can be used for a variety of purposes, including market research, targeted marketing, policy development, resource allocation, urban planning, and more.


4 slides
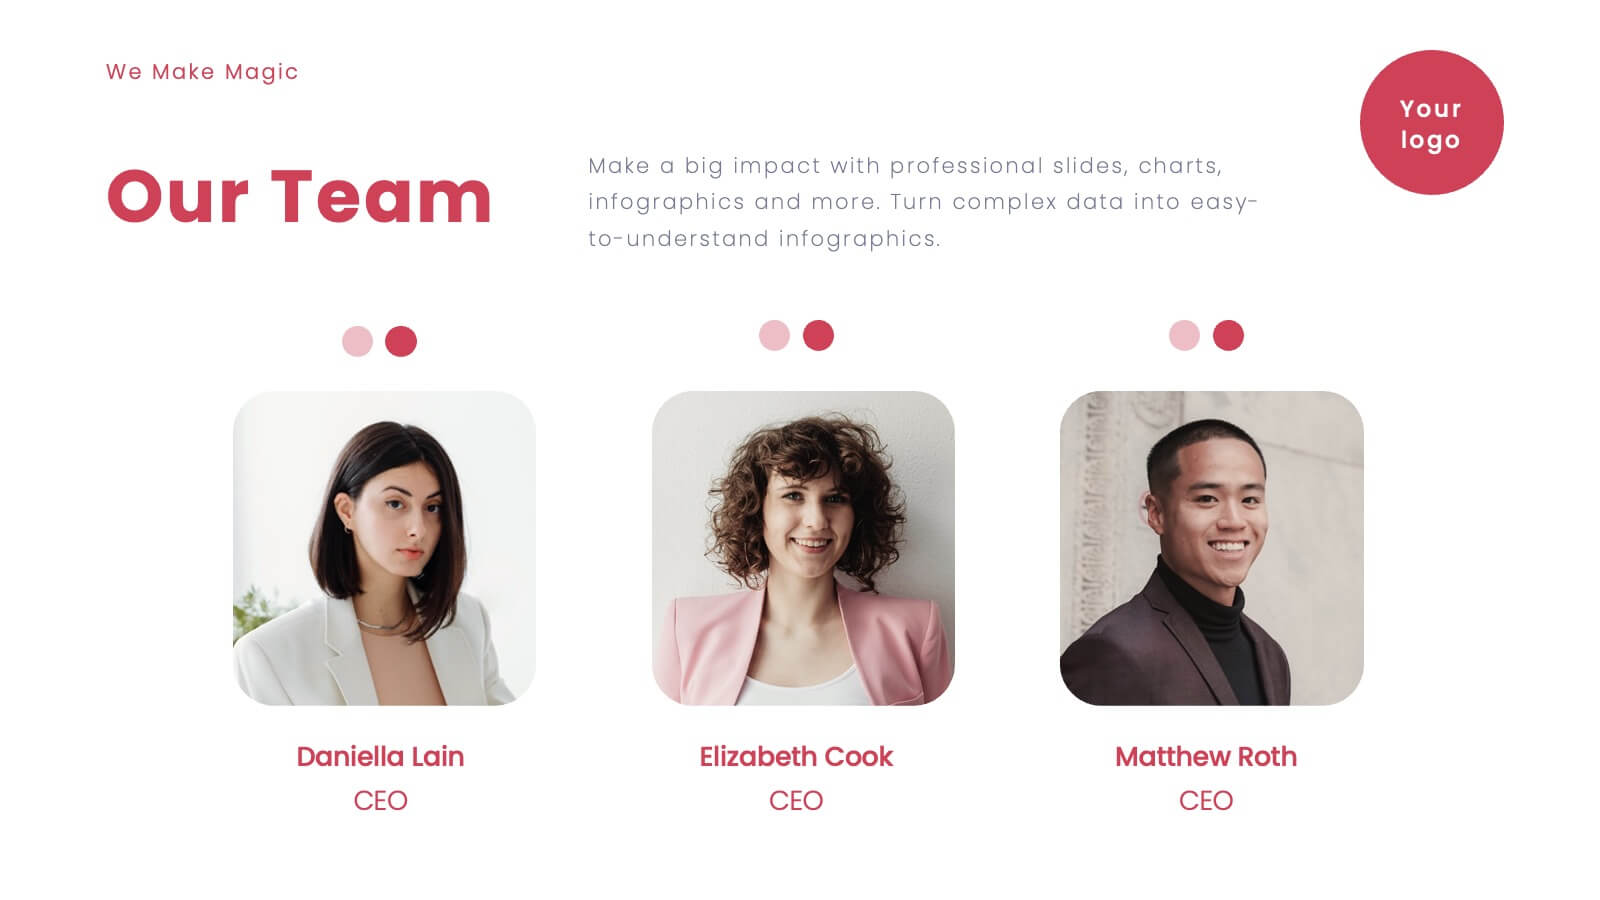
Minimal Company Profile Deck Presentation
Make a bold first impression with this sleek, minimal layout designed to showcase your company’s vision, services, and team with clarity and style. Perfect for startups or established brands, it balances professionalism and creativity effortlessly. Fully editable and compatible with PowerPoint, Keynote, and Google Slides for seamless customization.


6 slides
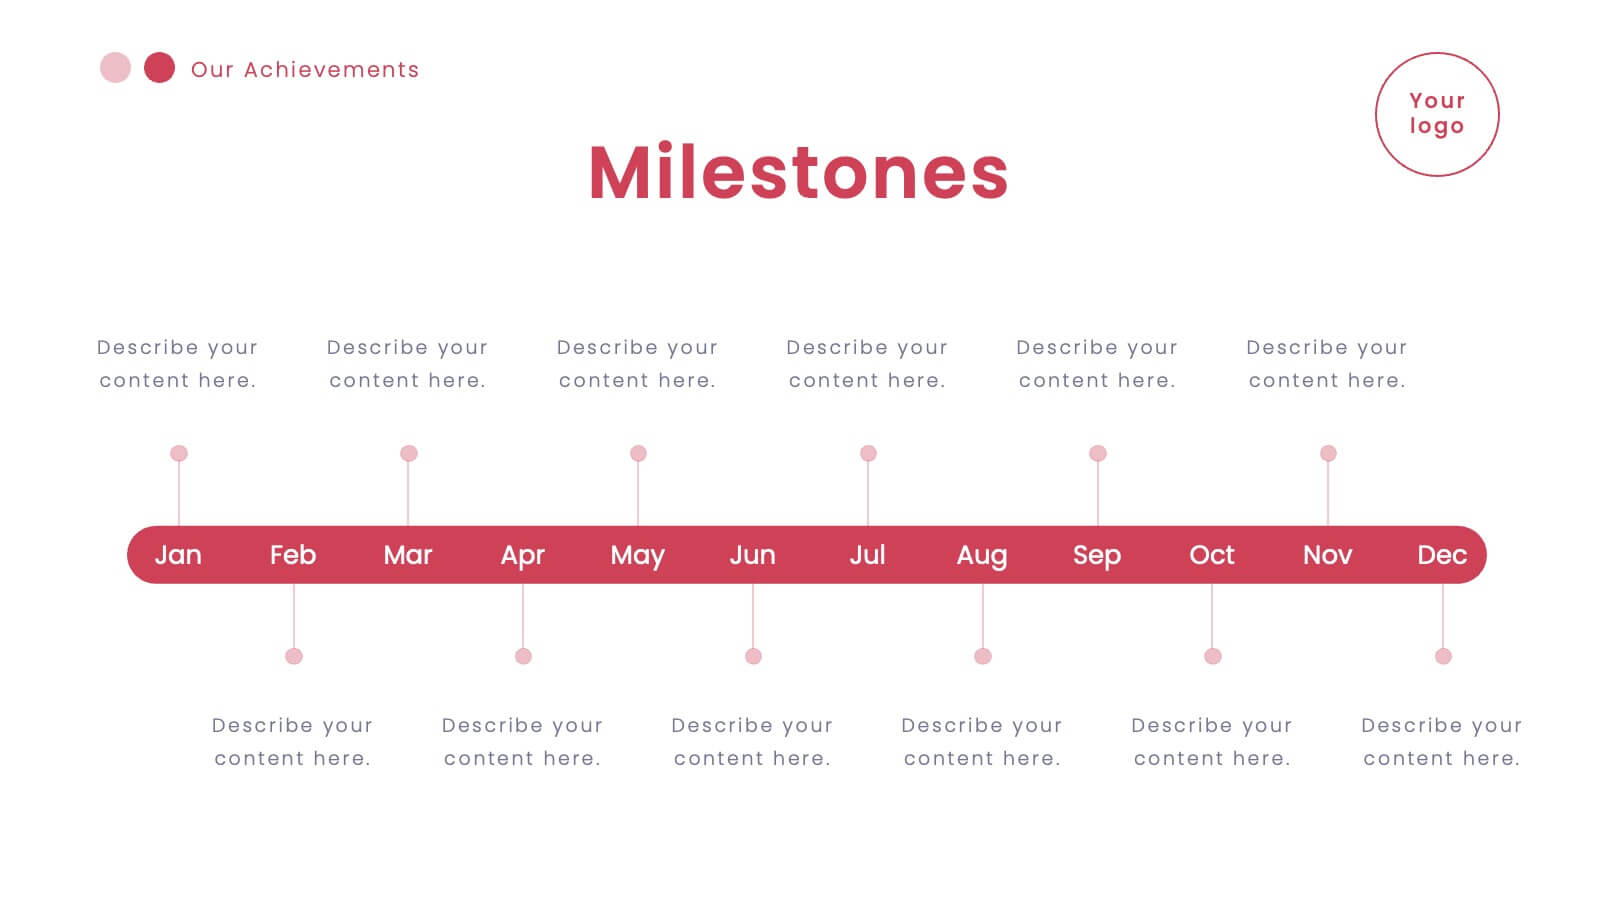
Annual Scheduling with Calendar Milestones Presentation
Make your year feel like a well-oiled machine with this bold, color-coded visual layout. It helps you map out project phases, monthly milestones, and long-term plans with clarity and structure. Ideal for strategy meetings or annual reviews, this editable template works seamlessly in PowerPoint, Keynote, and Google Slides.


23 slides
Journey Product Roadmap Presentation
Embark on a seamless journey through your product’s lifecycle with this comprehensive roadmap template! Perfect for illustrating key milestones, business models, and market opportunities, it’s your go-to for clear and engaging presentations. Dive into competitive analysis, showcase your unique selling proposition, and outline your growth projections with style. Compatible with PowerPoint, Keynote, and Google Slides.


22 slides
Etherwind Advertising Agency Proposal Presentation
This Advertising Agency Proposal Presentation Template offers a sleek and professional layout, perfect for showcasing your agency's capabilities, services, and success stories. Covering essential sections such as market analysis, strategy development, campaign execution, and client testimonials, it ensures a compelling pitch to potential clients. Designed for easy customization in PowerPoint, Keynote, and Google Slides, making it a versatile choice for agencies looking to impress their audience.


7 slides
Watercolor Plan Infographic
A watercolor plan infographic refers to an infographic design or style that incorporates elements of watercolor painting. Dive into the world of dreams and aspirations with our watercolor plan infographic template. This artistic and visually captivating infographic guides you through your plans and goals with the fluidity and creativity of watercolors. This infographic is a visually stunning and inspiring template that transforms the process of goal setting into an artistic masterpiece, encouraging individuals to paint their dreams with vivid hues of determination and creativity.


6 slides
PESTEL Framework Breakdown Presentation
Kickstart your strategic thinking with a bold, colorful layout that makes external business factors easy to understand at a glance. This presentation breaks complex influences into clear, structured sections, helping teams analyze trends and plan with confidence. Fully editable and compatible with PowerPoint, Keynote, and Google Slides.


7 slides
Change Management Principles Infographic
Change is the only constant in the business realm, and mastering its management can be the linchpin to success. The change management principles infographic, in its harmonious palette of gray, blue, and red, provides a visually compelling overview of the key tenets governing successful change. Tailored for business leaders, project managers, HR professionals, and organizational consultants, this infographic streamlines complex ideas into easily digestible insights. Crafted to be fully compatible with PowerPoint, Keynote, and Google Slides, it serves as an invaluable tool to illuminate and drive conversations around change in any corporate presentation.


5 slides
The Future of Food Waste Infographics
Food Waste refers to the loss or disposal of food that is still edible or could have been consumed. These infographic template are designed with the aim of raising awareness, inspiring change, and empowering individuals and organizations to take action towards a more sustainable food system. These infographics are perfect for anyone interested in understanding the future trajectory of food waste and exploring potential solutions. With these infographic templates, create a presentation that inspires action and foster a collective commitment to combating food waste for a more sustainable future.


7 slides
Marketing Infographic Presentation Template
A marketing infographic is a visual representation of information or data related to marketing, advertising, or business strategy. The purpose of this marketing infographic is to make all your ideas and data easily understandable and memorable by using graphics, images, charts, and other visual elements. This template can be used to explain a brand's target audience and important information. The aim of this marketing infographic is to make marketing content more engaging and impactful, which can help to reach target audience, convey their message effectively and increase brand awareness.


10 slides
Stakeholder Analysis Matrix Presentation
Spark interest from the very first slide with a clean, engaging layout designed to simplify complex relationships. This presentation helps you outline stakeholder influence, priorities, and engagement levels in a clear, structured way that supports better project decisions. Fully compatible with PowerPoint, Keynote, and Google Slides.


6 slides
Effective Time Management Strategie Presentation
Make the most of your hours with this sharp and creative visual layout designed to organize your time-saving game plan. This template highlights key time management strategies, helping you structure priorities and boost daily efficiency. Fully customizable and easy to edit in PowerPoint, Keynote, and Google Slides for seamless presentation use.