


Features
- 6 Unique slides
- Fully editable and easy to edit in Microsoft Powerpoint, Keynote and Google Slides
- 16:9 widescreen layout
- Clean and professional designs
- Export to JPG, PDF or send by email


Do you have any questions?
Recommend


21 slides
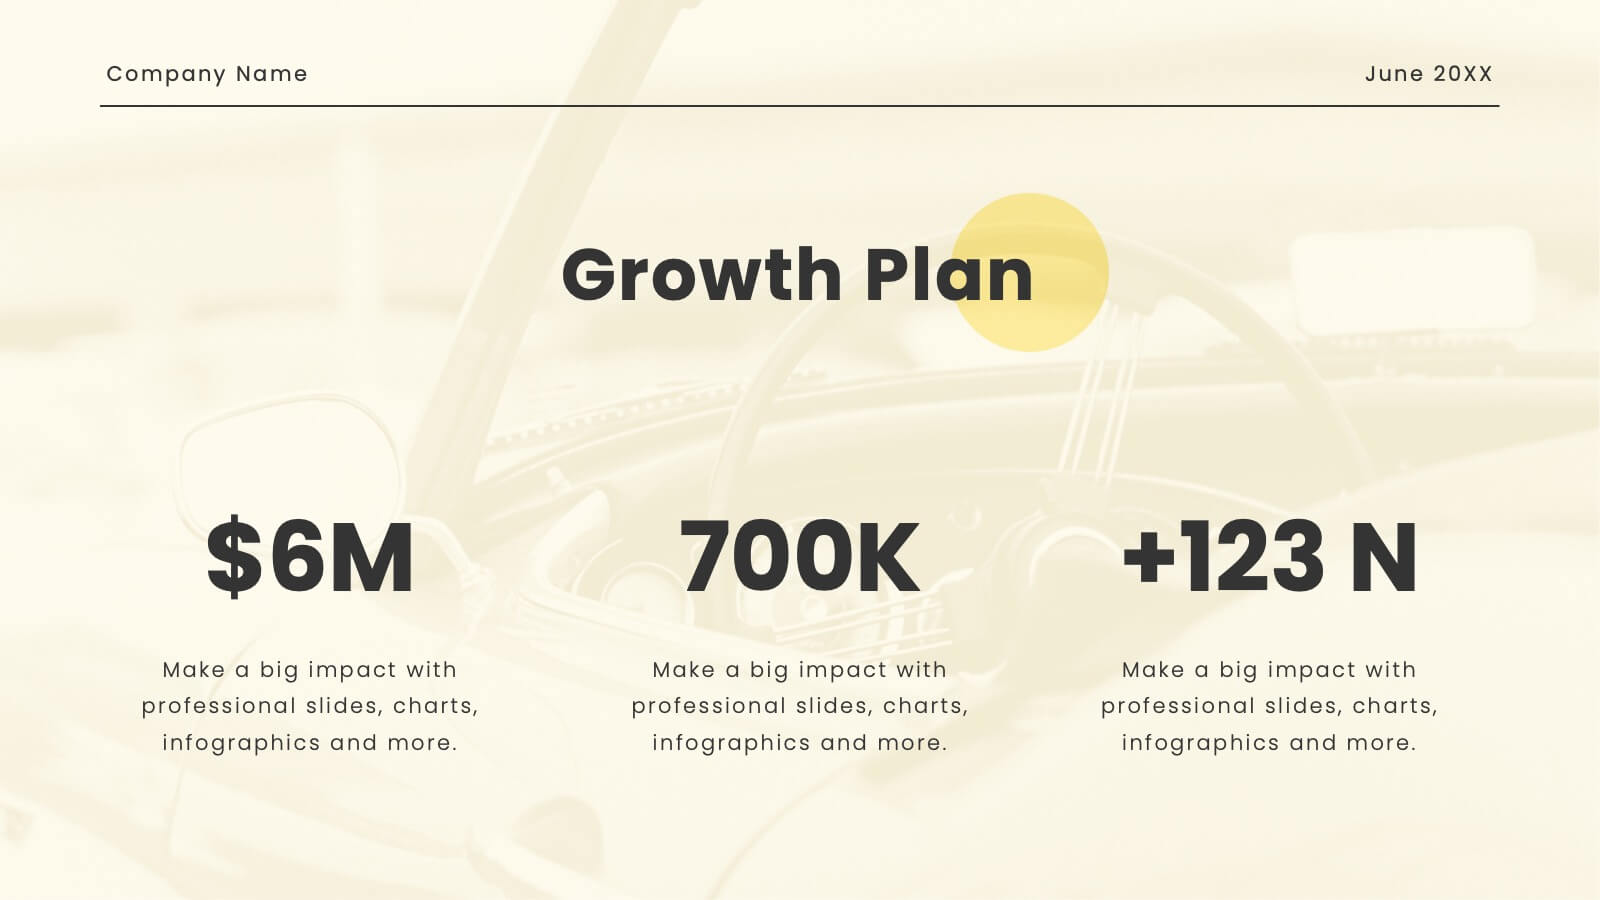
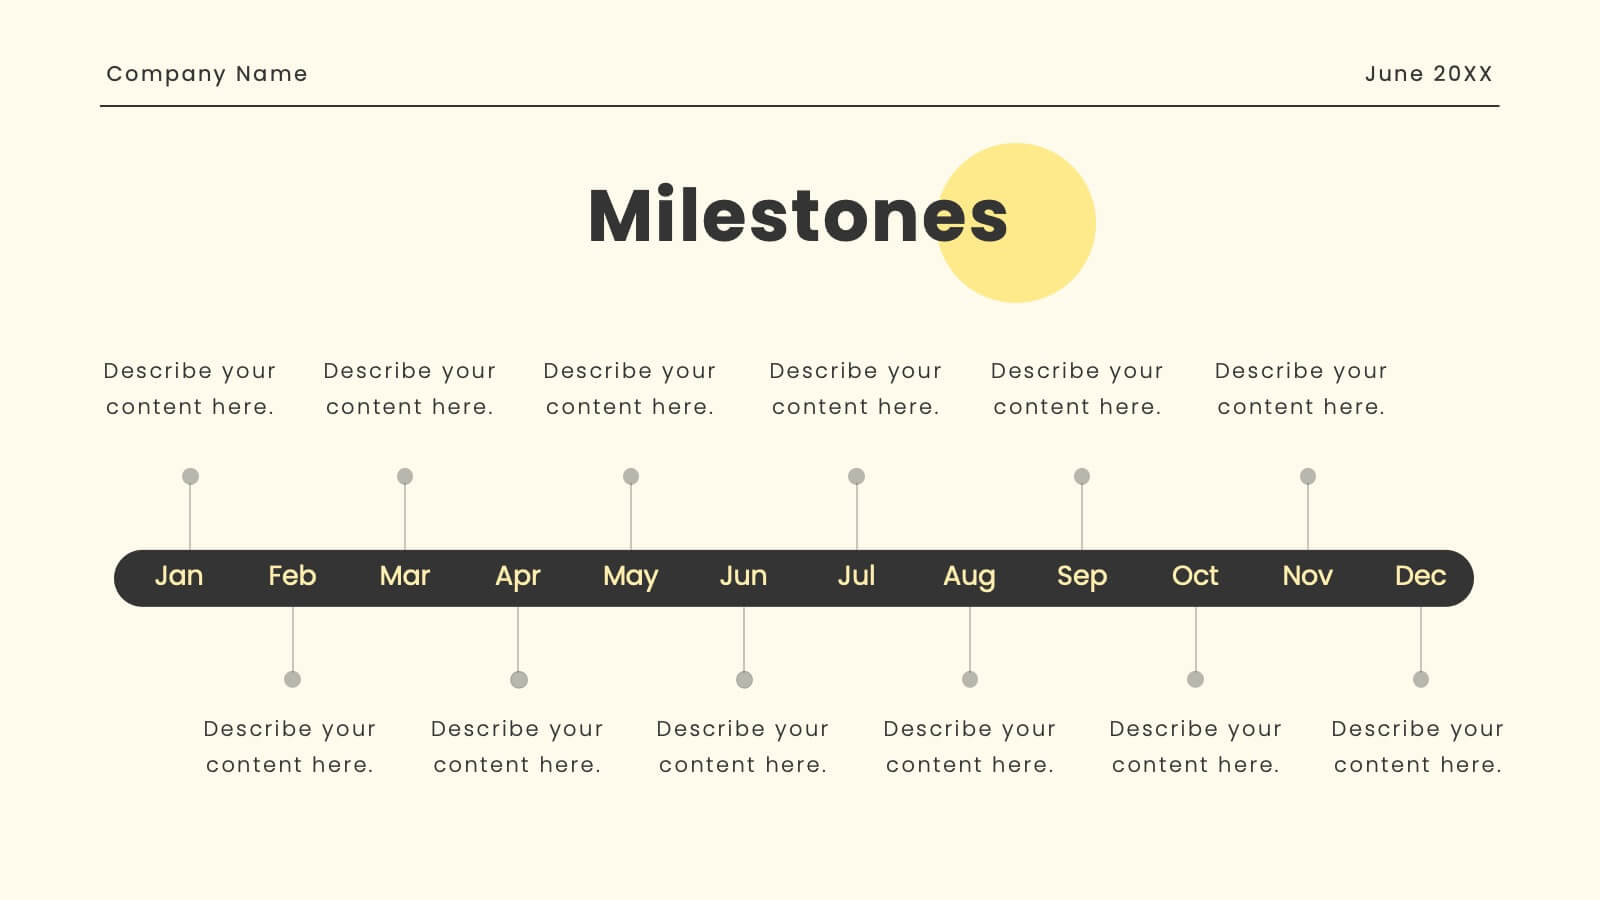
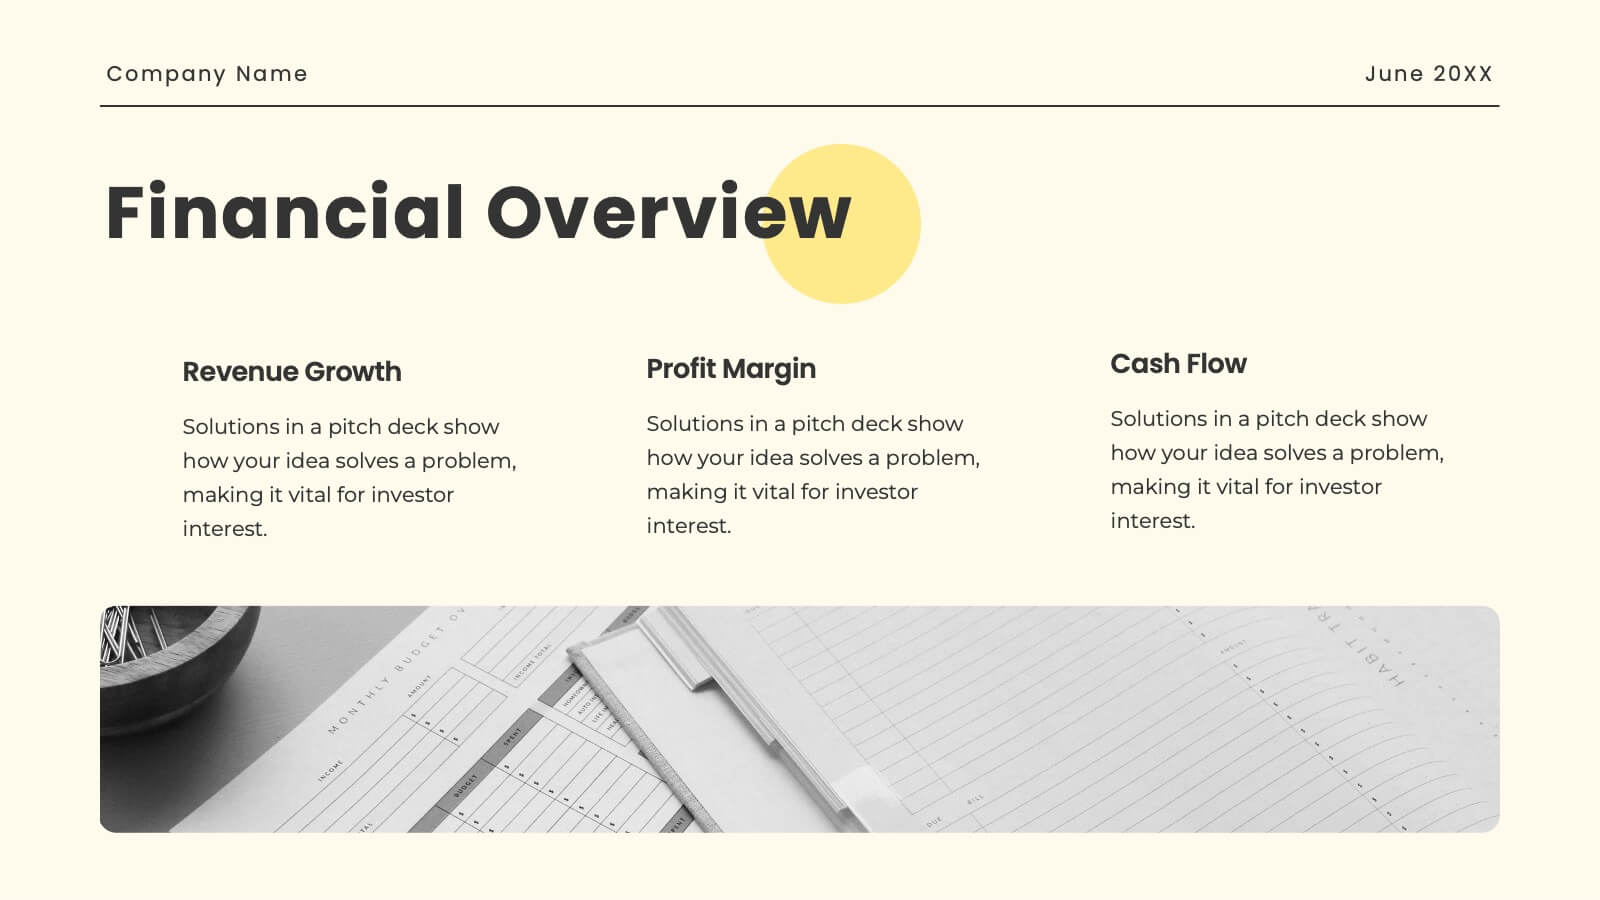
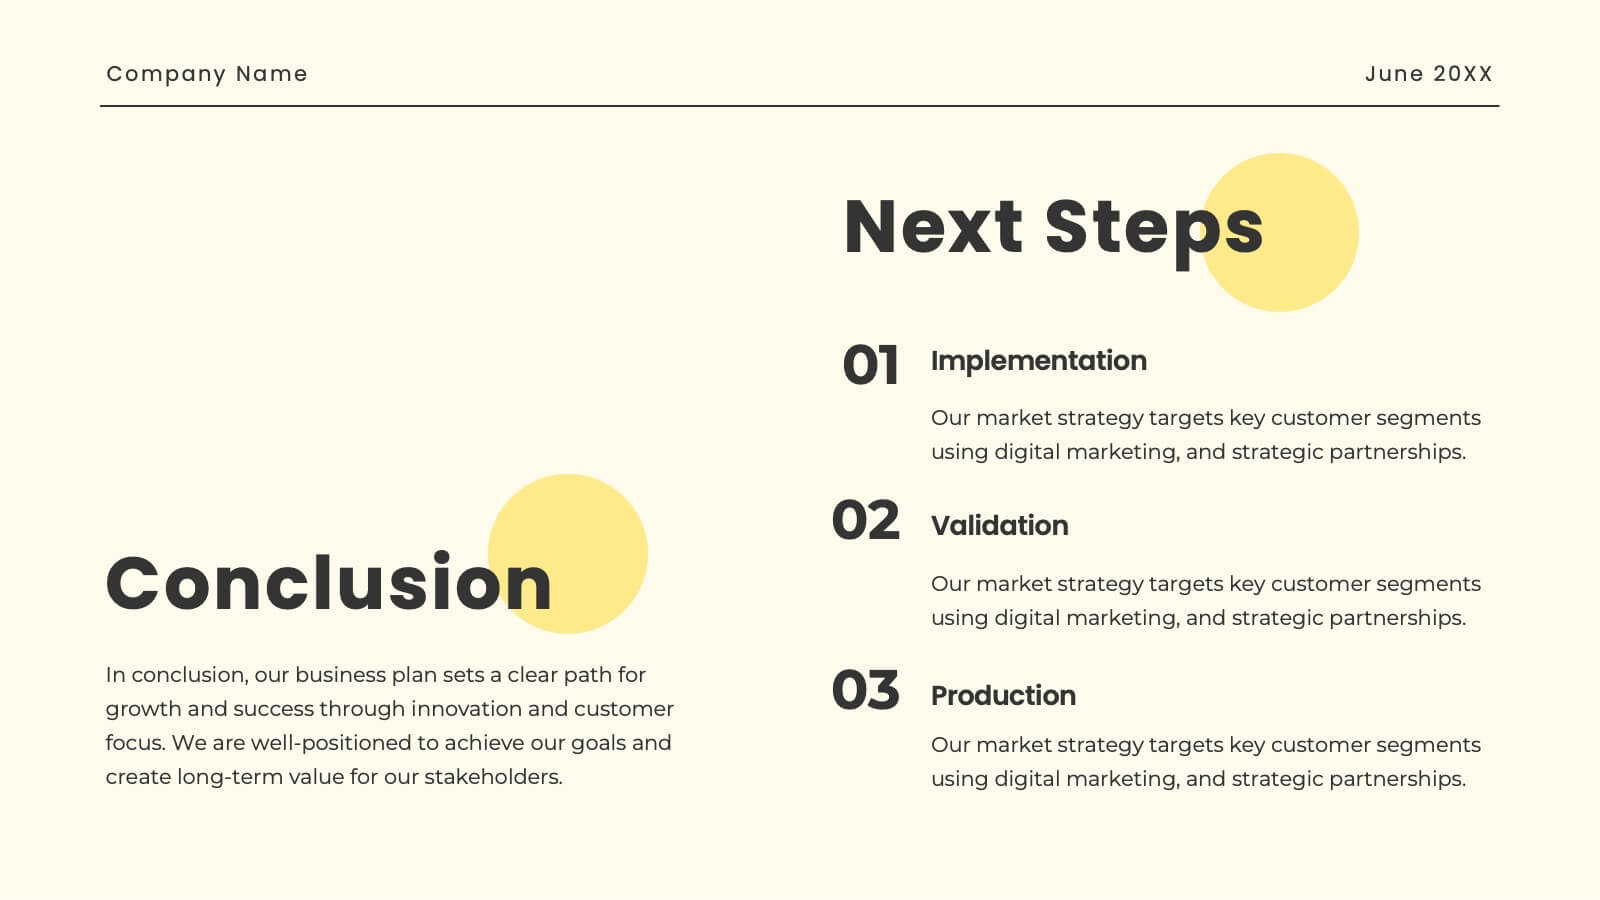
Oasis Startup Business Plan Presentation
Present your corporate business plan with confidence! This template includes sections for company overview, mission, vision, services, target market, and more. Showcase your market strategy, sales channels, growth plan, and financial overview. Perfect for conveying a professional and comprehensive business plan. Compatible with PowerPoint, Keynote, and Google Slides. Impress your audience today!


5 slides
Multiple Lists Infographics
Unleash the power of organized information with our multiple lists infographics template, your companion for presenting diverse data. This versatile resource, steeped in a vibrant mix of orange, blue, and purple hues, caters to professionals from all sectors, aiding in the seamless conveyance of varied content, from business agendas to educational material. The template, characterized by its informative and creatively random style, integrates compelling graphics and intuitive icons. Whether you're a business leader, educator, or content creator striving for clarity and engagement, this infographic tool is tailored for an unforgettable visual impact.


5 slides
Digital Marketing Infographics
Digital Marketing refers to the use of digital channels, platforms, and strategies to promote products, services, and brands to reach and engage with target audiences. These infographic templates are perfect for explaining concepts, illustrating processes, showcasing data, or comparing information. They are commonly used in digital marketing to provide information to clients, educate consumers, and promote products and services. These Infographics can be shared on social media, websites, and blogs to increase engagement and drive traffic to a brand's online presence. Compatible with Powerpoint, Keynote, and Google Slides.


5 slides
Education Jobs Infographics
Education Jobs encompass a wide range of roles and responsibilities focused on providing education, training, and support to learners of all ages. This template is designed to showcase the diverse range of careers available in the education sector. Use this template to inform and inspire individuals interested in pursuing a career in education, whether as teachers, administrators, counselors, researchers, or other specialized roles. With its visually engaging design and comprehensive information, this template will help your audience navigate the world of education jobs and make informed career decisions.


6 slides
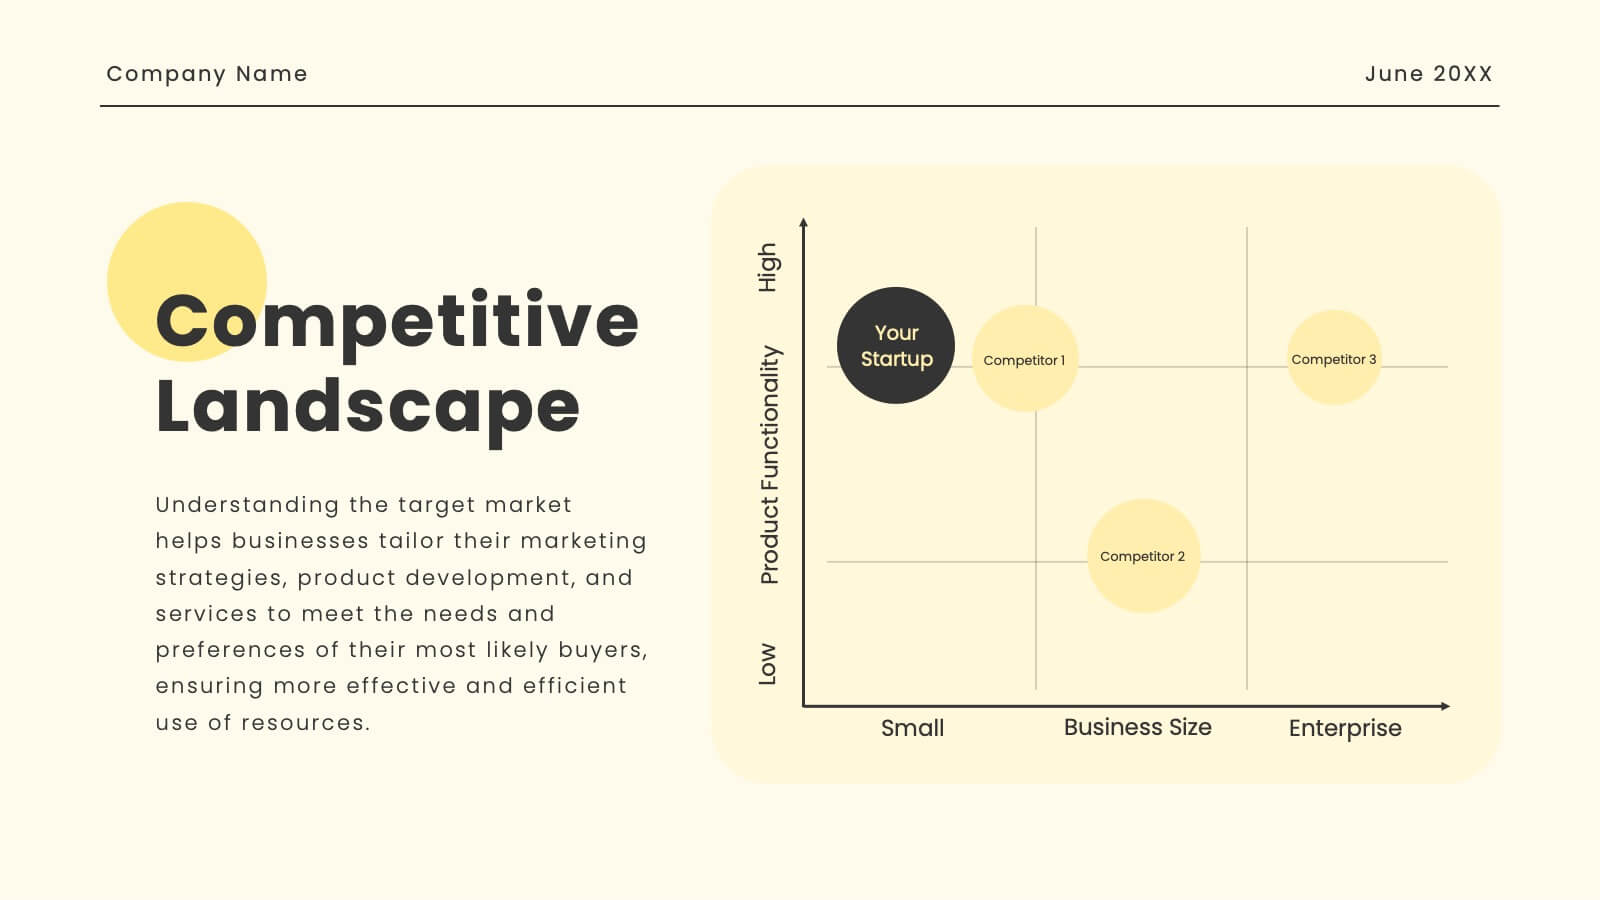
Target Audience Demographics Presentation
The "Target Audience Demographics" presentation employs an innovative spiral chart design to display key demographic data in an engaging and easy-to-understand format. Each segment of the spiral represents a different demographic characteristic with percentages clearly marked, enabling quick insights into audience composition. This design is well-suited for marketing presentations or any scenario where understanding audience segments is crucial. The placeholders are conveniently set up to add specific details or insights, making the template not only visually appealing but also highly functional for strategic planning and audience analysis.


5 slides
Monthly Sales Report Infographics
A monthly sales report is a document that provides an overview of a company's sales performance during a specific month. These infographic templates are perfect for sales managers, business owners, or analysts who want to present monthly sales performance and trends to stakeholders, team members, or clients. This is an effective tool for presenting sales data in a visually engaging and comprehensive way. With these templates, you can create professional and impactful sales reports that effectively convey the story behind the numbers. Compatible with Powerpoint, Keynote, and Google Slides.


10 slides
Modern Healthcare Technology Trends Presentation
Highlight innovations in healthcare with the Modern Healthcare Technology Trends Presentation. This slide features a central device graphic connected to four key icons, perfect for showcasing digital tools, emerging trends, or medical tech strategies. Fully customizable in Canva, PowerPoint, Keynote, and Google Slides—ideal for medical tech briefings and strategic presentations.


20 slides
Illumira Design Proposal Presentation
Impress clients with this modern and professional design proposal presentation template. It covers key sections such as project summary, objectives, budget breakdown, and action plans. Fully customizable with clean layouts and engaging visuals, perfect for showcasing your design solutions effectively. Compatible with PowerPoint, Keynote, and Google Slides.


6 slides
Gantt Chart for Project Phasing Presentation
Plan and visualize your timeline effortlessly with this Gantt Chart for Project Phasing presentation. Ideal for breaking down tasks by month, this template helps you communicate project stages, team responsibilities, and key milestones clearly. Fully editable in Canva, PowerPoint, and Google Slides—customize colors, titles, and durations to match your workflow.


6 slides
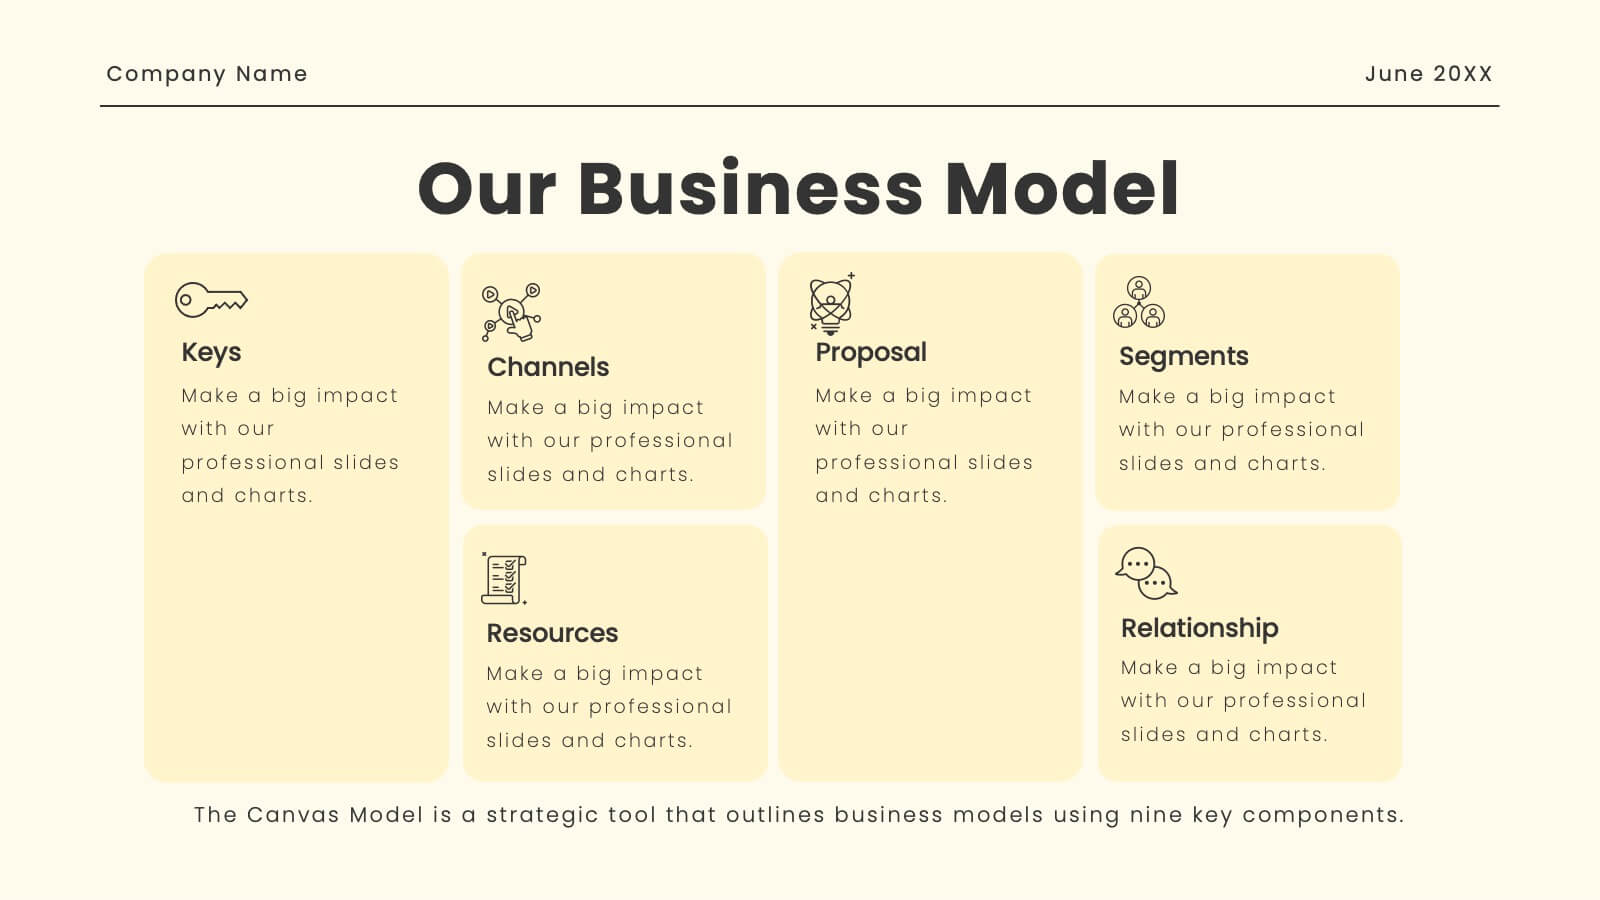
Canvas Breakdown for Startup Strategy Presentation
Break down your startup strategy with this streamlined canvas layout. Designed for clarity and flow, this slide presents six core components in a visually engaging format. Ideal for early-stage founders, innovation teams, and pitch decks, it simplifies complex business models into clear, actionable sections for strategic alignment and storytelling.


6 slides
RAPID Decision Infographic
The RAPID matrix is a decision-making framework used to clarify roles and responsibilities within a project or organization, especially when it comes to decision-making processes. The RAPID acronym stands for Responsible, Accountable, Consulted, Informed, and Decider. This infographic template is a visual tool that helps clarify roles and responsibilities within a project or process. This template is designed to define who is involved in each step of a task, who has decision-making authority, and who needs to be informed or consulted. Compatible with Powerpoint, Keynote, and Google Slides. Apply a color-coding scheme to visually distinguish different roles.


6 slides
Human Anatomy Structure Diagram Presentation
Explore human body systems visually with this anatomy diagram slide. Highlight up to five organs or regions using numbered callouts connected to a central graphic. Ideal for healthcare, education, or medical presentations. Easily customizable in PowerPoint, Keynote, or Google Slides for labeling body parts, explaining functions, or guiding patient education.


6 slides
Organizational Structure Overview Presentation
Map out your team’s structure with clarity using this simple organizational chart template. Ideal for showcasing departments, reporting lines, or team roles, it helps stakeholders quickly understand who’s who and how responsibilities are divided. Perfect for internal meetings, onboarding decks, or company overviews. Works with PowerPoint, Keynote, and Google Slides.


10 slides
Marketing Funnel Diagram Presentation
Optimize your sales strategy with this Marketing Funnel Diagram template. Ideal for visualizing customer journeys, lead conversion, and sales processes, this design is fully editable to fit your business needs. Customize colors, text, and icons easily. Compatible with PowerPoint, Keynote, and Google Slides for seamless presentations and collaboration.


4 slides
Strategic Growth Next Steps Presentation
Achieve sustainable growth with the Strategic Growth Next Steps Presentation template. This structured, step-by-step layout guides your audience through key phases of business expansion, helping to communicate priorities and action plans effectively. The wavy path design adds a dynamic flow to your strategy, ensuring clarity and engagement. Fully customizable for PowerPoint, Keynote, and Google Slides, making it a versatile tool for strategic planning and business development.


5 slides
Visual Decision-Making with Harvey Balls Presentation
Simplify complex evaluations with this Harvey Ball comparison chart. Ideal for product comparisons, feature assessments, or decision-making matrices, this slide presents up to 6 items and 4 features with intuitive visual cues. Fully editable in PowerPoint, Keynote, or Google Slides, it’s perfect for business, marketing, and strategy teams seeking clear and compelling insights.


4 slides
Virtual Learning Experience Design Presentation
Bring your online classroom ideas to life with this modern and visual-first design! This infographic presentation breaks down the key components of virtual learning experience design—perfect for mapping student touchpoints, engagement strategies, and content flow. Fully editable and easy to use in PowerPoint, Keynote, and Google Slides for fast customization.