


Features
- 5 Unique slides
- Fully editable and easy to edit in Microsoft Powerpoint, Keynote and Google Slides
- 16:9 widescreen layout
- Clean and professional designs
- Export to JPG, PDF or send by email


Do you have any questions?
Recommend


22 slides
Eclipser Qualitative Research Findings Presentation
This Qualitative Research Findings Presentation is designed to effectively showcase research insights with a clean and modern layout. It covers key areas such as research objectives, methodology, data analysis, findings, and recommendations. Fully customizable and compatible with PowerPoint, Keynote, and Google Slides for seamless editing and professional results.


5 slides
Investment Portfolio & Stock Forecast Presentation
Present key investment insights with clarity using the Investment Portfolio & Stock Forecast presentation template. Featuring a central briefcase visual and surrounding data points, this layout is perfect for showcasing portfolio allocation, stock predictions, market movements, or financial planning elements. Designed for finance professionals, analysts, and advisors, it simplifies complex data into digestible visuals. Fully editable and compatible with PowerPoint, Keynote, and Google Slides.


5 slides
Business Model Canvas Overview Presentation
Streamline your business strategy with the Business Model Canvas Overview Presentation. Designed for entrepreneurs, startups, and strategists, this template visualizes key partners, activities, value propositions, customer segments, revenue streams, and more. Fully editable for PowerPoint, Keynote, and Google Slides, ensuring a structured and professional business plan presentation.


5 slides
Africa Country Borders Presentation
Bring geography to life with a clean, modern map design that highlights country boundaries and key regions across Africa. Perfect for showcasing regional data, market analysis, or project coverage, this layout ensures clarity and precision. Fully compatible with PowerPoint, Keynote, and Google Slides for easy customization and use.


7 slides
Aviation Terms Infographic
Take flight with our aviation terms infographic, designed with a serene palette of white, blue, and hints of orange that echo the hues of the sky. This meticulously crafted infographic decodes the intricate jargon of the aviation world, making it a breeze for enthusiasts, trainees, and even seasoned aviators to grasp. Ideal for flight schools, airline training programs, and aviation seminars, this infographic simplifies complex terminologies with ease. With full compatibility across PowerPoint, Keynote, and Google Slides, sharing your knowledge of the skies has never been more accessible or visually appealing.


10 slides
Decision Tree Diagram Presentation
Simplify Decision-Making! The Decision Tree Diagram Presentation helps visualize complex choices with structured branching paths. Perfect for business strategies, process flows, or risk analysis, this template ensures clarity with editable nodes and connectors. Fully customizable and available for PowerPoint, Keynote, and Google Slides to fit your unique needs effortlessly.


7 slides
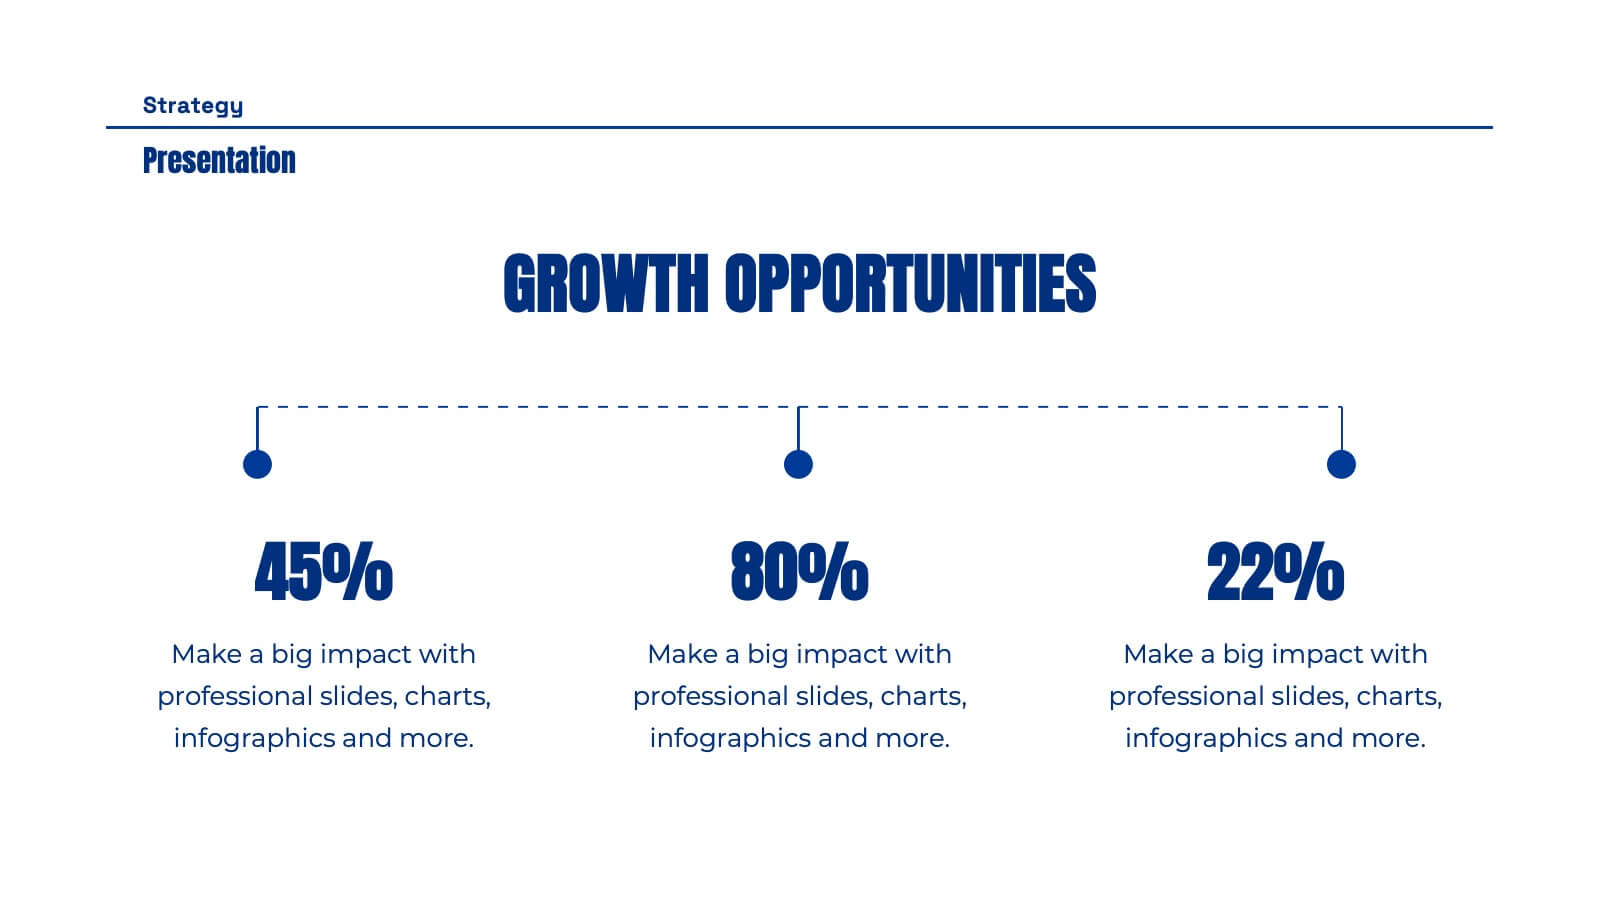
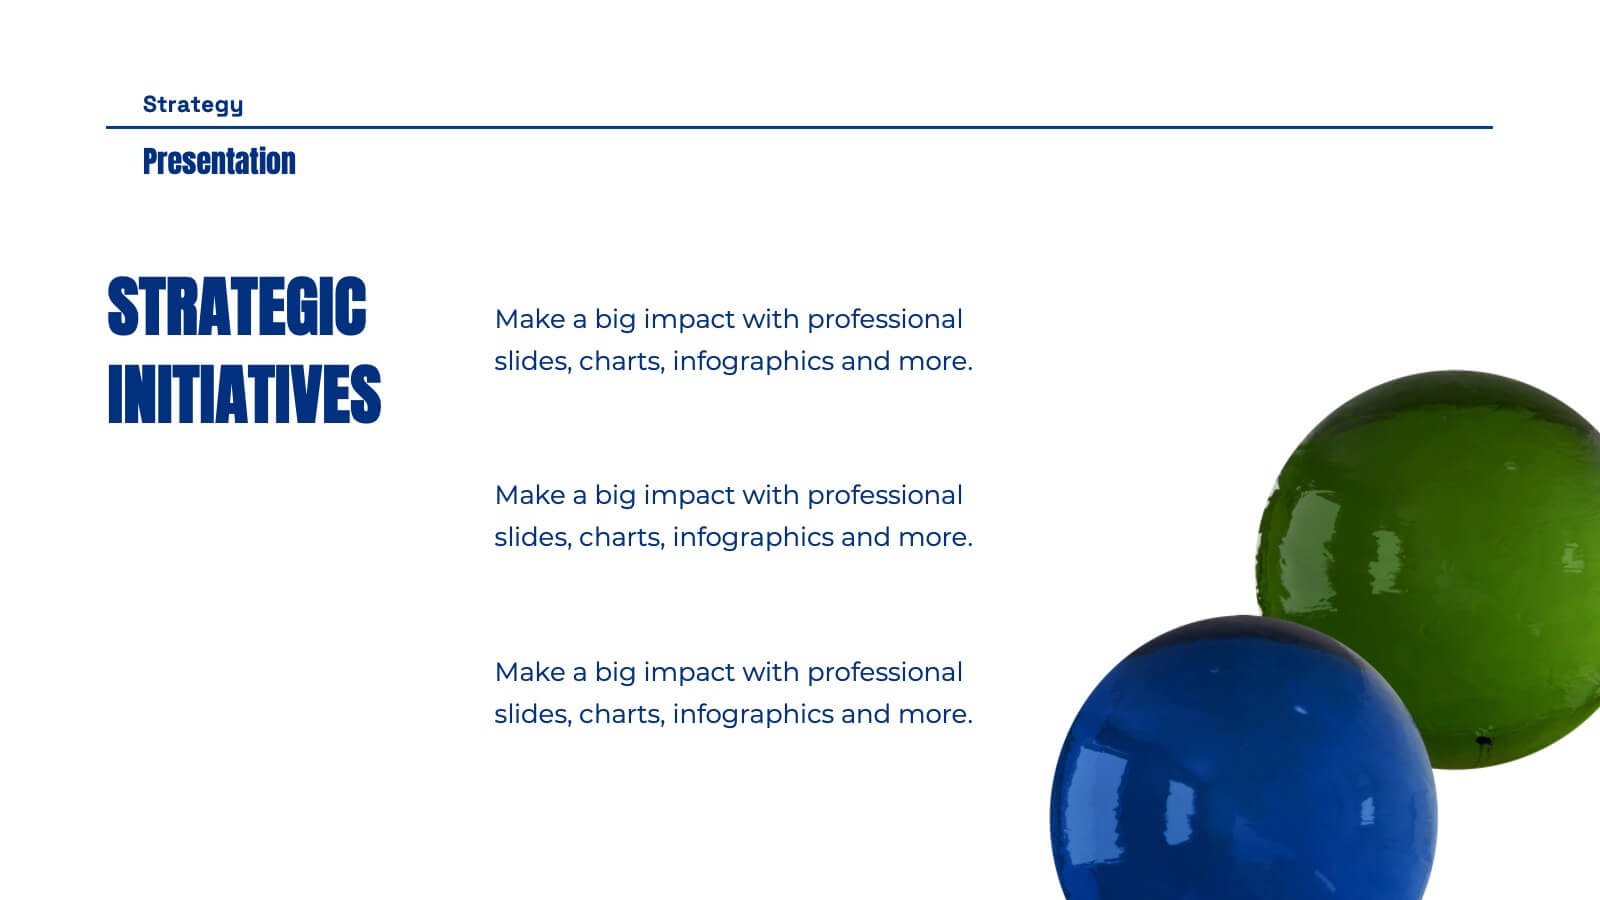
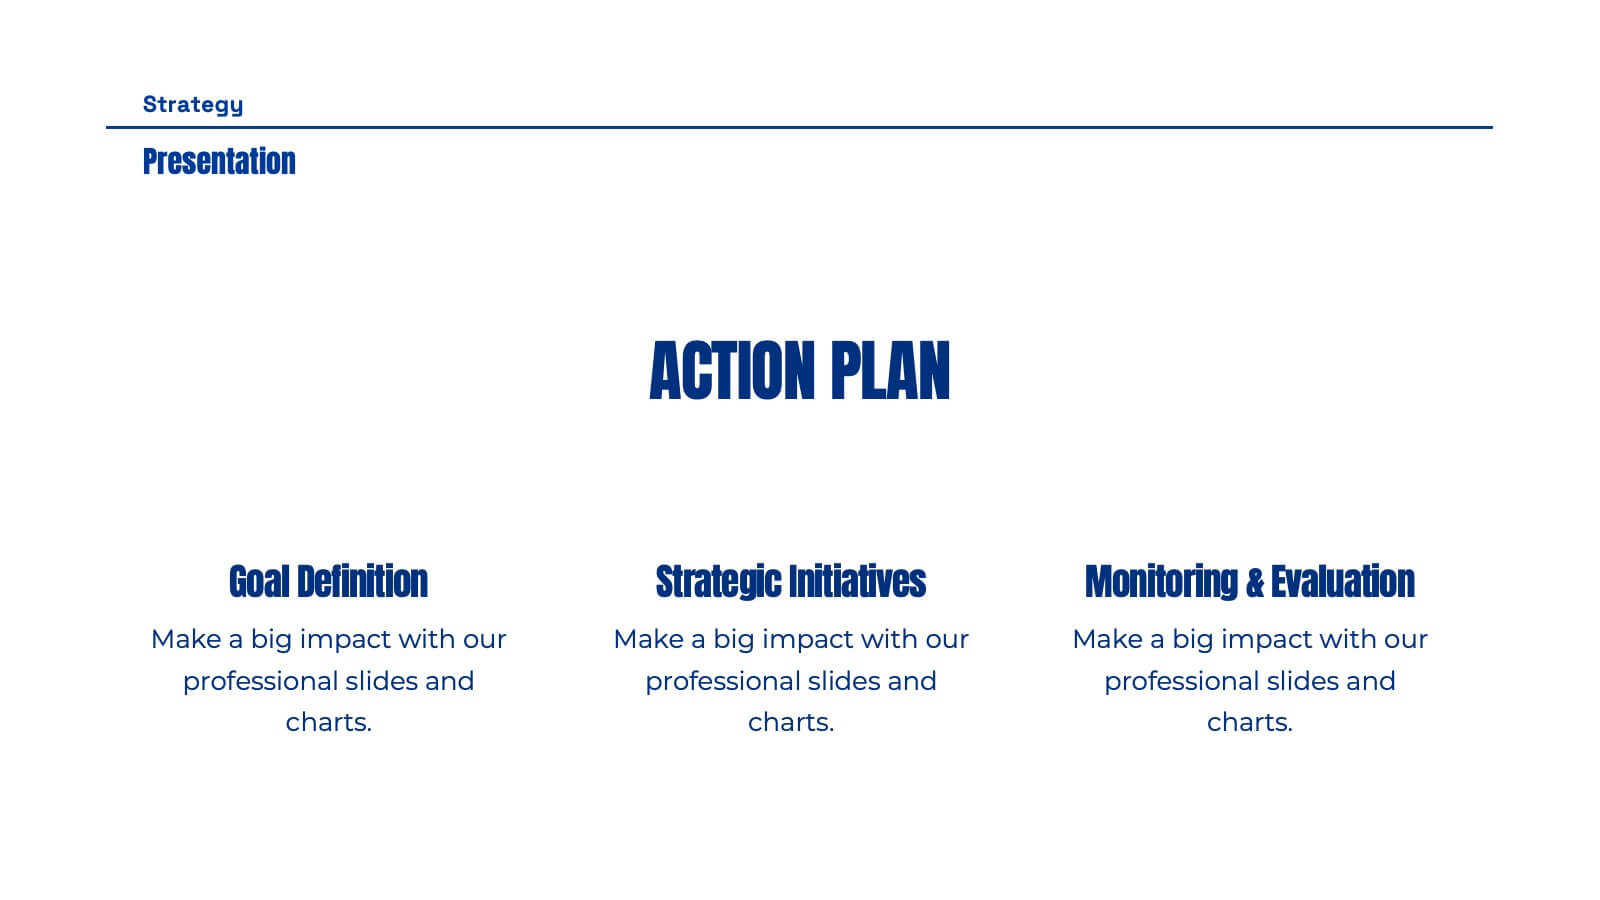
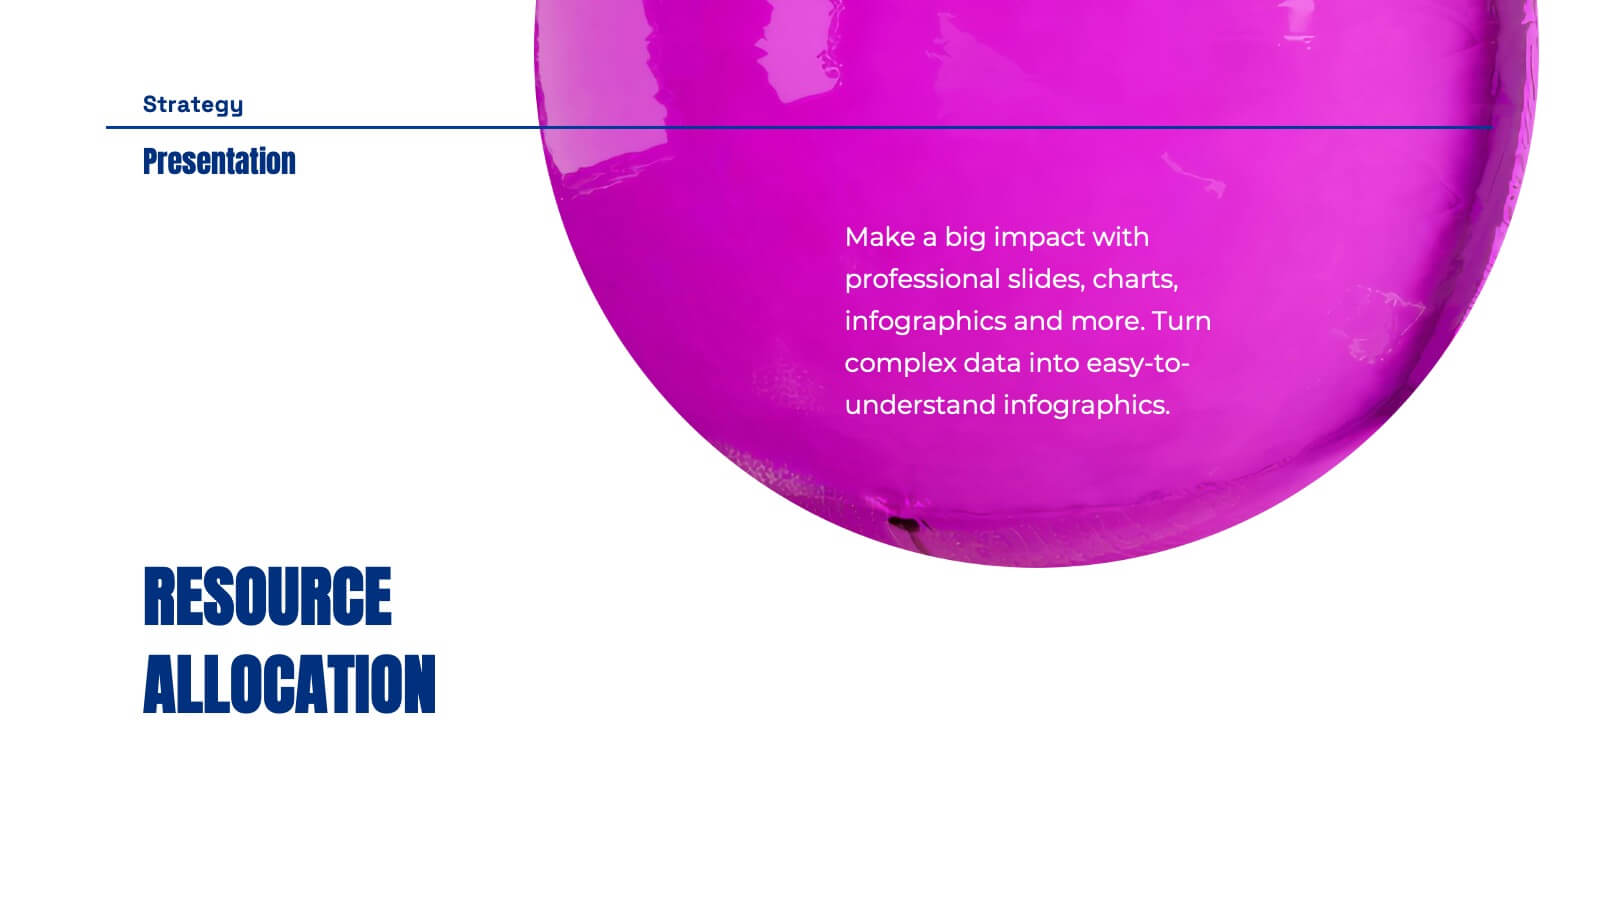
Growth Infographics Presentation Template
Our Growth Infographic template is a minimal modern design that combines data analysis and professional presentation. The presentation contains a set of slides with various information texts for your topic. This template is compatible with powerpoint and allows you to customize the color schemes, which makes it suitable for any theme and image style. Showcase your company’s growth by using this infographic template. This template can be used as a promotional tool for your business or to show growth results in order to attract investors. This template is a high quality, dynamic presentation!


10 slides
Project Budget Breakdown Presentation
The "Project Budget Breakdown Presentation" template offers a clear and efficient way to visualize budget allocations within a project. It uses a visually appealing color scheme that highlights four different budget segments, each represented by a different color to ensure quick readability and easy understanding. The template allows you to illustrate percentages and corresponding financial values, making it straightforward for stakeholders to grasp budget allocations at a glance. This template is highly beneficial for project managers, financial analysts, and business executives who need to present and discuss budgetary details clearly and concisely in project meetings or budget reviews. It is adaptable for use in various industries, including construction, IT, marketing, and research development, supporting effective budget management and transparency.


4 slides
Concentric Circles Business Model
Bring your ideas full circle—literally—with this bold and colorful diagram layout! This infographic template is ideal for presenting layered concepts, interconnected systems, or customer journeys using a visually engaging concentric circle design. It’s fully customizable and works seamlessly in PowerPoint, Keynote, and Google Slides for a polished, professional look.


4 slides
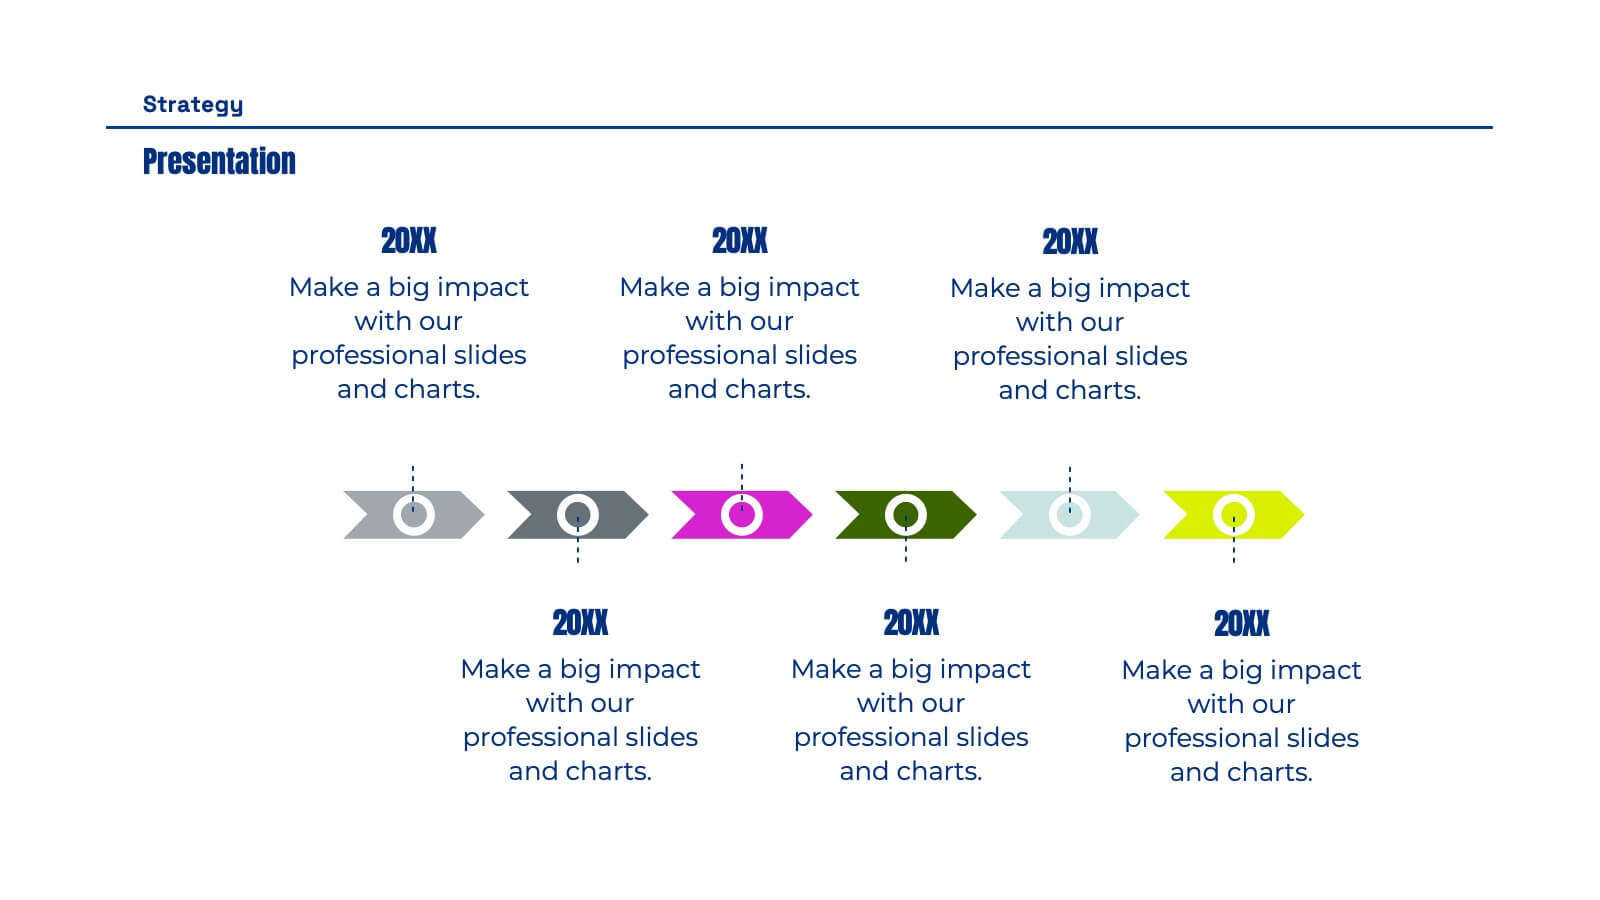
Colorful Workflow Process Chart Presentation
Bring your workflow to life with a vibrant, easy-to-follow layout that makes every stage feel connected and purposeful. This presentation helps you map processes, explain team roles, and simplify complex steps using a clean, visual flow. Fully compatible with PowerPoint, Keynote, and Google Slides.


4 slides
Project Responsibility Chart
Streamline team coordination with this Project Responsibility Chart. Clearly define who is Responsible, Accountable, Consulted, and Informed across key tasks. Ideal for project managers and team leads ensuring role clarity. Fully editable in PowerPoint, Keynote, and Google Slides.


5 slides
Insurance Policy Structure Presentation
Add a touch of creativity to your financial reports with this clean and modern presentation design. Perfect for explaining coverage breakdowns, risk management strategies, or policy frameworks, it simplifies complex ideas through visuals. Fully editable and compatible with PowerPoint, Keynote, and Google Slides for a seamless presentation experience.


43 slides
UX UI Structure Presentation
Dive into UX with this comprehensive, elegant presentation template tailored for detailed case studies and user research. Perfect for mapping user journeys, creating personas, and showcasing design principles, this template ensures your UX insights are clearly communicated. Its sleek design enhances readability and engagement. Compatible with PowerPoint, Keynote, and Google Slides, it's ideal for any platform.


5 slides
Corporate Case Study Analysis Presentation
Enhance your business presentations with the Corporate Case Study Analysis Presentation template. This structured design helps visualize case studies, success stories, or business challenges in a clear, step-by-step format. Ideal for consultants, business analysts, and executives, this slide simplifies complex data into an easy-to-follow journey. Fully customizable in PowerPoint, Keynote, and Google Slides to align with your brand and insights.


21 slides
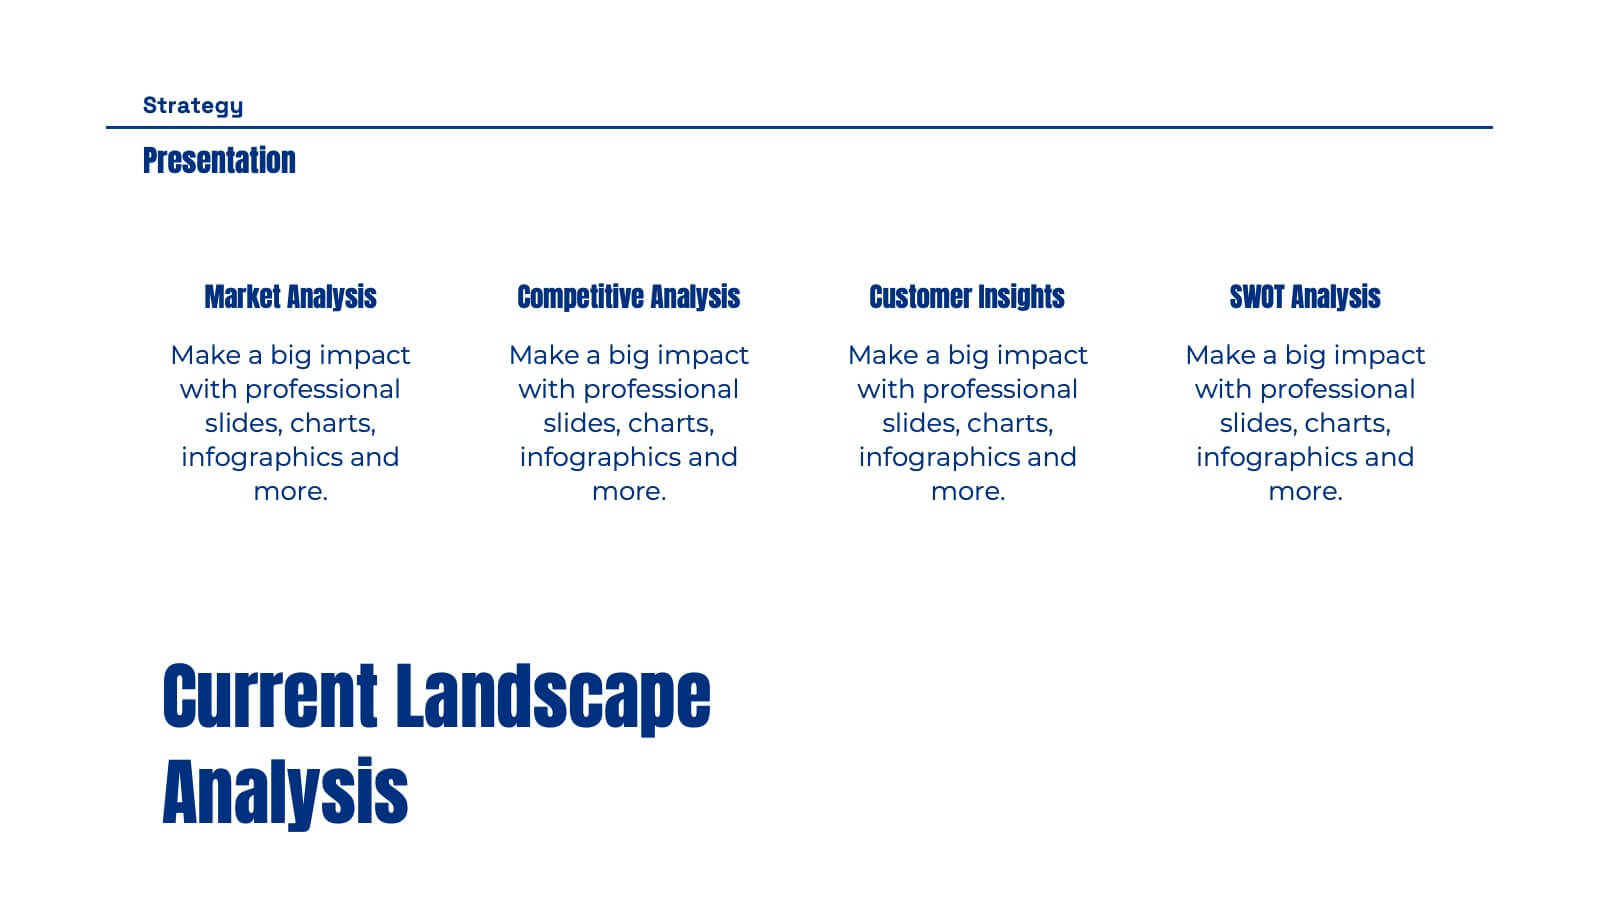
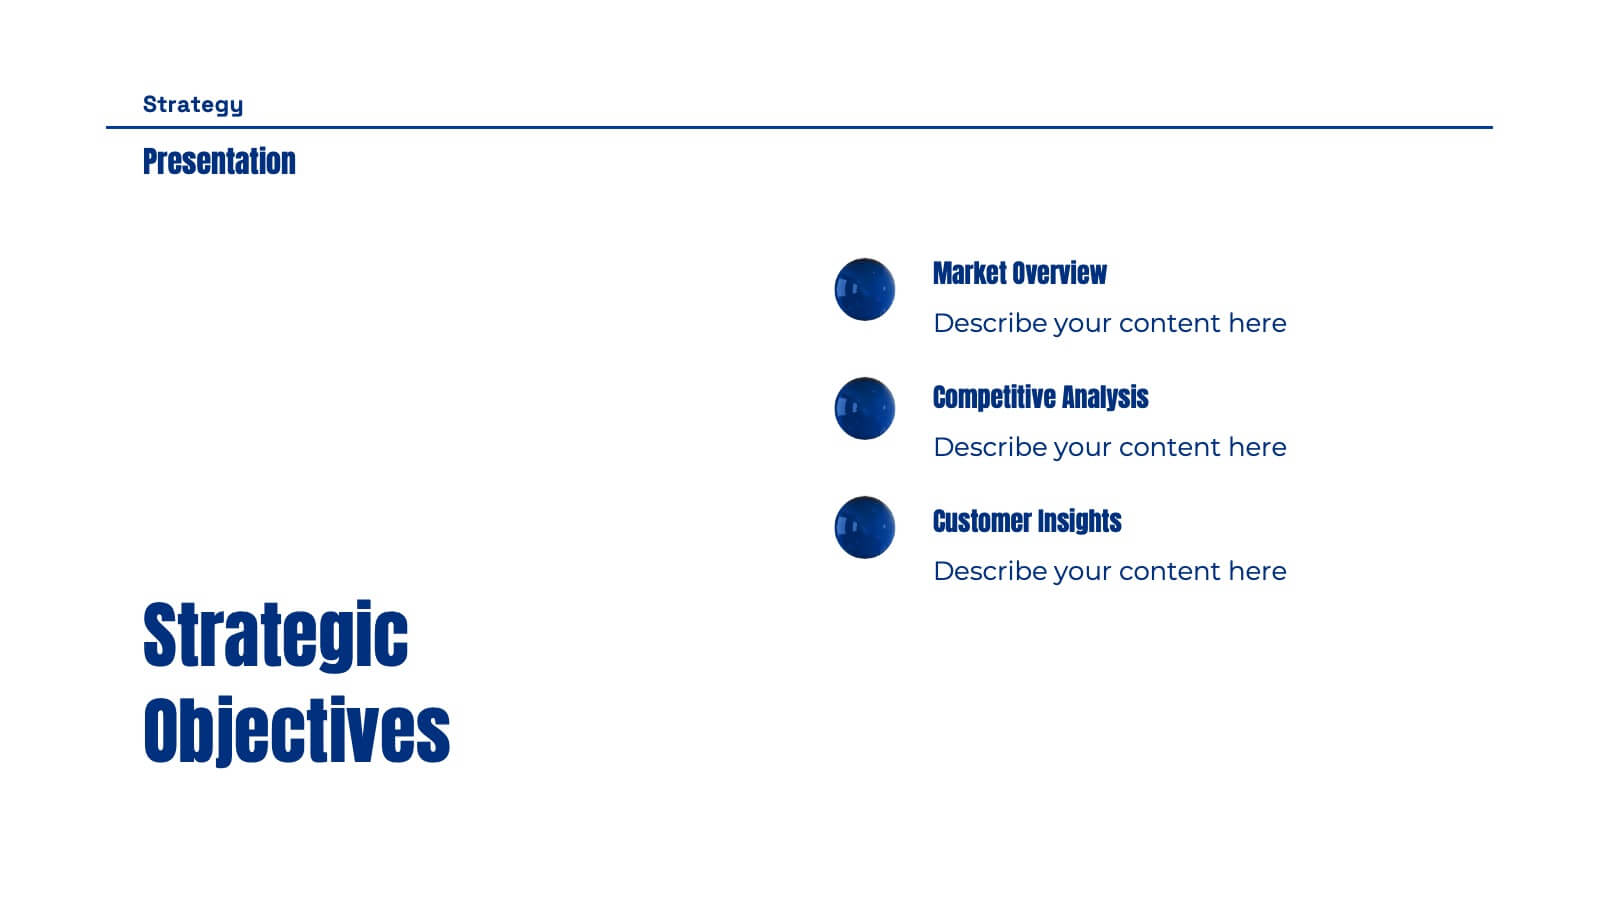
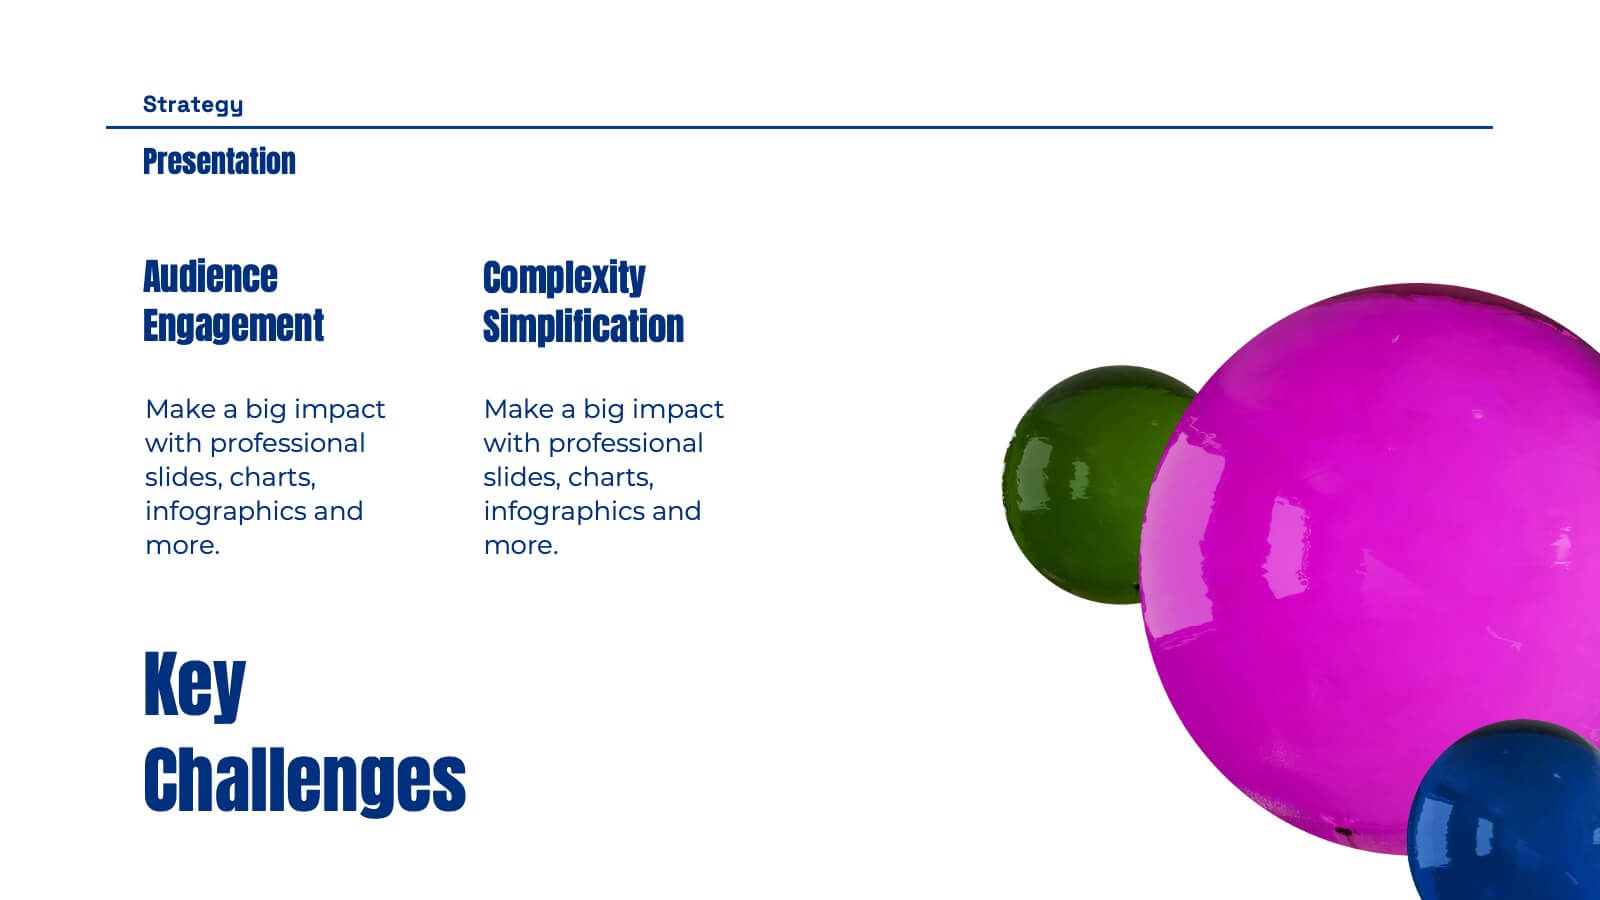
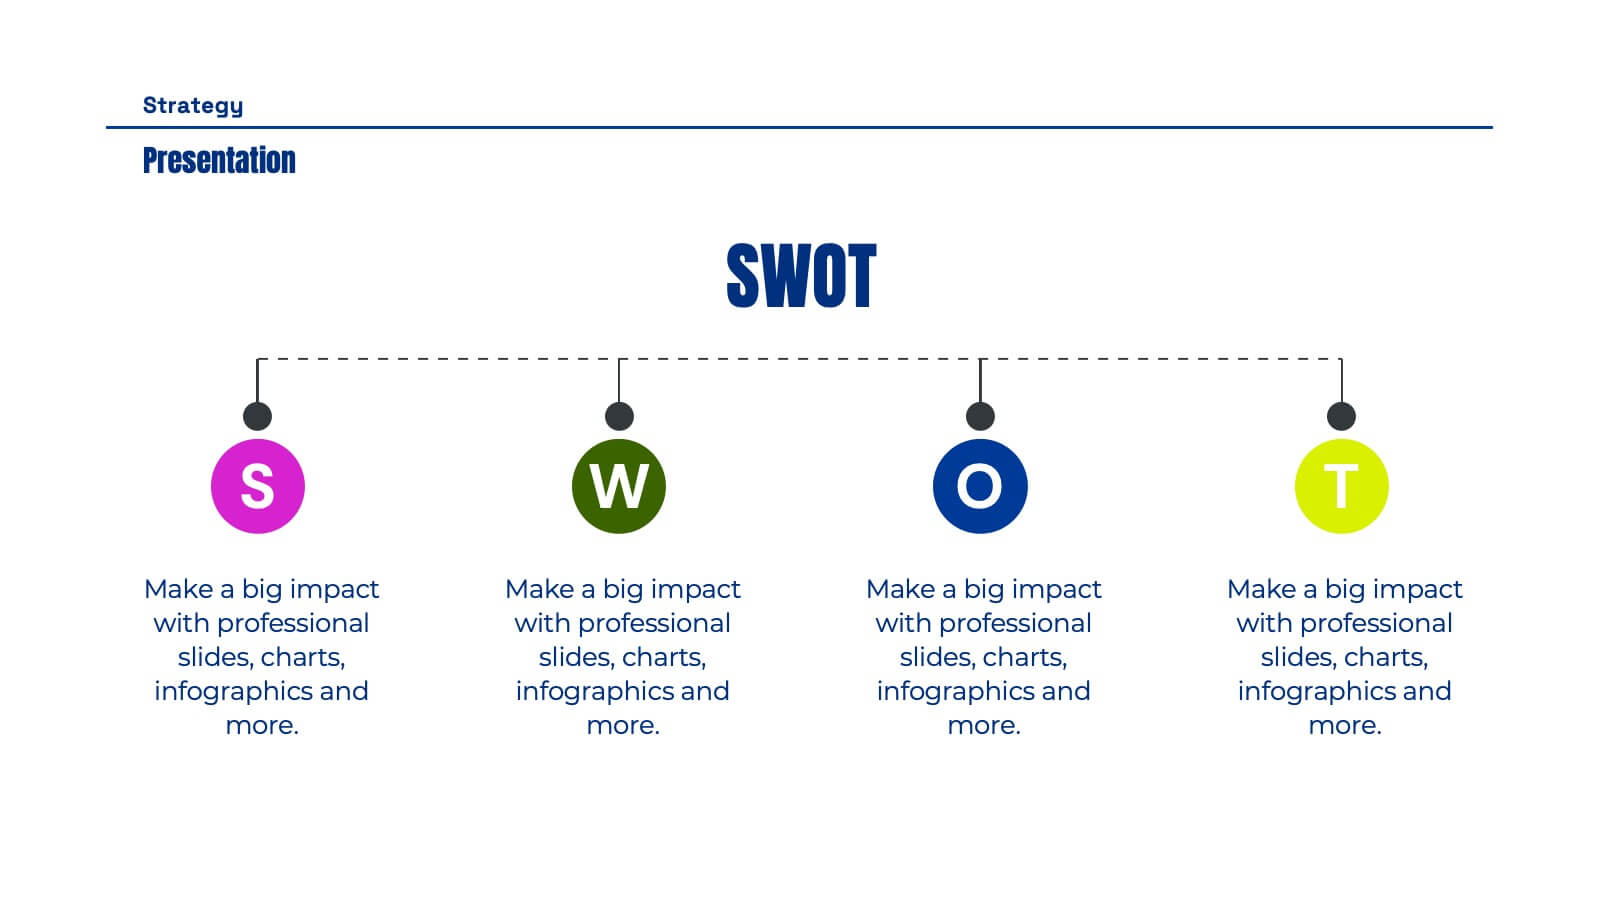
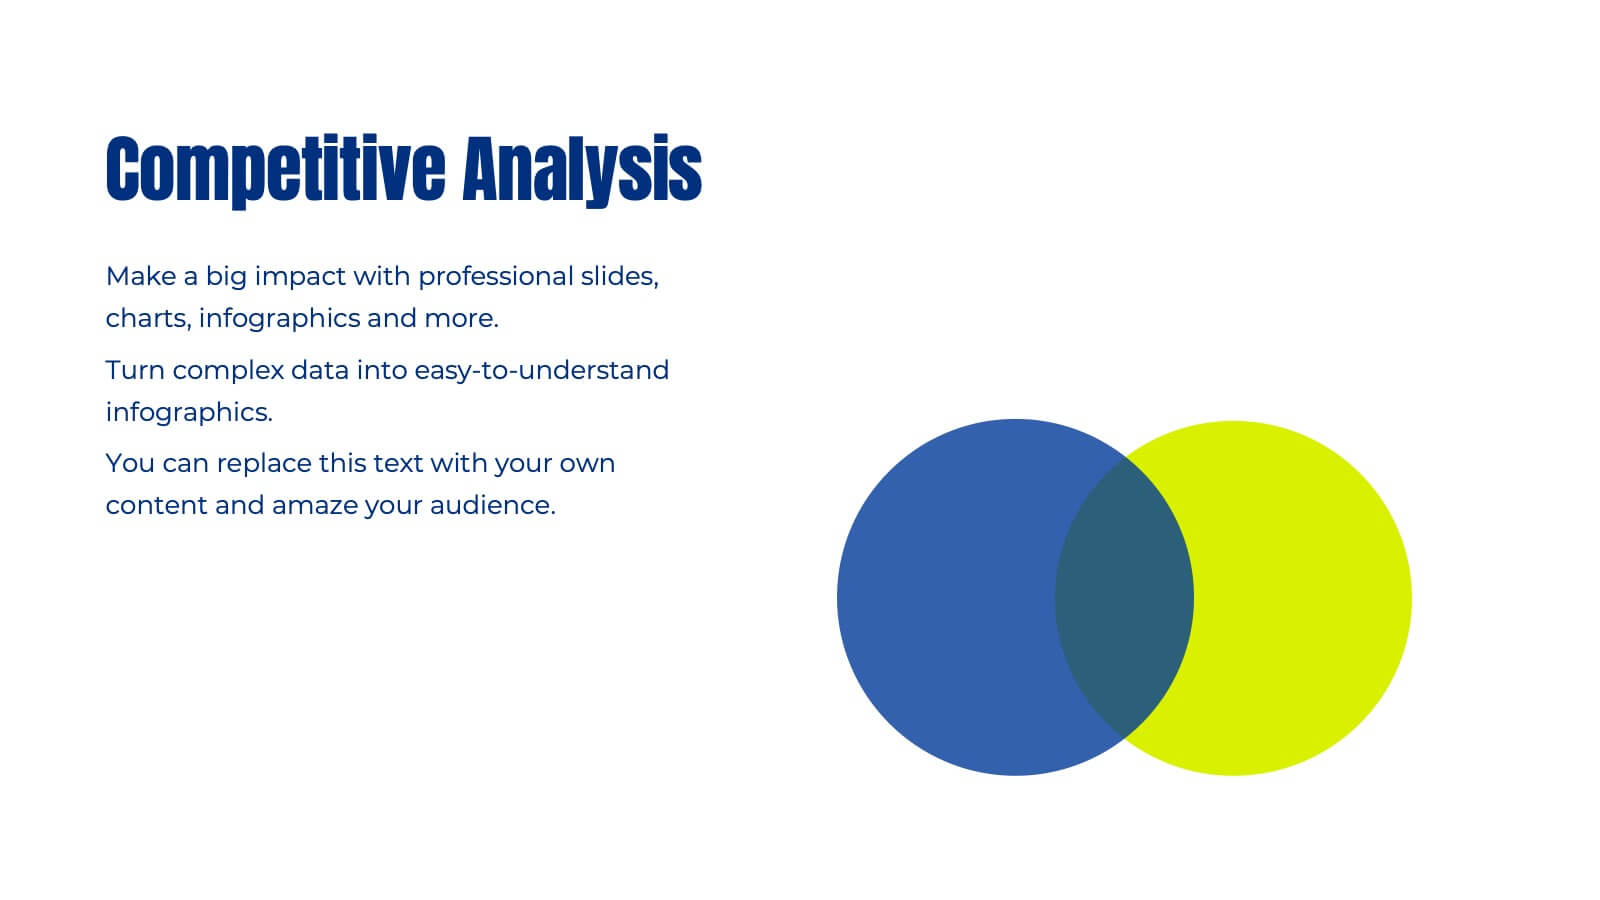
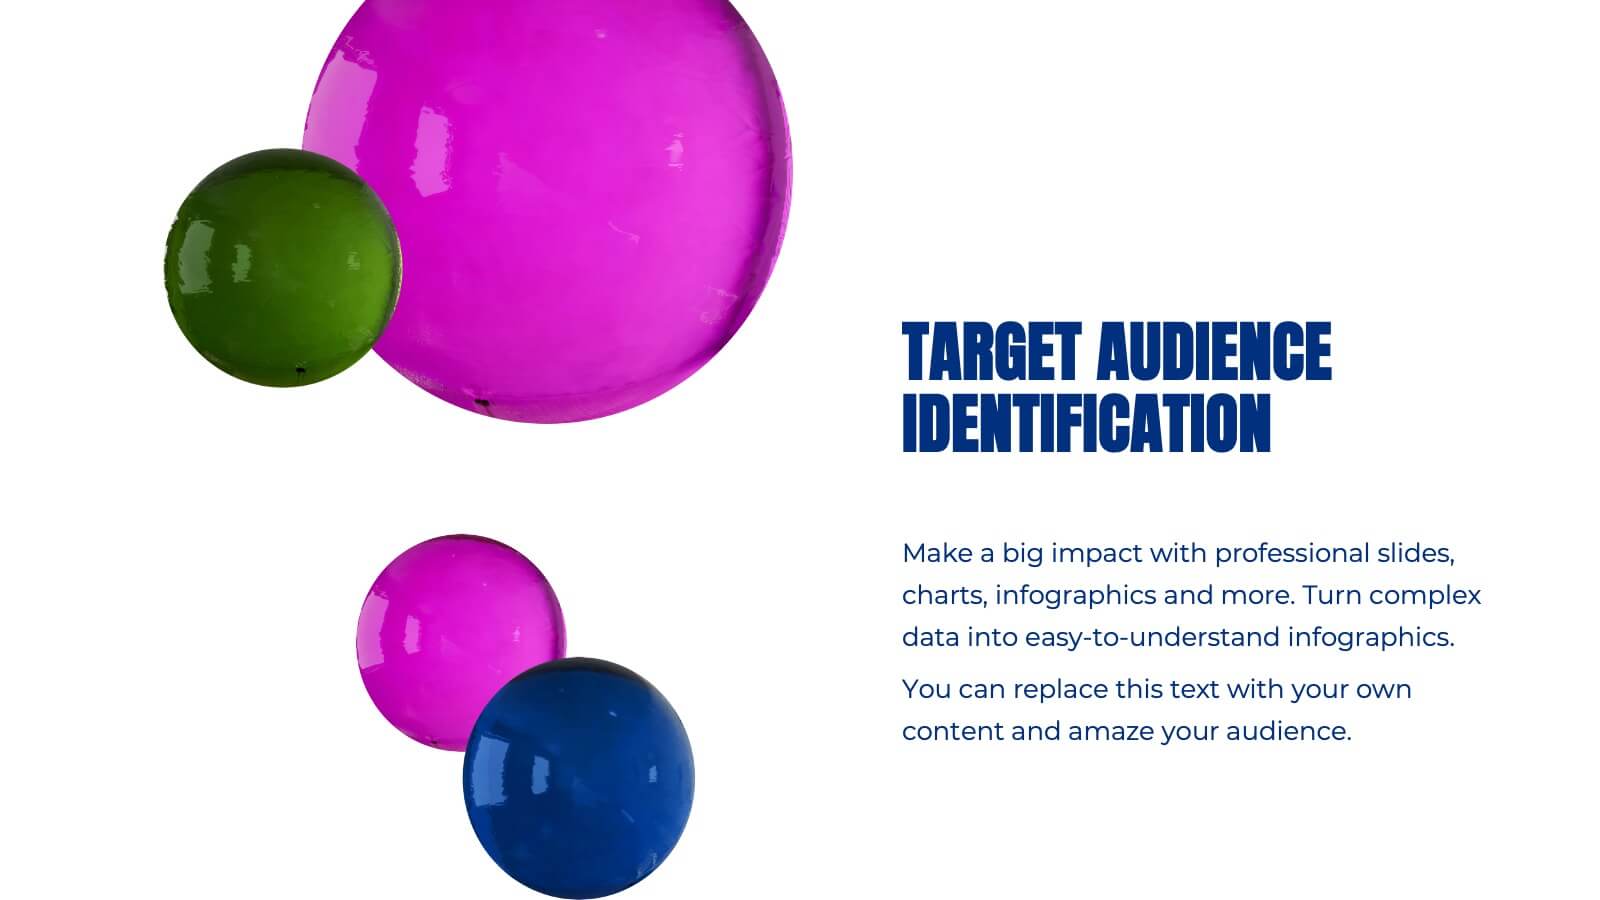
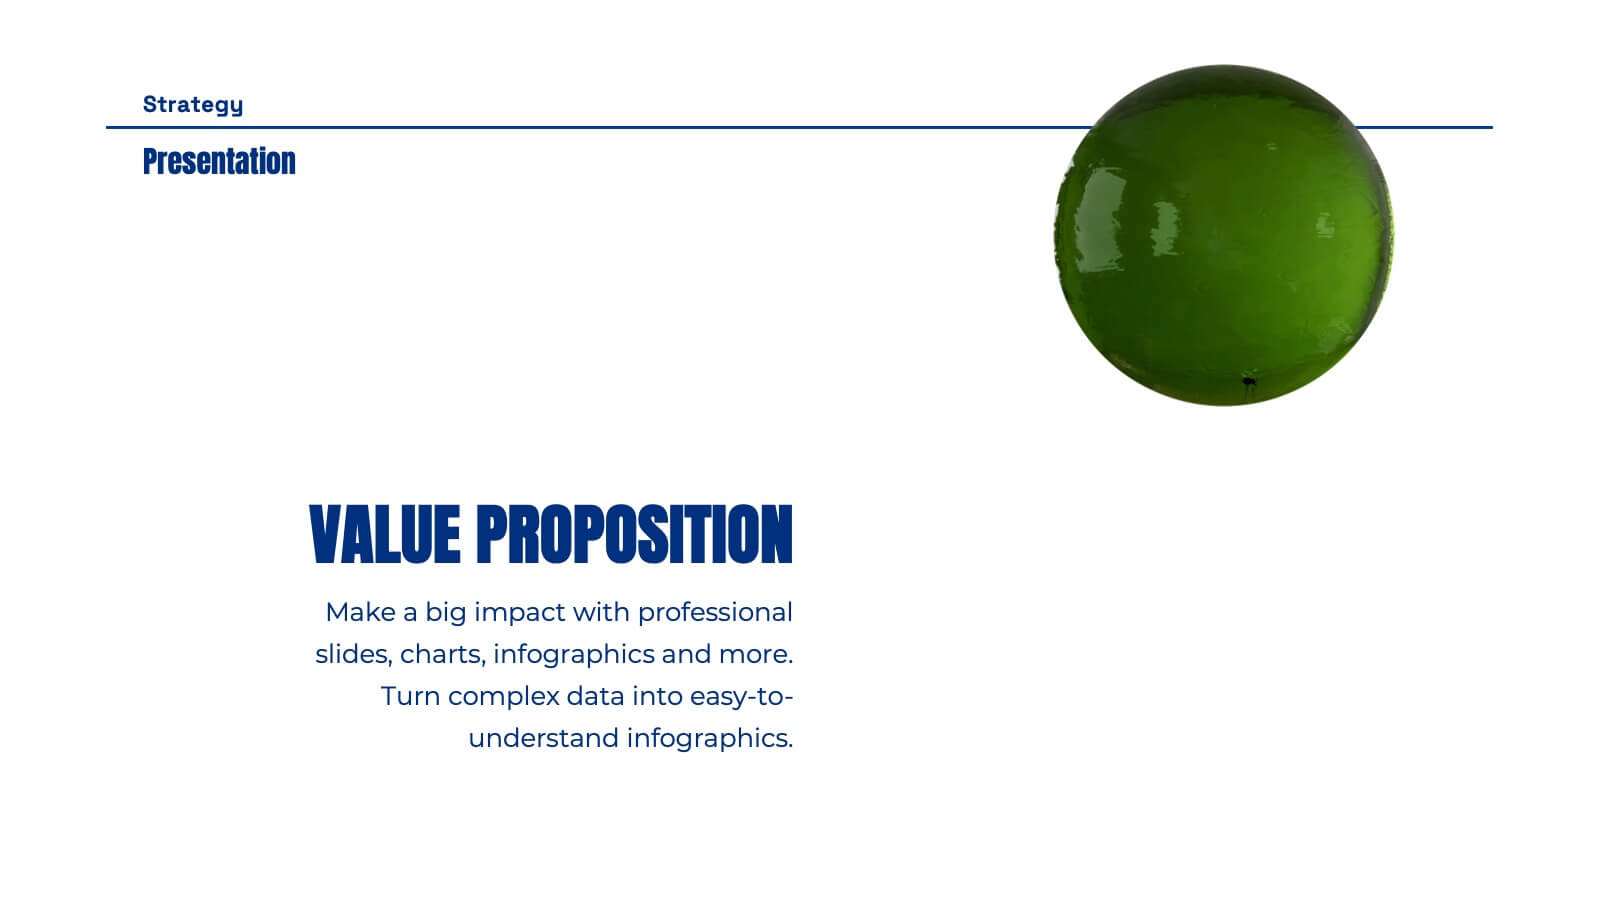
Ops Business Strategy Presentation
Set your strategy in motion with this dynamic, visually striking presentation template! Perfect for conveying key business insights like competitive analysis, market trends, and strategic objectives, it helps organize your plan for success. Each slide focuses on clarity and effectiveness, making it ideal for impactful presentations. Compatible with PowerPoint, Keynote, and Google Slides for effortless use across platforms.


6 slides
Hierarchical Thought Flow Mind Map Presentation
Present your ideas with clarity using this Hierarchical Thought Flow Mind Map presentation. Designed for structured thinking, this layout displays six key concepts radiating from a central theme, making it ideal for workflows, strategies, or team roles. Fully editable in Canva, PowerPoint, and Google Slides for total customization.


4 slides
RACI Matrix for Role Assignment Presentation
Simplify team roles and task ownership with this RACI Matrix for Role Assignment slide. Clearly map out who is Responsible, Accountable, Consulted, and Informed for each project task across team members. Ideal for project planning, team meetings, or stakeholder alignment. This structured matrix layout allows easy customization for names, tasks, and role indicators. Fully editable and compatible with PowerPoint, Keynote, and Google Slides.