


Features
- 6 Unique slides
- Fully editable and easy to edit in Microsoft Powerpoint, Keynote and Google Slides
- 16:9 widescreen layout
- Clean and professional designs
- Export to JPG, PDF or send by email


Do you have any questions?
Recommend


4 slides
Product Launch and Roadmap Milestones Presentation
Highlight every phase of your product journey with this Product Launch and Roadmap Milestones presentation. Designed with a winding roadmap layout and colorful milestone markers, this template is perfect for visualizing launch plans, key deliverables, and development stages. Fully editable in Canva, PowerPoint, and Google Slides for easy customization.
4 slides
Team Performance and Progress Tracker Presentation
Track momentum, highlight achievements, and visualize team success with this clean performance tracker layout. Featuring gauge meters and progress bars, this slide makes it easy to present productivity metrics, goal progress, or task completion at a glance. Fully editable and compatible with PowerPoint, Keynote, and Google Slides.


4 slides
Meet the Business Team Presentation
Ignite curiosity from the start with a clean, modern layout designed to introduce your team with clarity and confidence. This presentation highlights key roles, expertise, and contributions, helping audiences quickly understand who drives the work forward. Fully editable and easy to customize in PowerPoint, Keynote, and Google Slides.


6 slides
Simple TOC Layout for Deck Navigation Presentation
Guide your audience effortlessly with this Simple TOC Layout for Deck Navigation template. Featuring a clean, vertical flow with numbered icons and clear section markers, it’s ideal for organizing multi-part presentations. Fully customizable in Canva, PowerPoint, and Google Slides to match your brand colors and ensure professional, seamless navigation.


2 slides
Bold and Minimal Opening Presentation Layout
Make your first slide speak volumes with this bold yet minimal opening layout. Designed to grab attention while keeping things simple, this template helps you introduce your presentation with clarity and confidence. Great for modern business decks, it’s fully customizable and works seamlessly in PowerPoint, Keynote, and Google Slides.


6 slides
Social Comparison Infographics
The "Social Comparison" infographic template is a thought-provoking and detailed tool, expertly crafted for PowerPoint, Keynote, and Google Slides. This template is particularly useful for psychologists, sociologists, and educators who wish to explore and present the concept of social comparison, its impacts on individual behavior, and its role in society. This template delves into the various dimensions of social comparison, including upward and downward comparisons, the influence on self-esteem, and the effects on social cohesion. It's structured to provide a nuanced understanding of how individuals assess themselves relative to others, making it a valuable resource for educational seminars, psychological workshops, or social research presentations. The design is both engaging and reflective, with a color scheme that is subtle yet impactful. This ensures the presentation is not only visually appealing but also resonates with the complex and multifaceted nature of social comparison. Whether used in academic settings, counseling sessions, or social research meetings, this template ensures that the intricacies of "Social Comparison" are presented in a clear, insightful, and visually compelling manner.


21 slides
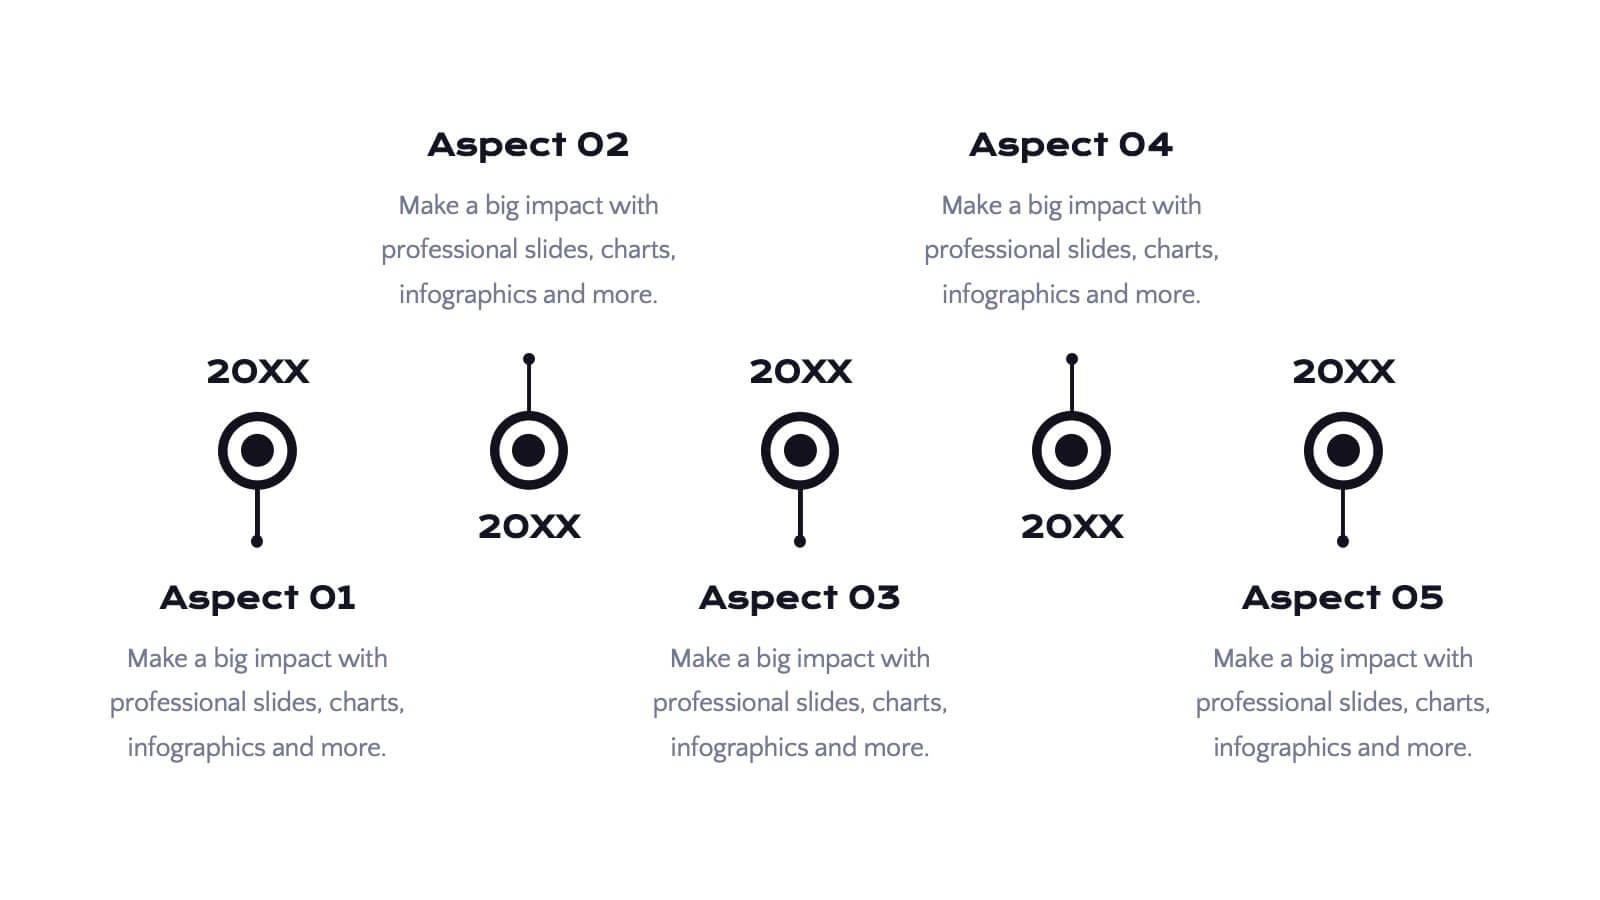
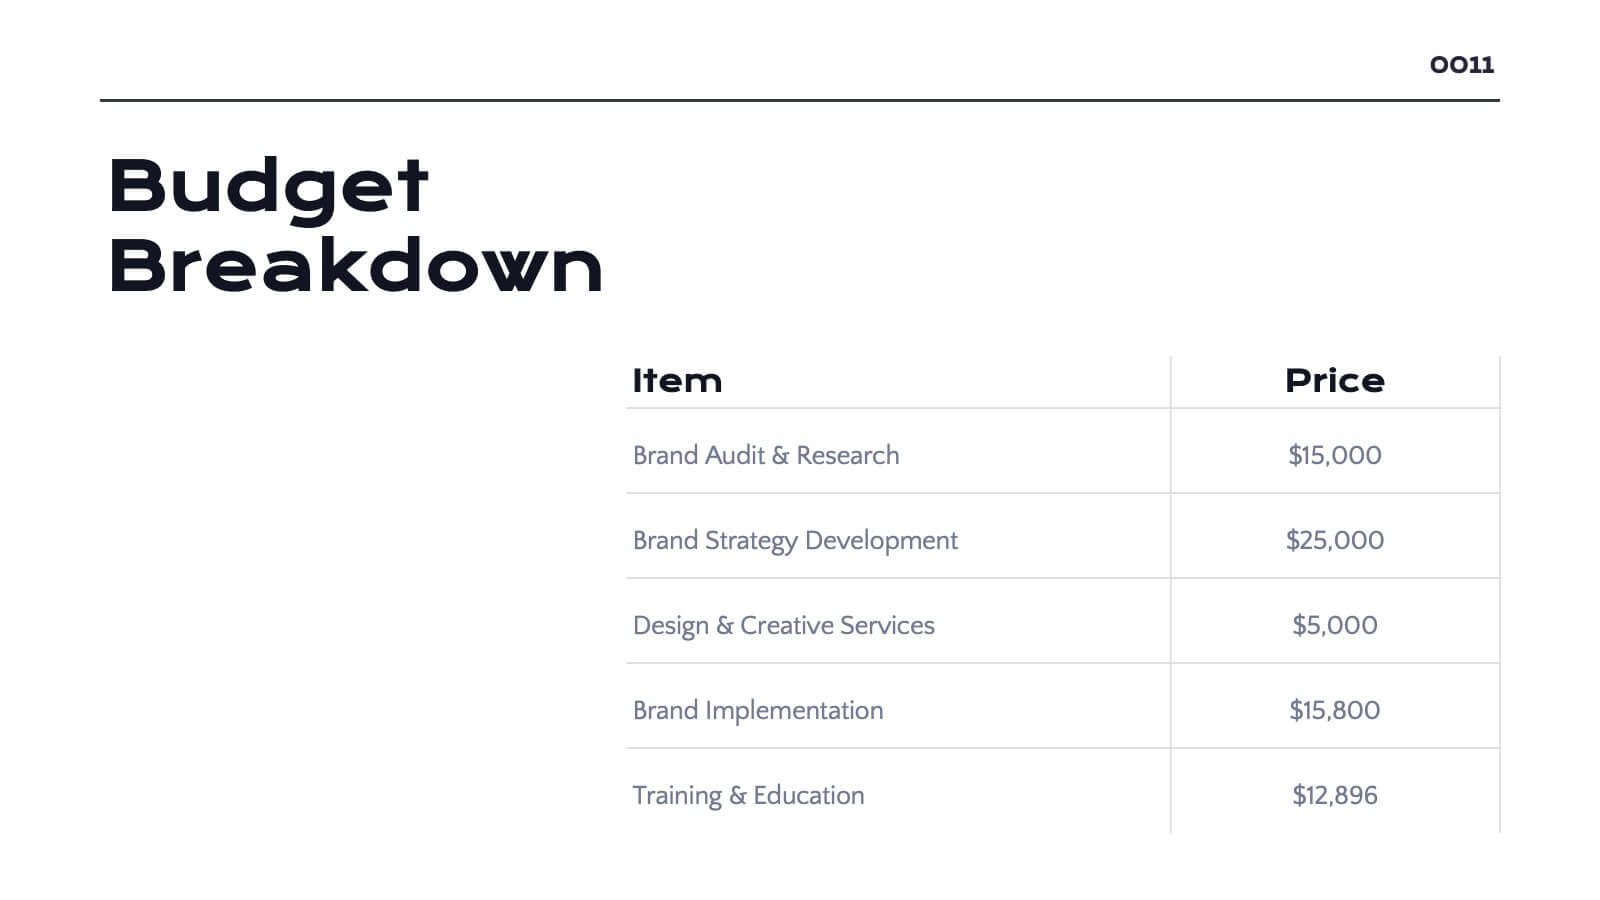
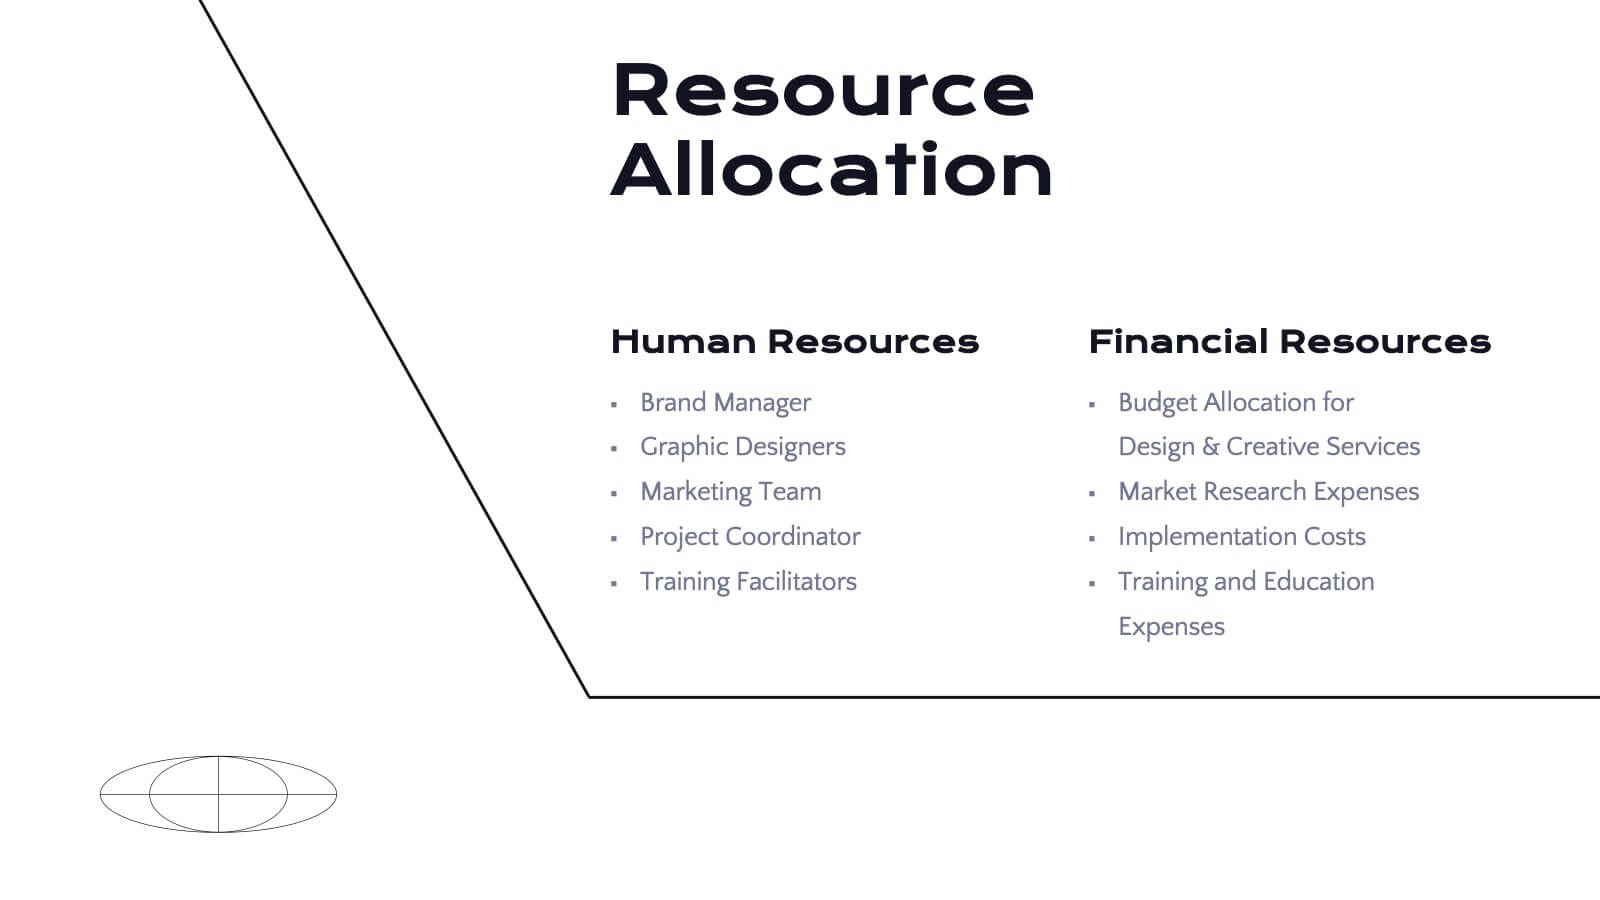
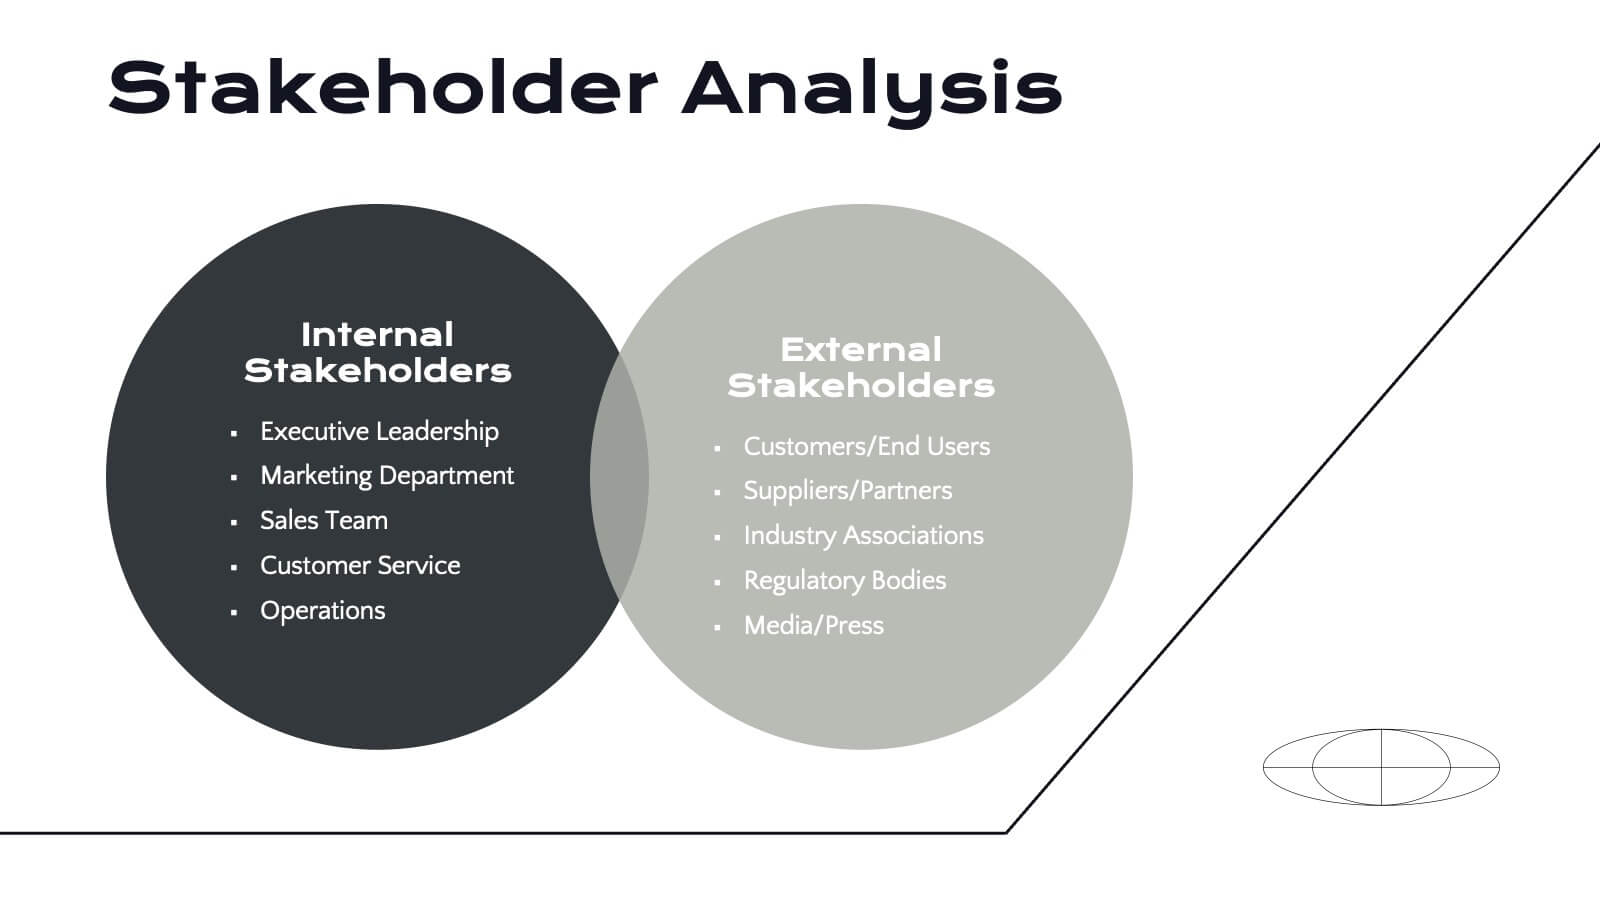
Radiance Detailed Project Execution Plan Presentation
Elevate your project execution presentations with this sleek template, covering everything from objectives to timelines and budget breakdowns. It's perfect for aligning your team and stakeholders. Compatible with PowerPoint, Keynote, and Google Slides, it ensures professionalism and clarity in showcasing your project plans.


6 slides
Africa Population Map Infographics
Discover the flexibility of our Africa Population Map infographic template, a dynamic tool for illustrating population distribution across the African continent. This template is compatible with widely used presentation software like PowerPoint, Keynote, and Google Slides, allowing you to effortlessly customize it according to your specific requirements. The Africa Population Map infographic template provides a solid foundation for visualizing population data, highlighting densely populated areas, urban centers, and demographic trends. Whether you're an educator, researcher, or simply curious about Africa's demographics, this template offers a user-friendly platform to create engaging presentations and informative materials. Impress your audience with this SEO-optimized Africa Population Map infographic template, thoughtfully designed for clarity and ease of use. Tailor it to showcase population variations, growth patterns, and regional insights, making it a valuable asset for your projects and presentations. Start crafting your personalized infographic today!


7 slides
Cyber Security Consultant Infographic
Dive into the realm of cyber safety with our cyber security consultant infographic. With a color palette that reflects the technological and serious nature of the domain – blue for trust and black for professionalism – this infographic is a representation of the role and responsibilities of a cyber security consultant. The design employs sleek icons that symbolize various cyber security elements. Ideal for IT professionals, and institutions providing training on cyber security. Compatible with PowerPoint, Keynote, and Google Slides, it promises versatility and ease of use. This ensures that the complex world of cyber security is made accessible.


6 slides
Iceberg Visualization Business Concept Presentation
Make your message stand out with a bold visual that reveals what lies above and below the surface. This presentation uses a clear iceberg structure to help explain business concepts, hidden insights, and layered ideas with ease. Perfect for strategy, planning, and analysis. Compatible with PowerPoint, Keynote, and Google Slides.


6 slides
Human Anatomy Silhouette Infographic Presentation
Visualize key medical concepts with the Human Anatomy Silhouette Infographic Template. This professional and informative design highlights different body areas with labeled sections for easy understanding. Ideal for medical, healthcare, and educational presentations. Fully customizable and compatible with PowerPoint, Keynote, and Google Slides.


5 slides
Big Data Interpretation and Metrics Presentation
Break down complex data into digestible segments with the Big Data Interpretation and Metrics Presentation. Featuring a puzzle-inspired layout, this template is ideal for illustrating interconnected data points, analytics strategies, or metric-based frameworks. Fully customizable in PowerPoint, Keynote, and Google Slides.


20 slides
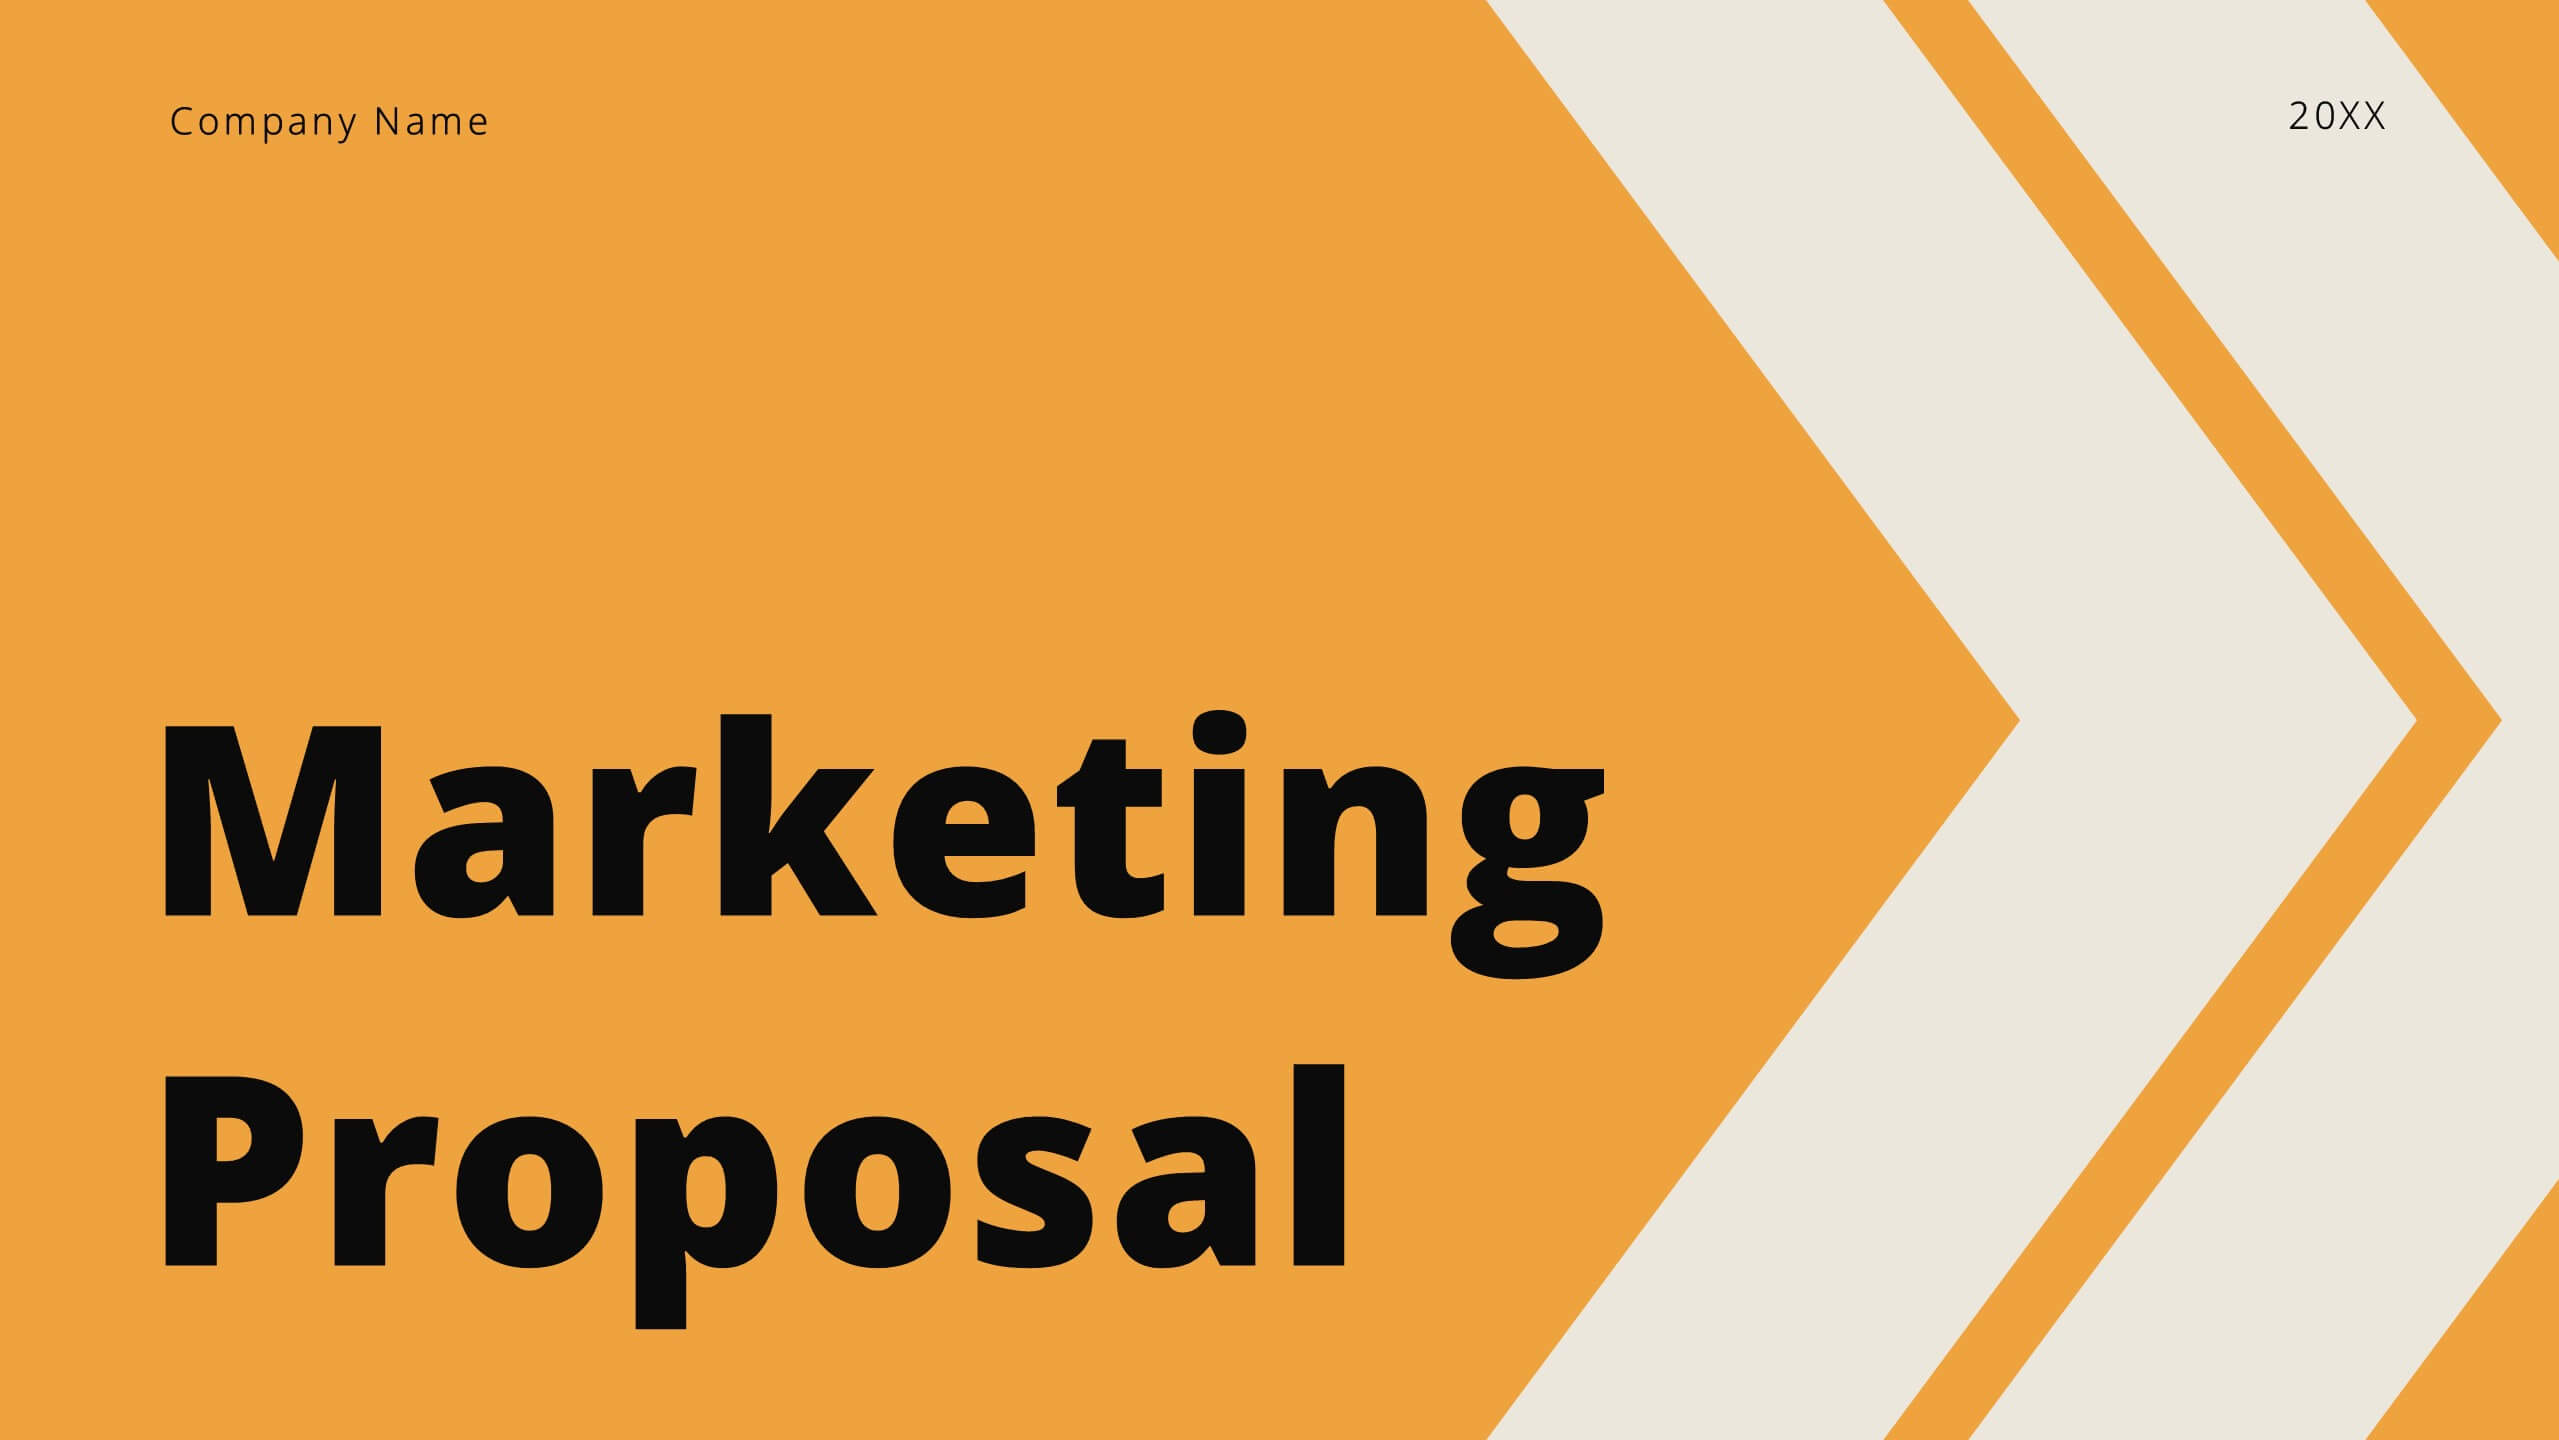
Nexisphere Marketing Proposal Presentation
Showcase your marketing plan with this proposal deck, featuring sections on consumer analysis, digital trends, influencer strategies, and SEO insights. Ideal for presenting a comprehensive marketing approach, it’s compatible with PowerPoint, Keynote, and Google Slides, offering flexibility for engaging presentations tailored to any audience.


21 slides
Design Creative Concept Presentation
Enhance your creative presentations with this Creative Concept template. It features slides for objectives, color palettes, typography options, and prototyping steps. Ideal for designers and creative teams, this template supports PowerPoint, Keynote, and Google Slides, facilitating a comprehensive and engaging presentation of creative projects.


26 slides
Cassanra Presentation Template
Cassanra is a bold, professional template with a retro look. Its ravishing, modern aesthetic will stand out and grab your attention, while detailed design elements keep it readable. Packed with features like charts, timelines, and easy to edit text blocks, Cassanra is perfect for businesses as well as personal use. A mixture of bold colors are used to help keep the look appealing and easy to read. This template comes with a large amount of features from charts, timelines and an easy to edit text this template is perfect for businesses seeking to make an impression on their audience.


6 slides
Network Security Infographics
Strengthen your understanding of Network Security with our customizable infographic template. This template is fully compatible with popular presentation software like PowerPoint, Keynote, and Google Slides, allowing you to easily customize it to illustrate and communicate various aspects of network security. The Network Security infographic template offers a visually engaging platform to explore and explain the importance of protecting digital information, securing networks, and preventing cyber threats. Whether you're an IT professional, business owner, or simply interested in cybersecurity, this template provides a user-friendly canvas to create informative presentations and educational materials. Enhance your knowledge of Network Security with this SEO-optimized infographic template, thoughtfully designed for clarity and ease of use. Customize it to highlight key concepts, security measures, best practices, and the evolving landscape of cybersecurity, ensuring that your audience gains valuable insights into this critical field. Start crafting your personalized infographic today to fortify your understanding of Network Security.


2 slides
App Interface Device Preview Presentation
Display your mobile app design with this sleek interface preview layout. Centered around a realistic smartphone mockup, this template includes four surrounding sections for text or key features. Ideal for pitch decks or product demos, it's fully editable in PowerPoint, Keynote, or Google Slides to match your brand.