


Características


¿Tienes alguna pregunta?
Recomendar


5 diapositivas
Interlocking Puzzle Infographic Presentation
Visually connect ideas with the Interlocking Puzzle Infographic. This design is perfect for illustrating processes, relationships, and key concepts that fit together seamlessly. Whether you're presenting business strategies, project workflows, or educational content, this template enhances clarity and engagement. Fully customizable and compatible with PowerPoint, Keynote, and Google Slides.


7 diapositivas
Cyber Security Consultant Infographic
Dive into the realm of cyber safety with our cyber security consultant infographic. With a color palette that reflects the technological and serious nature of the domain – blue for trust and black for professionalism – this infographic is a representation of the role and responsibilities of a cyber security consultant. The design employs sleek icons that symbolize various cyber security elements. Ideal for IT professionals, and institutions providing training on cyber security. Compatible with PowerPoint, Keynote, and Google Slides, it promises versatility and ease of use. This ensures that the complex world of cyber security is made accessible.


6 diapositivas
Marketing Customer Profile Infographics
Our Marketing Customer Profile infographic is a strategic tool crafted for use in Powerpoint, Keynote, and Google Slides. It is ideal for marketers, sales teams, and business strategists looking to present a comprehensive view of customer demographics, preferences, and behaviors. This infographic is designed to segment and illustrate various aspects of customer profiles, helping to paint a detailed picture of target markets. It includes elements such as age range, gender distribution, income levels, purchasing habits, and preferred communication channels, among others. The layout is structured to guide the audience through the data in a logical sequence, ensuring a thorough understanding of the customer base. Incorporating this infographic into your marketing presentations will empower your team to tailor strategies that resonate with your audience, backed by data-driven insights. Whether you’re crafting personalized marketing campaigns, developing new products, or exploring new market opportunities, this infographic will serve as an essential visual aid to support your objectives. Use it to bring clarity and focus to discussions about your customer profiles and market segmentation strategies.


5 diapositivas
Internal Communication Flow Chart Presentation
Visualize key communication channels within your organization using this internal communication flow chart. With a clean radial layout, this template helps you illustrate how information travels between departments or roles. Ideal for HR teams, managers, or consultants. Fully editable in Canva, PowerPoint, and Google Slides for seamless customization.


23 diapositivas
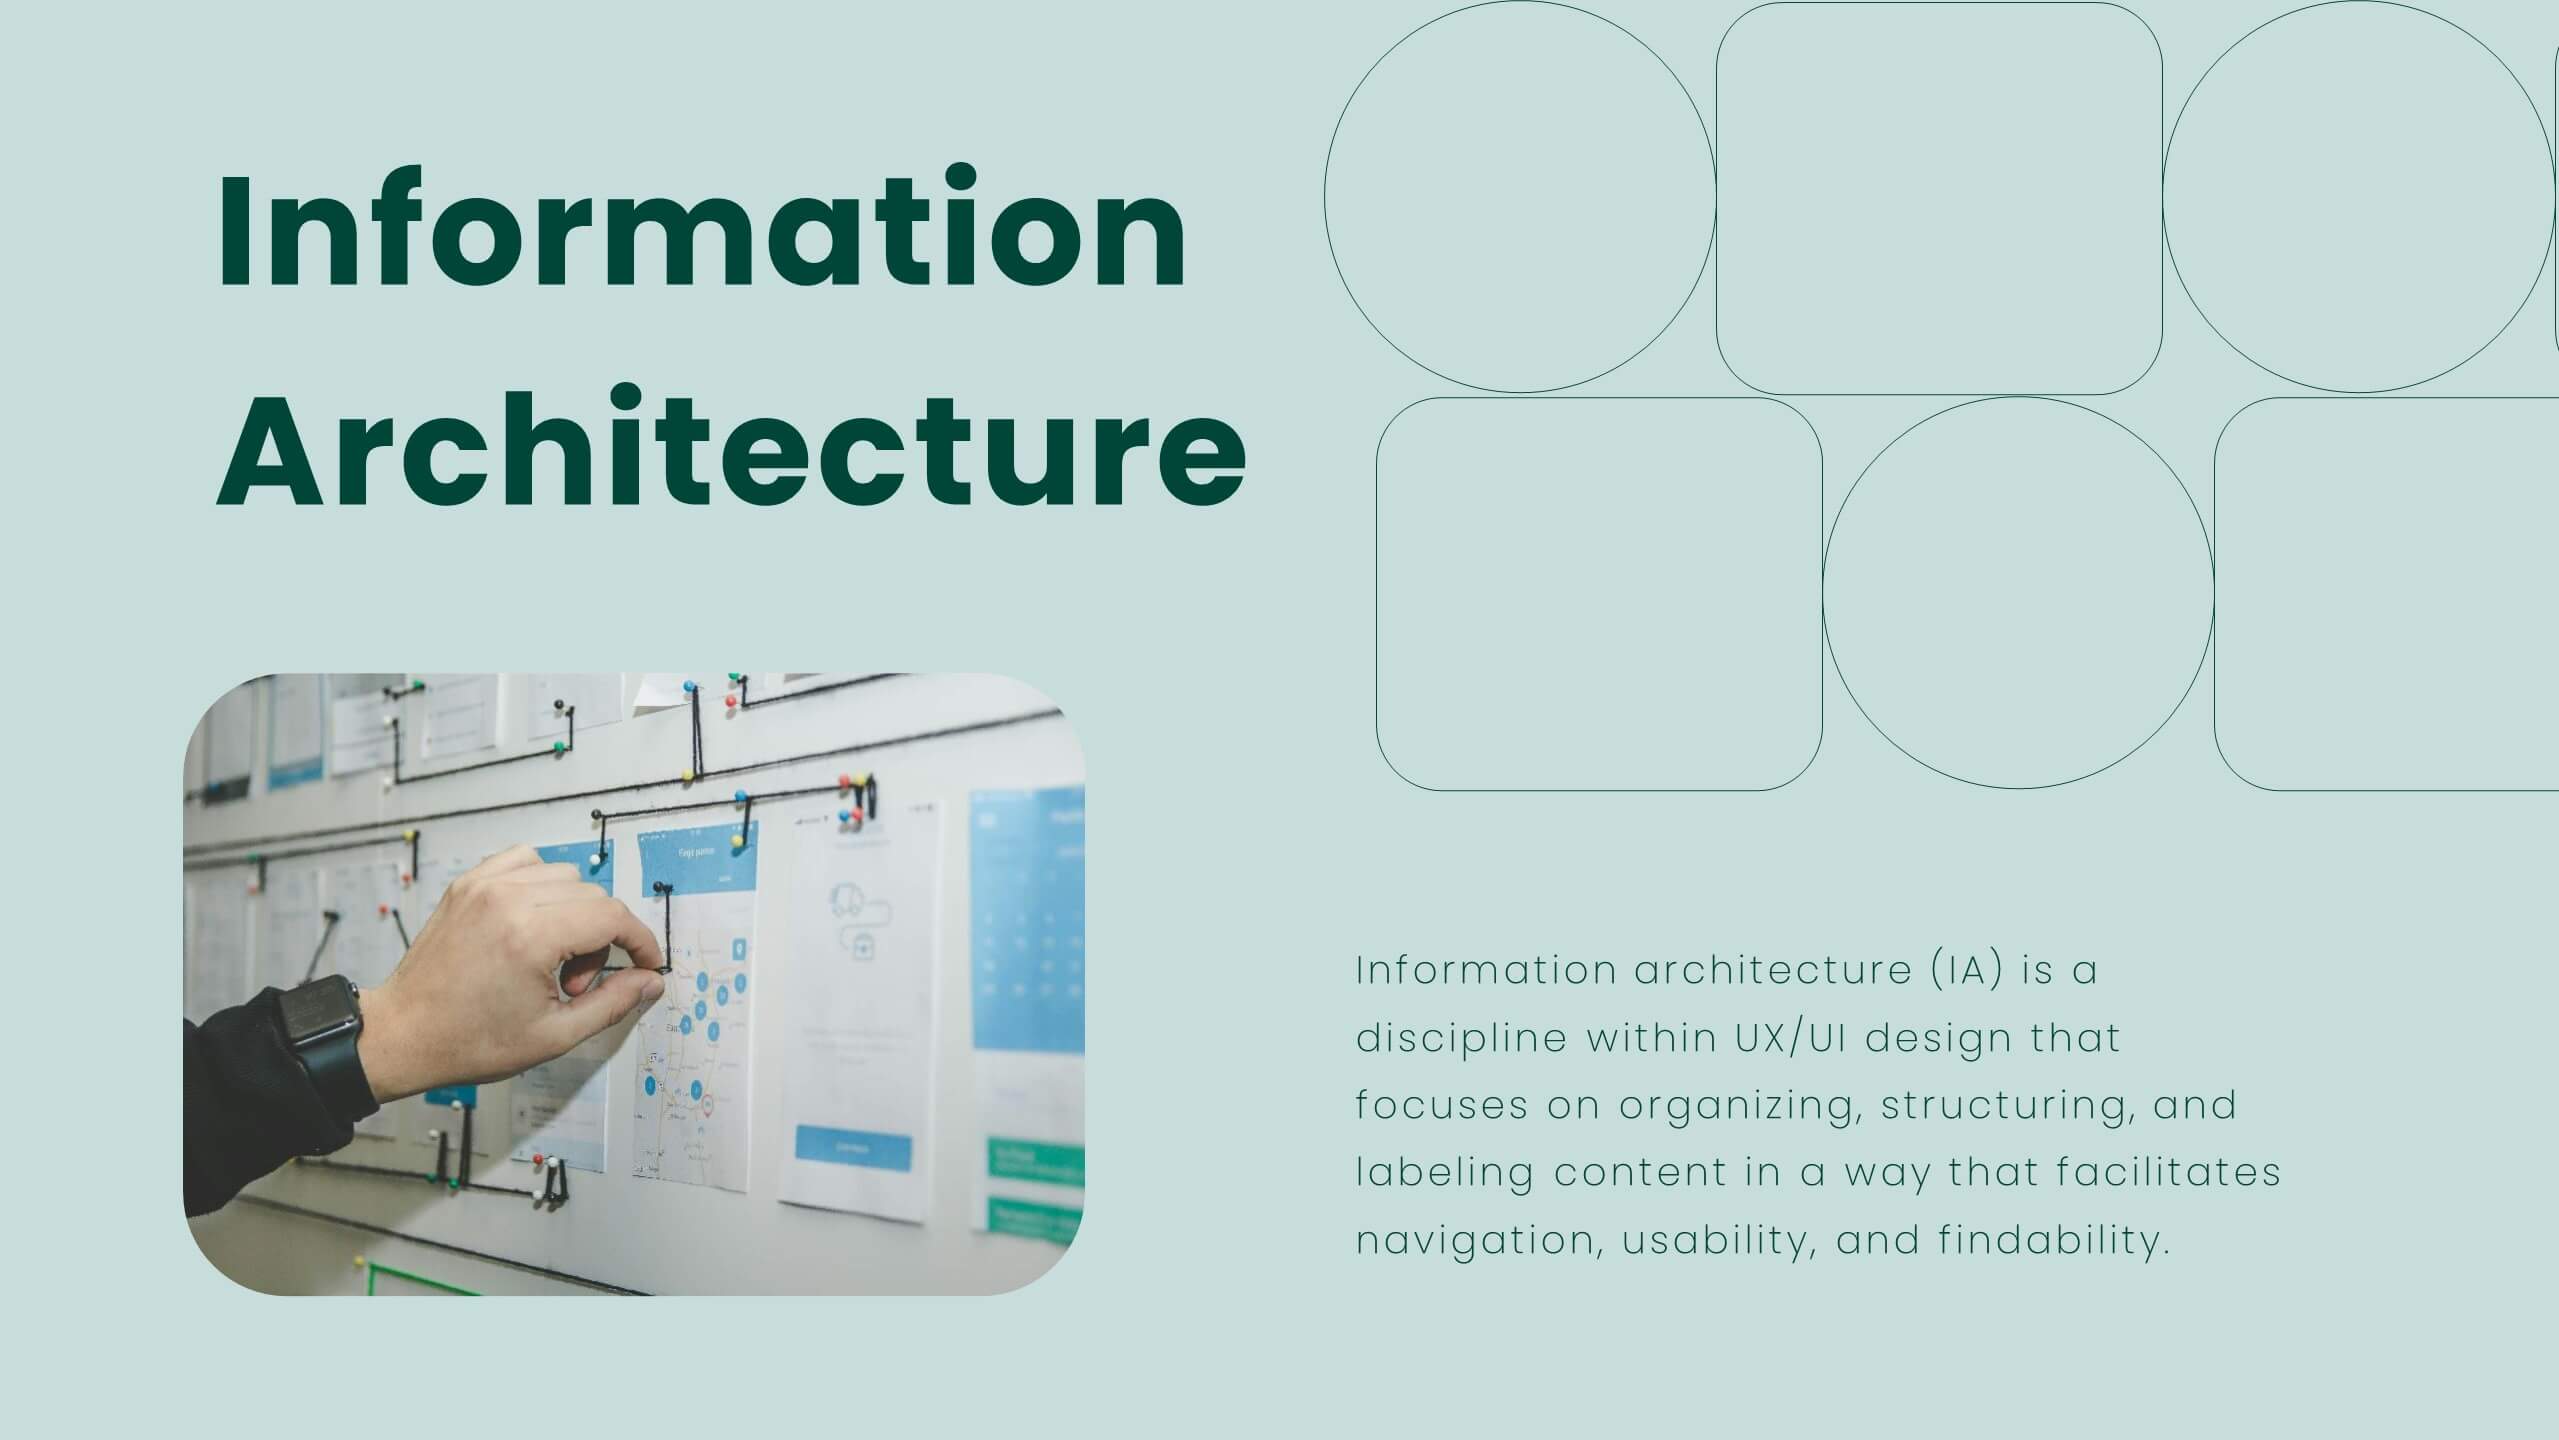
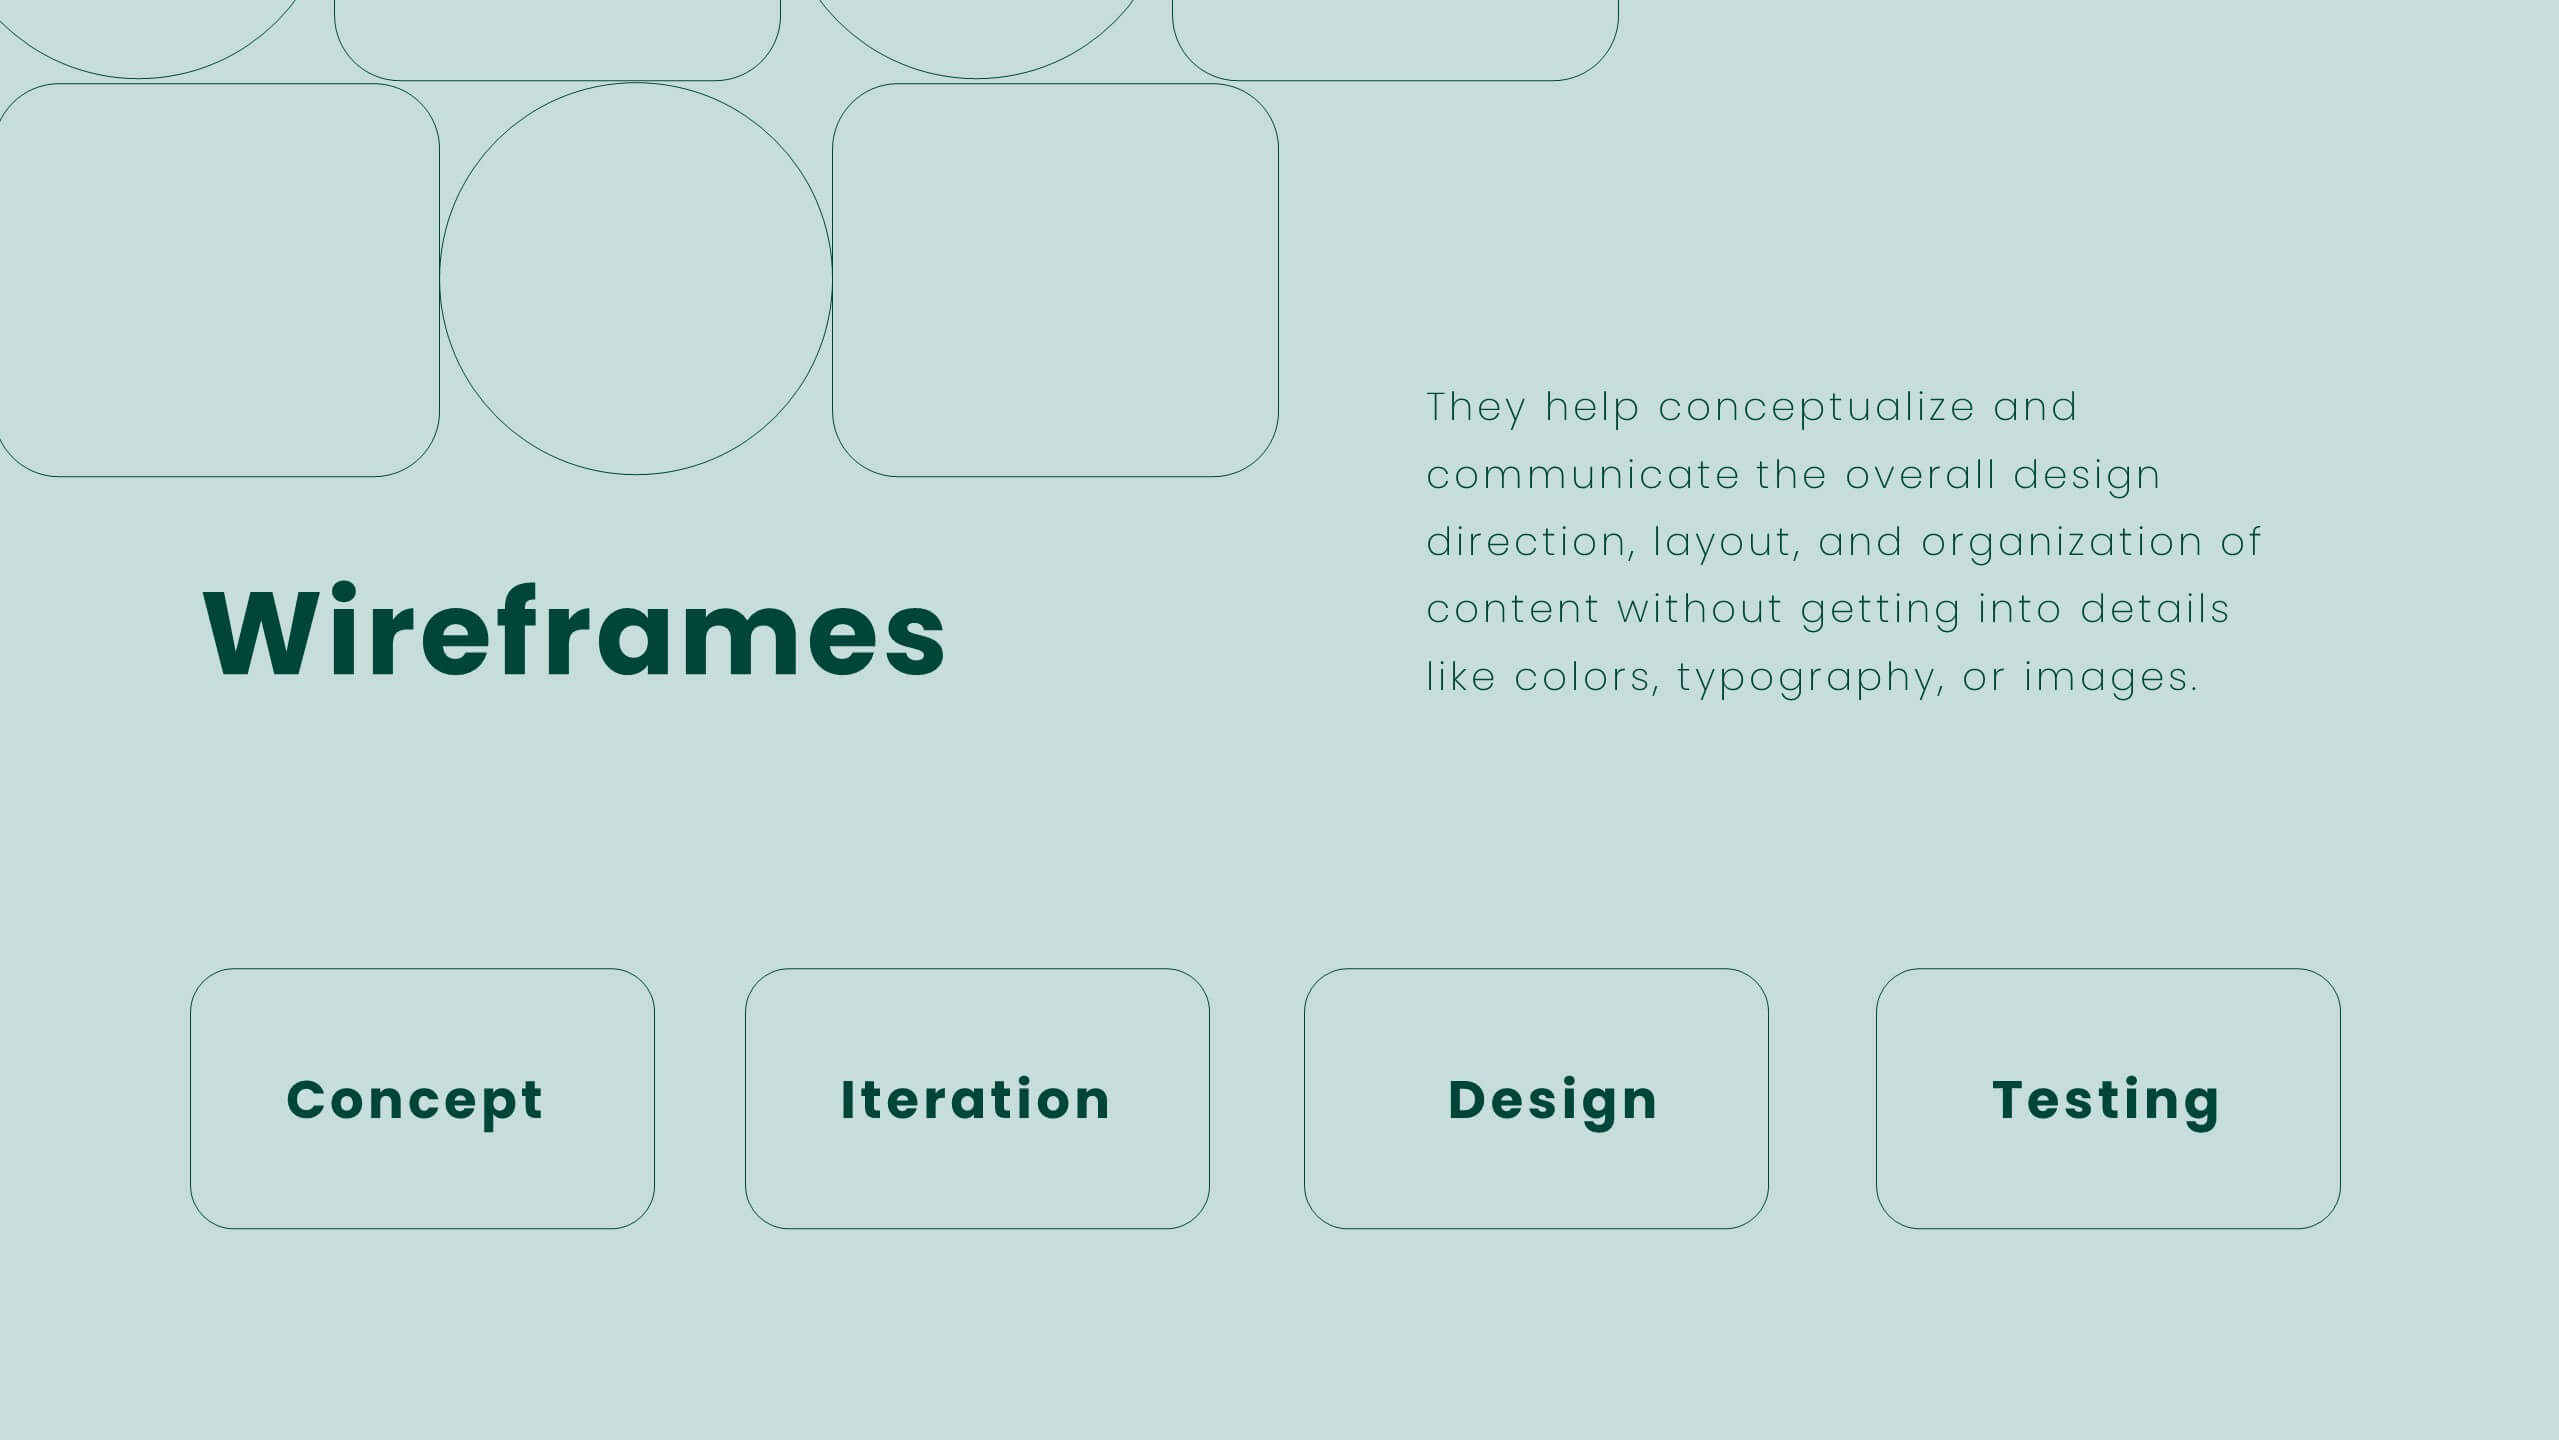
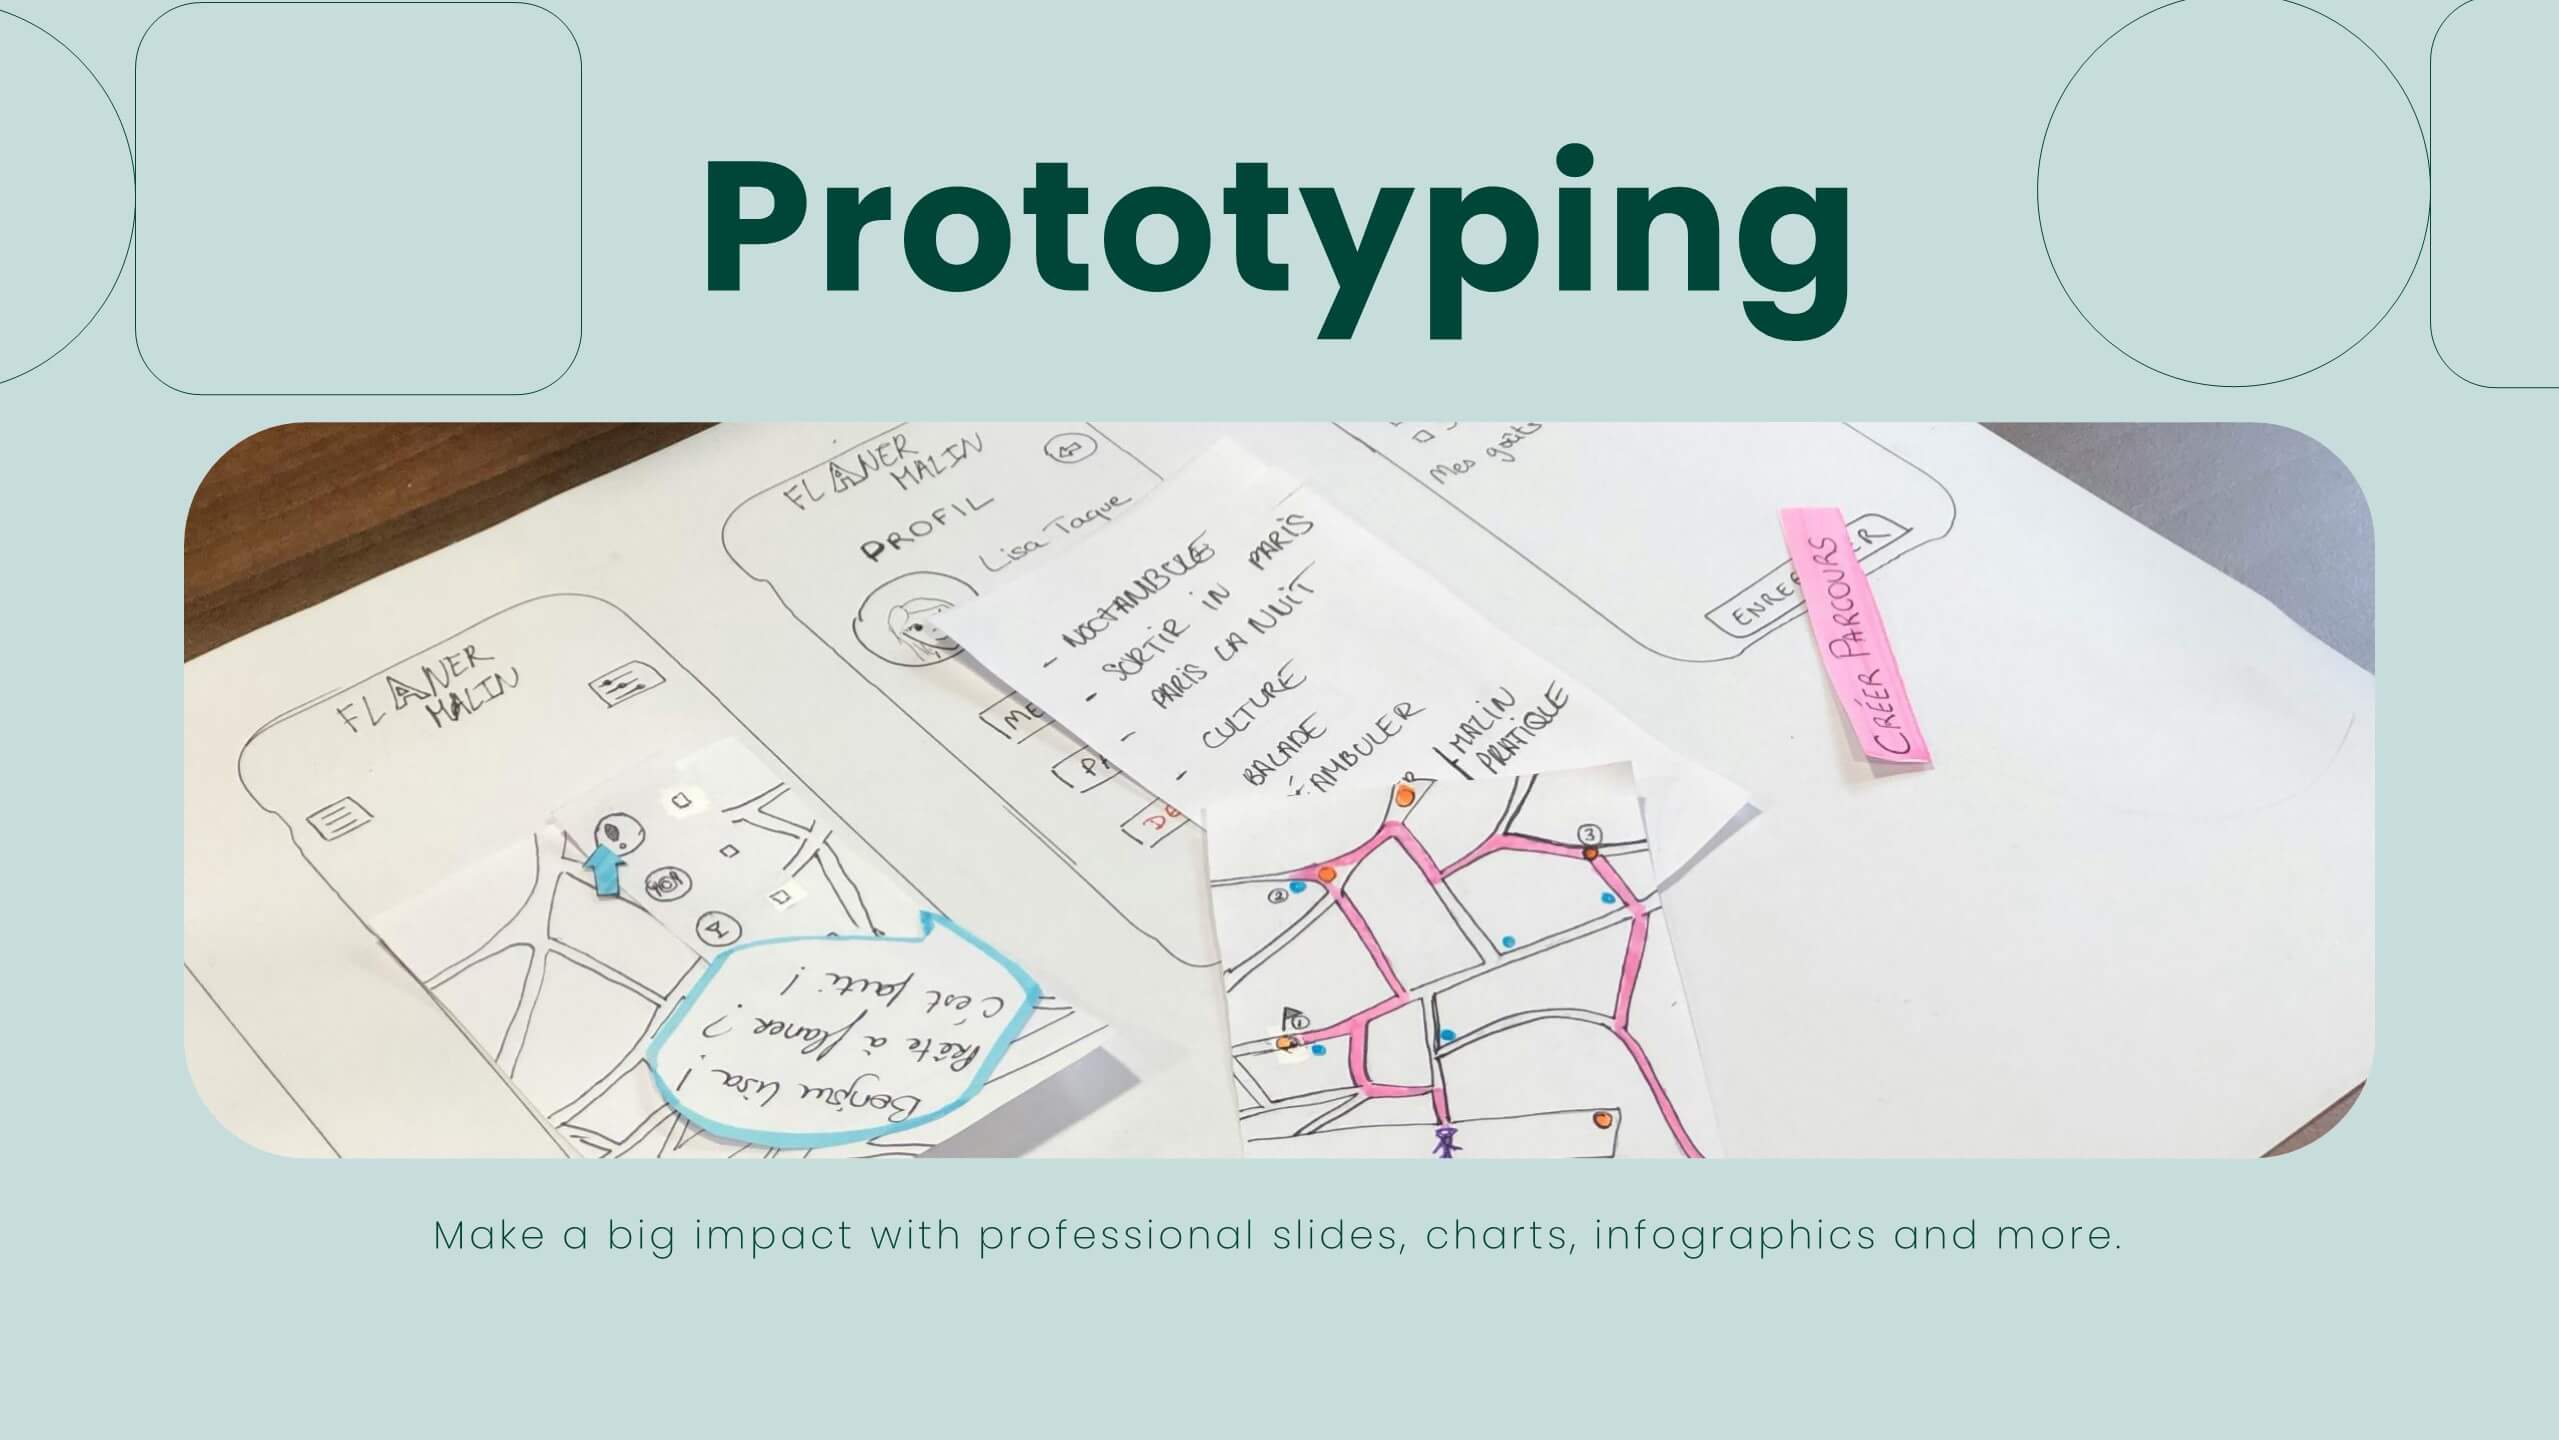
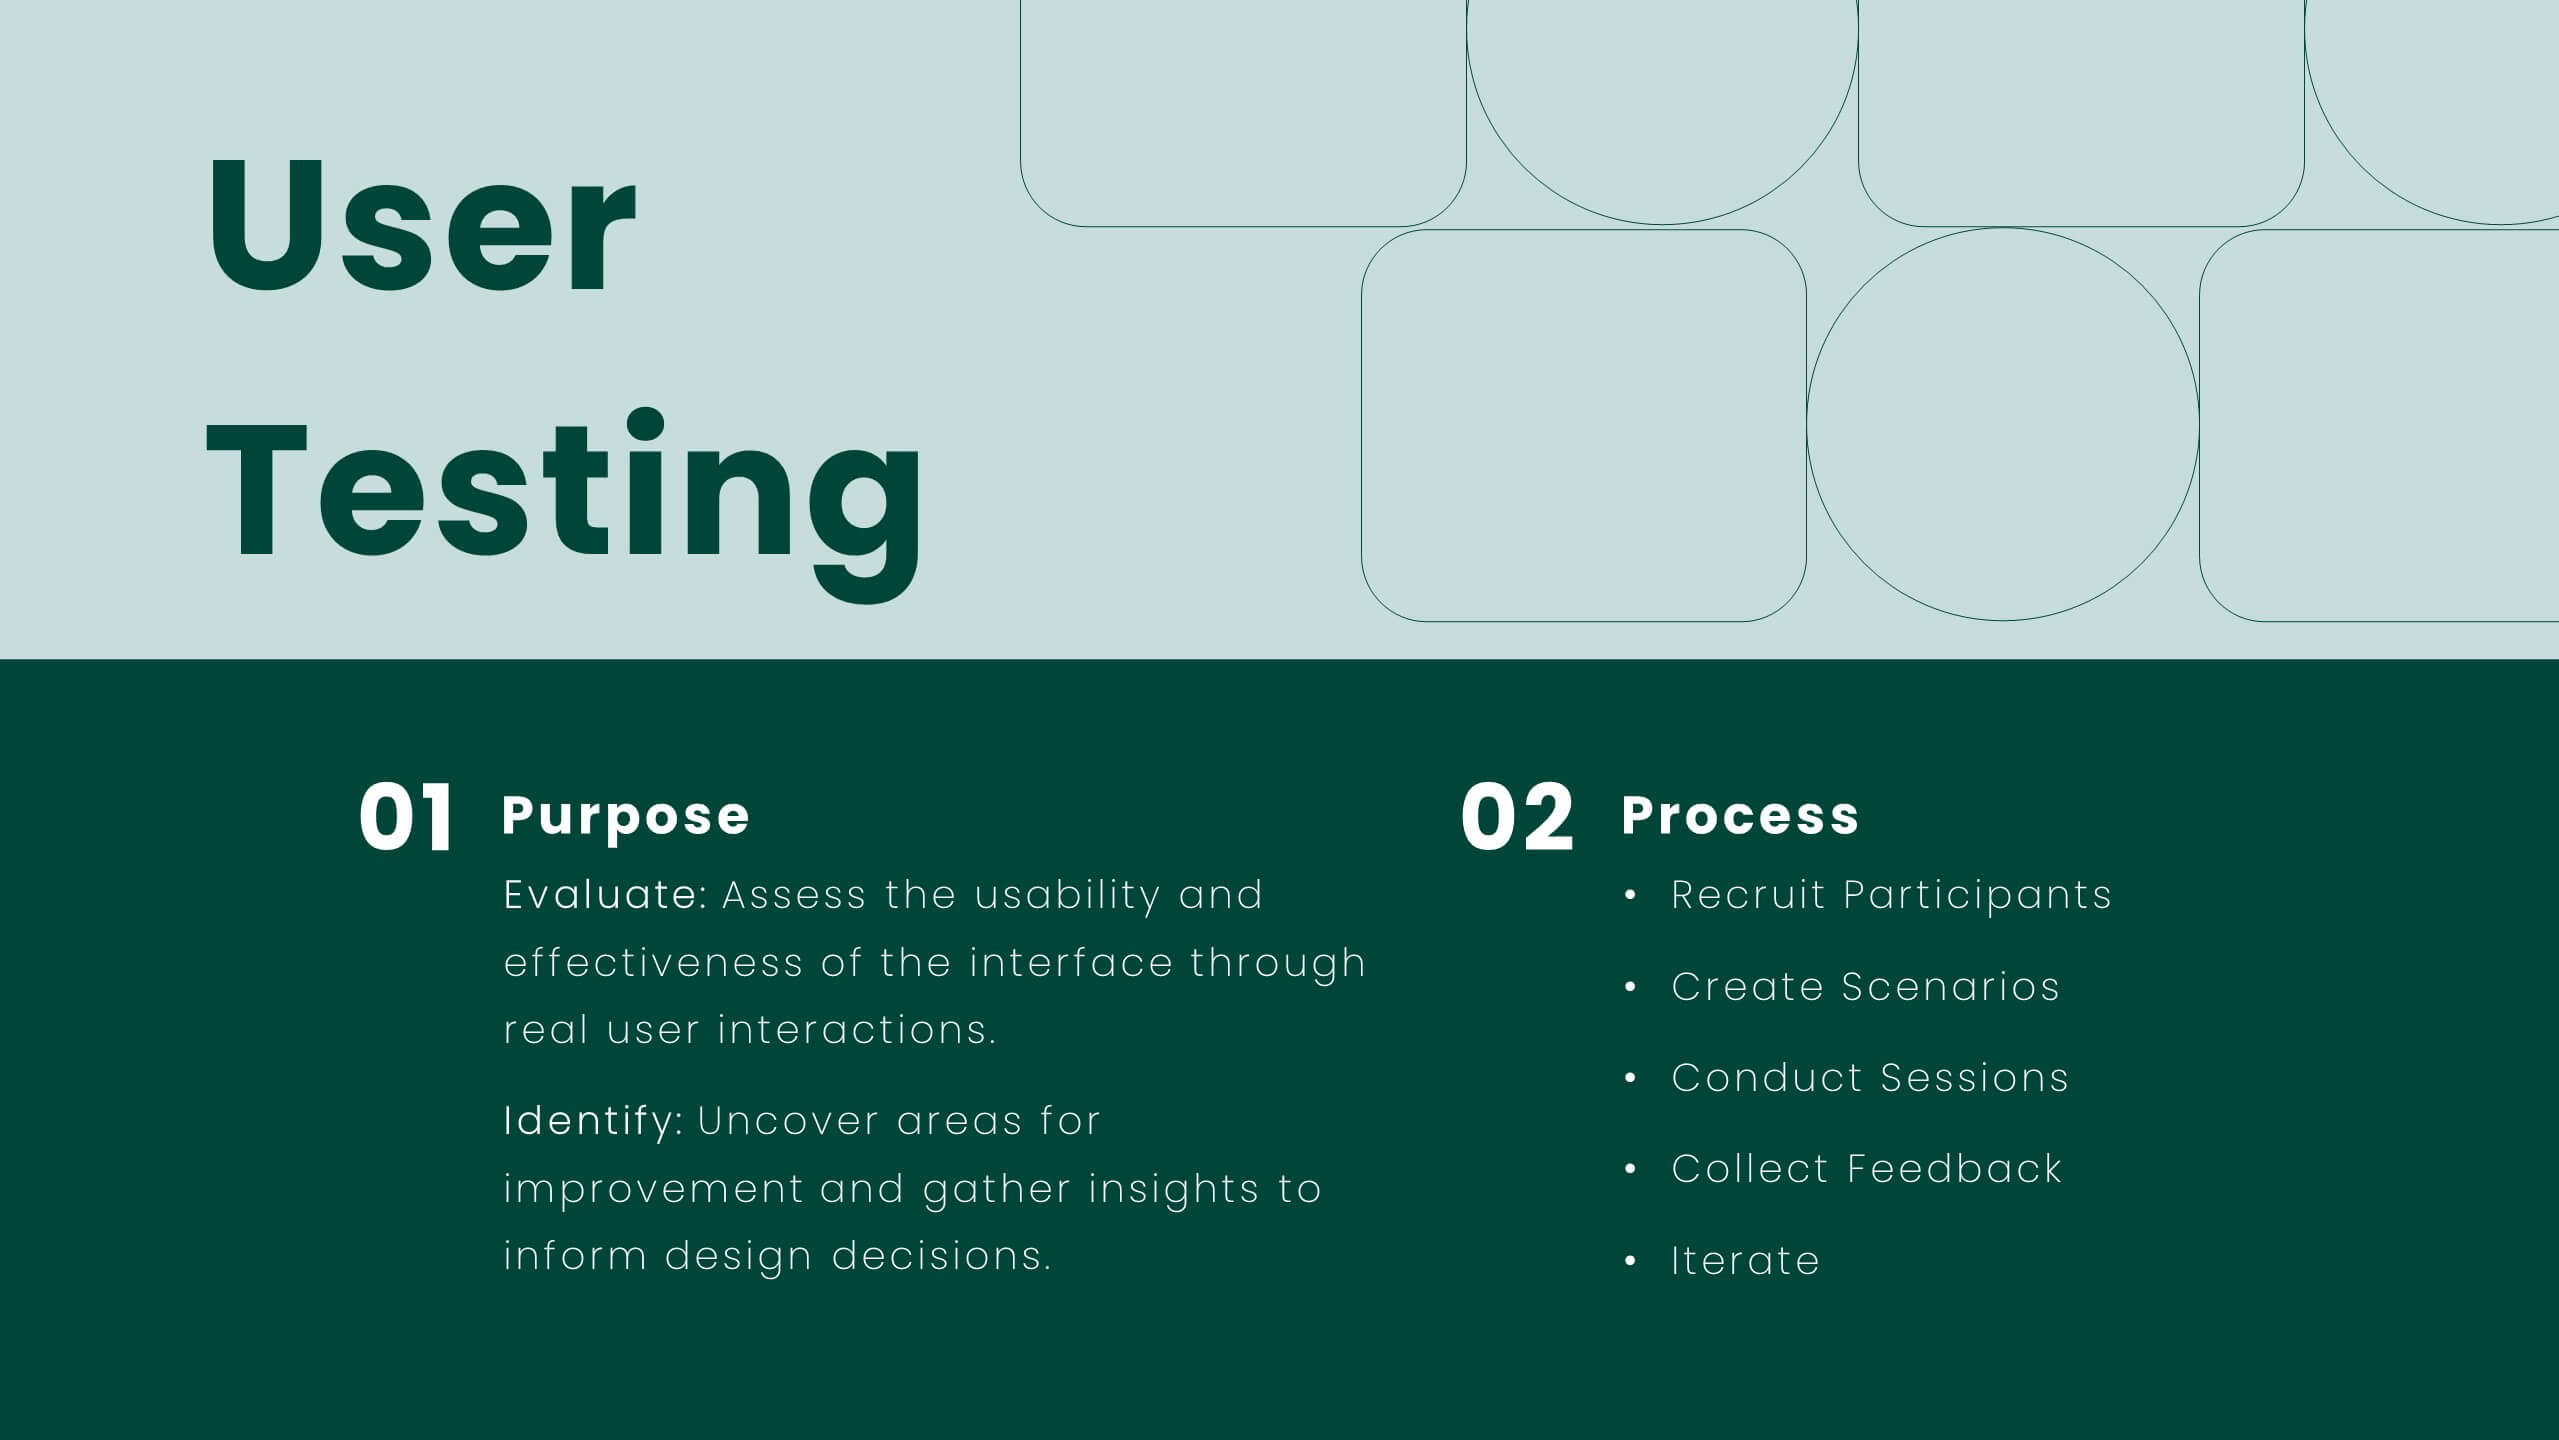
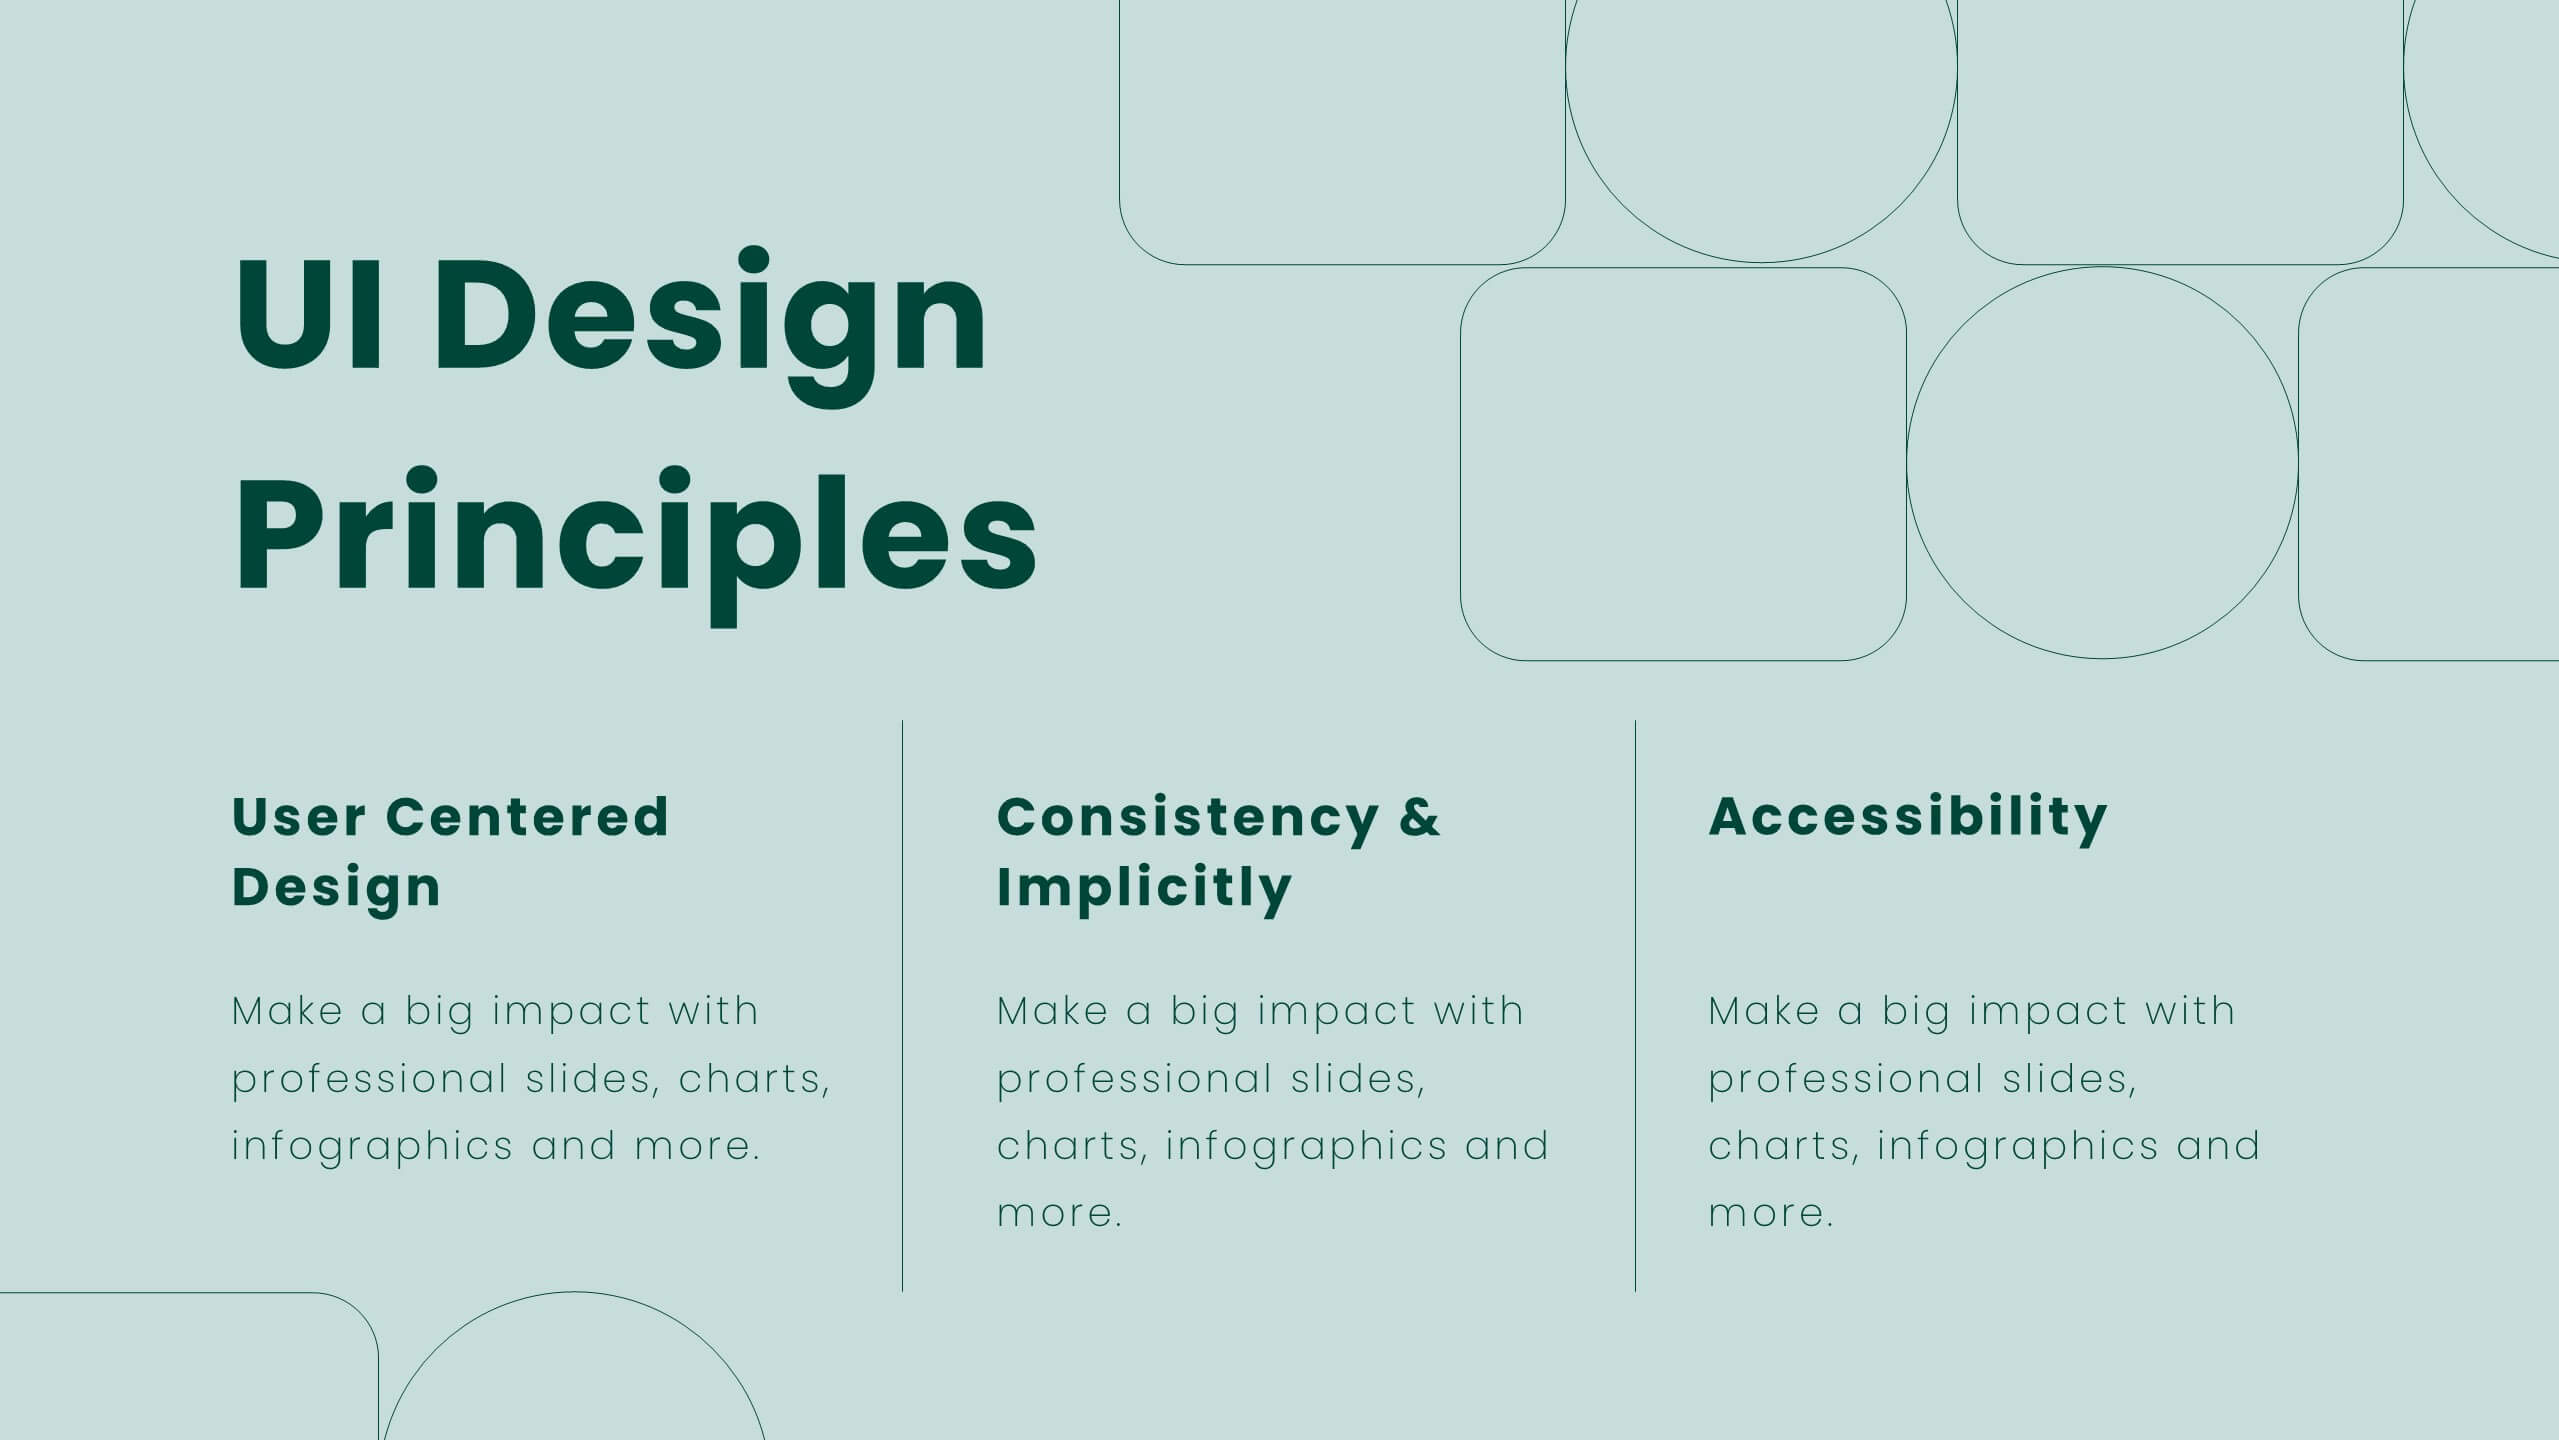
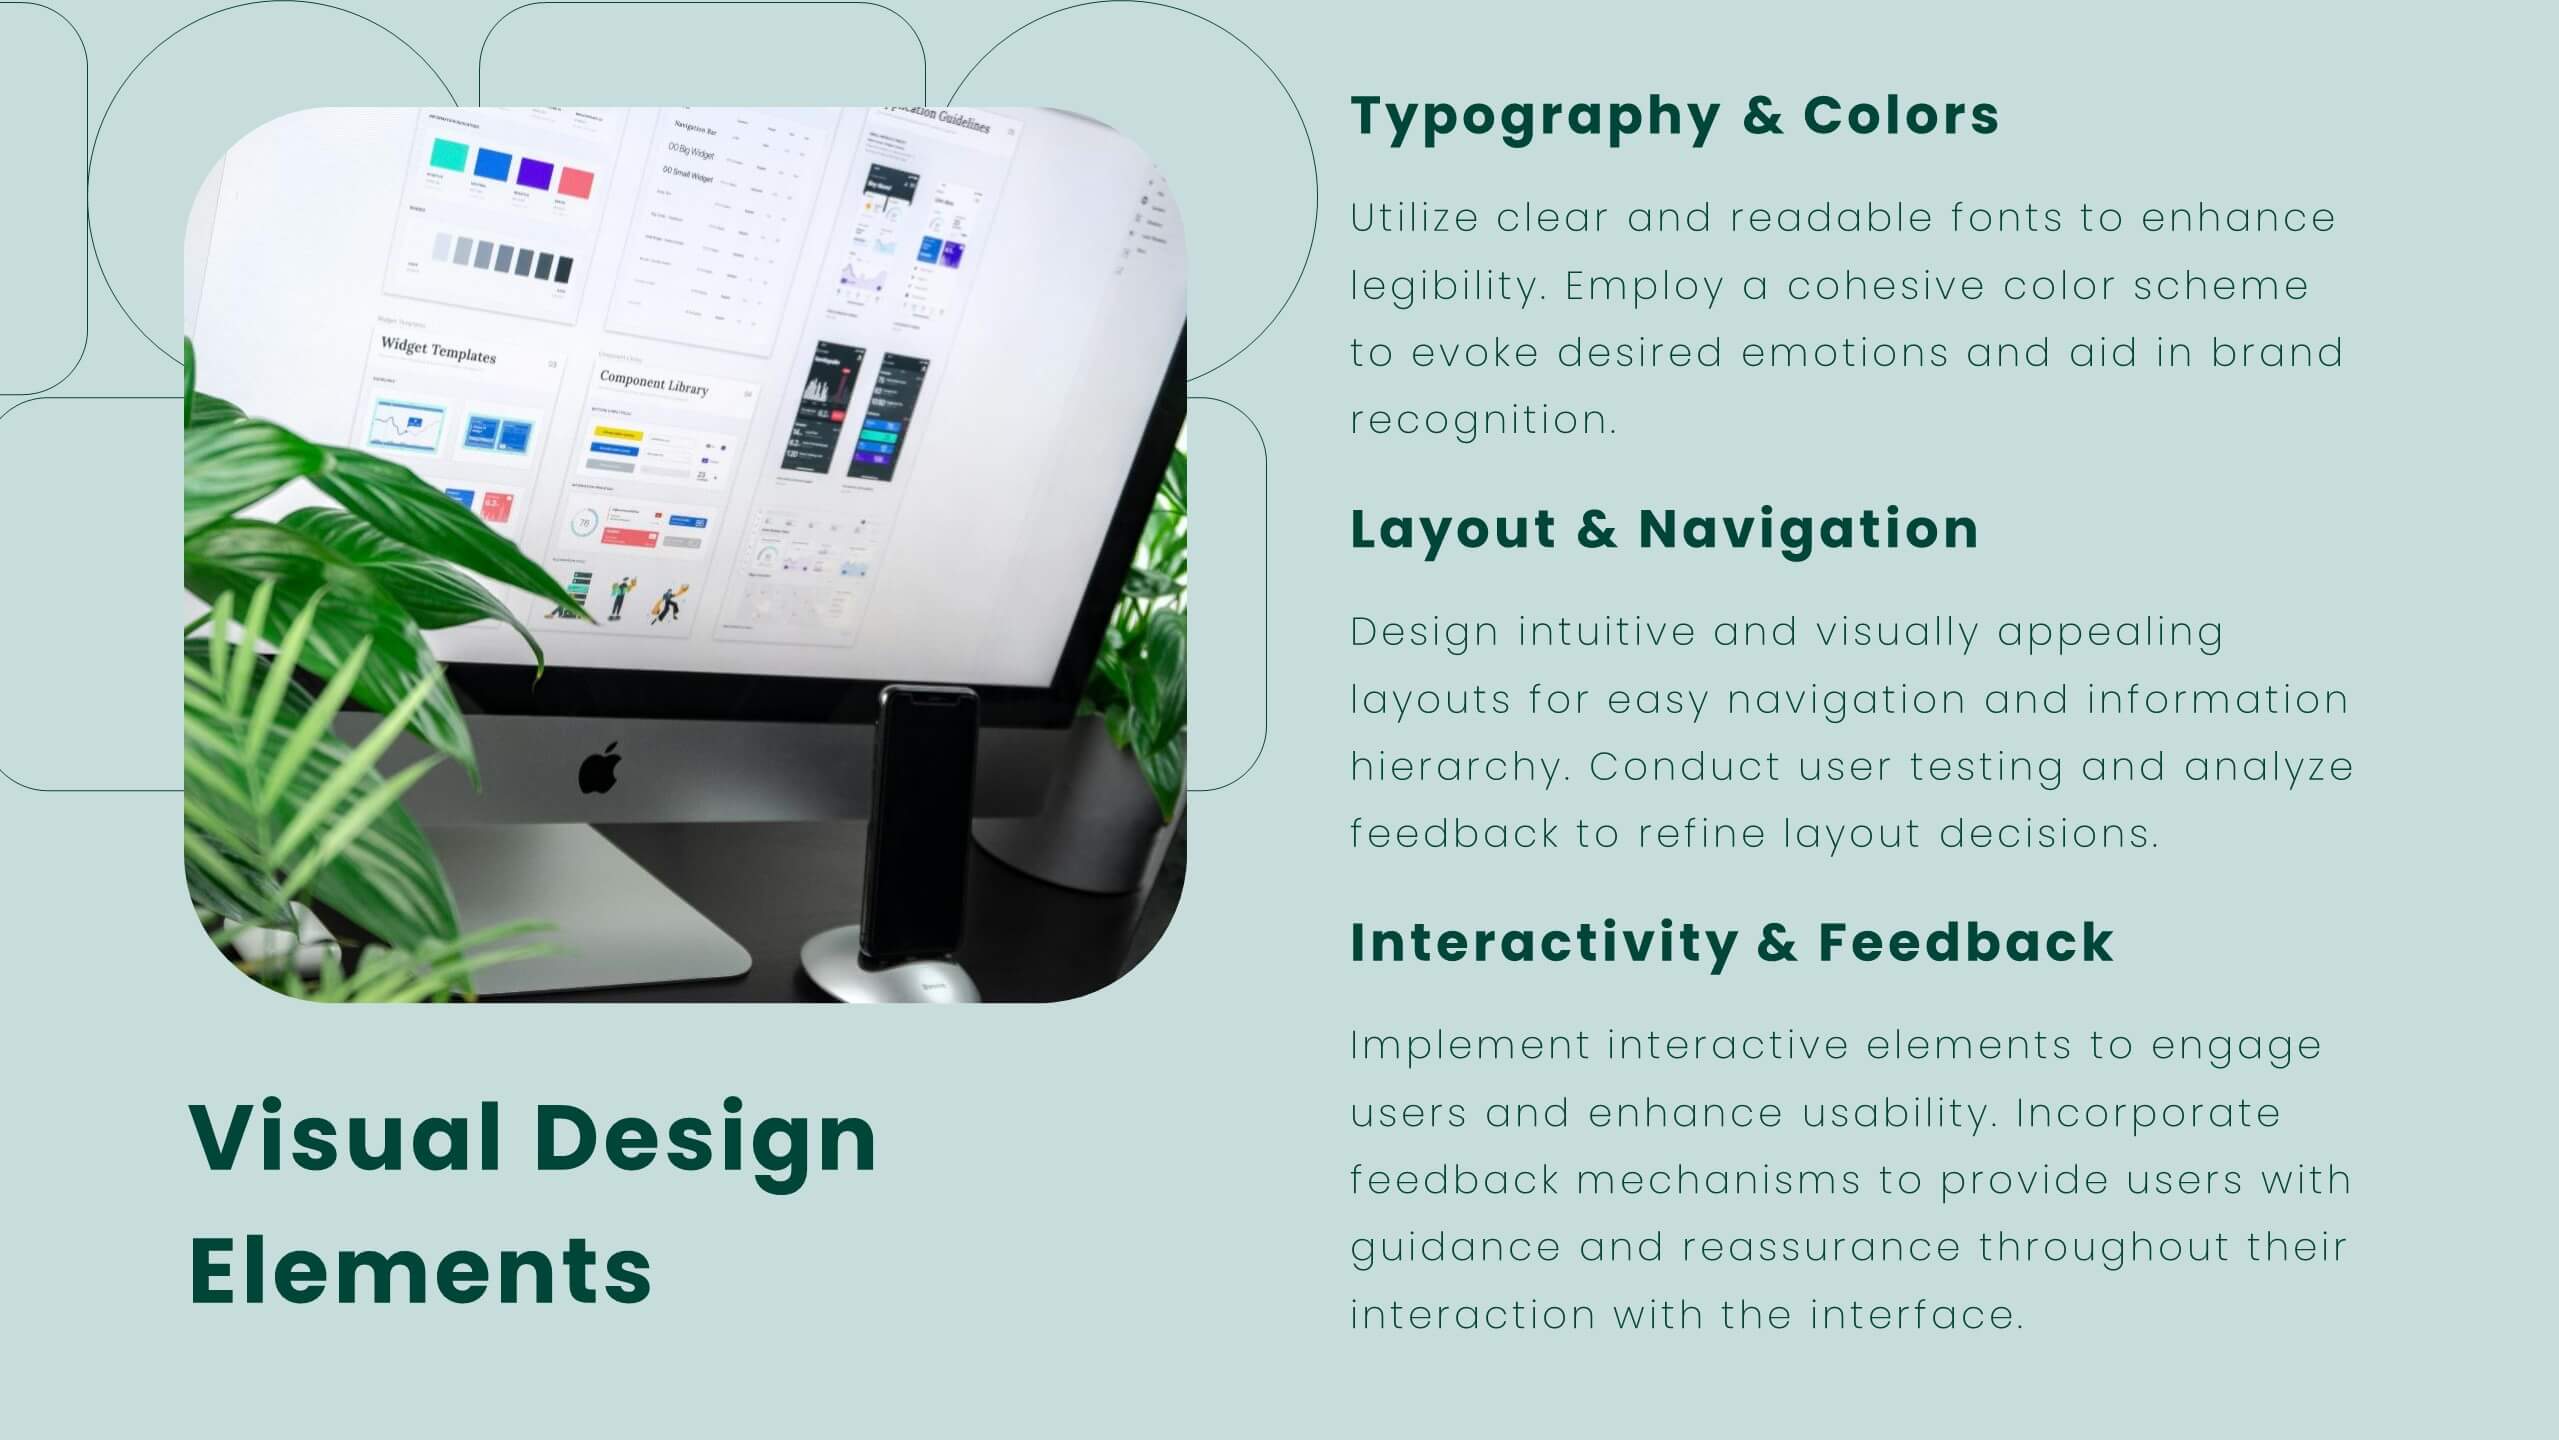
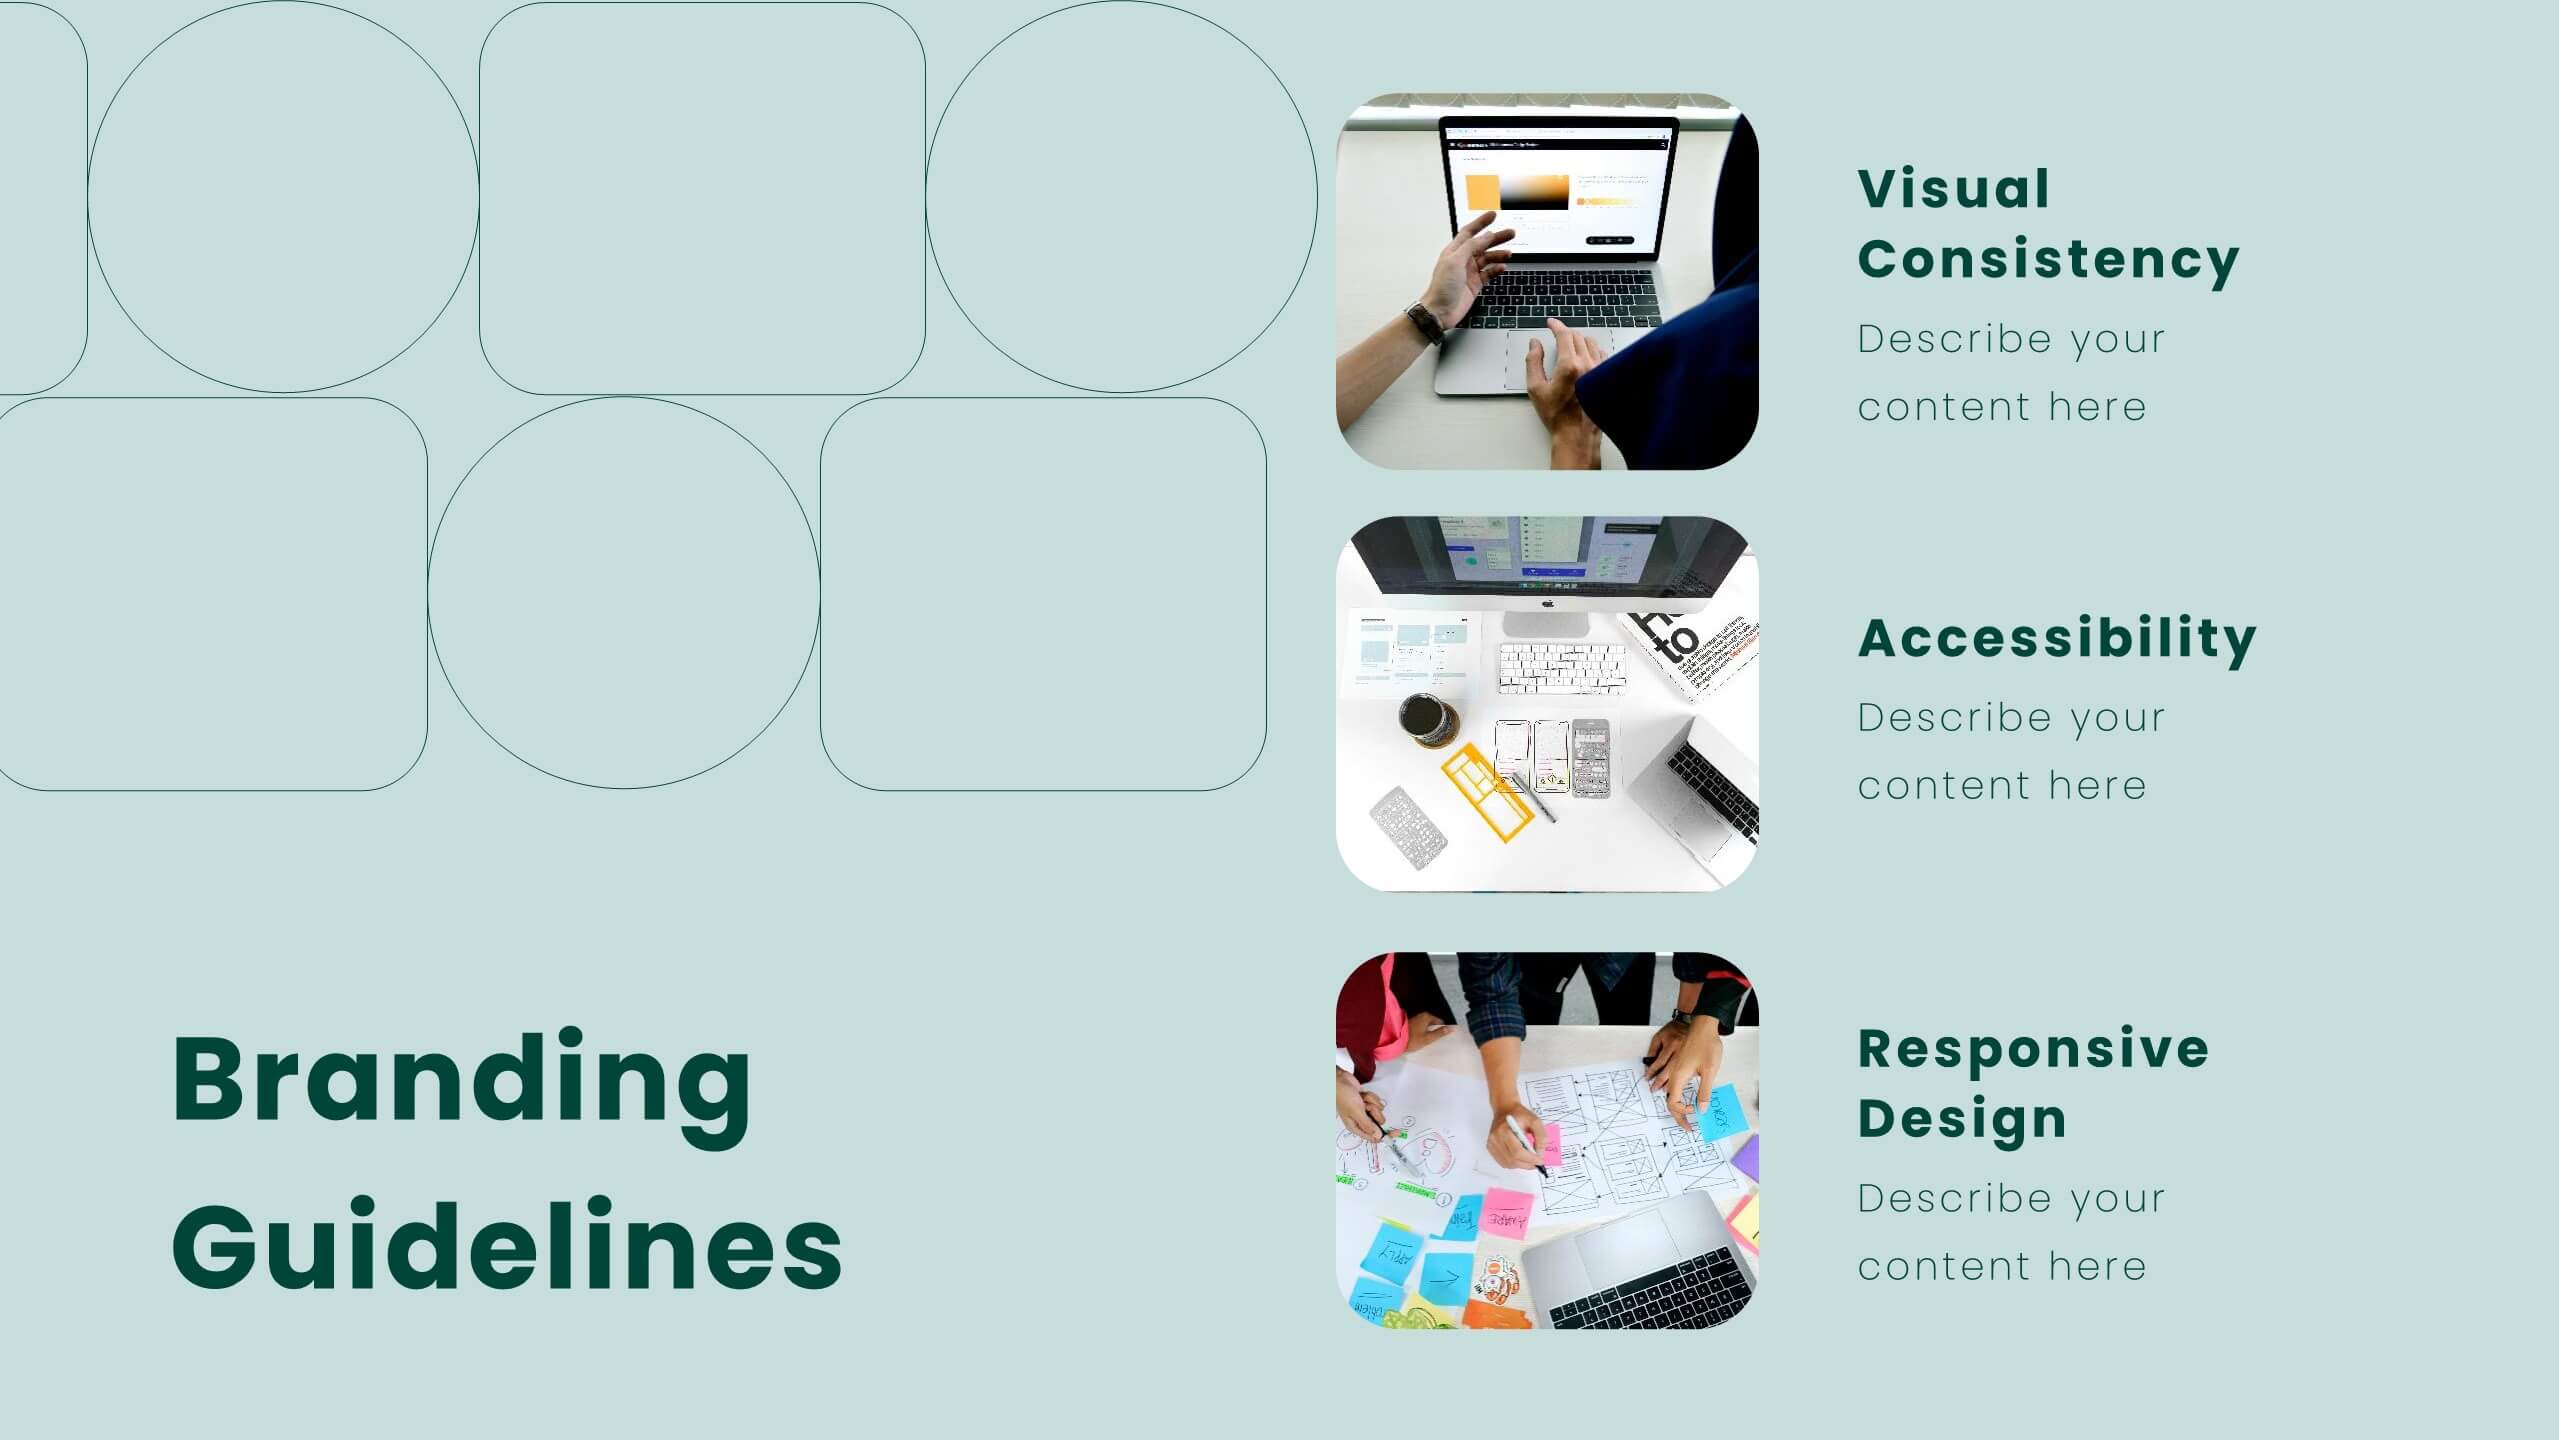
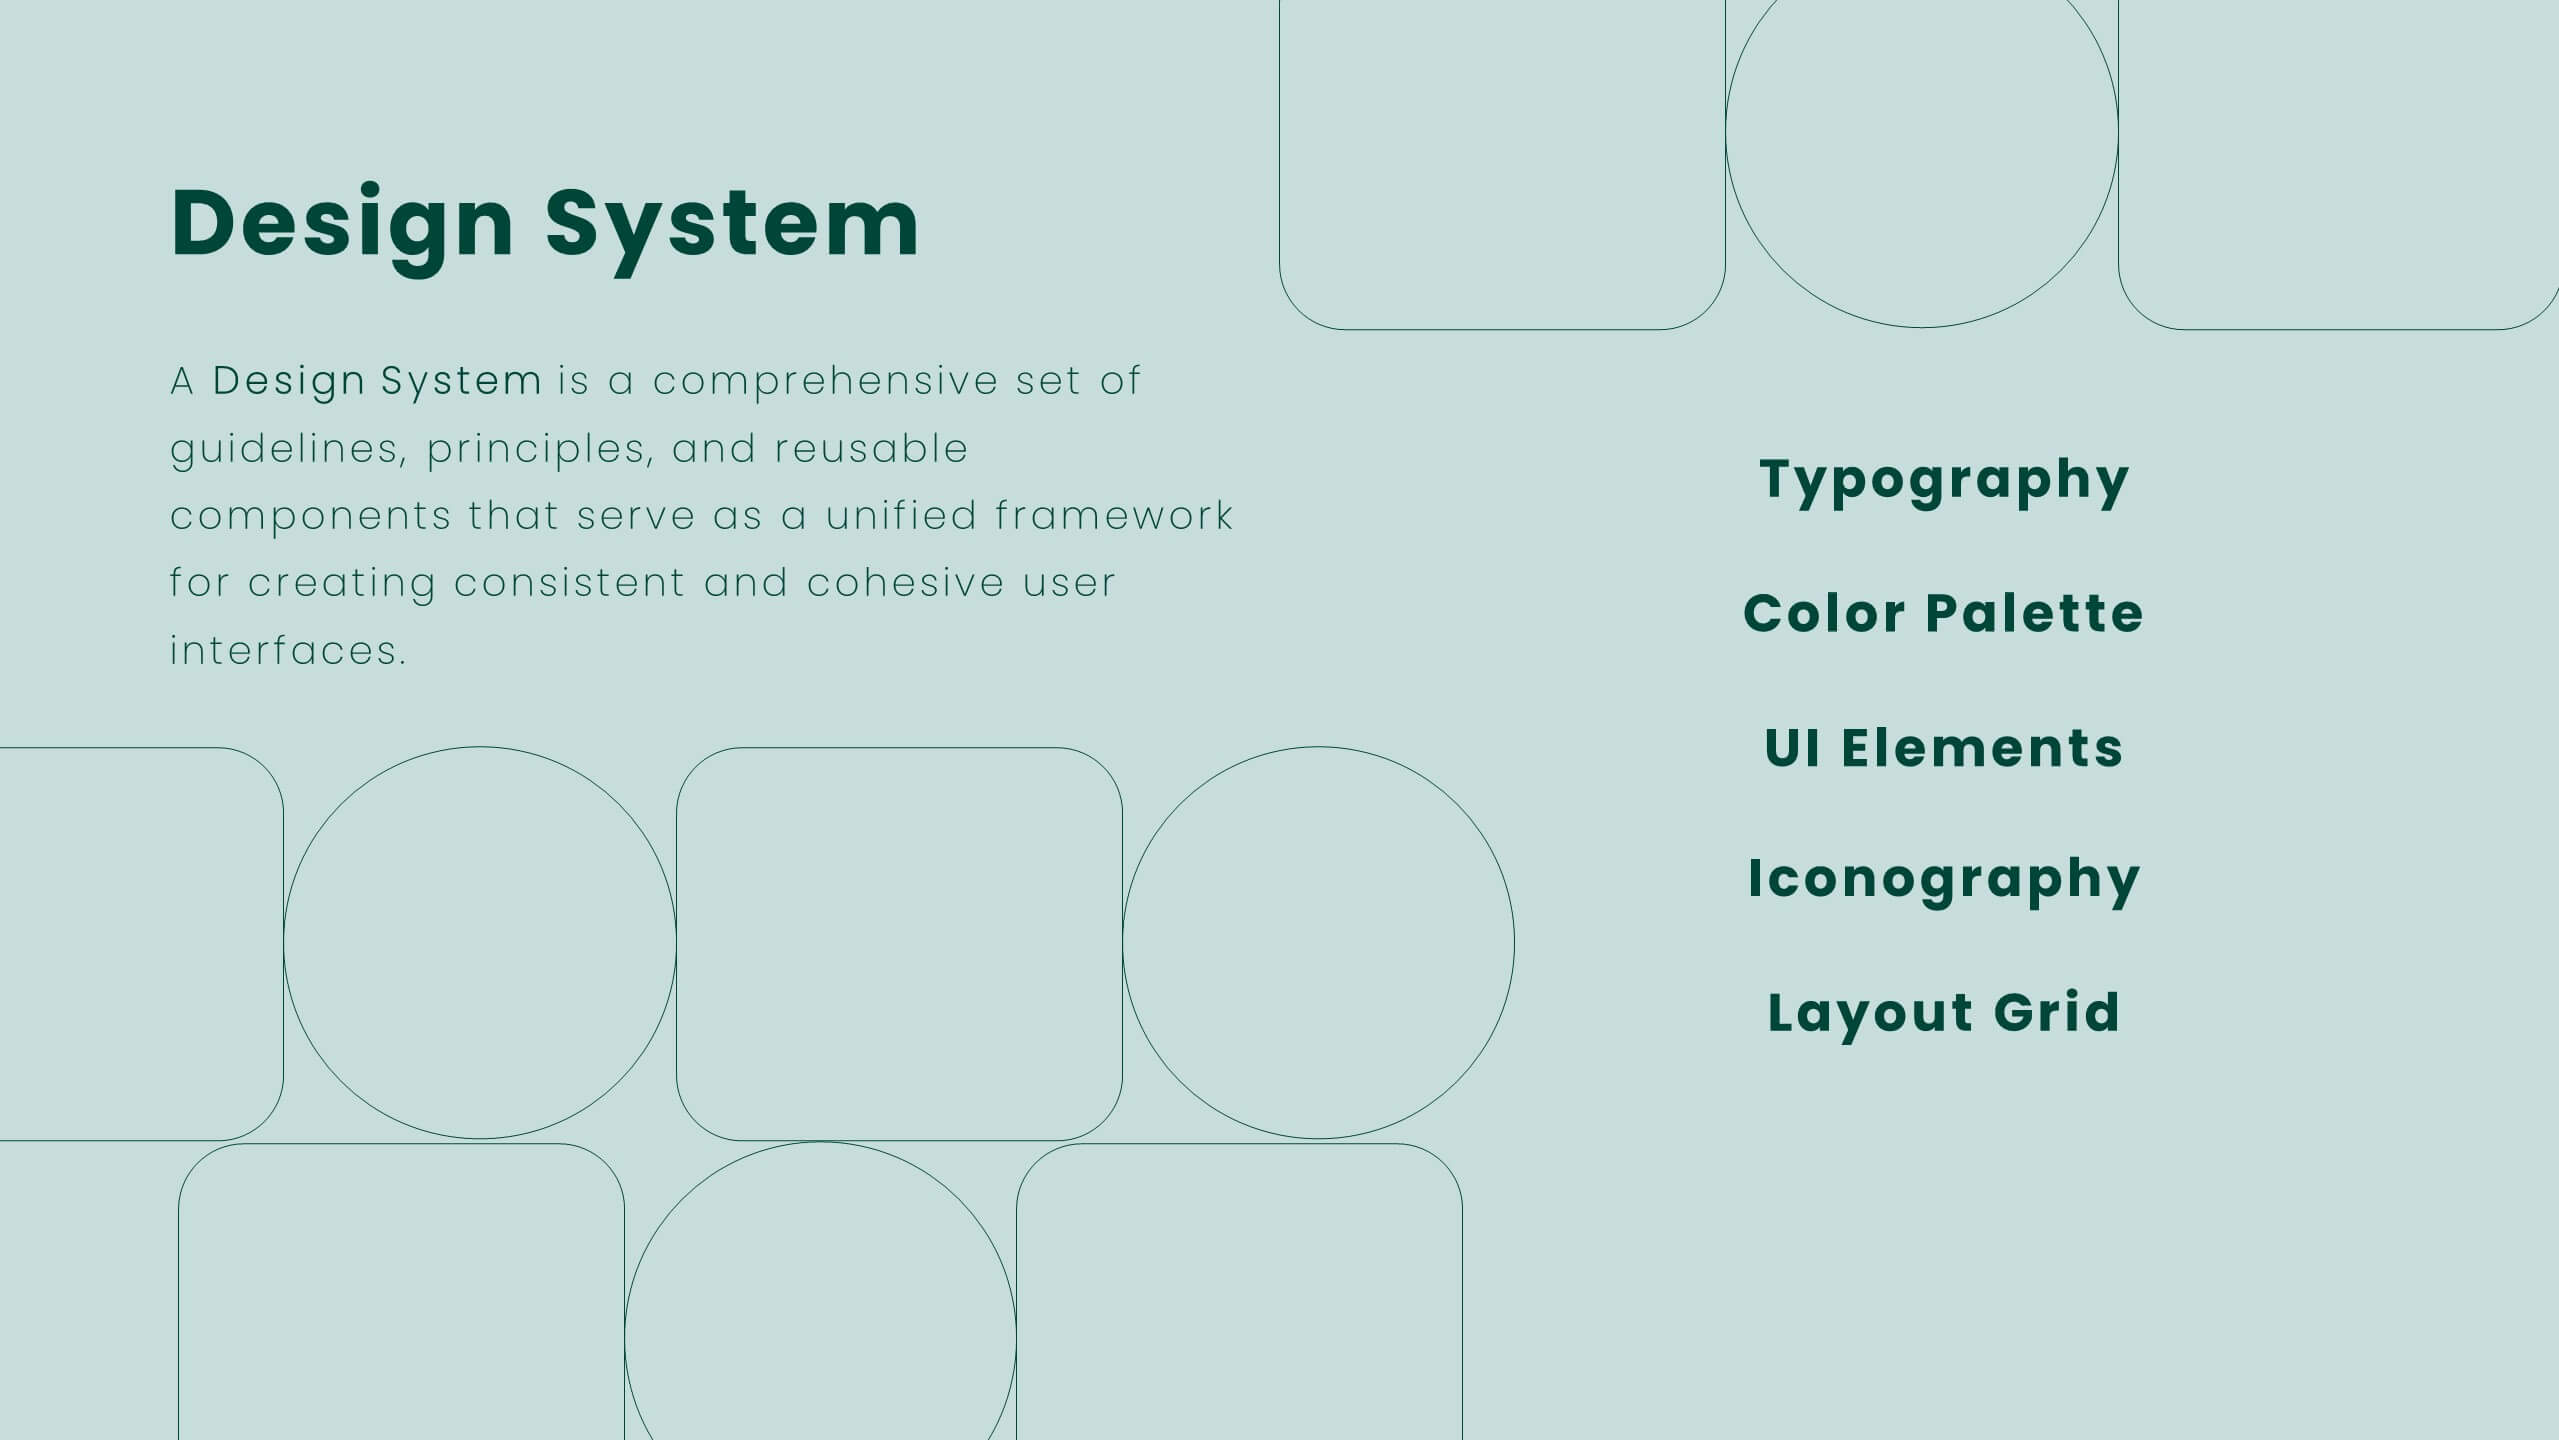
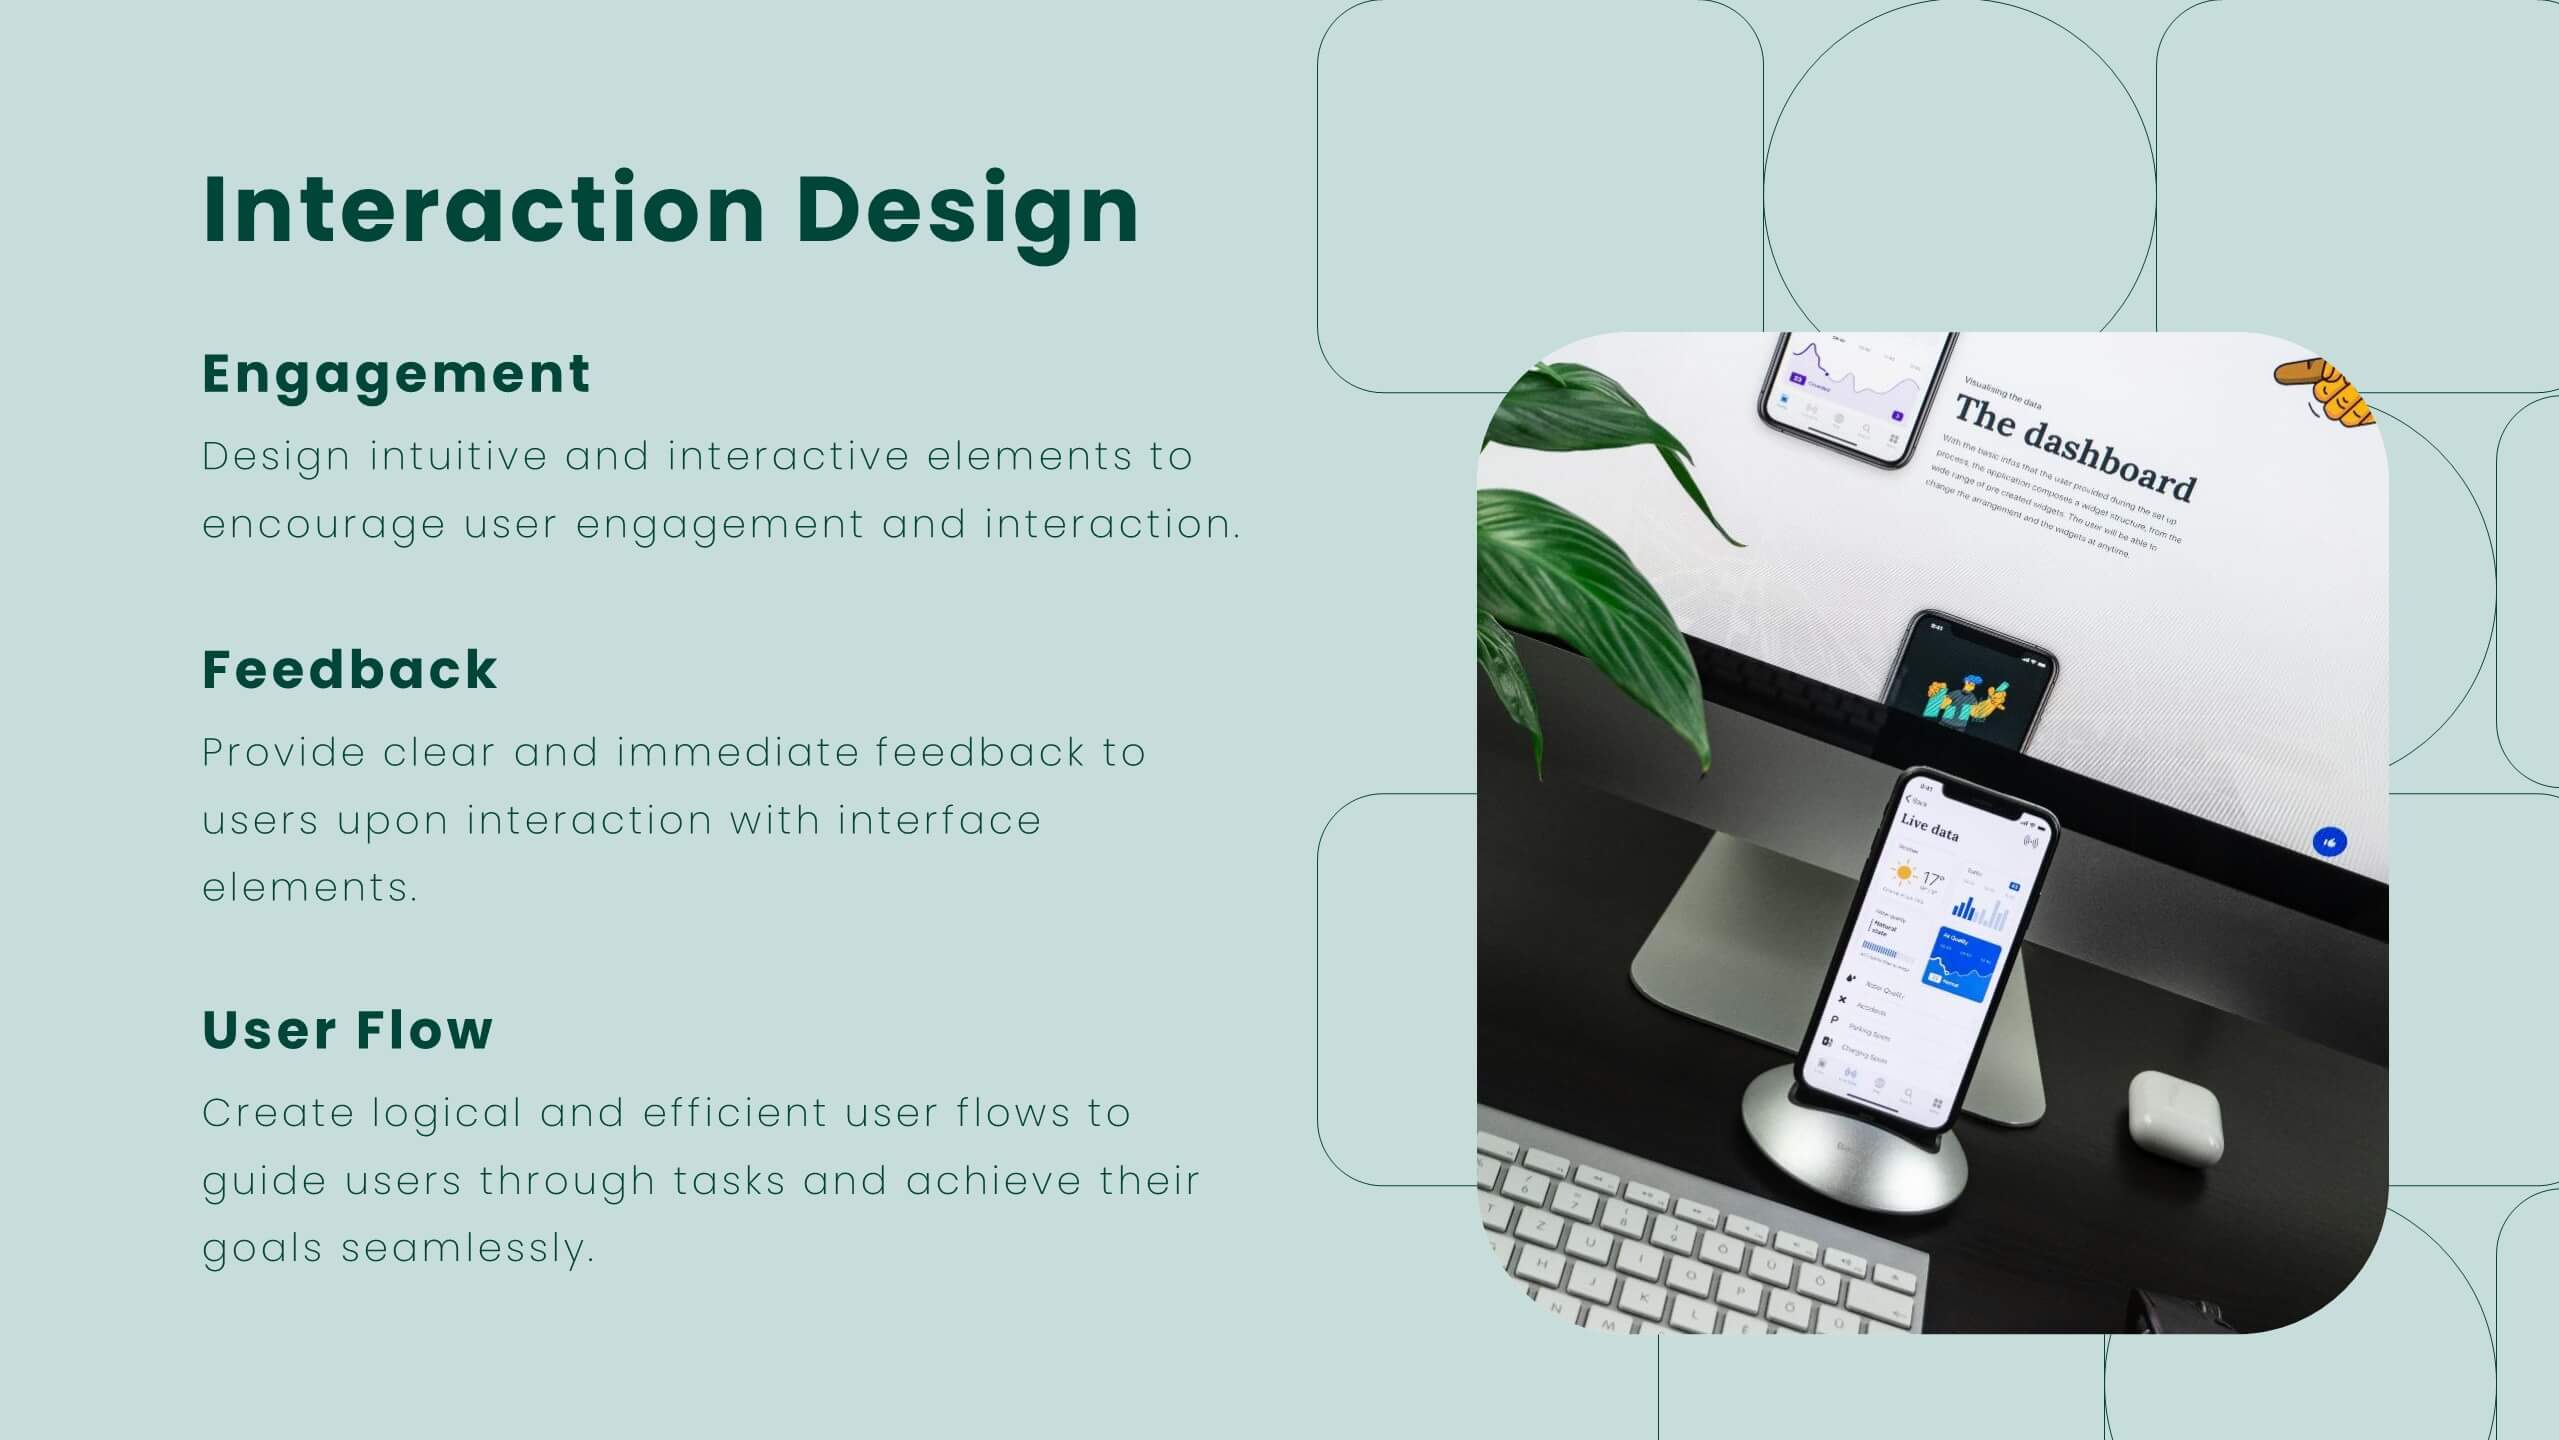
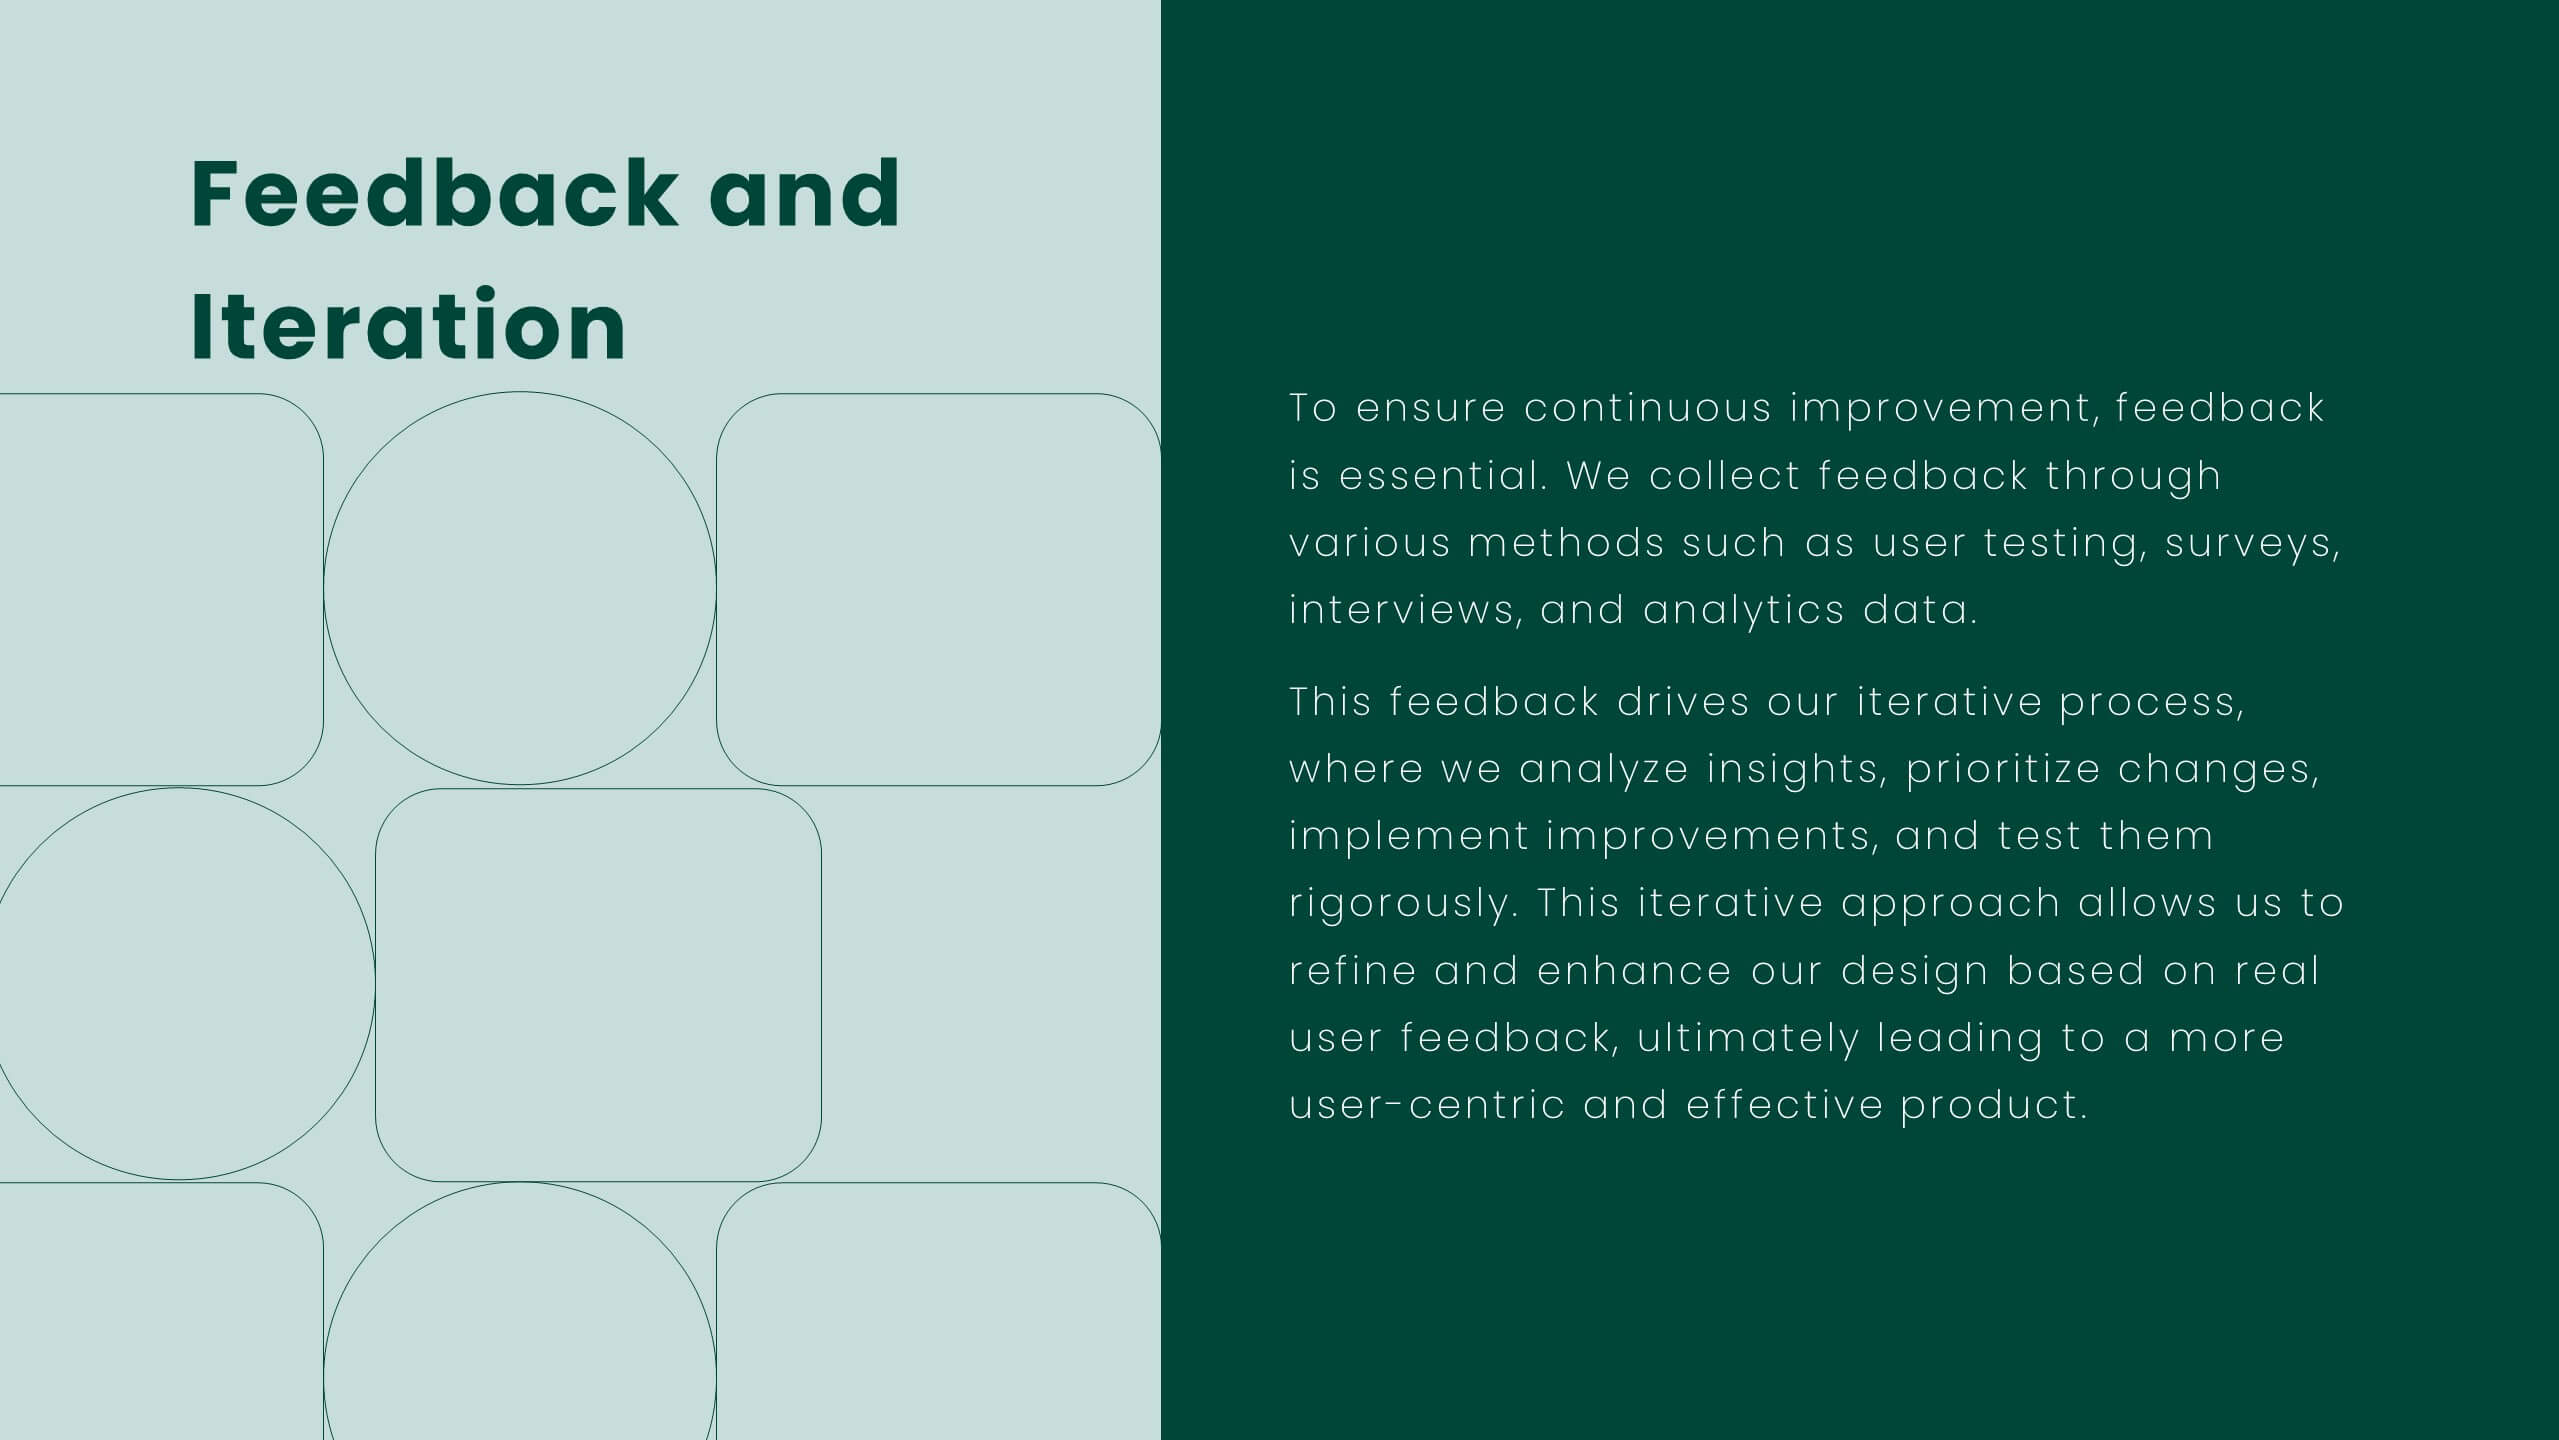
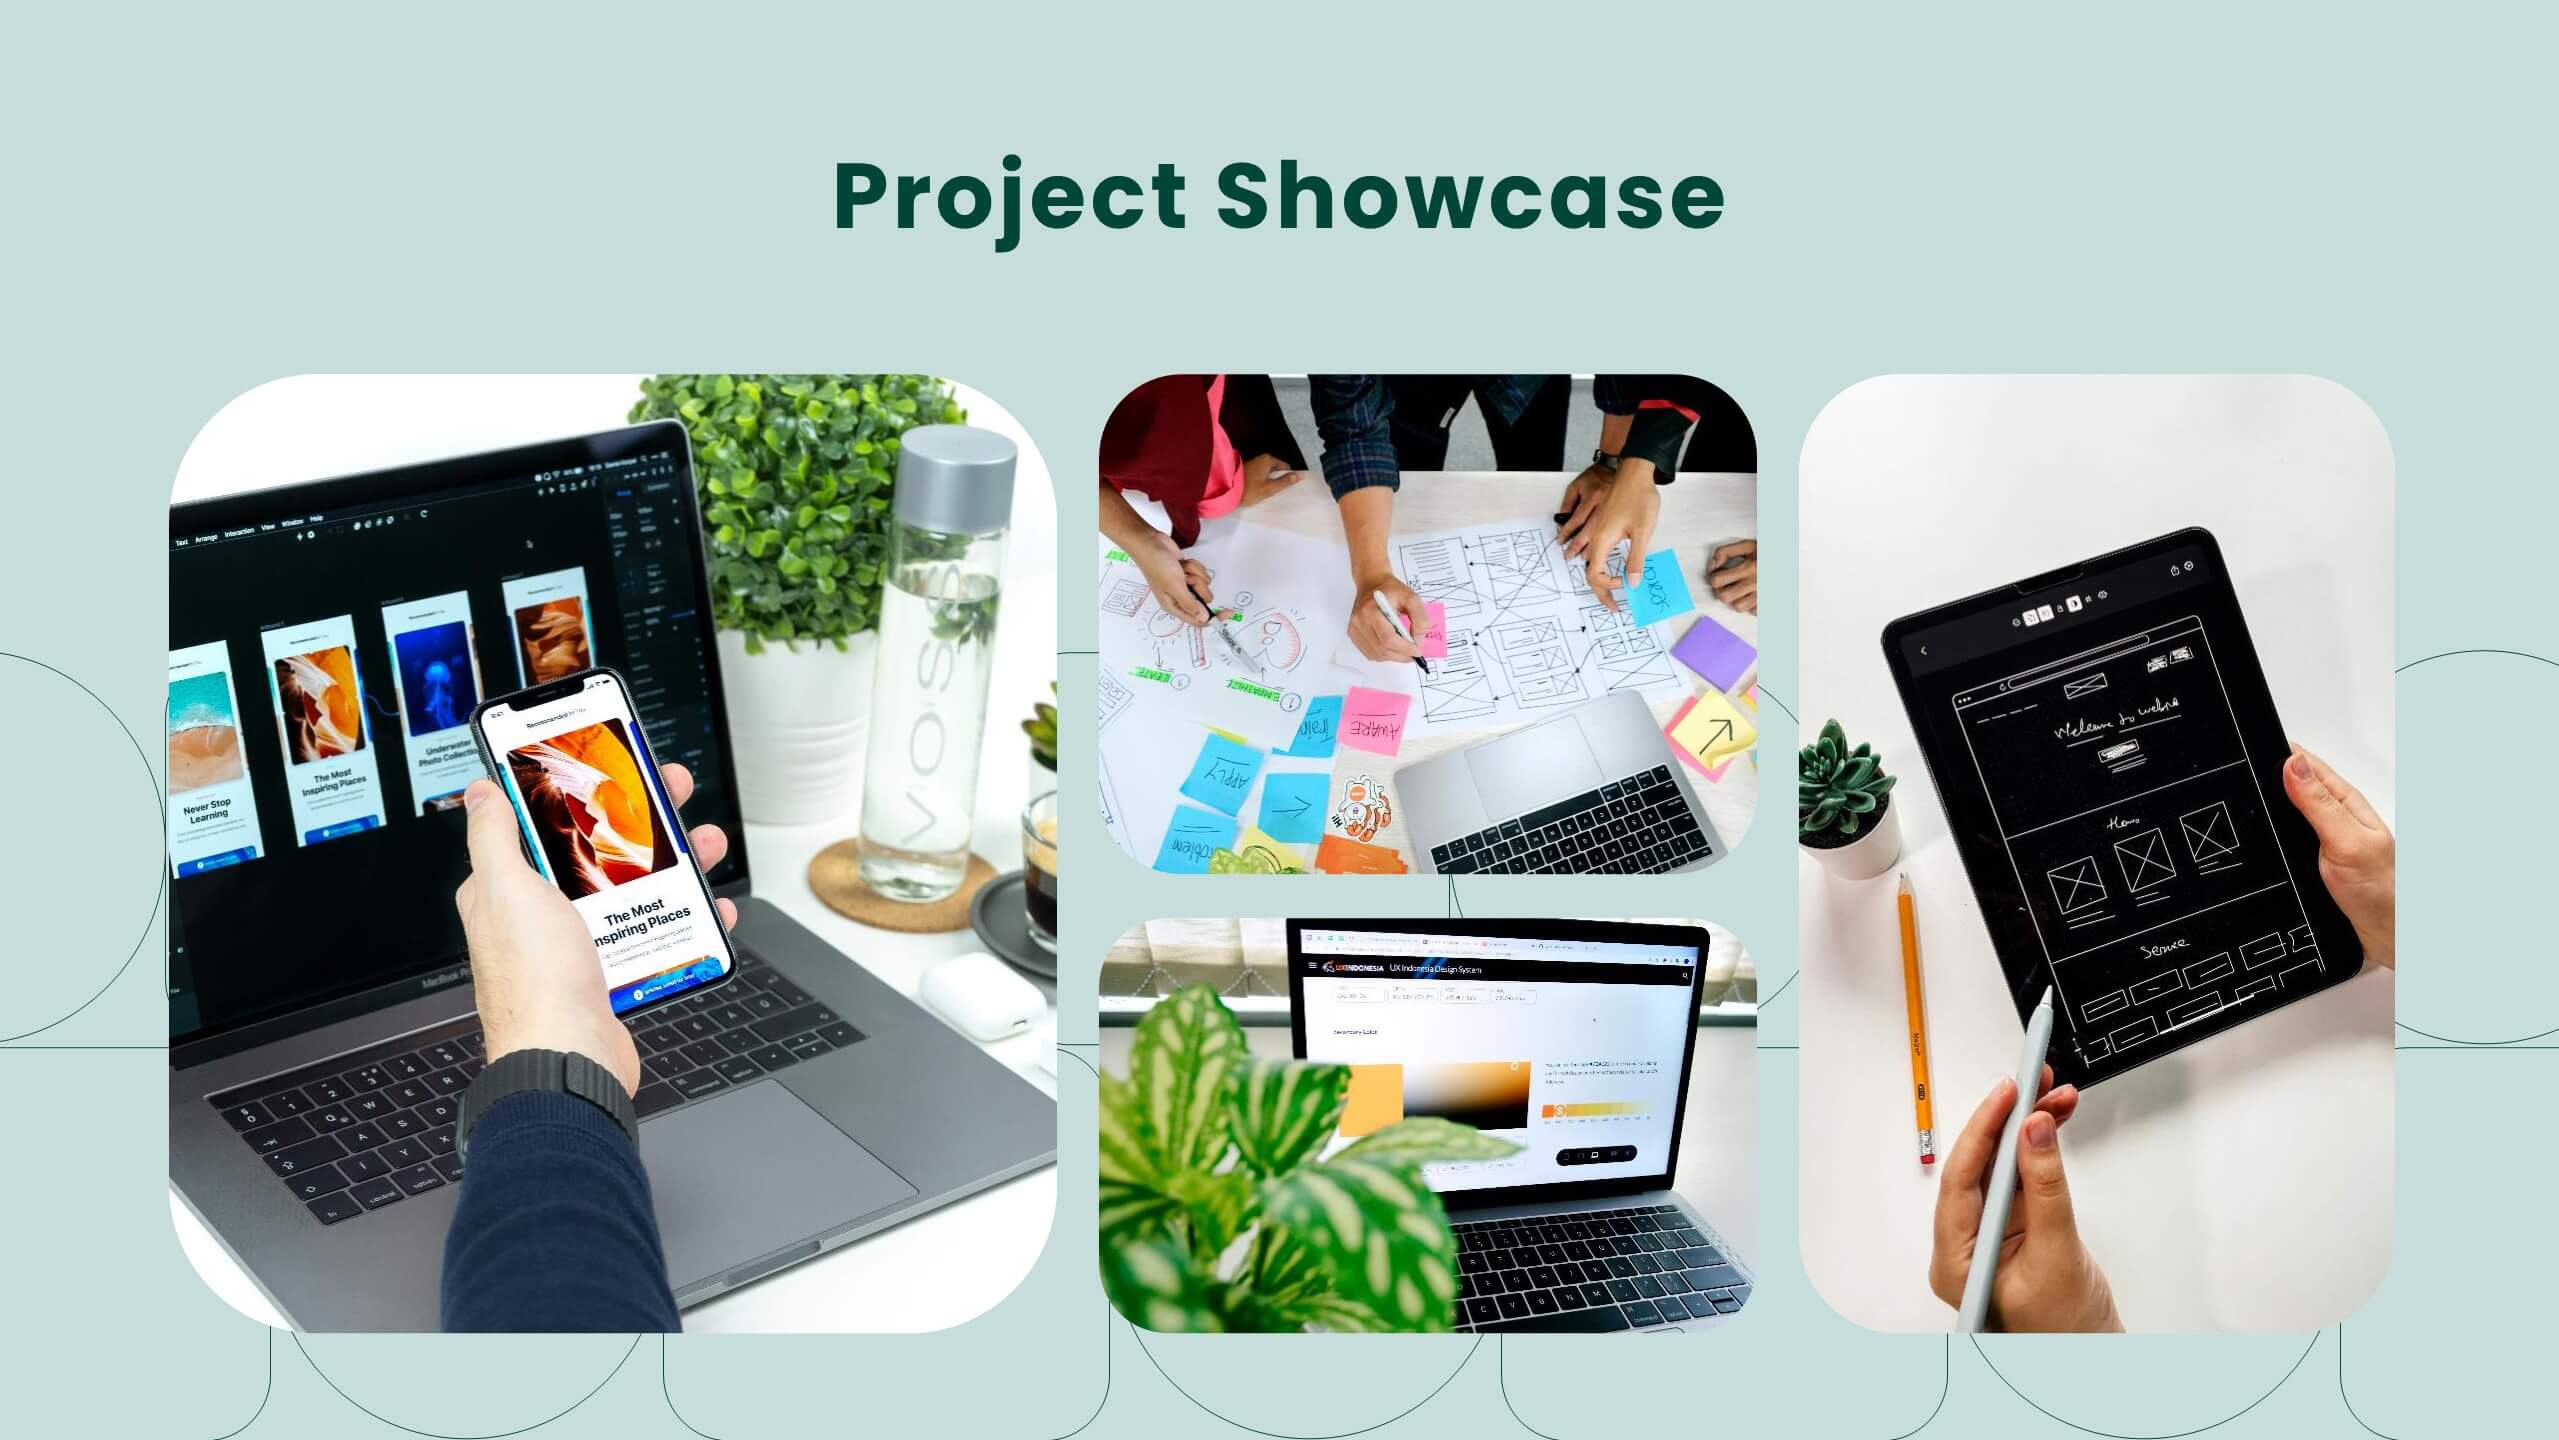
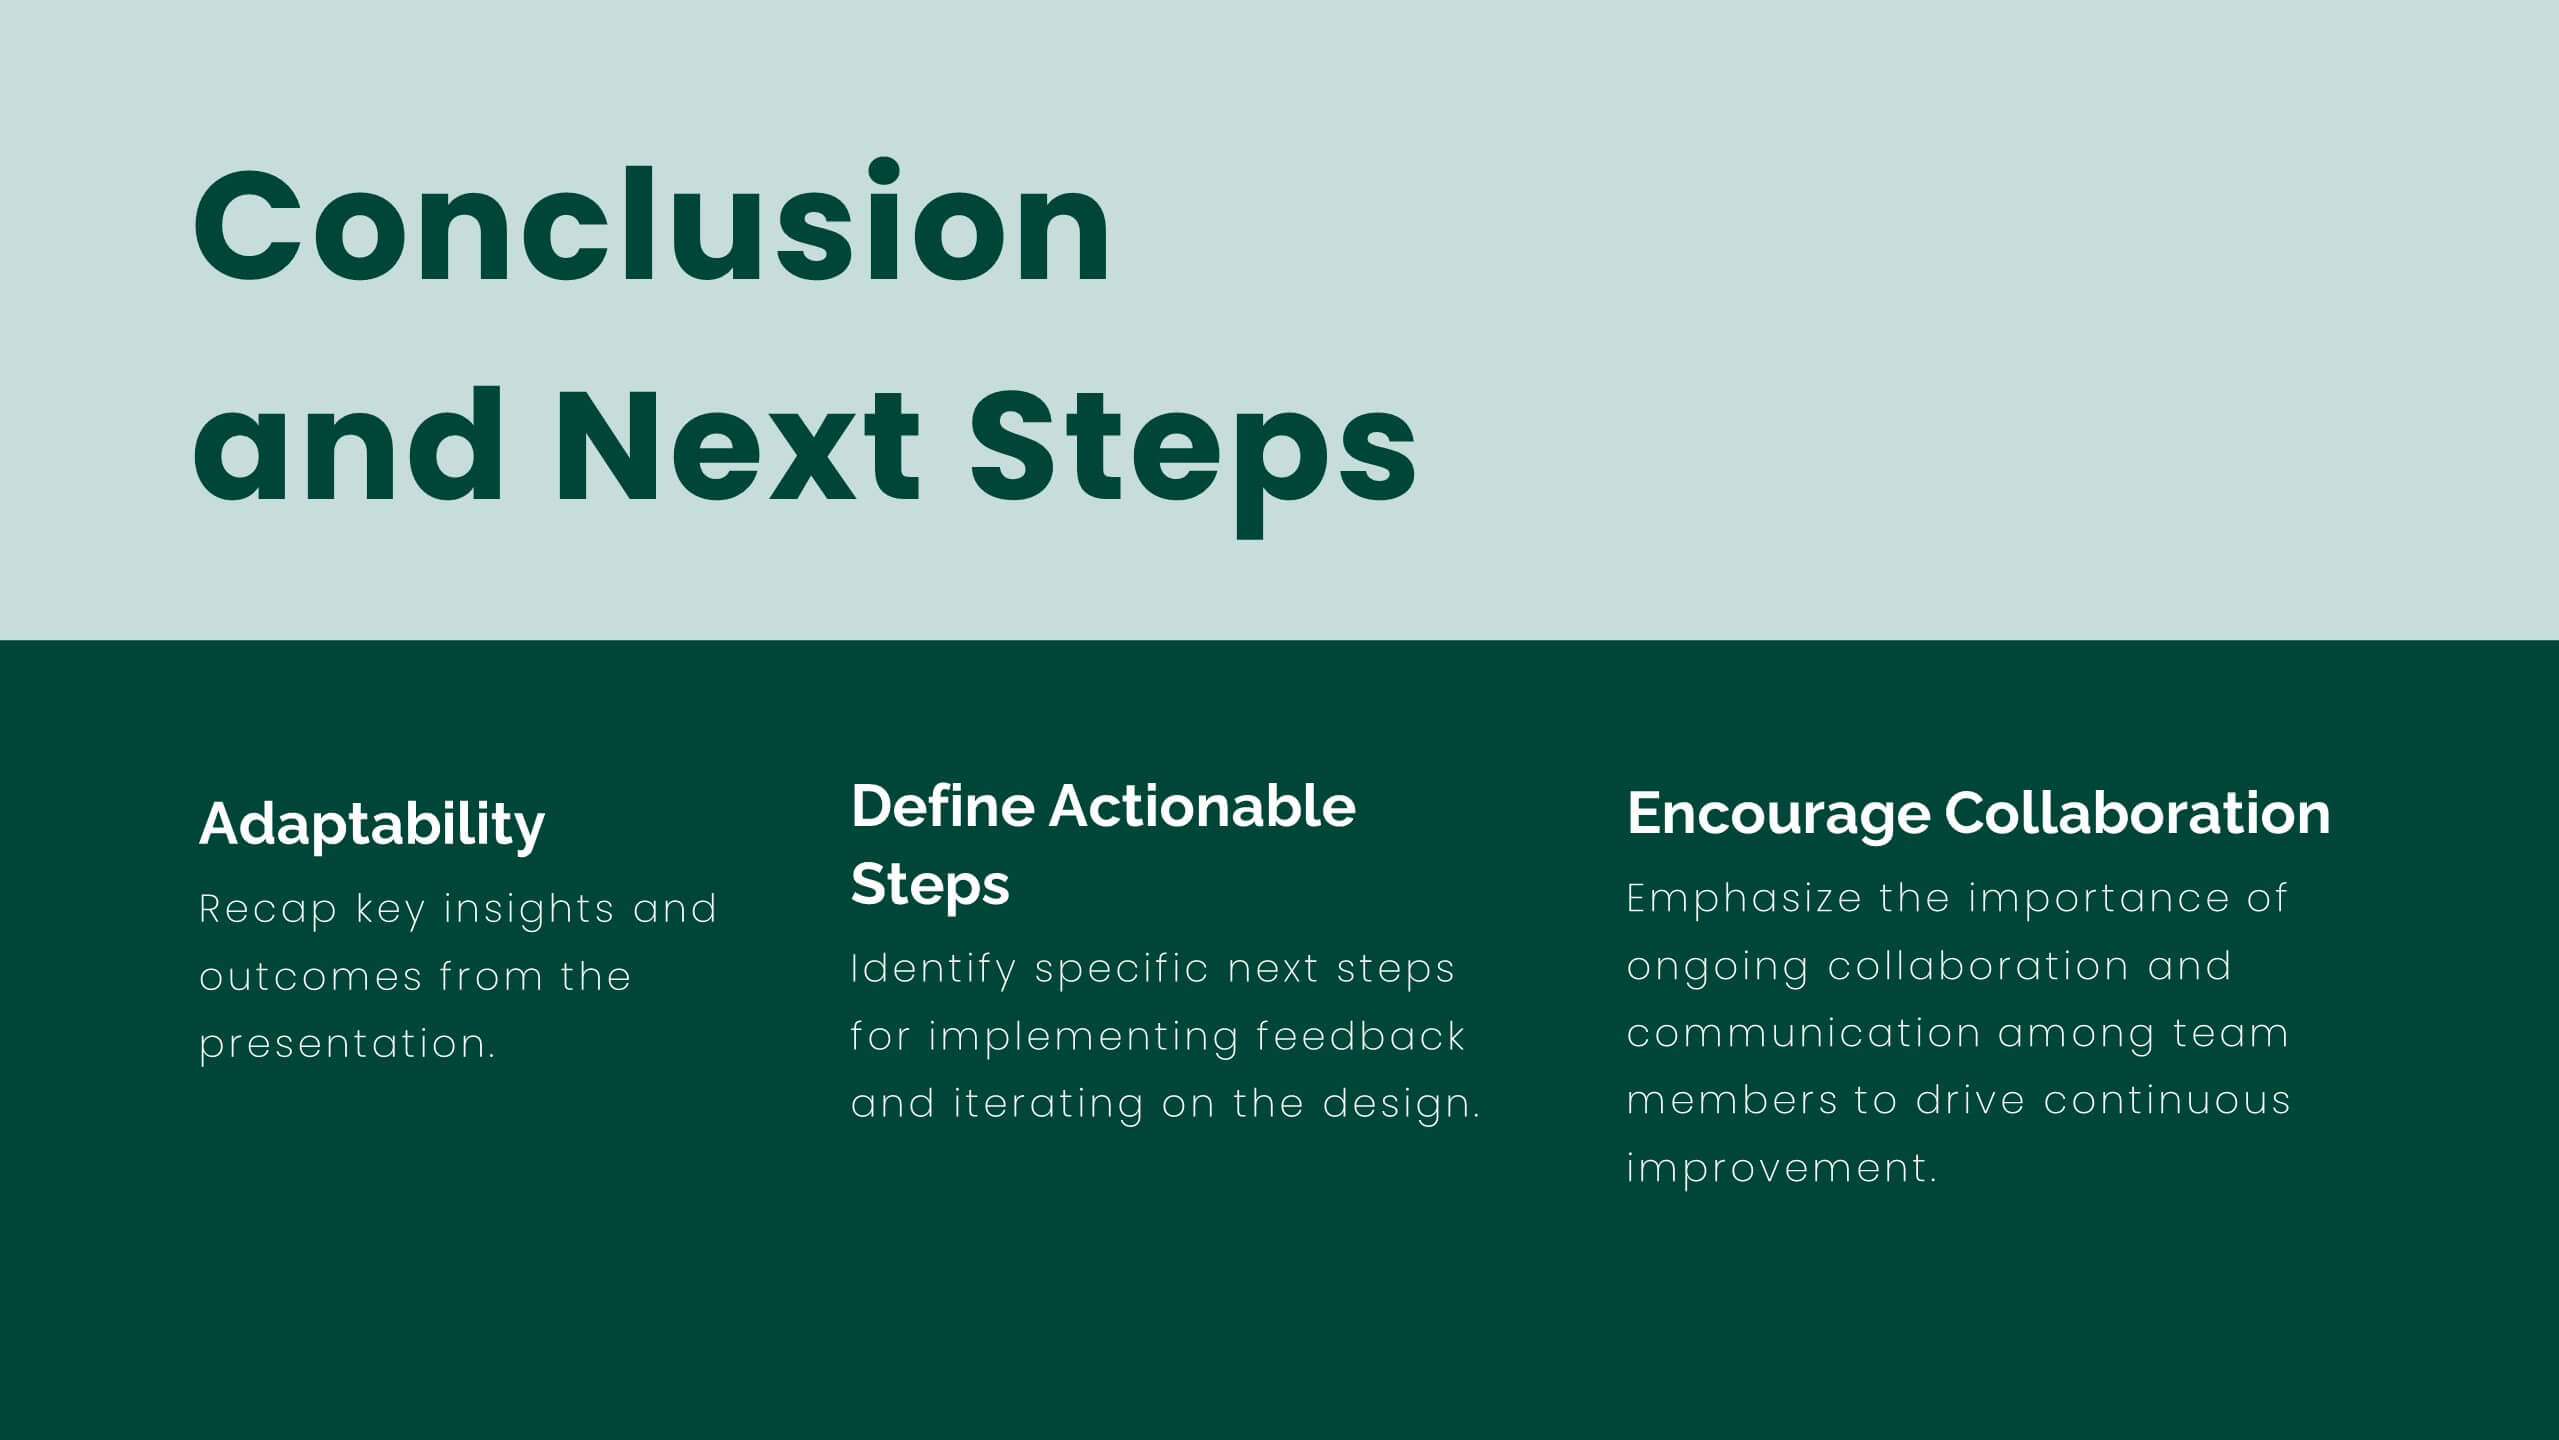
Lumina UX Case Study Presentation
Create compelling UX case studies with this modern template. Cover user research, personas, wireframes, and prototyping. Perfect for showcasing UI design principles, responsive design, and usability guidelines. Highlight feedback, iteration, and project showcase. Compatible with PowerPoint, Keynote, and Google Slides. Elevate your UX presentations and impress stakeholders with clear, detailed insights.


7 diapositivas
Process Table Infographic
Unveil the intricacies of any process with our process table slide infographic. Situated on a clean white base, the design flourishes with a spectrum of green for growth, purple for innovation, blue for consistency, and orange. With its detailed infographics, symbolizing icons, and flexible image placeholders, this template offers a structured representation of step-by-step processes, from initiation to completion. Perfectly calibrated for Powerpoint, Keynote, or Google Slides. An indispensable tool for business analysts, operations managers, educators, or anyone looking to streamline and visualize processes.


7 diapositivas
Success Iceberg Infographic
Iceberg Infographic are visual guides to understanding the world of business. Ideal for anyone who wants to understand the basics of business, from what it is and how it works to why it matters. This template is easy to read, and can be used for everything from data visualization to teaching people how to use a new product. Give your audience a look at the most important parts of your business. The template is easy to use, and allows you to highlight your data. Fully customizable and compatible with Powerpoint, Keynote, and Google Slides. There are multiple color themes, fonts, and shapes to choose from, and endless combinations to make it truly yours.


8 diapositivas
Travel Planning and Itinerary Overview Presentation
Pack your bags—this stylish template makes mapping adventures a breeze! Designed for trip overviews and itinerary planning, it includes world maps, must-see lists, weather forecasts, and schedules all in one layout. Perfect for travel agencies, bloggers, or wanderlust planners. Fully compatible with PowerPoint, Keynote, and Google Slides for easy customization.


7 diapositivas
Europe Population Infographic Presentation
A Europe Map infographic is a visual representation of the European continent, highlighting its geographic features, population, culture, history, and other relevant information. This template is a perfect graphic representation of Europe that combines text, data, and images in a fun and engaging way. This pre-designed template allows users to modify or customize the map to suit their specific needs. This includes a map of Europe with its countries, major cities, and geographic features, along with additional information and visuals related to the topic or purpose of the infographic.


7 diapositivas
AIDA Interest Model Infographic
The AIDA Interest Model is a cornerstone in marketing and sales, guiding professionals through the stages of Attention, Interest, Desire, and Action. Our infographic, bathed in hues of purple, green, blue, and yellow, brings this classical model to life in a refreshing and engaging manner. With a fun, yet informative style, it elucidates each phase, making it a go-to resource for marketers, salespersons, and educators alike. Whether you're training a team, educating students, or crafting a persuasive pitch, this infographic will elevate your presentation. It's fully compatible with PowerPoint, Keynote, and Google Slides.


6 diapositivas
Formal Numbers Infographics
Enter the world of formal numbers, a vital concept in mathematics and science! This infographic acts as your gateway to comprehending the structure and significance of formal numbers. From the fundamental properties of natural numbers to the intricate details of real and complex numbers, we unveil the secrets that underpin these mathematical entities. Discover the mathematical significance of formal numbers across various fields, from algebra to calculus and beyond. Explore how these numbers are used in practical applications, including engineering, physics, and computer science. Gain an appreciation for the elegance and versatility of formal numbers in solving real-world problems. With this informative infographic, compatible with PowerPoint, Keynote, and Google Slides, sharing your understanding of formal numbers becomes seamless. Empower yourself with the knowledge to navigate the intricate world of mathematics. Dive into the realm of formal numbers and embark on a journey of mathematical exploration and enlightenment.


21 diapositivas
Stonelight Qualitative Research Findings Presentation
Present your research findings with clarity and impact using this sleek and modern presentation template. Designed for professionals and researchers, it guides you through all key aspects of your project, from introduction and background to detailed literature reviews, methodology, and data collection processes. Showcase your insights with sections for data analysis, key findings, and results interpretation, ensuring your audience stays engaged. This template also includes areas for recommendations, implications, and future research opportunities, making it ideal for academic, business, or industry presentations. Fully customizable and compatible with PowerPoint, Google Slides, and Keynote, it adapts seamlessly to your branding and content needs. Communicate your findings effectively and make a lasting impression with this professional and polished design.


6 diapositivas
Stock Market Trends and Charts Presentation
Turn financial data into a story that’s easy to follow with this clean, professional layout designed to highlight market growth, patterns, and investment insights. Ideal for analysts and educators, it combines charts with sleek visuals. Fully compatible with PowerPoint, Keynote, and Google Slides for effortless customization.


26 diapositivas
Linear Technology Presentation
Cyberspace is the realm of digital information that can be accessed, shared, and stored using electronic devices. Focus on the future of technology with this template! This presentation's linear design will put your ideas front-and-center. This design is high-tech the theme colors and icons are sure to make an inspiring first impression on your audience. This can be used for business presentations, academic projects and conferences. This template consists of 26 slides that will bring your ideas to the next level by putting emphasis on key points and keeping your ideas concise and organized.


24 diapositivas
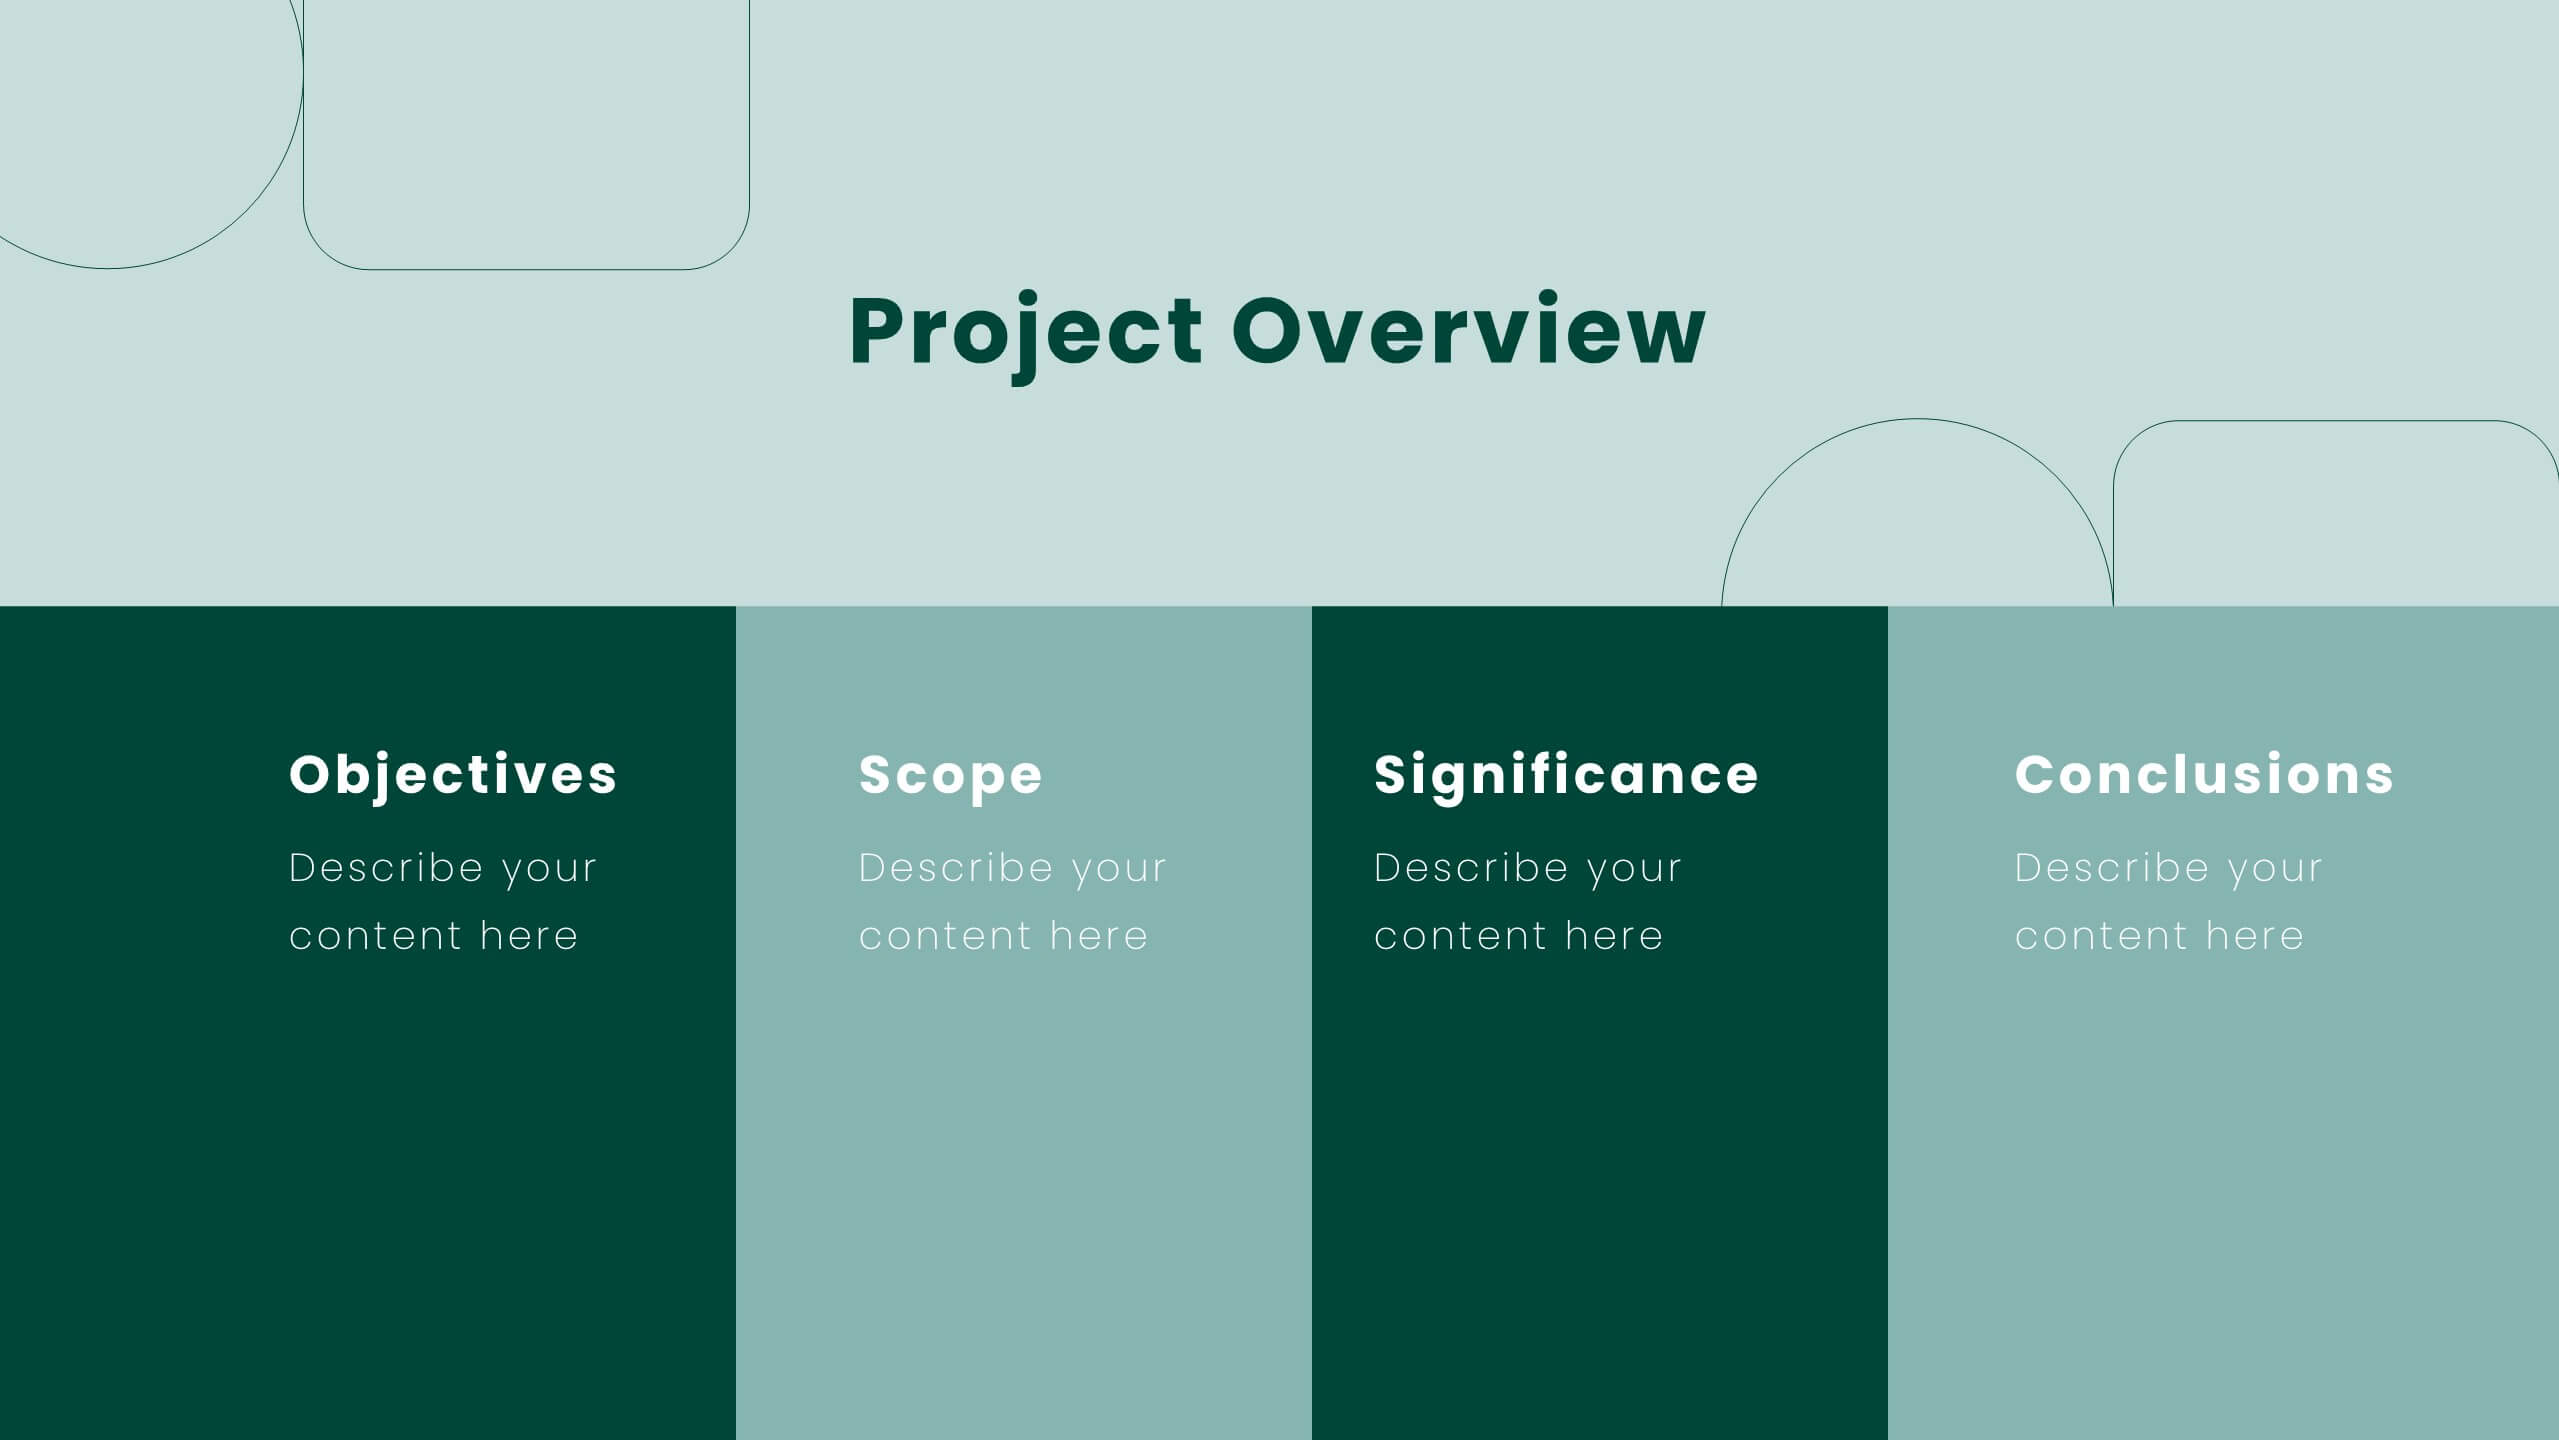
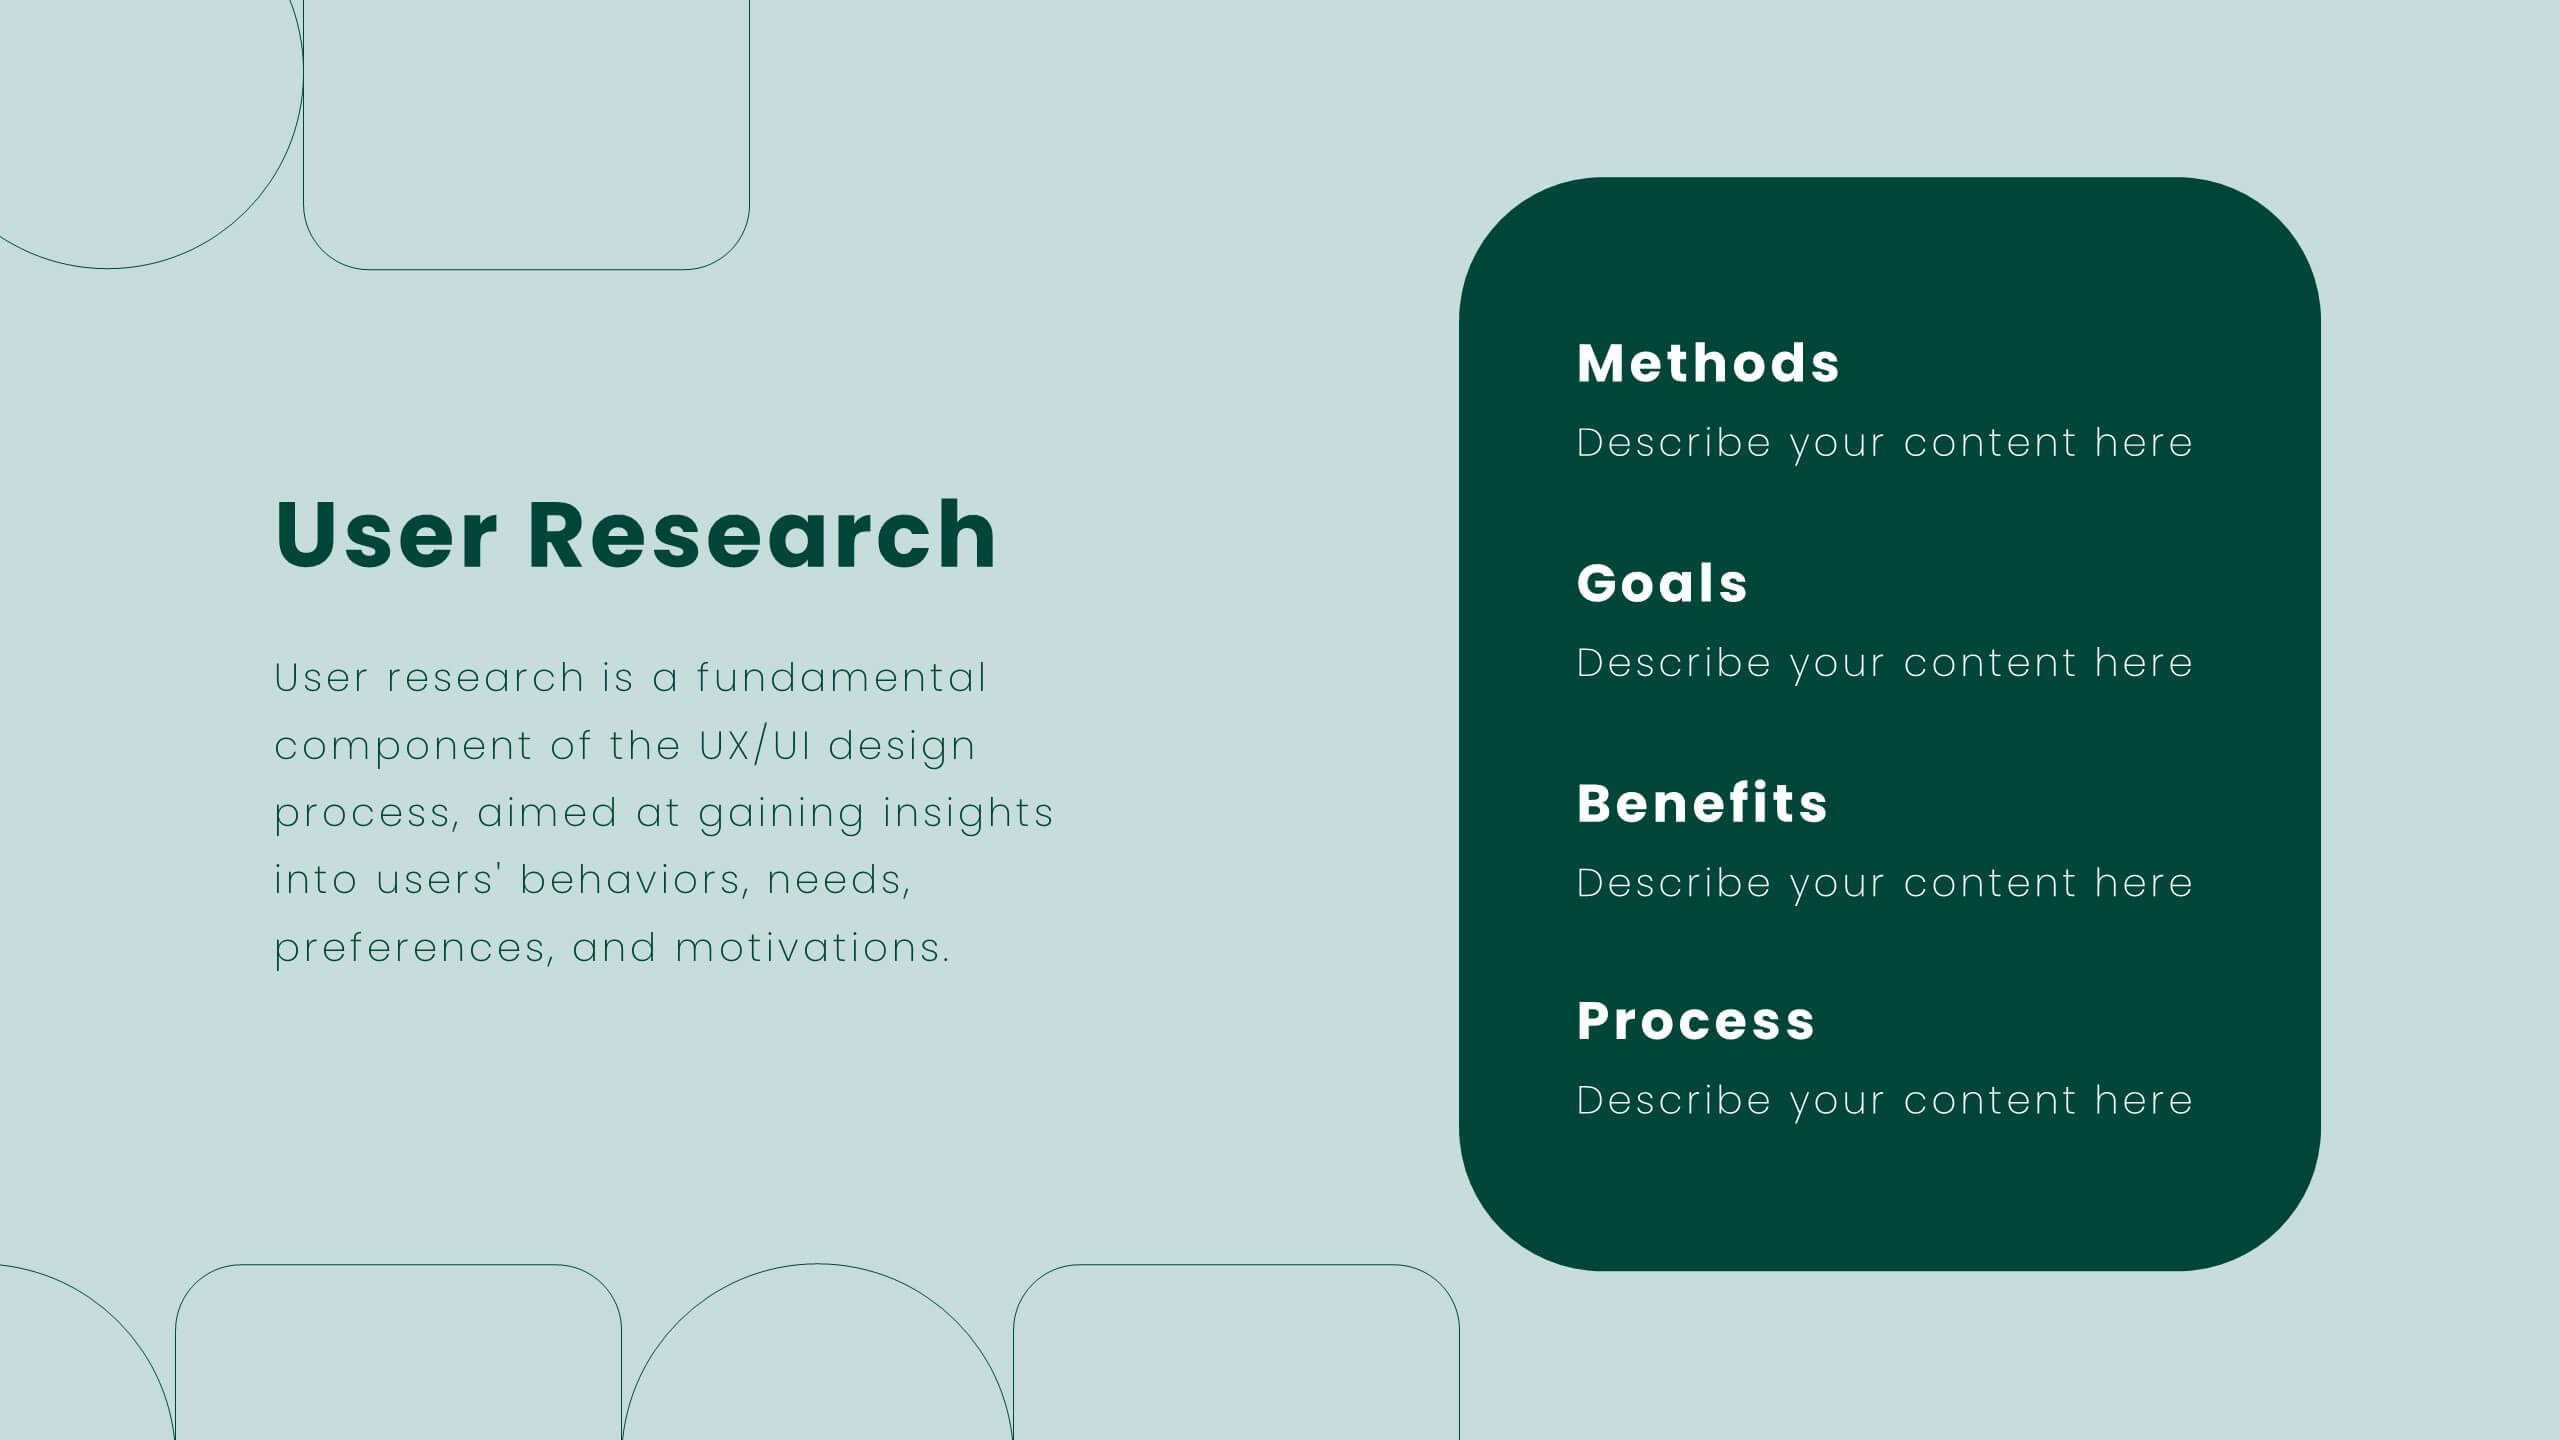
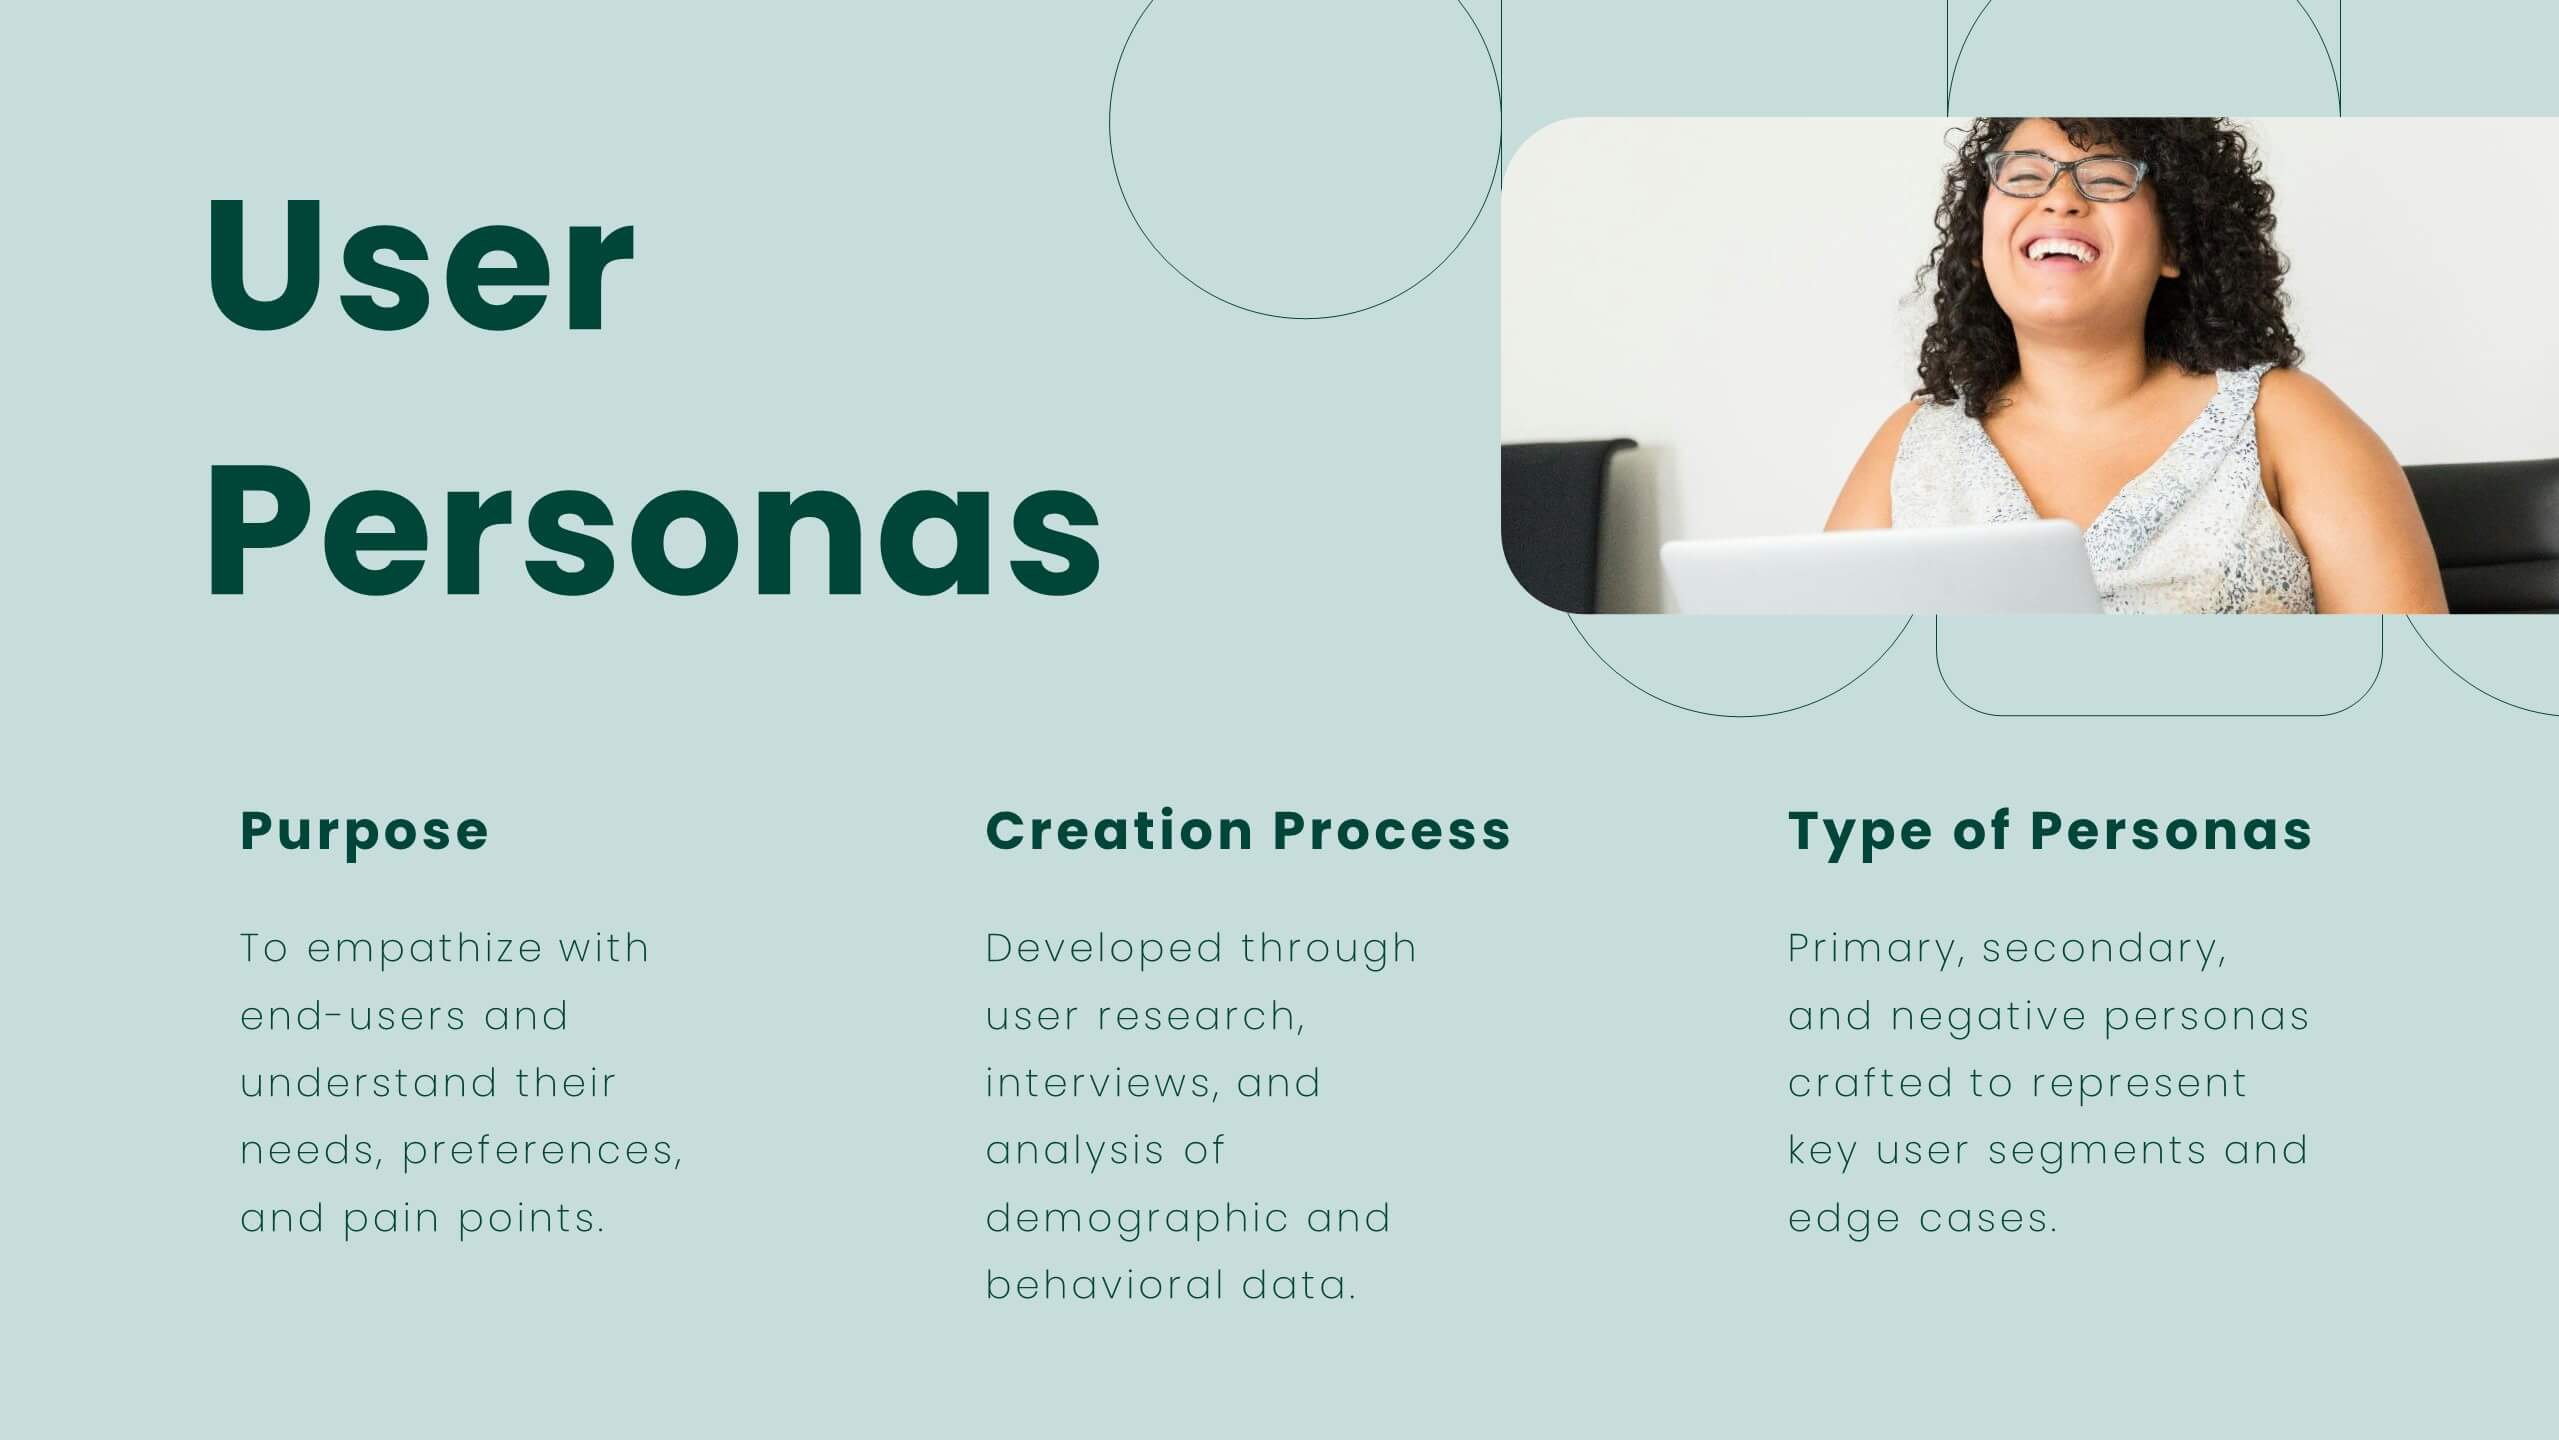
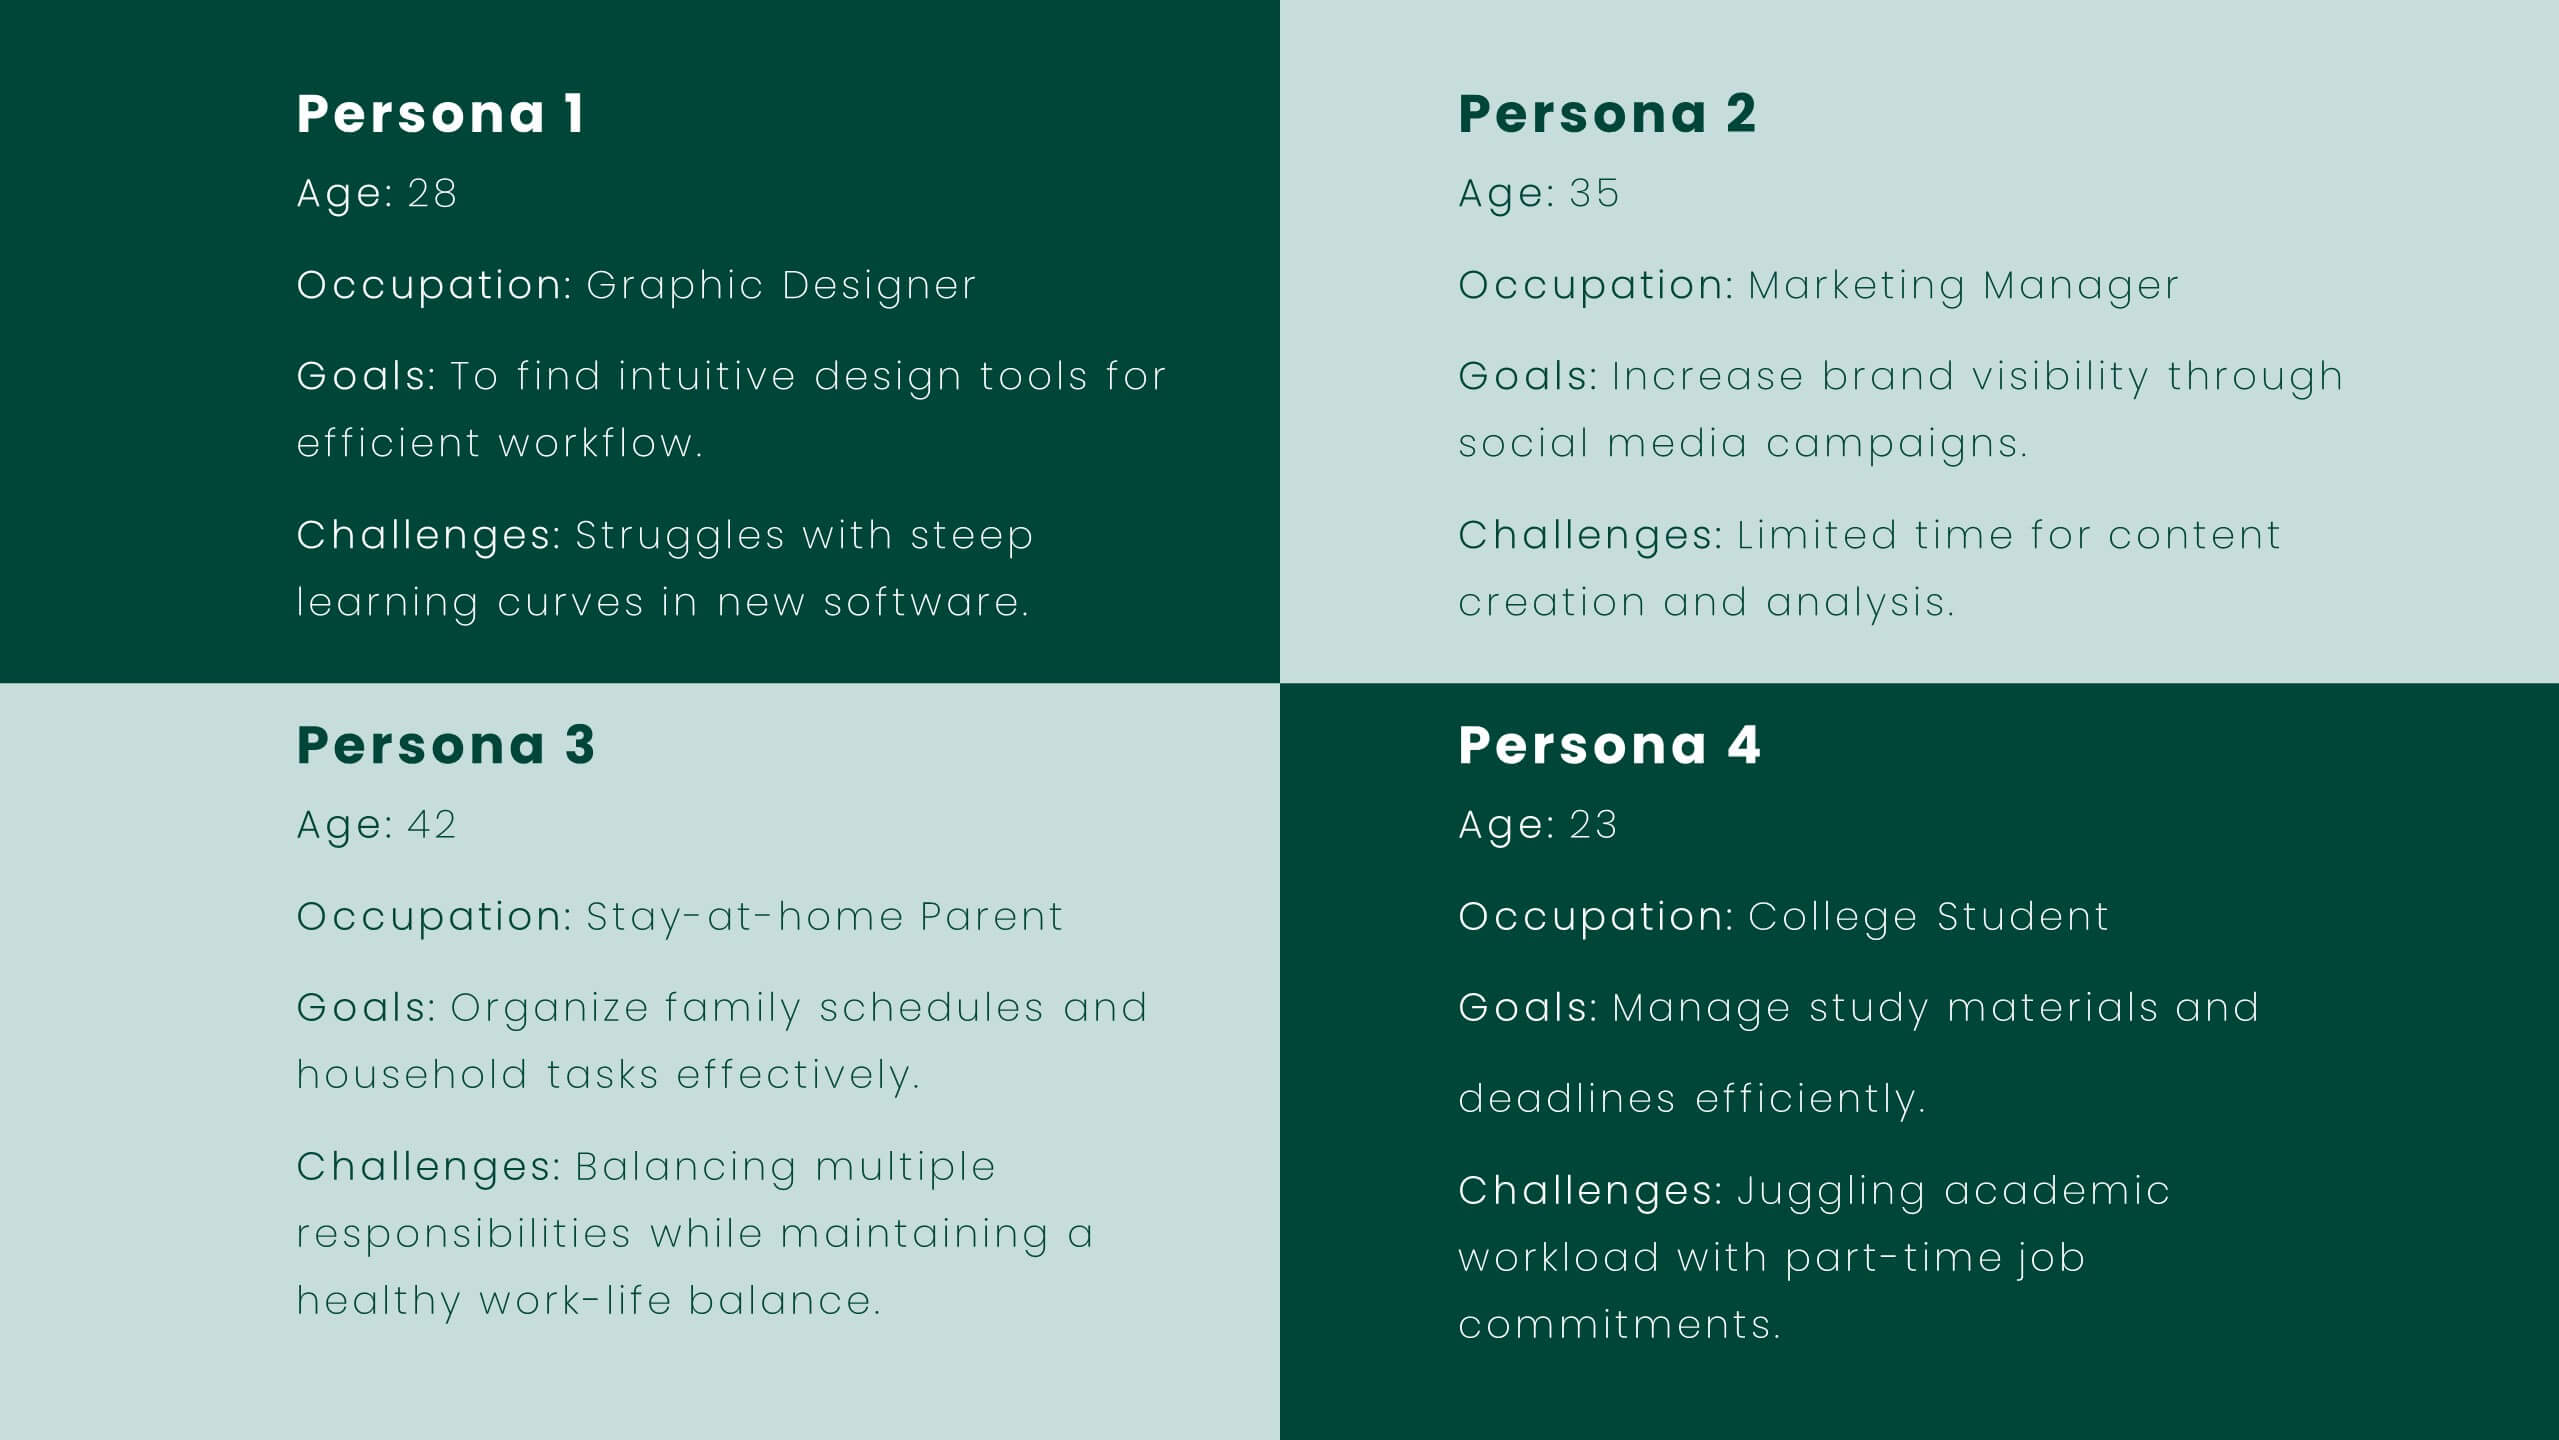
Veritas UX Research Report Presentation
This UX research report template is designed for clarity and modern style, using a sleek color palette and structured layouts to showcase insights. It includes sections for project overview, user research, personas, wireframes, prototyping, and user testing results. Compatible with PowerPoint, Keynote, and Google Slides, it’s ideal for presenting findings effectively.


6 diapositivas
Science Project Infographic
Science projects are hands-on activities designed to explore and investigate scientific concepts. This infographic template aims to communicate complex scientific information in a visually appealing and easy-to-understand manner. The infographic provides an overview of the project's key elements, including the question, hypothesis, materials, procedure, results, and conclusion. This serves as a creative and engaging guide to help students choose and plan their science projects for school science fairs or independent research. The infographic uses visuals, illustrations, and icons to enhance understanding and engagement.


5 diapositivas
Strategic Planning with Concentric Circles
Draw your audience in with a visual that’s as focused as your message! This strategic concentric circles template helps you map out layered priorities, interconnected goals, or phased strategies in a clean, compelling way. Fully customizable and compatible with PowerPoint, Keynote, and Google Slides for seamless presentation design.