


Características


¿Tienes alguna pregunta?
Recomendar


5 diapositivas
Risk and Return Investment Presentation
Navigate the high seas of finance with our captivating infographic presentation template, designed to visually break down the complex relationship between risk and return in investments. This template simplifies presenting key data points, making it ideal for financiers and investors looking to make informed decisions. Each slide is meticulously crafted to ensure clarity and impact, highlighting the balance of potential rewards against possible risks. Perfect for use in PowerPoint, Keynote, and Google Slides, this template is a must-have tool for anyone in the financial sector aiming to convey their strategy with precision and flair.


5 diapositivas
Productivity and Time Optimization Presentation
Visualize time-saving strategies and workflow efficiency with this hourglass-themed productivity template. Ideal for illustrating phased progress, deadlines, or time distribution, this design breaks your message into four clear sections with engaging visuals. Fully editable in PowerPoint, Keynote, and Google Slides.

22 diapositivas
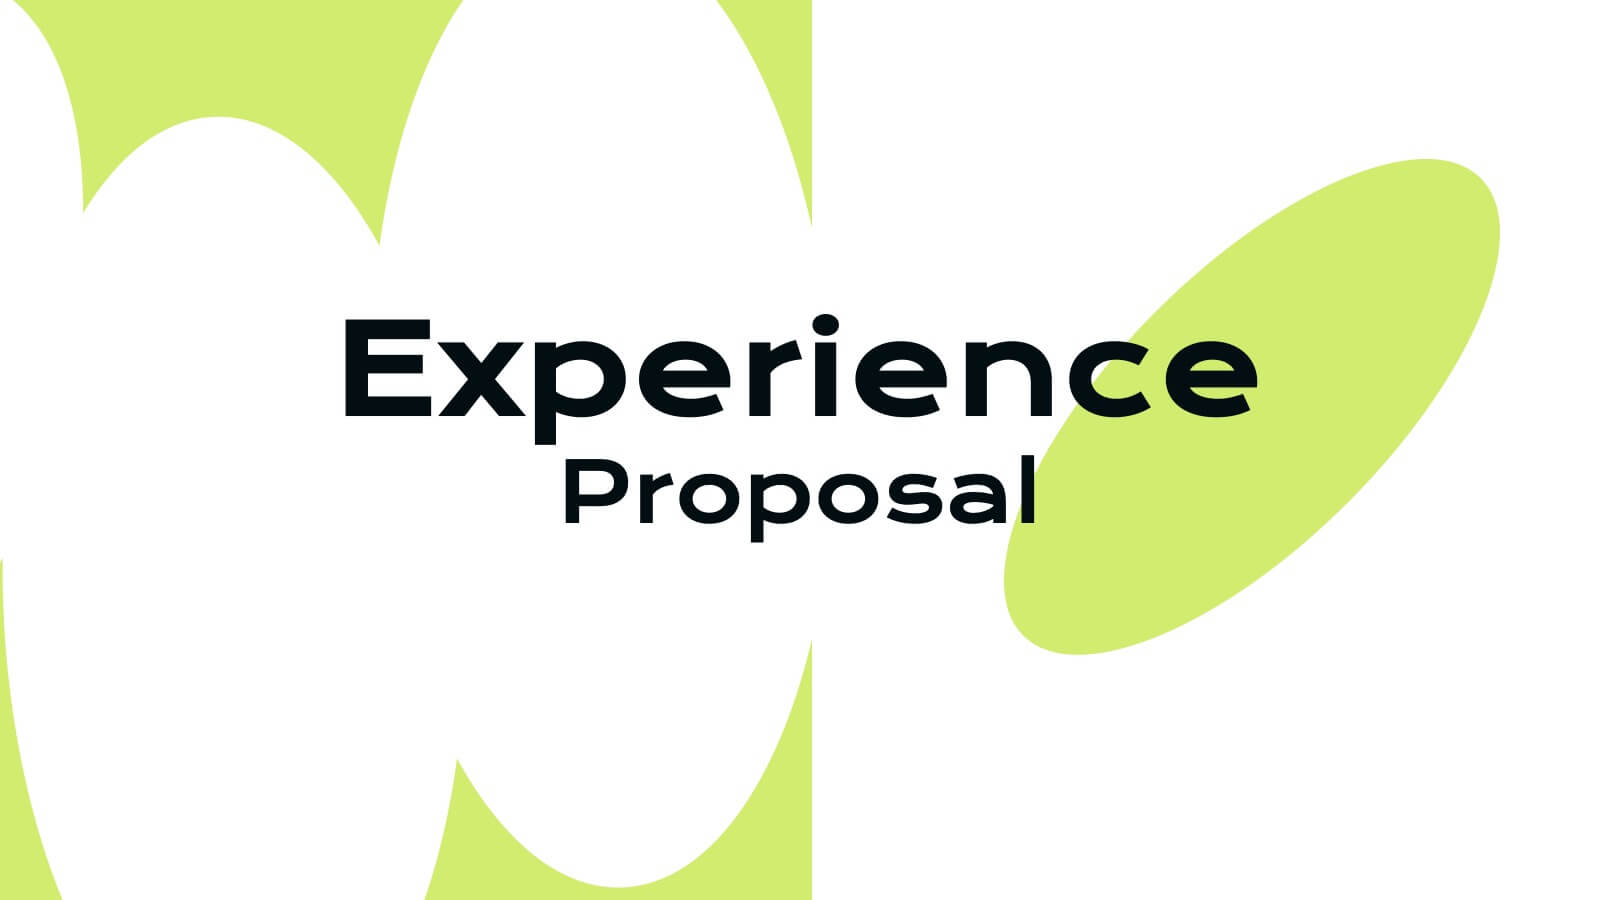
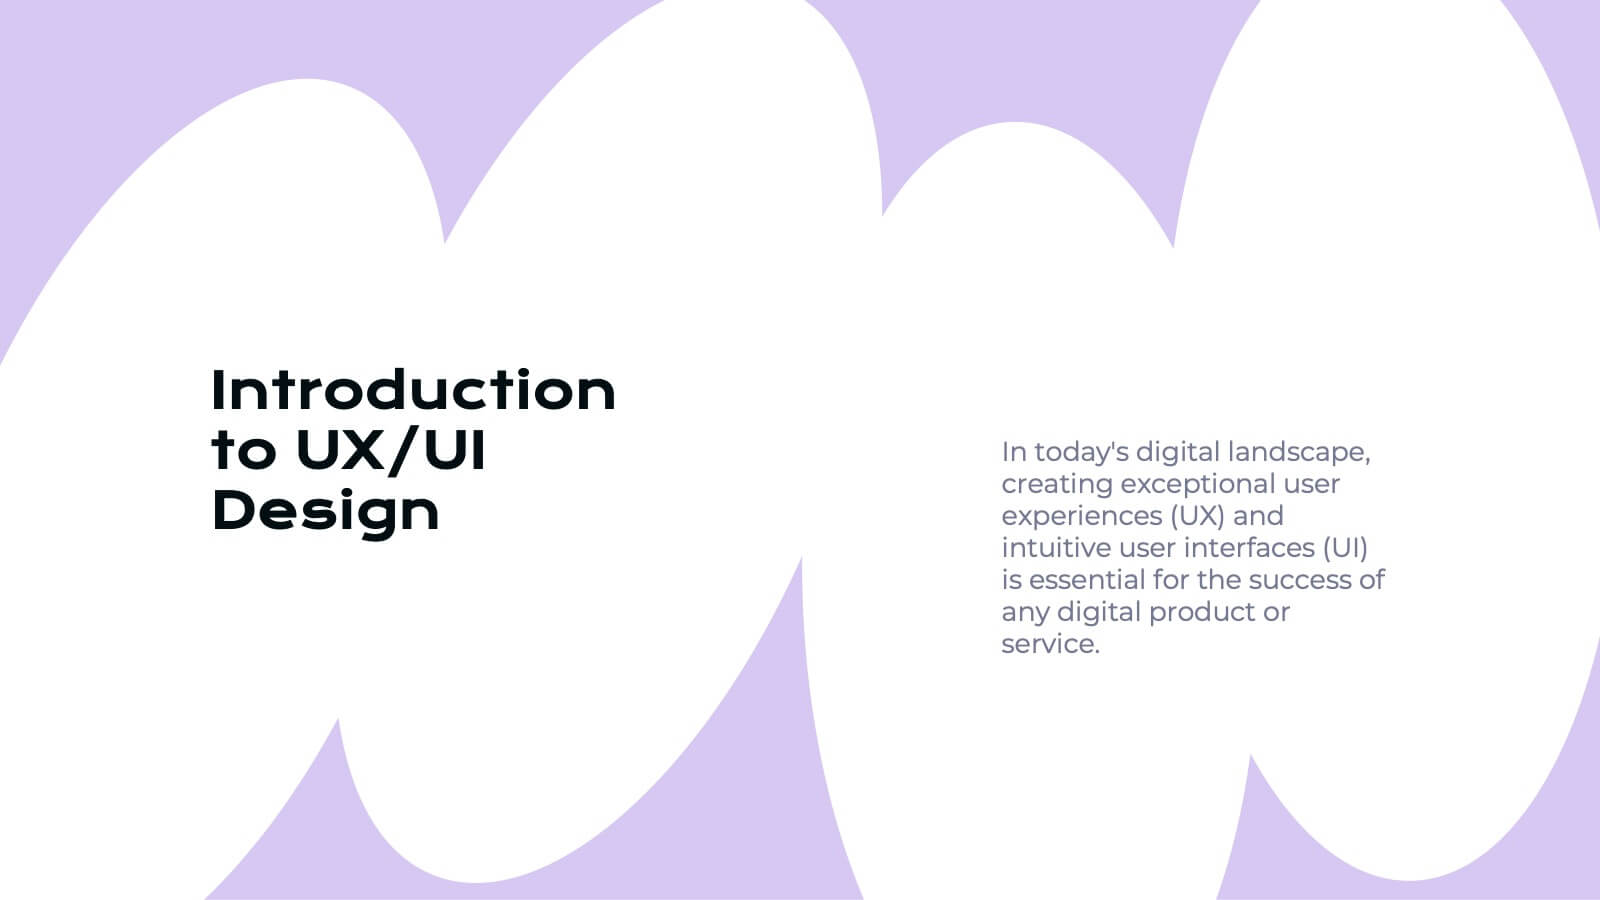
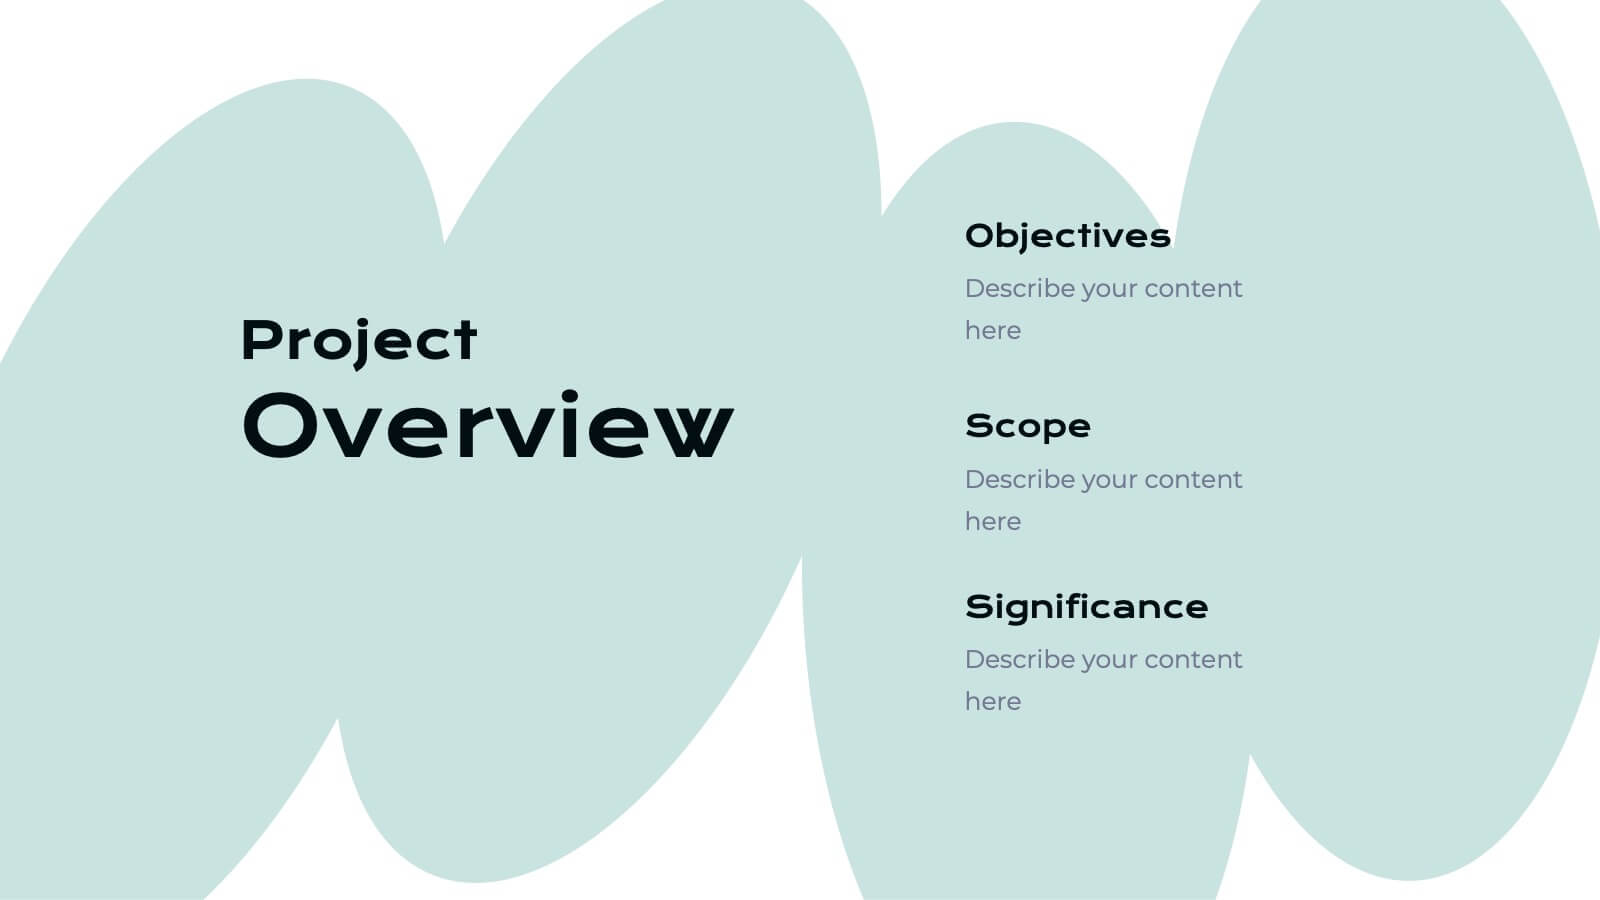
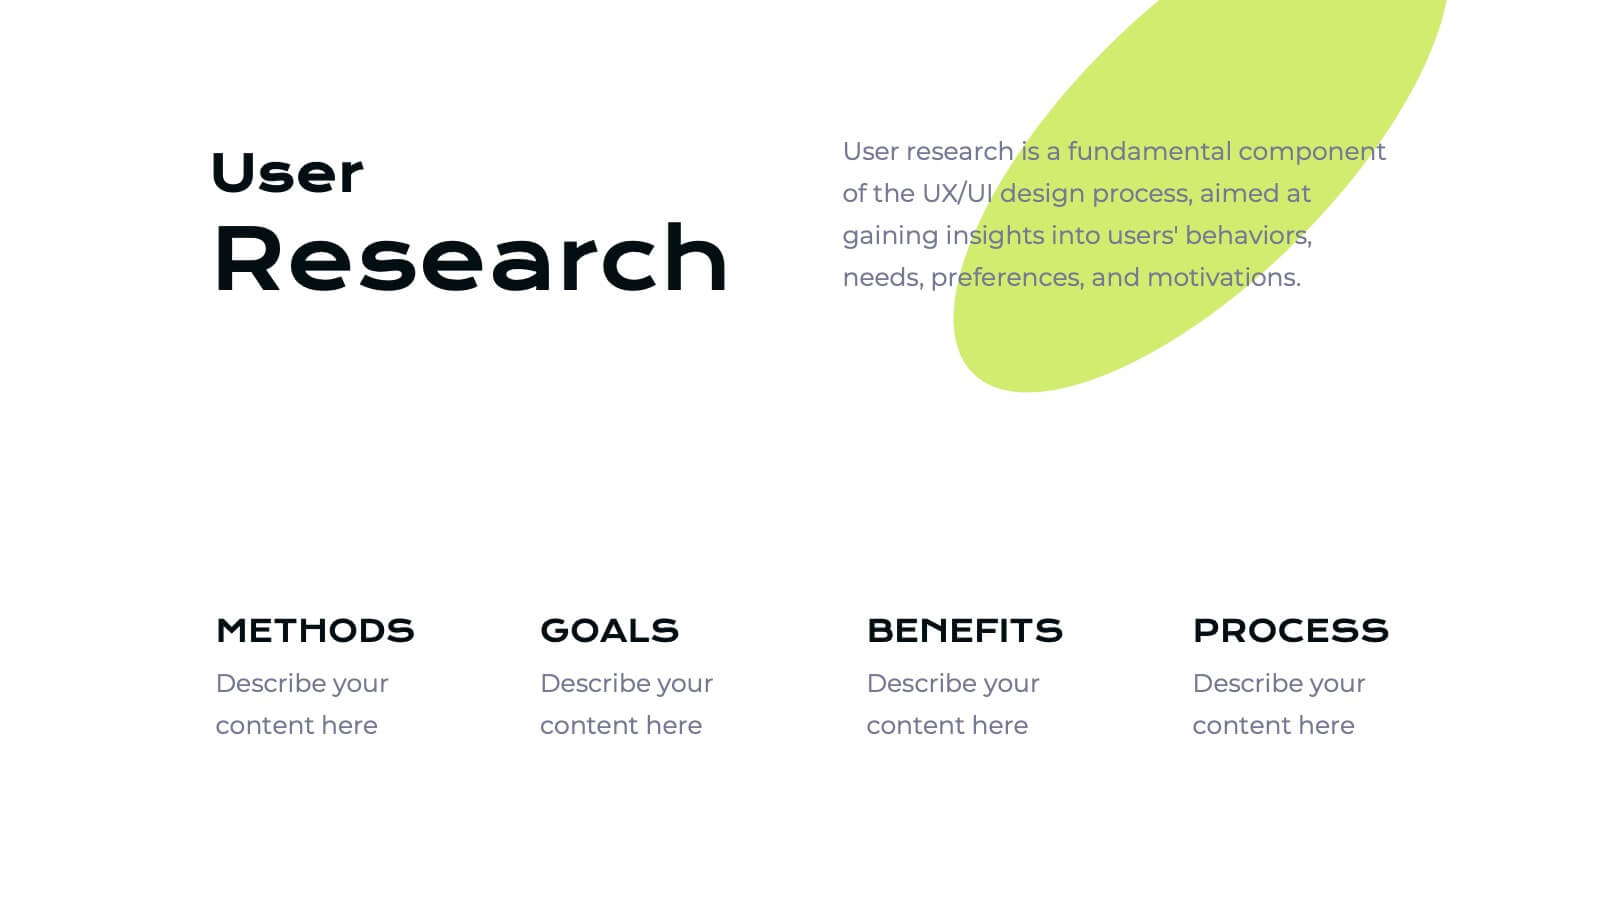
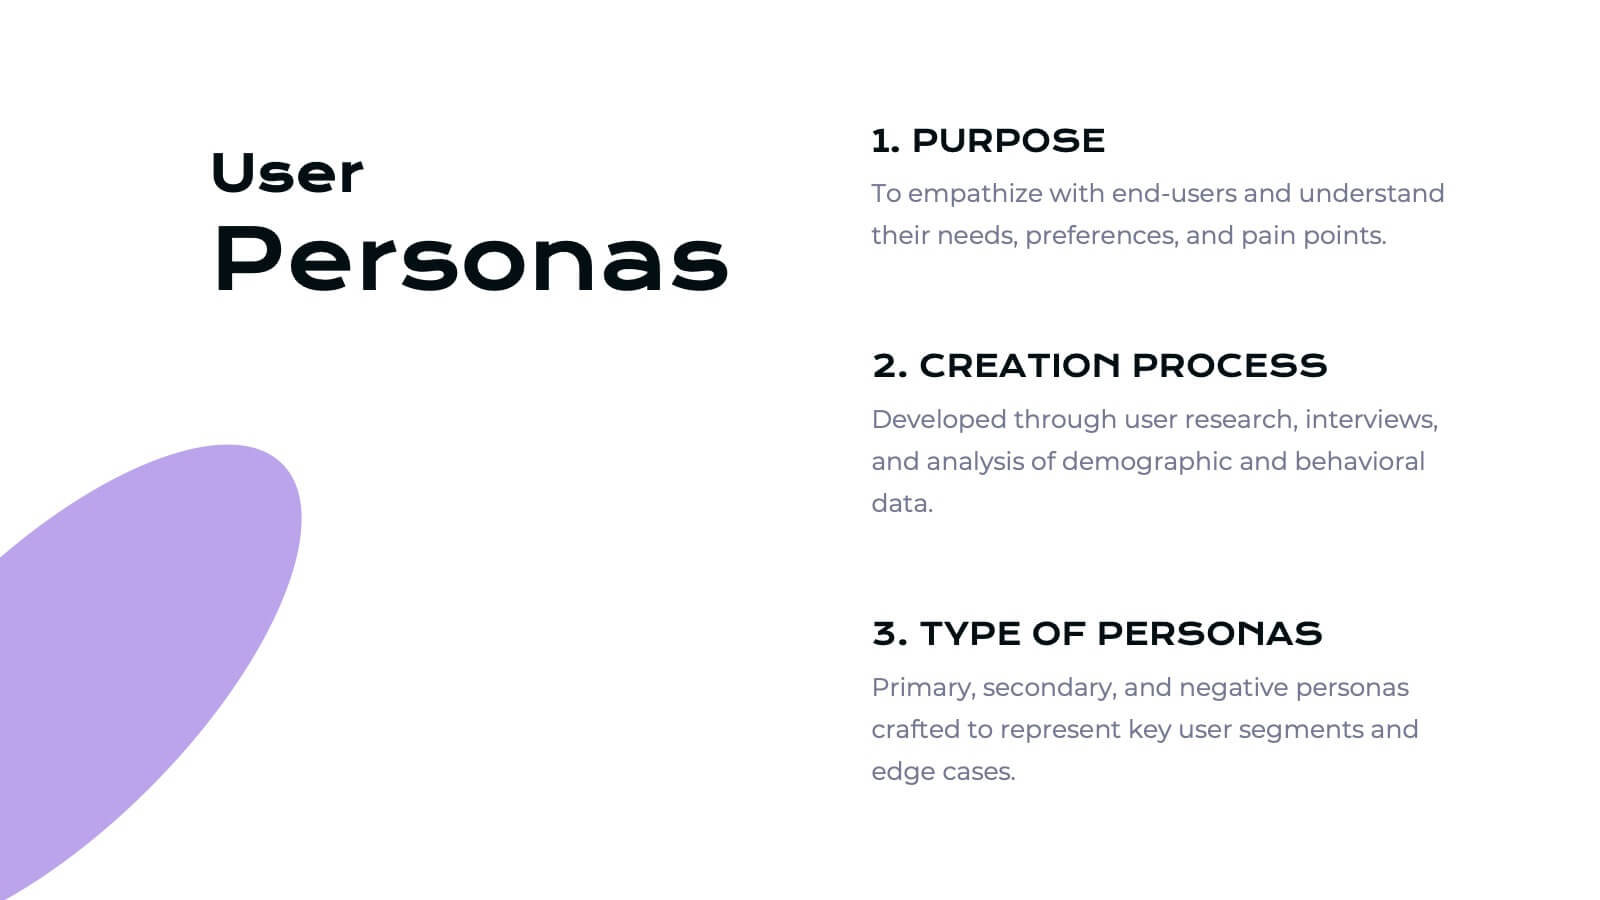
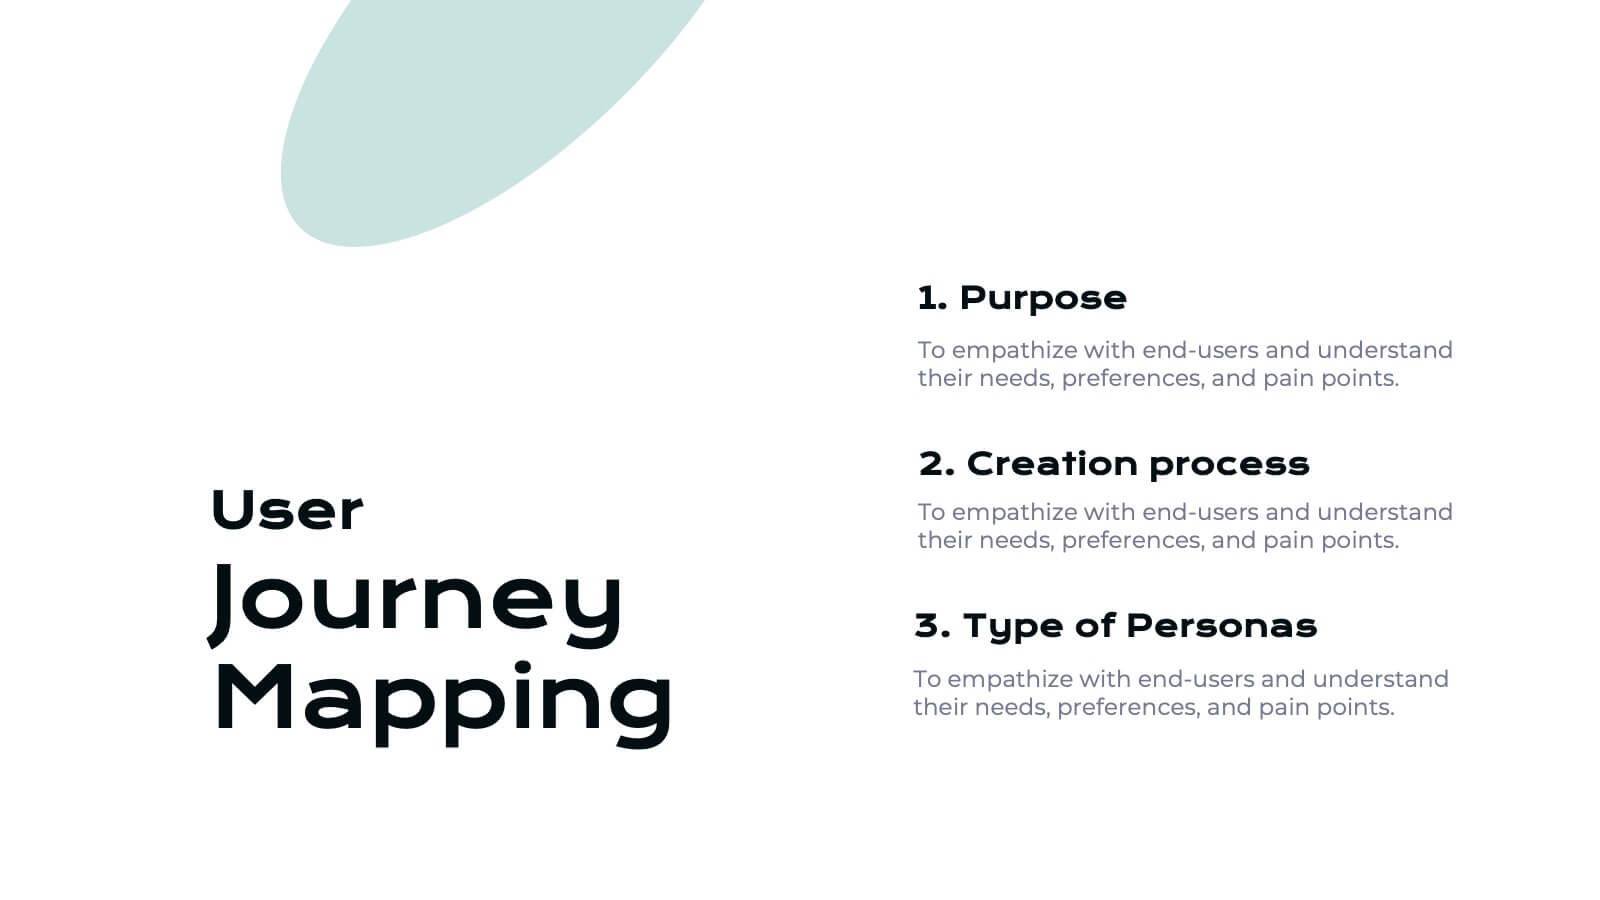
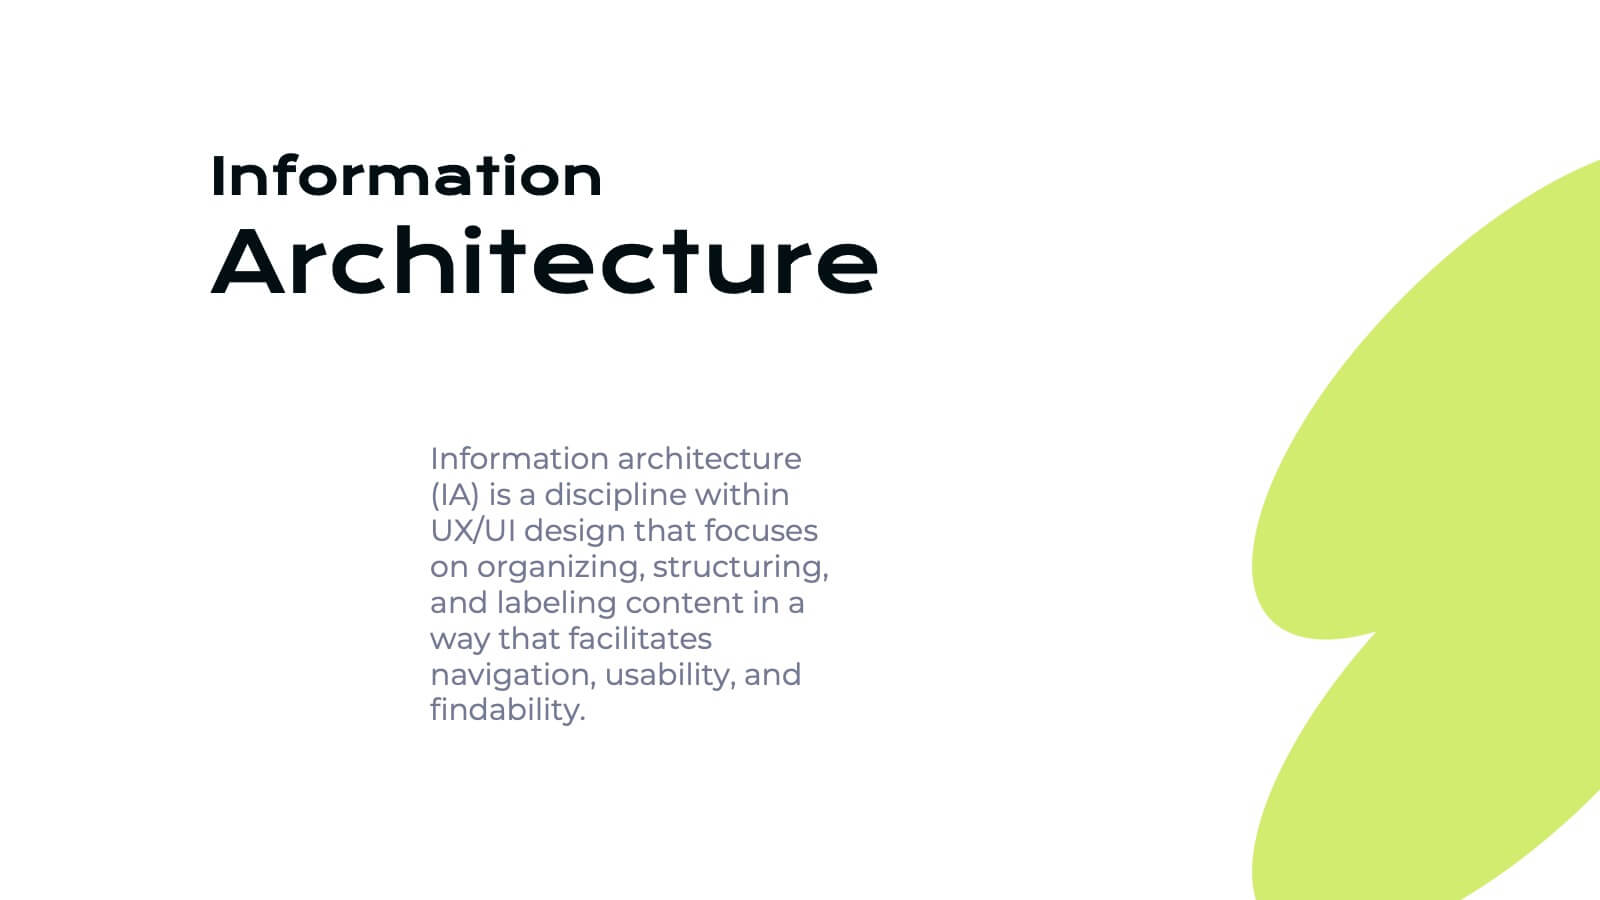
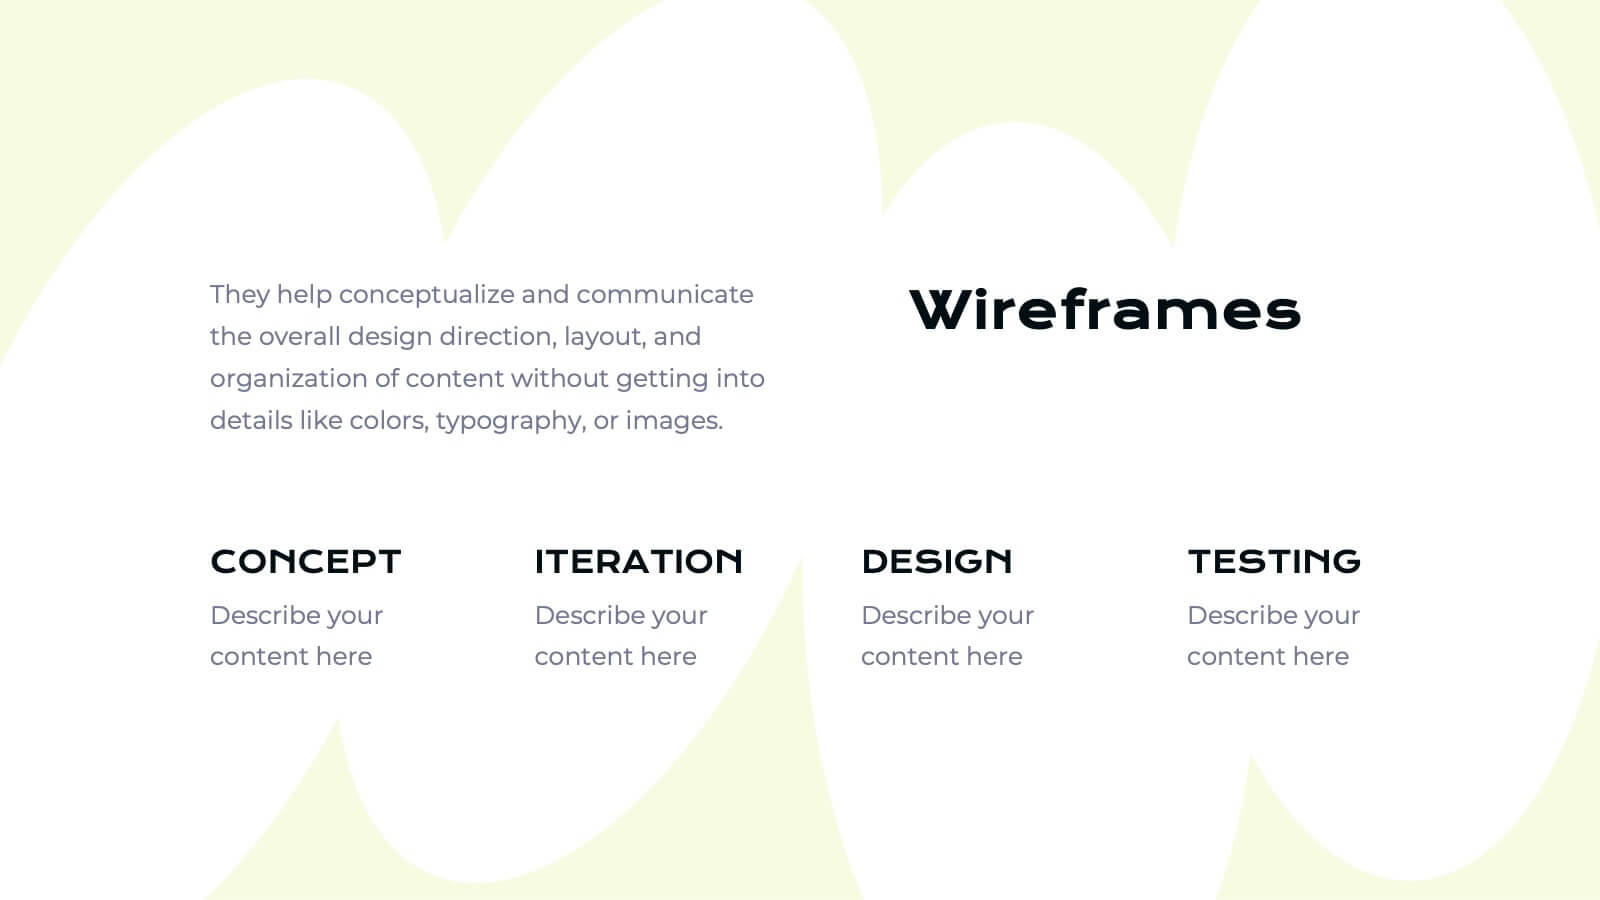
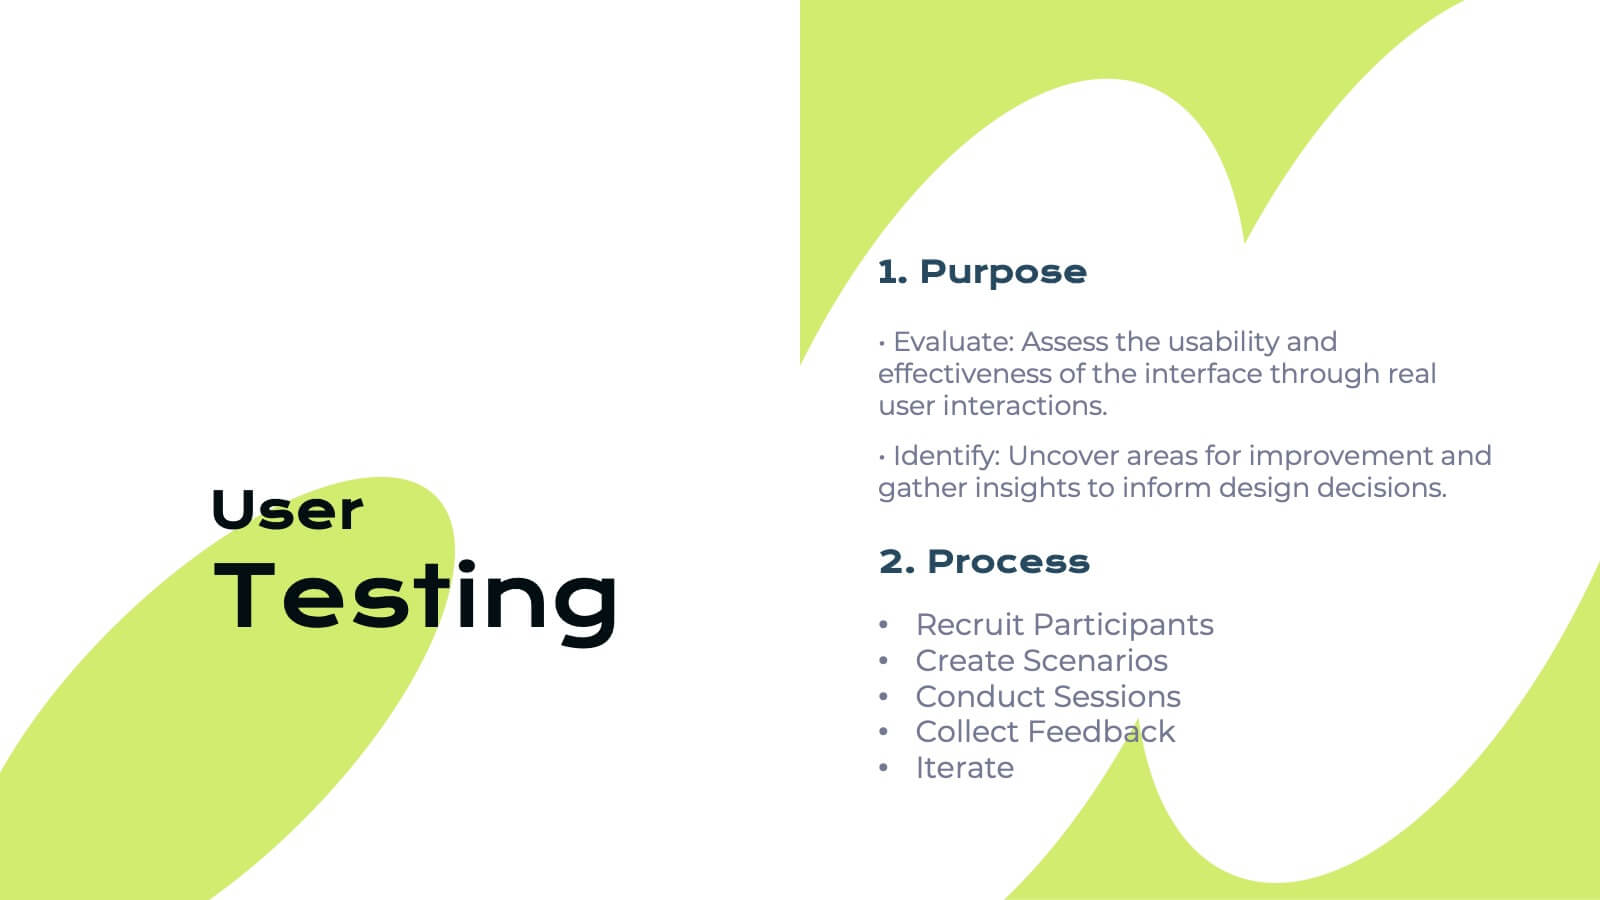
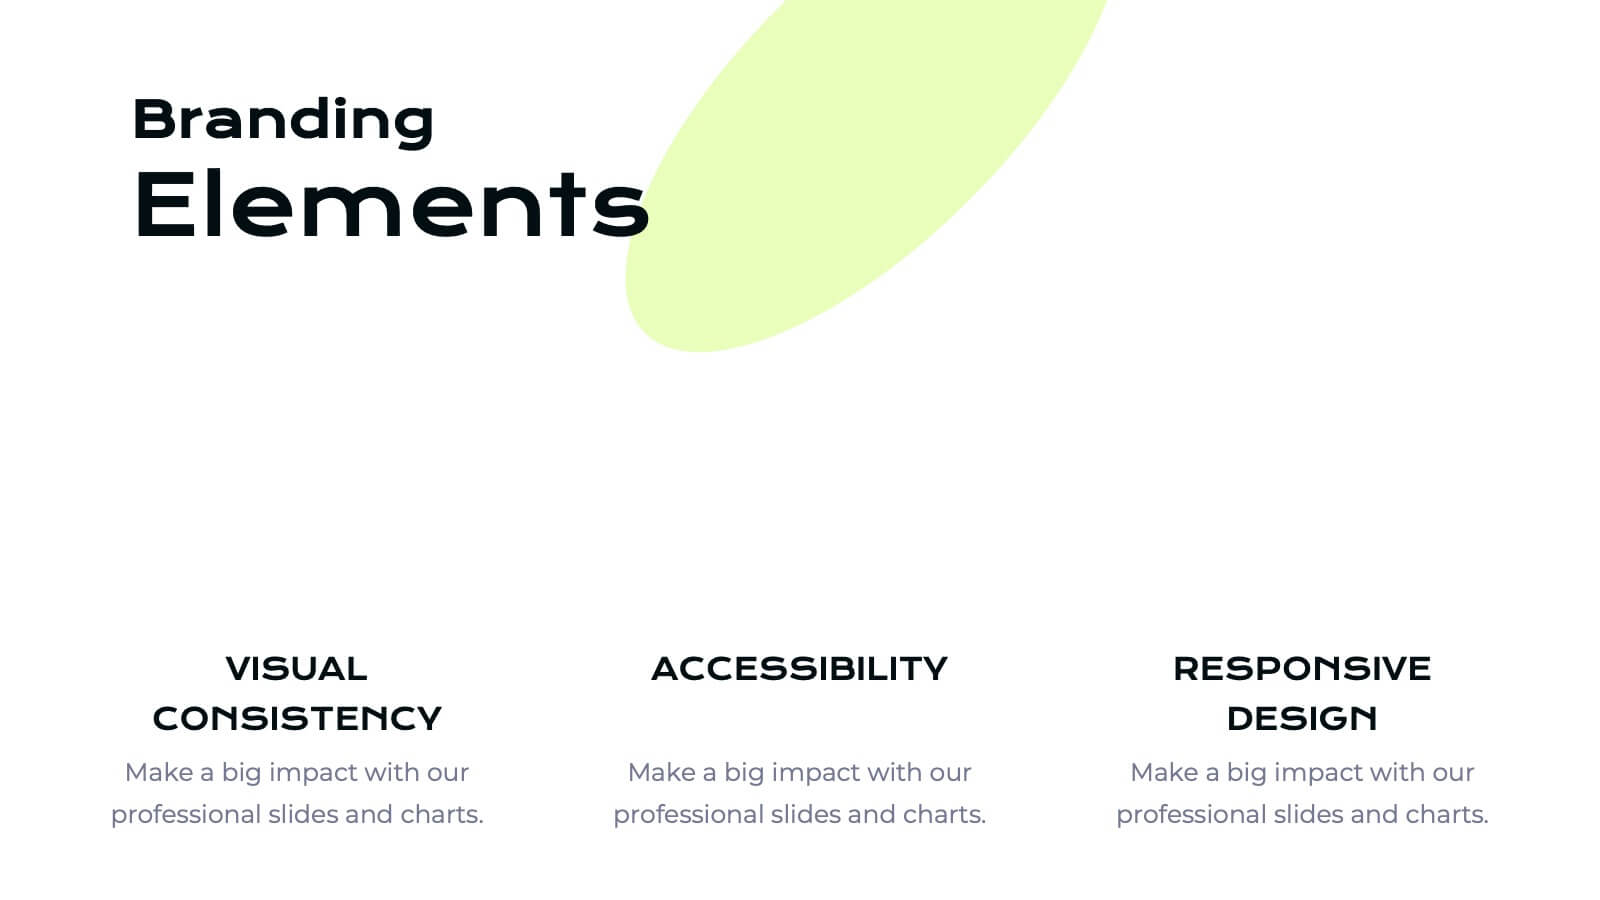
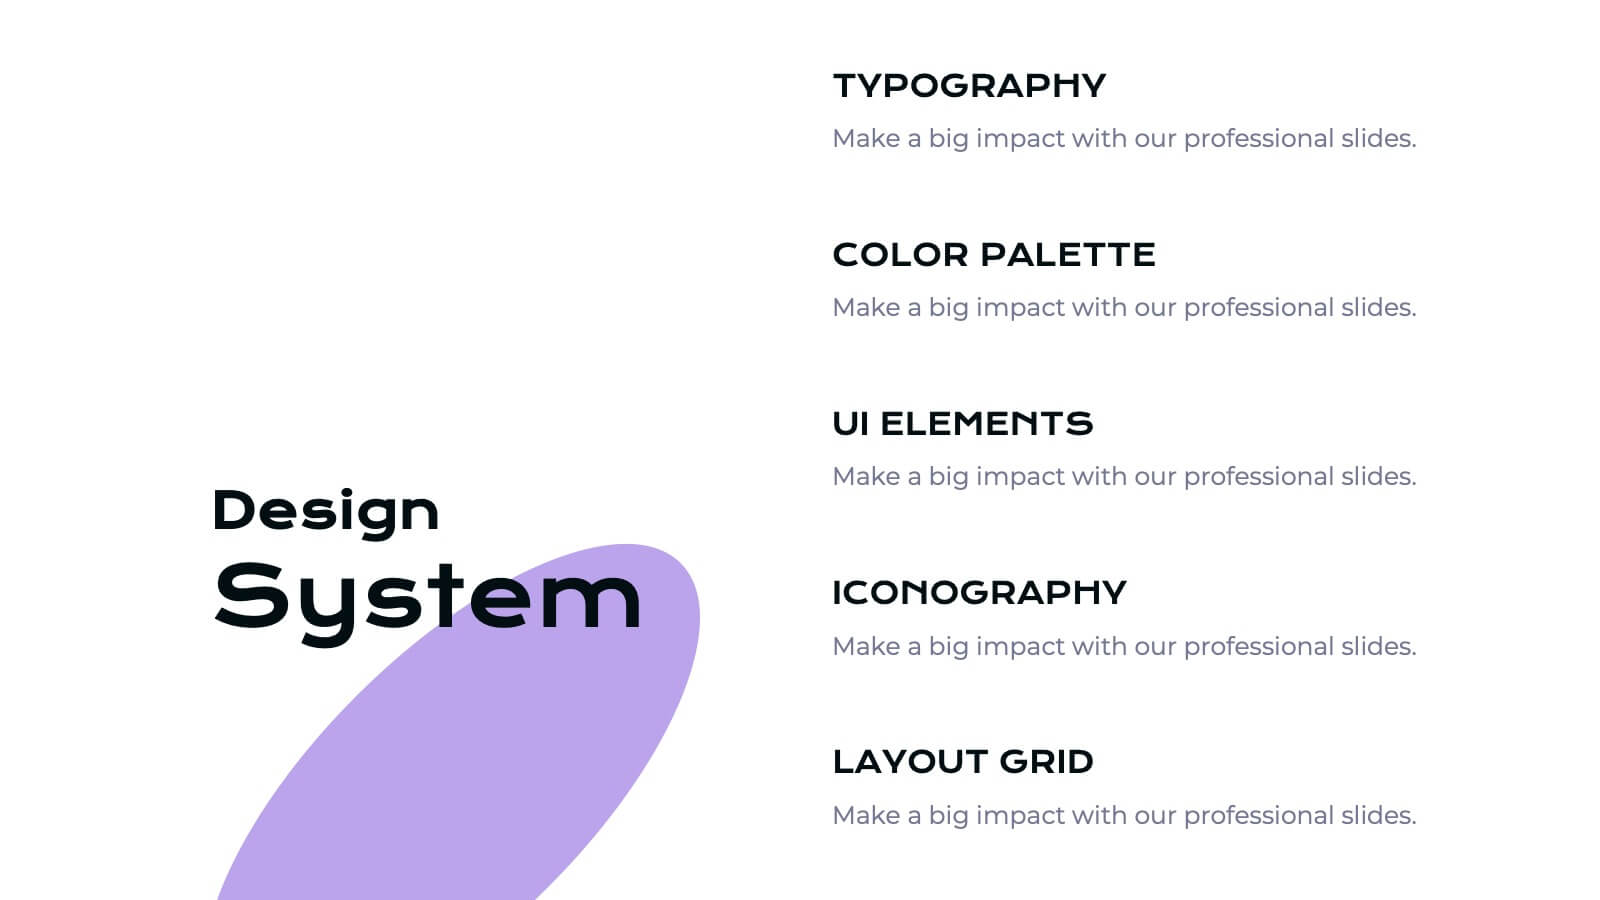
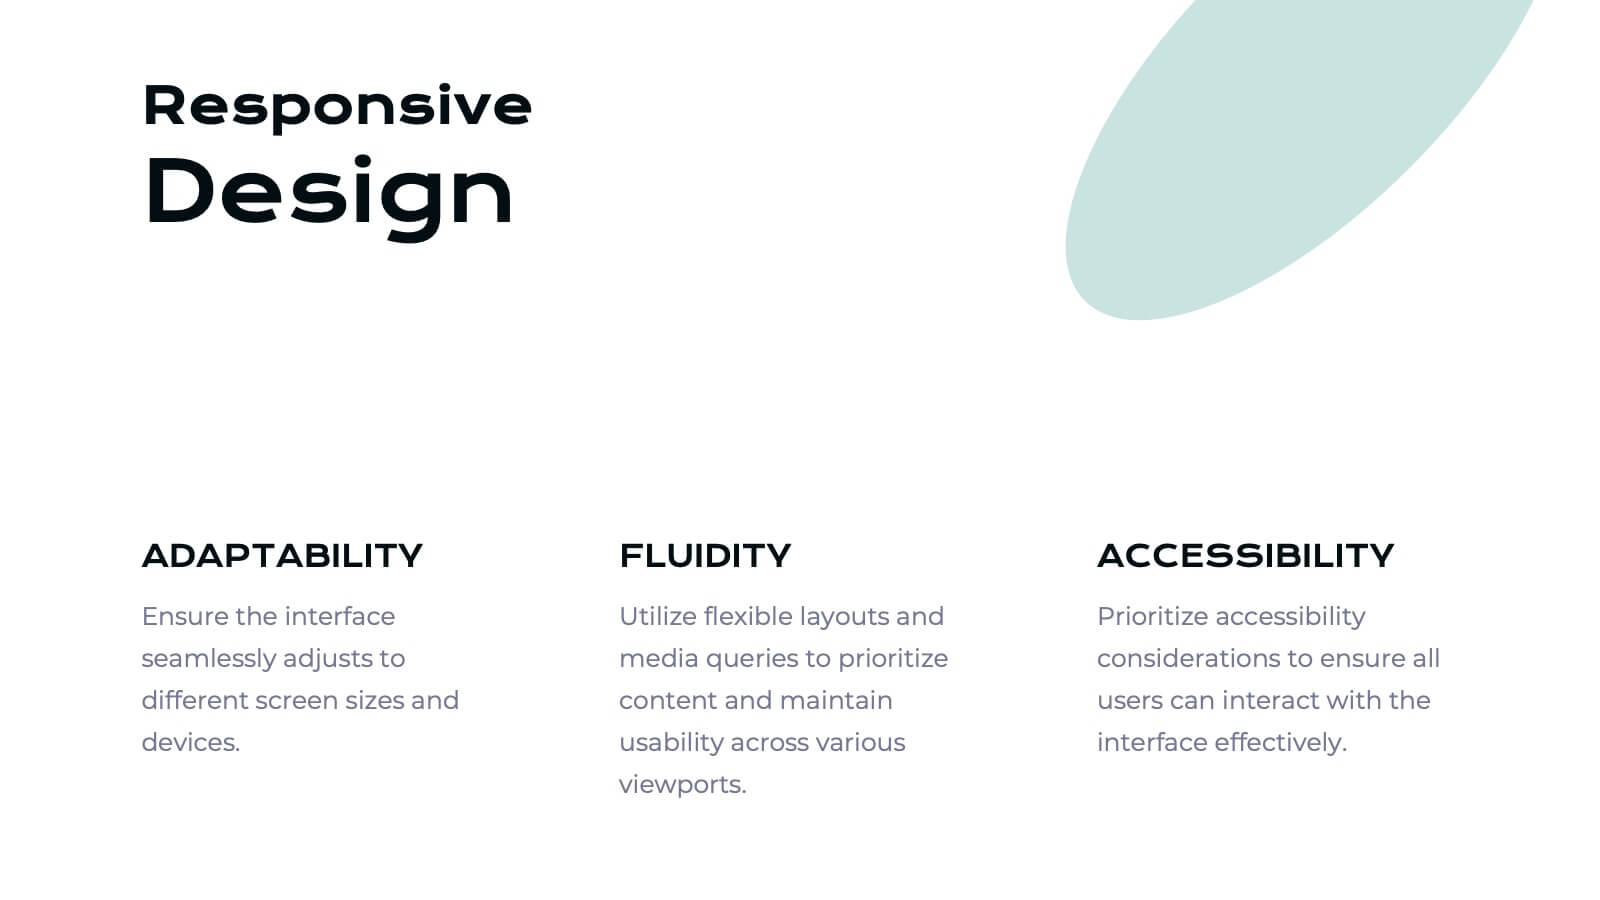
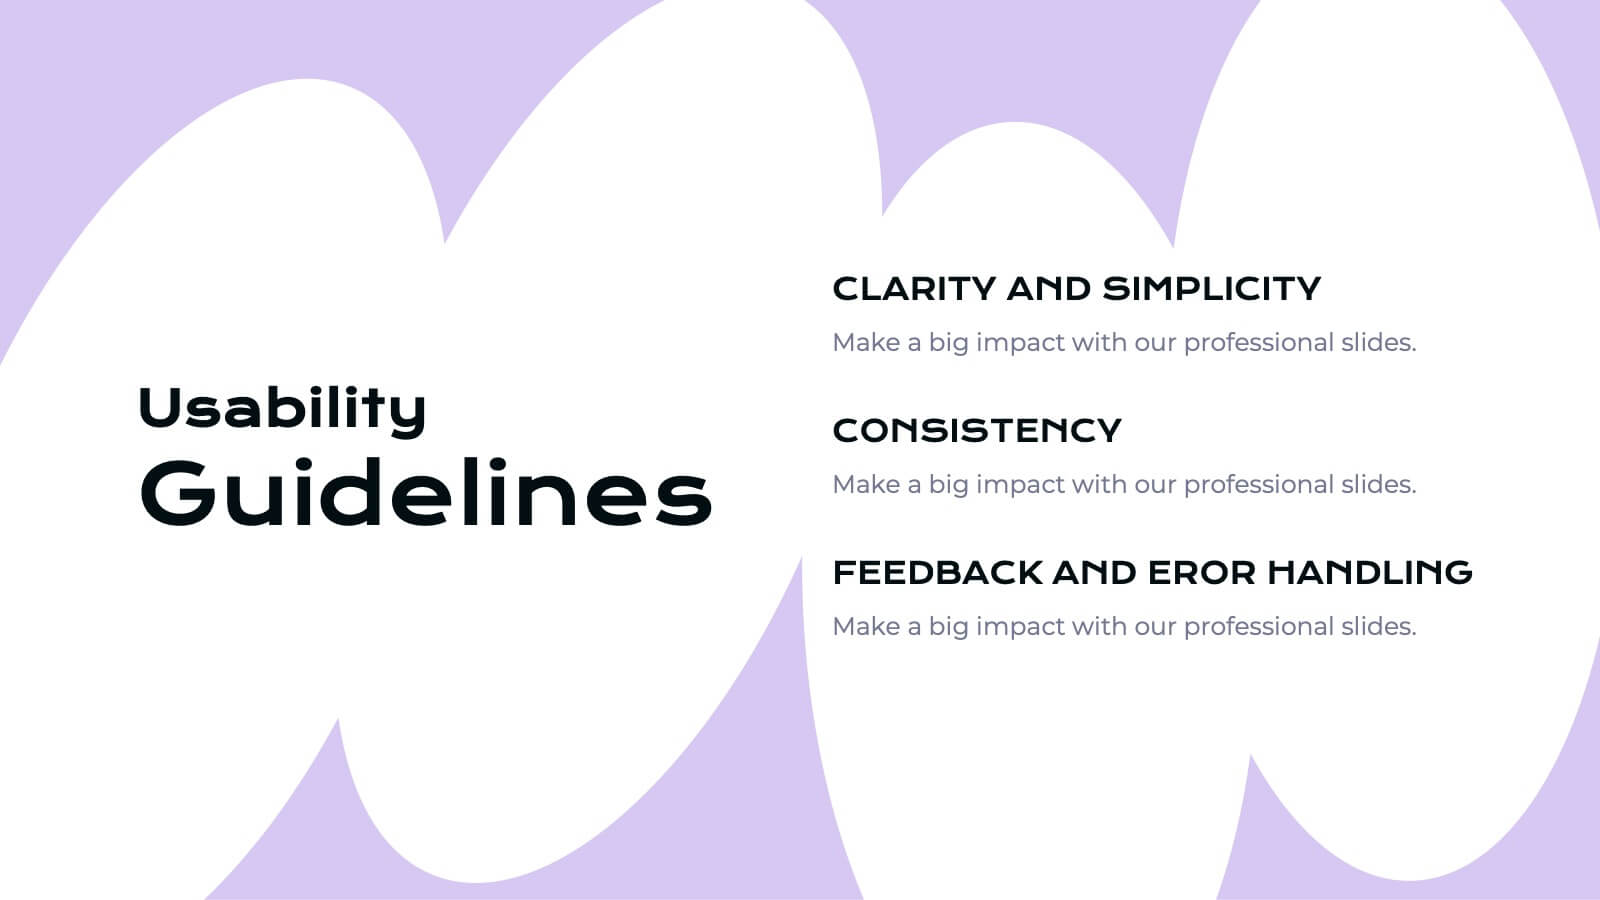
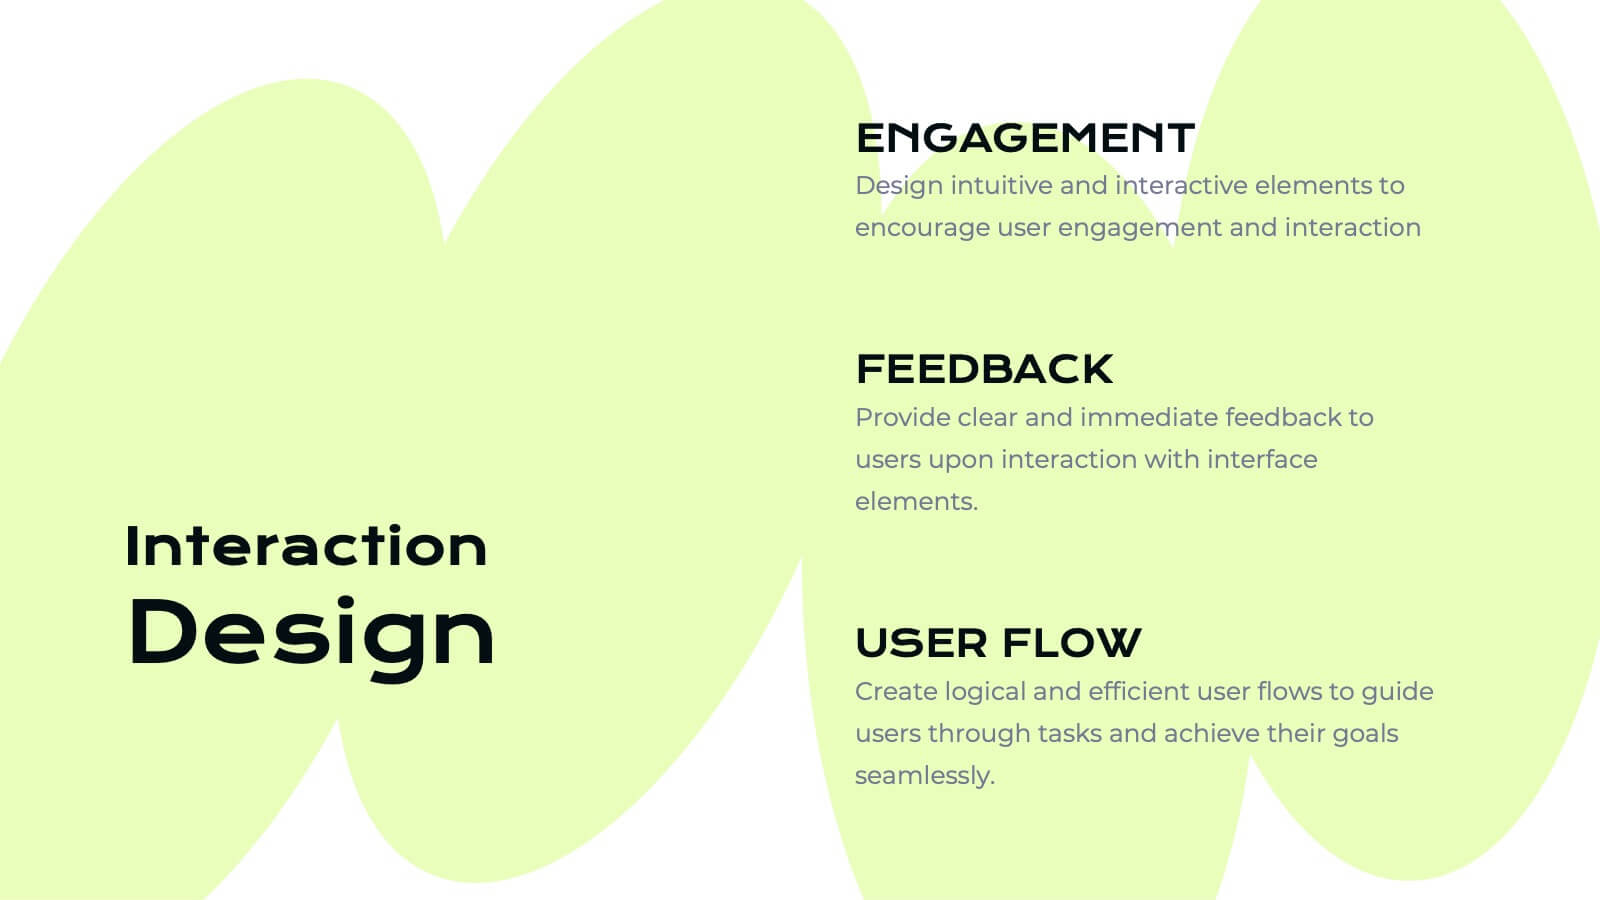
Ifrit User Experience Proposal Presentation
Unleash the power of great design with this fiery Ifrit-inspired presentation, perfect for delivering your user experience proposal! This template lets you showcase your UX strategies, research, and design process in a visually striking and well-organized format. Impress stakeholders with every slide. Compatible with PowerPoint, Keynote, and Google Slides.


3 diapositivas
Designing a Loyalty Program Presentation
Build stronger customer connections with a sleek, modern layout that highlights how reward systems drive retention and engagement. This design is perfect for visualizing loyalty strategies, program tiers, and user benefits with clarity and style. Fully editable and compatible with PowerPoint, Keynote, and Google Slides for effortless customization.


21 diapositivas
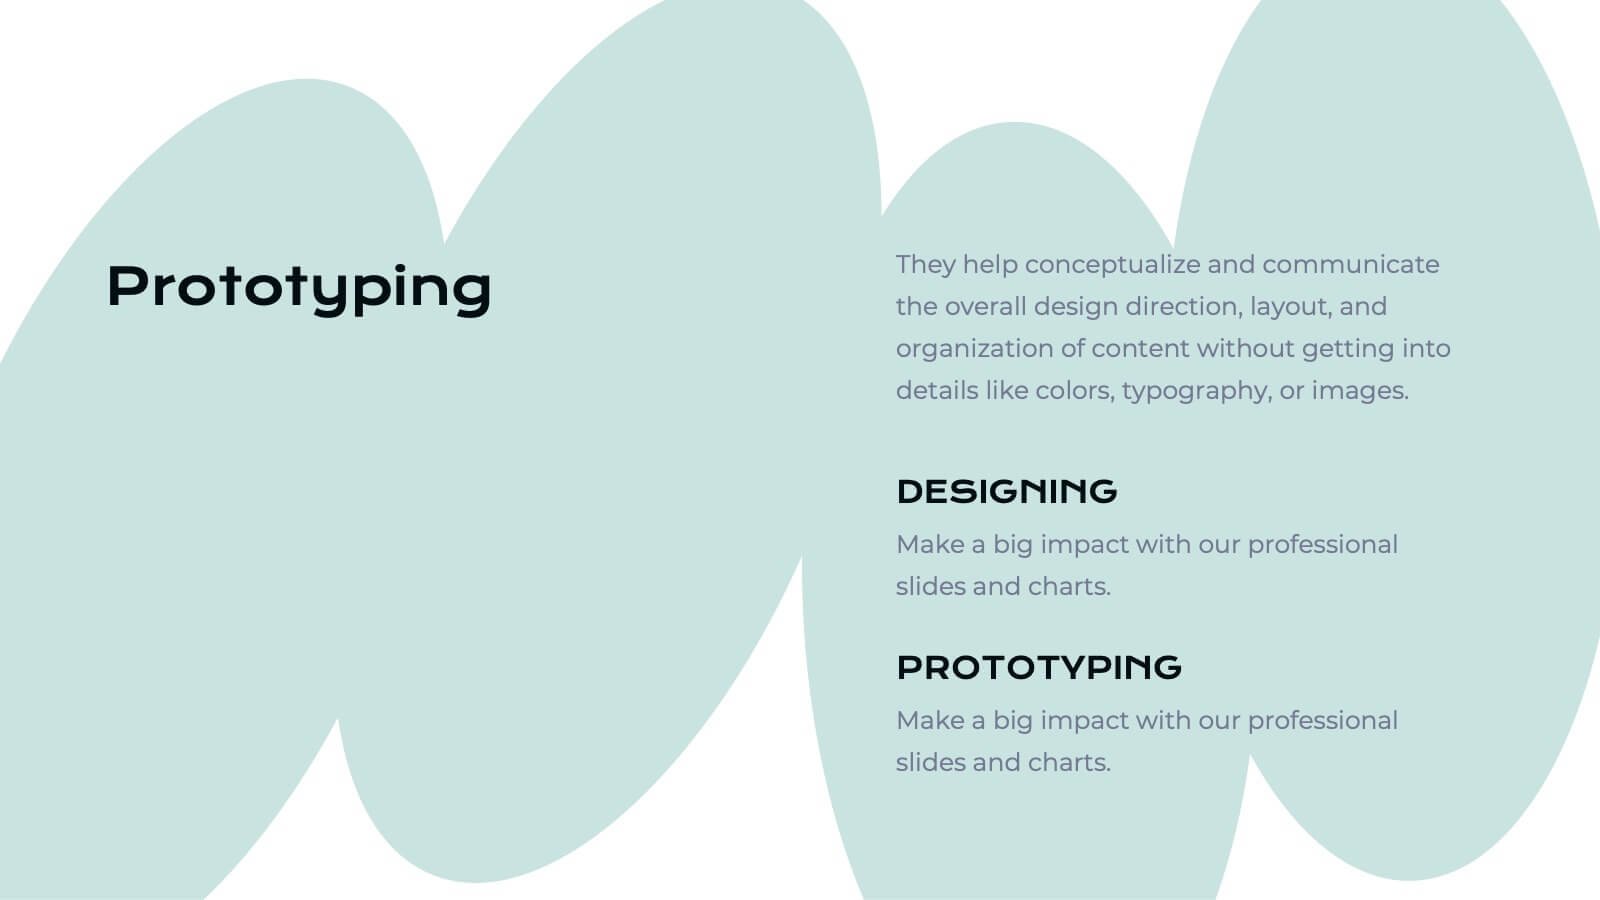
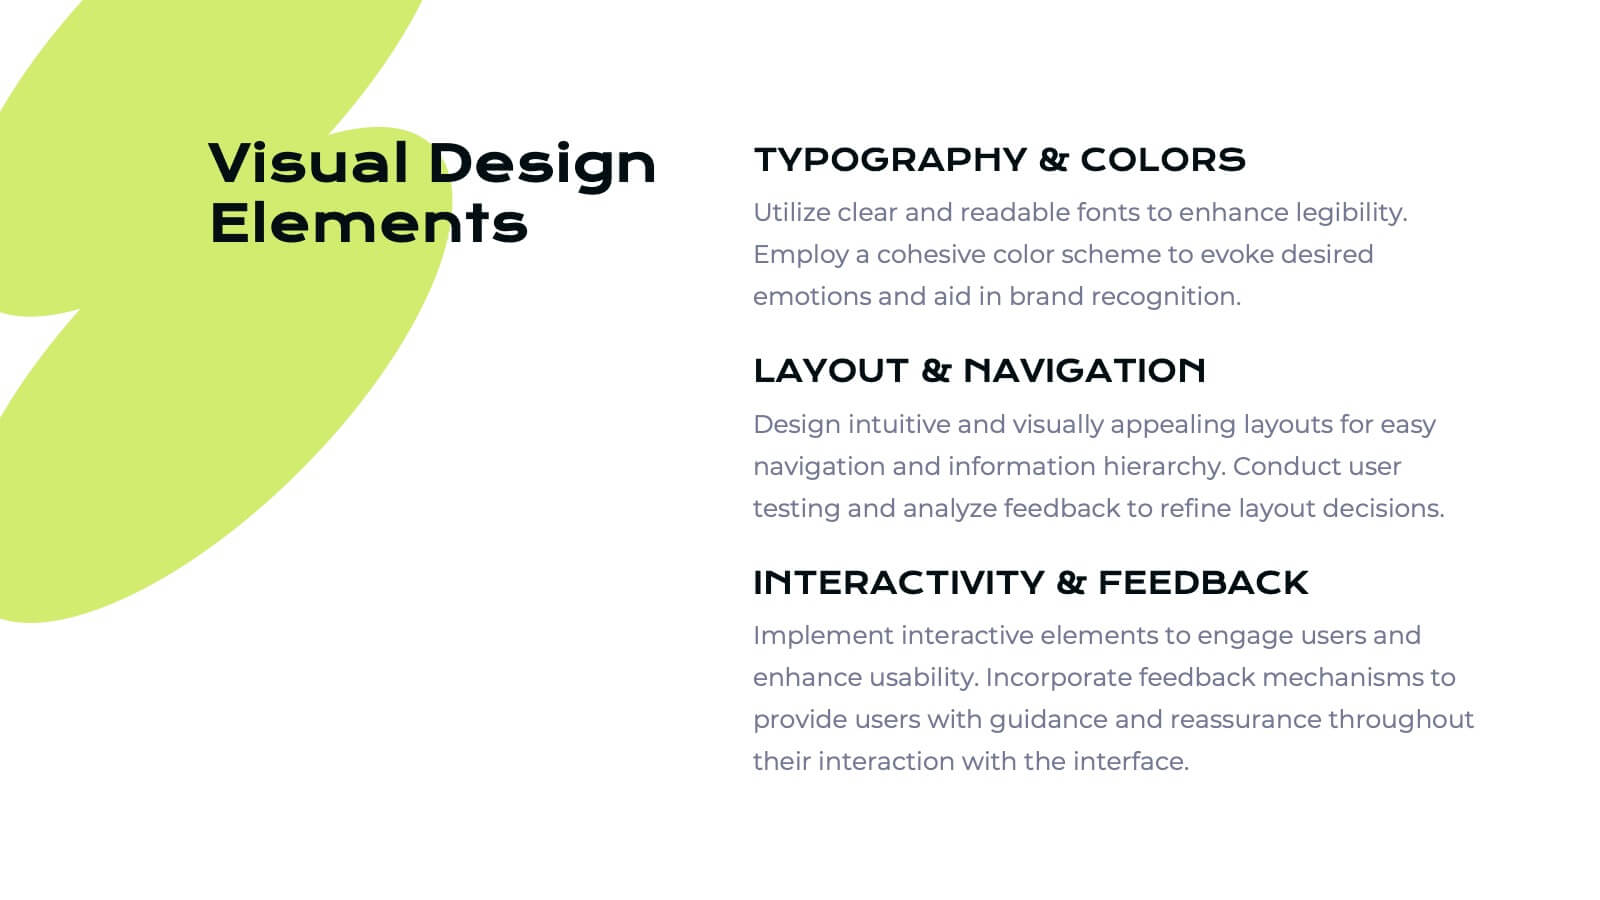
Ember Echo Graphic Design Project Plan Presentation
The Ember Graphic Design Project Plan template is the perfect canvas for your creative journey! Kickstart your project with a sleek and professional introduction that sets the tone for your design vision. This template is designed to guide you through every step of the design process, from the initial brief to the final presentation. Highlight your target audience, concept development, and design elements with beautifully crafted slides that capture the essence of your project. Dive into the specifics with dedicated sections for brand identity components, textures, and the design process itself, ensuring that every detail is covered. The template also includes mood boards, prototypes, and design assets, making it easy to showcase your work in progress. With feedback and testing slides, you can iterate and refine your designs before presenting the final product. This template is fully compatible with PowerPoint, Keynote, and Google Slides, making it versatile and easy to use for any creative project.


21 diapositivas
Parthenon Marketing Proposal Template Presentation
Create an impactful marketing proposal with this vibrant and modern presentation template! Covering key sections such as industry overview, consumer behavior, social media strategies, and emerging technologies, it helps you present your marketing insights with style. Fully customizable and perfect for data-driven marketing plans, this template is compatible with PowerPoint, Keynote, and Google Slides for seamless presentation delivery.


4 diapositivas
Team Planning and Event Calendar
Turn chaos into coordination with this visual-first layout that simplifies how your team plans, tracks, and communicates project milestones. Each calendar block highlights key players, deadlines, and status updates—perfect for keeping everyone aligned and informed at a glance. Fully compatible with PowerPoint, Keynote, and Google Slides.


23 diapositivas
Cosmira Digital Strategy Presentation
This Digital Strategy Presentation provides a comprehensive framework for outlining business objectives, competitive analysis, and growth opportunities. It includes key sections such as SWOT analysis, performance metrics, and implementation plans. Ideal for businesses and marketers, the slides are fully editable and compatible with PowerPoint, Keynote, and Google Slides.


22 diapositivas
Etherwind Advertising Agency Proposal Presentation
This Advertising Agency Proposal Presentation Template offers a sleek and professional layout, perfect for showcasing your agency's capabilities, services, and success stories. Covering essential sections such as market analysis, strategy development, campaign execution, and client testimonials, it ensures a compelling pitch to potential clients. Designed for easy customization in PowerPoint, Keynote, and Google Slides, making it a versatile choice for agencies looking to impress their audience.


4 diapositivas
Risk Impact Matrix Grid Presentation
Visualize project risk with this customizable impact matrix grid. Designed for quick risk assessment, it helps you map likelihood versus impact using color-coded indicators and clean grid layouts. Ideal for strategic planning, audits, or compliance meetings. Compatible with PowerPoint, Google Slides, and Keynote for seamless editing and professional presentations.


2 diapositivas
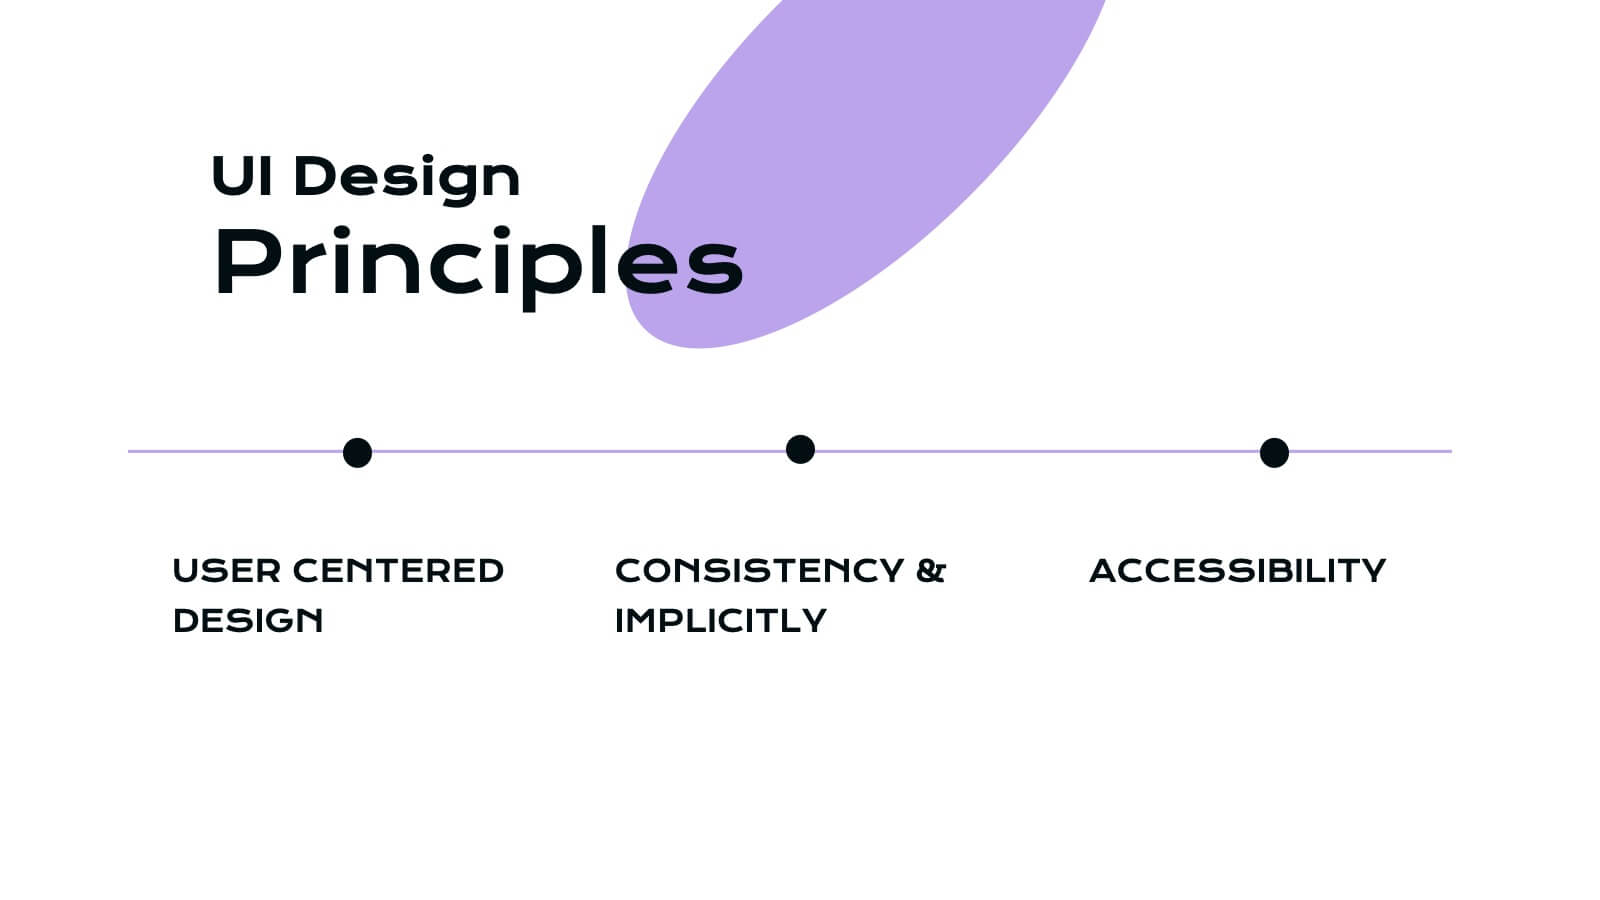
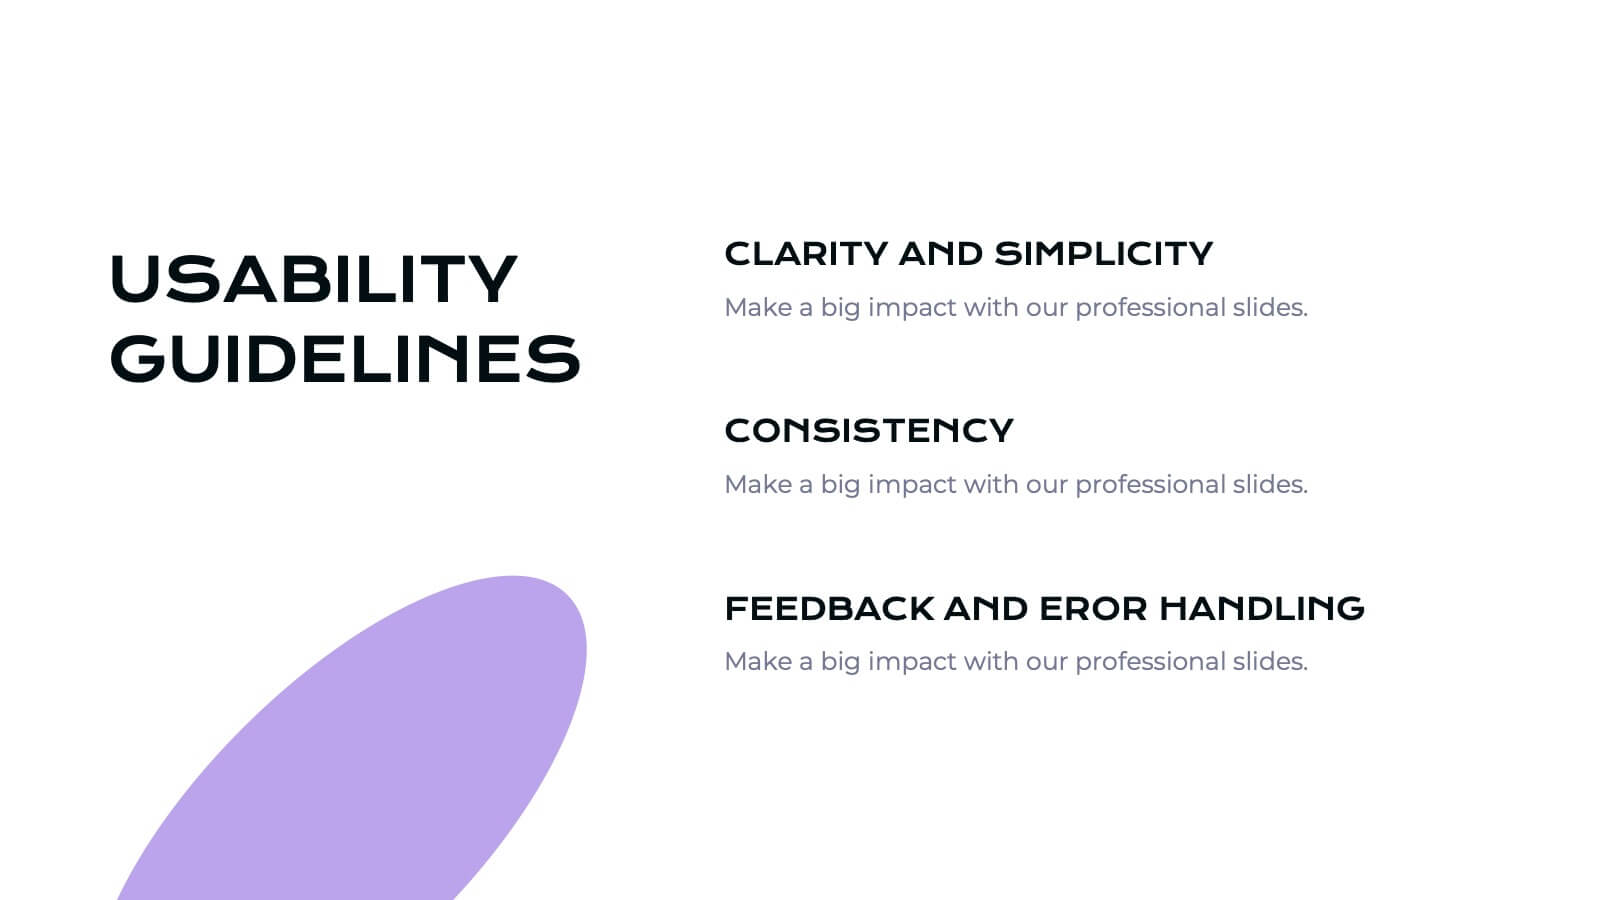
Opening Company Profile Introduction Presentation
Make a bold first impression with the Opening Company Profile Introduction Presentation — a sleek, modern design perfect for business overviews, team intros, or brand missions. Featuring clean typography and a purple accent shape that adds personality without distraction, this layout is ideal for concise, professional messaging. Fully editable and compatible with Canva, PowerPoint, Google Slides, and Keynote.


7 diapositivas
Demographic Traits Infographic
Dive deep into the world of demographics with our demographic traits infographic. Painted in hues of white, yellow, and blue, this infographic expertly visualizes population data within a map layout, ensuring a cohesive understanding of varied traits across regions. Tailored for market researchers, sociologists, business analysts, and educators, this tool is designed to make complex demographic data comprehensible and engaging. Whether you're using PowerPoint, Keynote, or Google Slides, our infographic will seamlessly fit, elevating the quality and clarity of your presentation.


22 diapositivas
Transmuton Creative Agency Pitch Deck Presentation
Showcase your agency’s creativity and expertise with this bold and modern pitch deck presentation. Covering key areas like campaign execution, strategy development, client success stories, and market analysis, this template helps you present a compelling vision. Fully customizable and compatible with PowerPoint, Keynote, and Google Slides for a seamless presentation experience.


5 diapositivas
Cyber Security Best Practices Infographics
Navigate the digital landscape safely with our cyber security best practices infographics. Crafted in a striking combination of black with colorful accents, this creative, vertical template is a powerhouse of cyber safety education. It's an indispensable resource for IT professionals, and educators seeking to propagate security protocols. The design encapsulates compelling graphics, intuitive icons, and dedicated placeholders. Compatible with Powerpoint, Keynote, and Google Slides. By employing this infographic, users can foster a culture of digital vigilance and defense, making it an asset in the fight against online threats.


7 diapositivas
Innovation Infographics Presentation Template
Our innovation Infographic template is a trendy and professional way to present innovation to your audience in a way that keeps them engaged. This design features simple yet striking elements which will deliver your message, while the font and color scheme gives you that flexibility to personalize this template to your brand’s identity. We have designed this presentation template to help you create and deliver engaging content for your audience. It is a powerful tool that helps you build interest, generate leads and position yourself as an authority on the subject of innovation.


7 diapositivas
PESTEL Analysis Marketing Infographic
PESTEL Analysis, often referred to as PESTLE Analysis, is a strategic management tool used to analyze and evaluate external macro-environmental factors that can impact an organization. This infographic template is a comprehensive and visually captivating template that unravels the strategic insights derived from the PESTEL analysis in the realm of marketing. Explore the critical external factors that influence your marketing strategy and steer your business towards success. Compatible with Powerpoint, Keynote, and Google Slides. Empower your marketing strategies with our PESTEL Analysis Marketing Infographic!


2 diapositivas
Creative Gratitude Slide
Wrap up your presentation with impact using this clean, modern “Thank You” slide. Featuring space for a photo, contact details, and playful design elements, it's perfect for leaving a lasting impression. Ideal for business proposals, pitch decks, and educational slide decks. Fully editable in PowerPoint, Keynote, and Google Slides.