


Características


¿Tienes alguna pregunta?
Recomendar


6 diapositivas
Strategy to Overcome Challenges Presentation
Get ready to chart a winning path with this dynamic visual roadmap! These slides help simplify complex strategies into clear steps to tackle business challenges head-on. Perfect for team alignment, leadership planning, and problem-solving workflows. Fully compatible with PowerPoint, Keynote, and Google Slides for flexible, professional presentations.


6 diapositivas
Business Competitive Analysis Presentation
Evaluate your market position with the Business Competitive Analysis Presentation. This structured template provides a clear side-by-side comparison of key business factors like price, quality, features, speed, and service against competitors. Ideal for strategy planning, business development, and market research, it features customizable colors, text, and layouts. Compatible with PowerPoint, Keynote, and Google Slides for seamless editing and presentation.


5 diapositivas
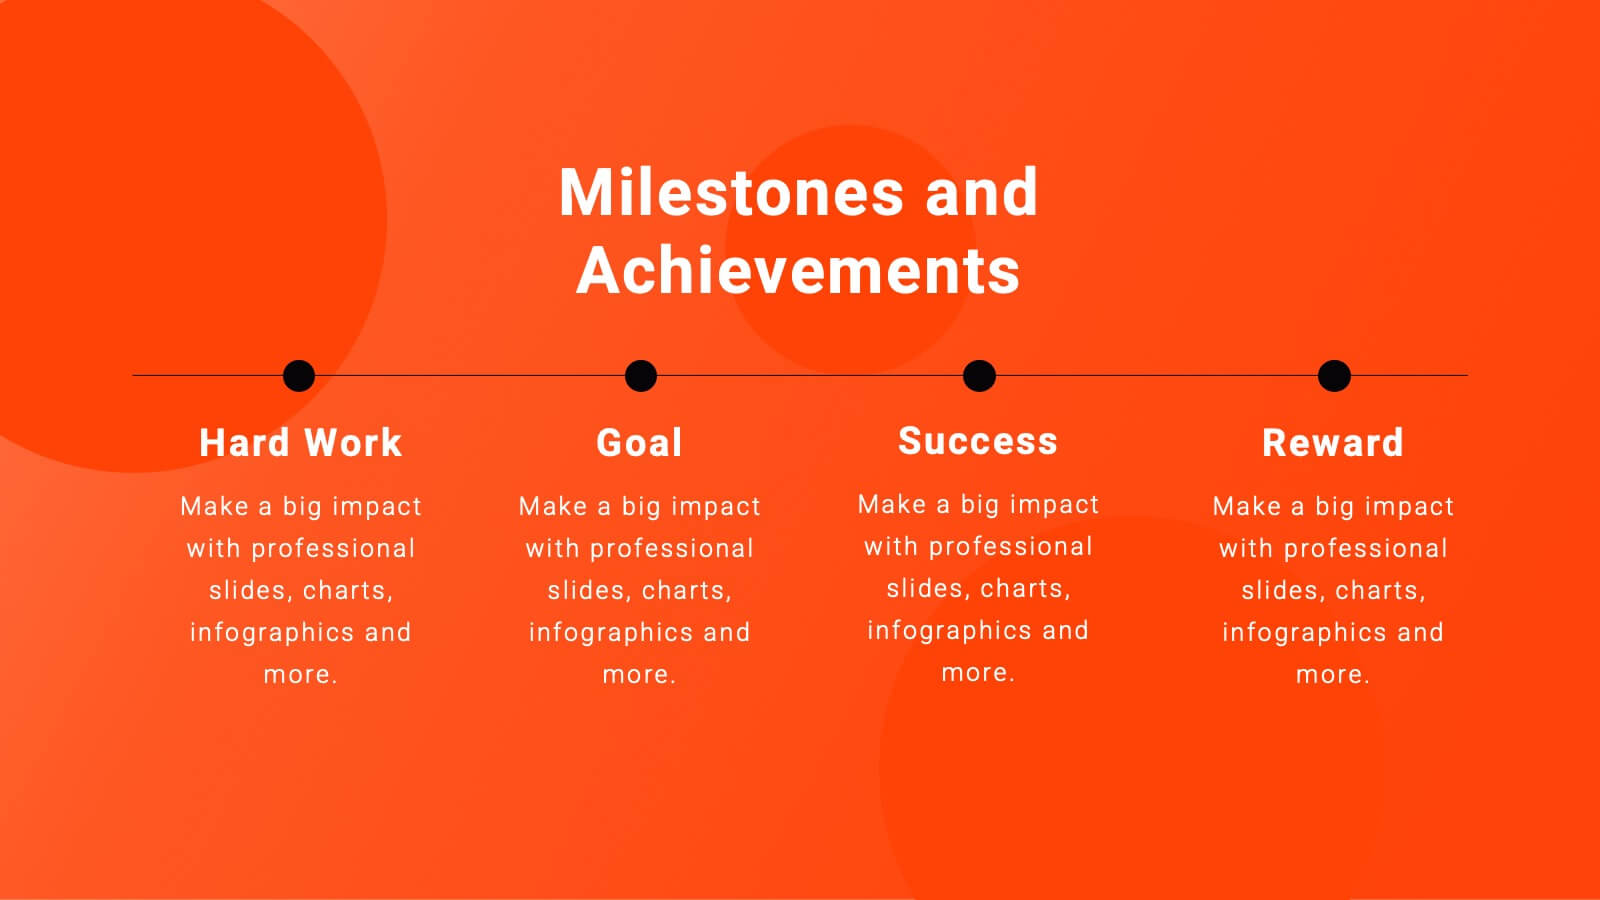
Strategic Roadmap with Milestone Tracks
Chart your progress with clarity using the Strategic Roadmap with Milestone Tracks Presentation. This visual template showcases a dotted milestone path connecting key yearly events or business phases—perfect for illustrating timelines, strategic goals, and transformation journeys. Fully editable in PowerPoint, Keynote, and Google Slides.


6 diapositivas
Environmental Protection and Ecology Plan Presentation
Highlight your green initiatives with the Environmental Protection and Ecology Plan Presentation. Featuring a lightbulb-leaf graphic, this template helps you present sustainability goals, eco strategies, and key action steps clearly. Ideal for environmental reports, proposals, or educational content. Fully customizable in Canva, PowerPoint, or Google Slides.


6 diapositivas
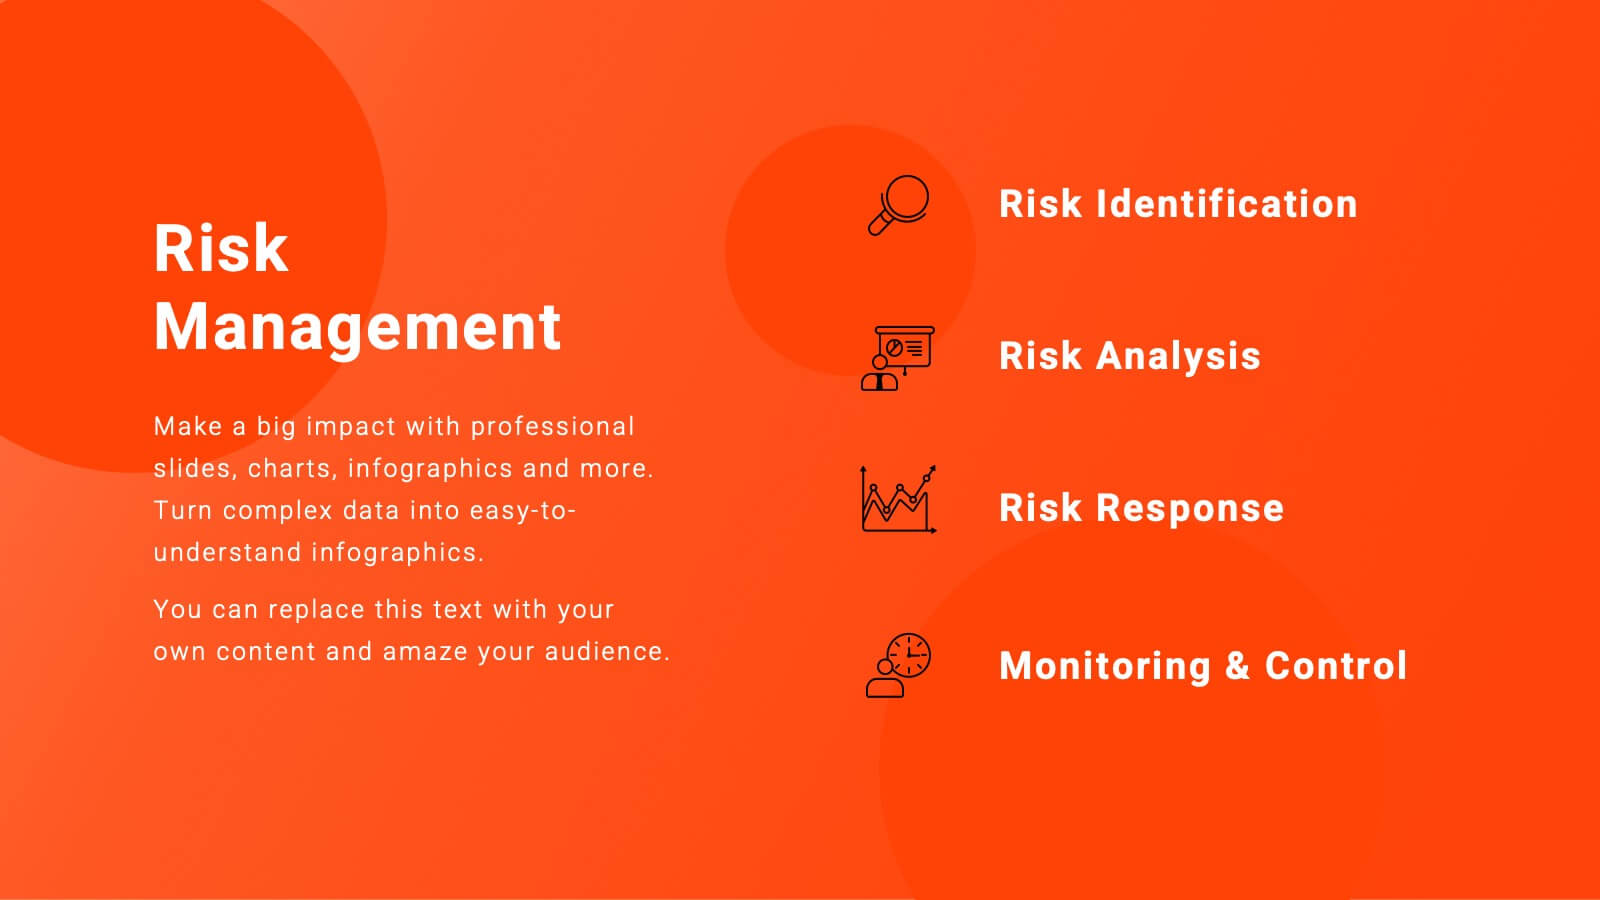
Machine Learning and Data Science Presentation
Deliver insights with precision using this data-driven presentation template tailored for machine learning, AI, and analytics topics. Featuring a central hub-and-spoke design, this layout allows you to showcase key components like algorithms, tools, processes, or data sources. Each segment includes clean icons and customizable titles for seamless editing. Ideal for data scientists, tech professionals, and academic presentations. Fully editable in PowerPoint, Keynote, and Google Slides.


6 diapositivas
Team Work Environment Infographic
A team work environment refers to the conditions and culture within a group of individuals who come together to work collaboratively on a common goal or project. This infographic template highlights the importance of teamwork and fosters a positive team-oriented workplace culture. The design emphasizes the key elements and benefits of a collaborative work environment, encouraging employees to work together effectively and efficiently. This infographic features illustrations that depict employees working together, collaborating, and supporting one another. This reinforces the idea of teamwork and unity within the organization.


4 diapositivas
Environmental Sustainability Strategy Presentation
The "Environmental Sustainability Strategy" presentation template is a visually engaging tool designed to outline an organization's approach to integrating sustainable practices into its operations. The template illustrates the journey from social to environmental and corporate sustainability, represented by seedlings growing into mature plants, symbolizing development and growth in sustainable practices. This template is perfect for businesses aiming to communicate their commitment to sustainability, detailing specific strategies and milestones in social, environmental, and corporate domains. It encourages viewers to think about the progressive stages of implementing sustainable actions within a corporate framework.


5 diapositivas
CBD Industry Infographics
CBD, or cannabidiol, is a natural compound derived from the hemp plant that has gained popularity in recent years for its potential therapeutic benefits. This infographic template is perfect if you want to educate others on the CBD industry. These vertical infographics are designed to help you provide a concise and engaging way to present facts, statistics, and trends about CBD products, usage, benefits, regulations, and market growth. This template can be used by CBD companies, health professionals, and educational institutions to inform and educate their audience about the industry and important considerations.


7 diapositivas
Pillar of Success Infographic
Pillars of Success is a metaphorical term used to describe principles or key elements that are essential for achieving success in various aspects of life, whether it's in personal development, business, education, relationships, or any other domain. This infographic template unveils the essential principles that constitute the very pillars upon which triumph and accomplishment stand. Compatible with Powerpoint, Keynote, and Google Slides. The pillars represent foundational factors that contribute to success. This template symbolizes the foundation of any successful venture, emphasizing the importance of a strong start.


6 diapositivas
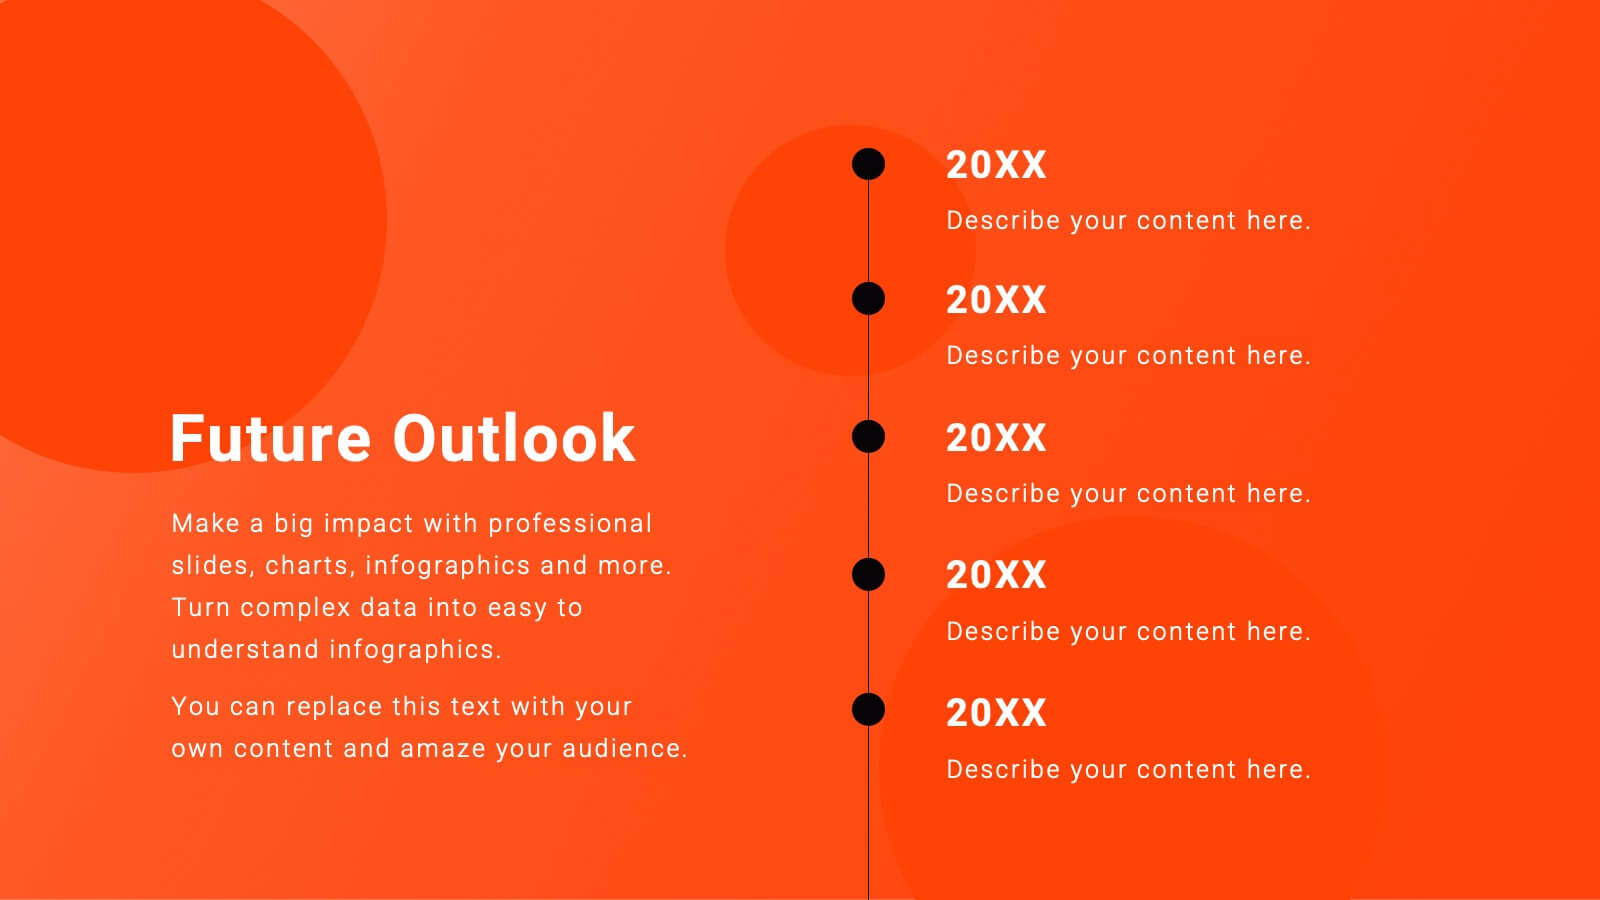
Evolution of an Industry Through Time Presentation
Visualize industry transformation with the Evolution of an Industry Through Time Presentation. This timeline-style layout is perfect for highlighting key milestones, technological shifts, or growth stages across decades. Ideal for consultants, educators, or corporate strategists. Fully editable in Canva, PowerPoint, Keynote, and Google Slides for easy adaptation.


5 diapositivas
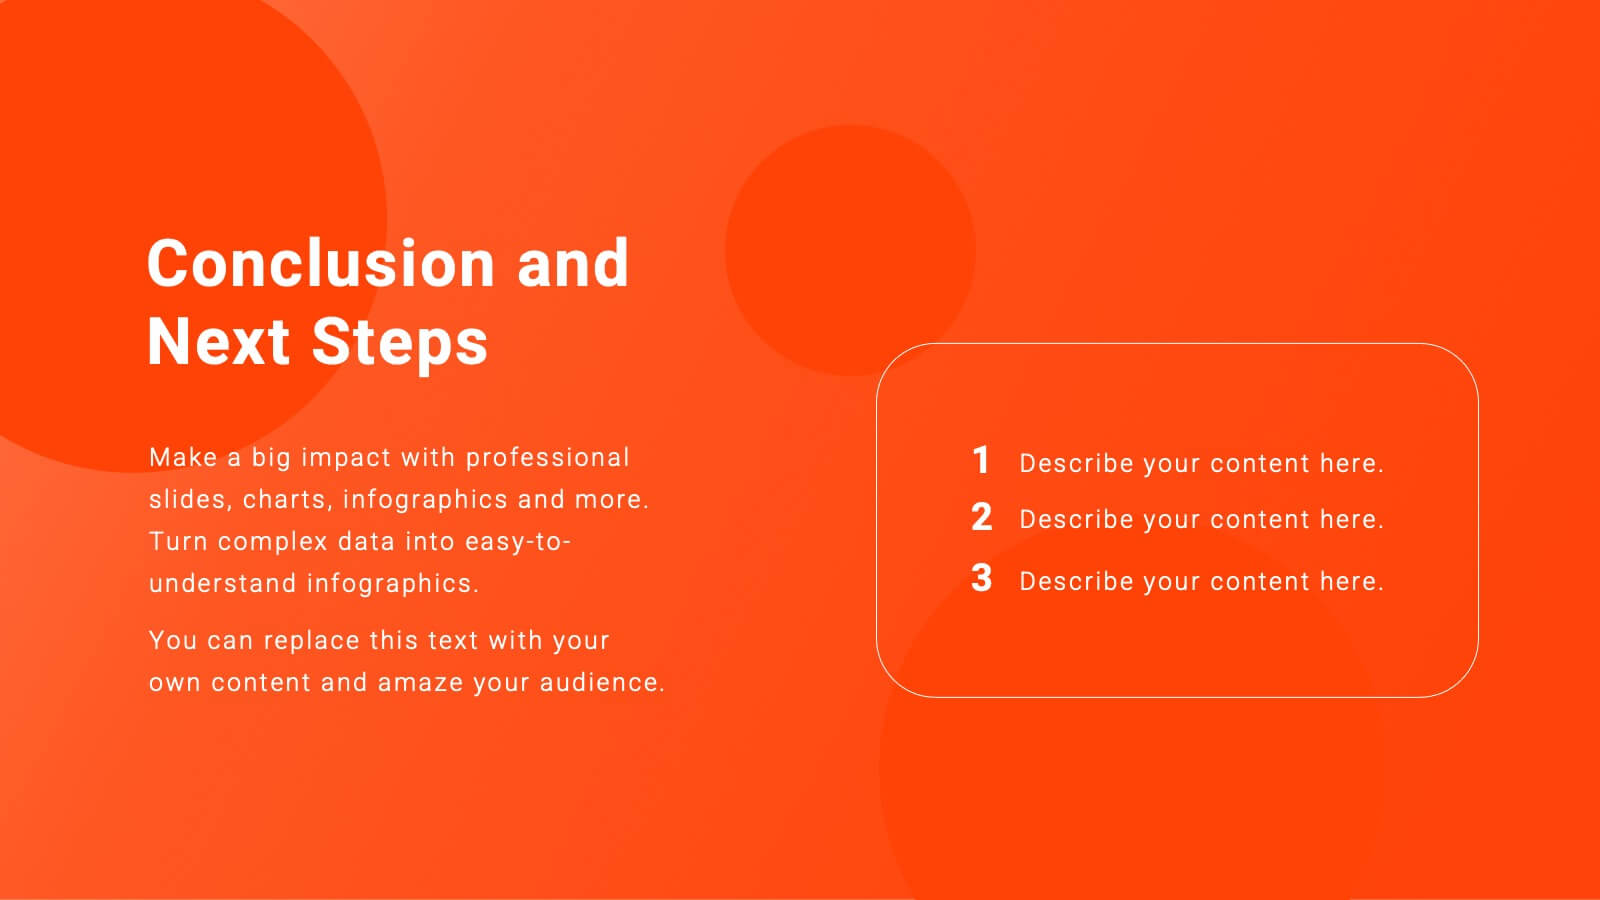
Strategic Planning Canvas for Growth
Build a clear roadmap to success with the Strategic Planning Canvas for Growth Presentation. This slide uses a curved timeline layout to showcase five progressive steps, ideal for outlining growth phases, initiatives, or planning milestones. Each stage is paired with a modern icon and text area for key insights. Fully editable in PowerPoint, Keynote, and Google Slides.


5 diapositivas
Revenue and Cost Breakdown Presentation
Present your financial insights with clarity using this 4-point revenue and cost analysis layout. Ideal for summarizing earnings, expenses, or budget comparisons. The circular icon design keeps information clean and engaging. Fully customizable in Canva, PowerPoint, or Google Slides to fit your brand’s data and presentation needs.


5 diapositivas
European Countries Editable Map Presentation
Bring your data to life with a detailed and modern map layout that showcases insights across Europe. Perfect for visualizing country comparisons, regional statistics, or business expansion plans, this clean design ensures clarity and impact. Fully compatible with PowerPoint, Keynote, and Google Slides for easy editing and presentation.


5 diapositivas
Innovation Framework Presentation
Turn bold ideas into structured success with this engaging presentation design. Perfect for mapping creative processes, innovation systems, and project development stages, it helps present ideas clearly and visually. Fully editable and easy to customize, this presentation is compatible with PowerPoint, Keynote, and Google Slides for effortless use.


7 diapositivas
Framework Infographics Presentation Template
A framework infographic is a visual representation of a structured approach or system for addressing a problem, organizing information, or making decisions. Our framework infographic is designed to help you understand complex concepts and to provide a visual roadmap that can be easily followed. This template makes an impact with a professional design, customizable text and graphics, and compelling visual content. If you need to display and share information, charts, graphs or lists in a creative way this template will guide you through each step to create a professional looking infographic.


5 diapositivas
Human-Centered Design Thinking Strategy
Showcase empathy-driven innovation with the Human-Centered Design Thinking Strategy Presentation. This slide visually emphasizes user-focused thinking by combining a head silhouette with colorful puzzle icons representing each strategic step. Ideal for UX strategy meetings, product development pitches, and innovation workshops, it includes five editable segments labeled A to E, each with matching text fields to explain your core insights or process stages. Compatible with PowerPoint, Keynote, and Google Slides for seamless editing and presentation.


23 diapositivas
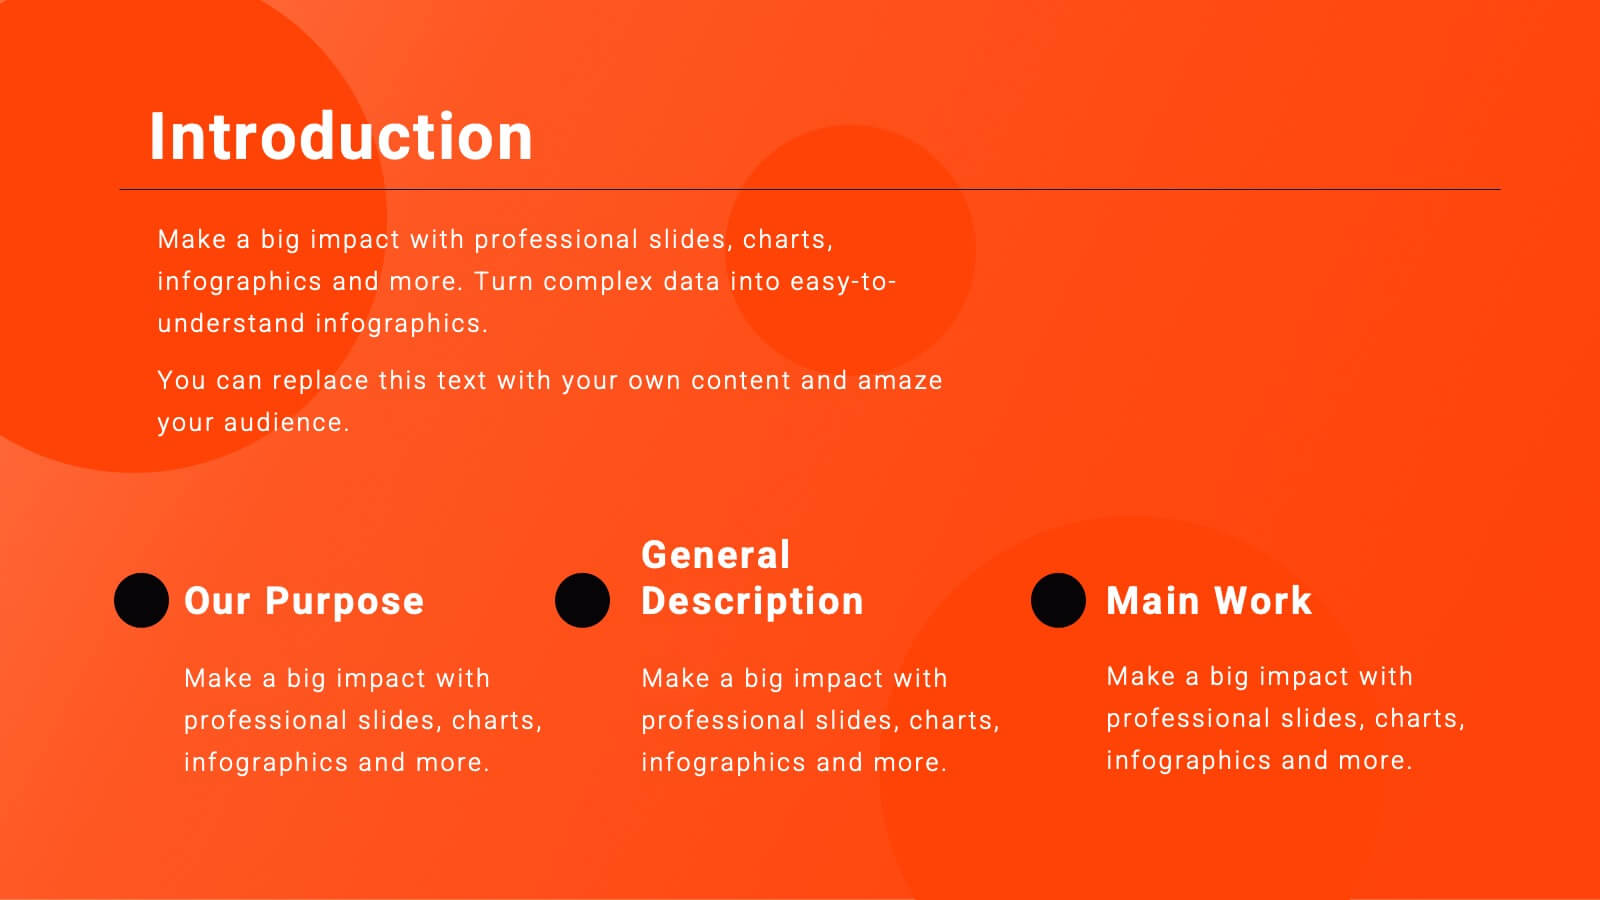
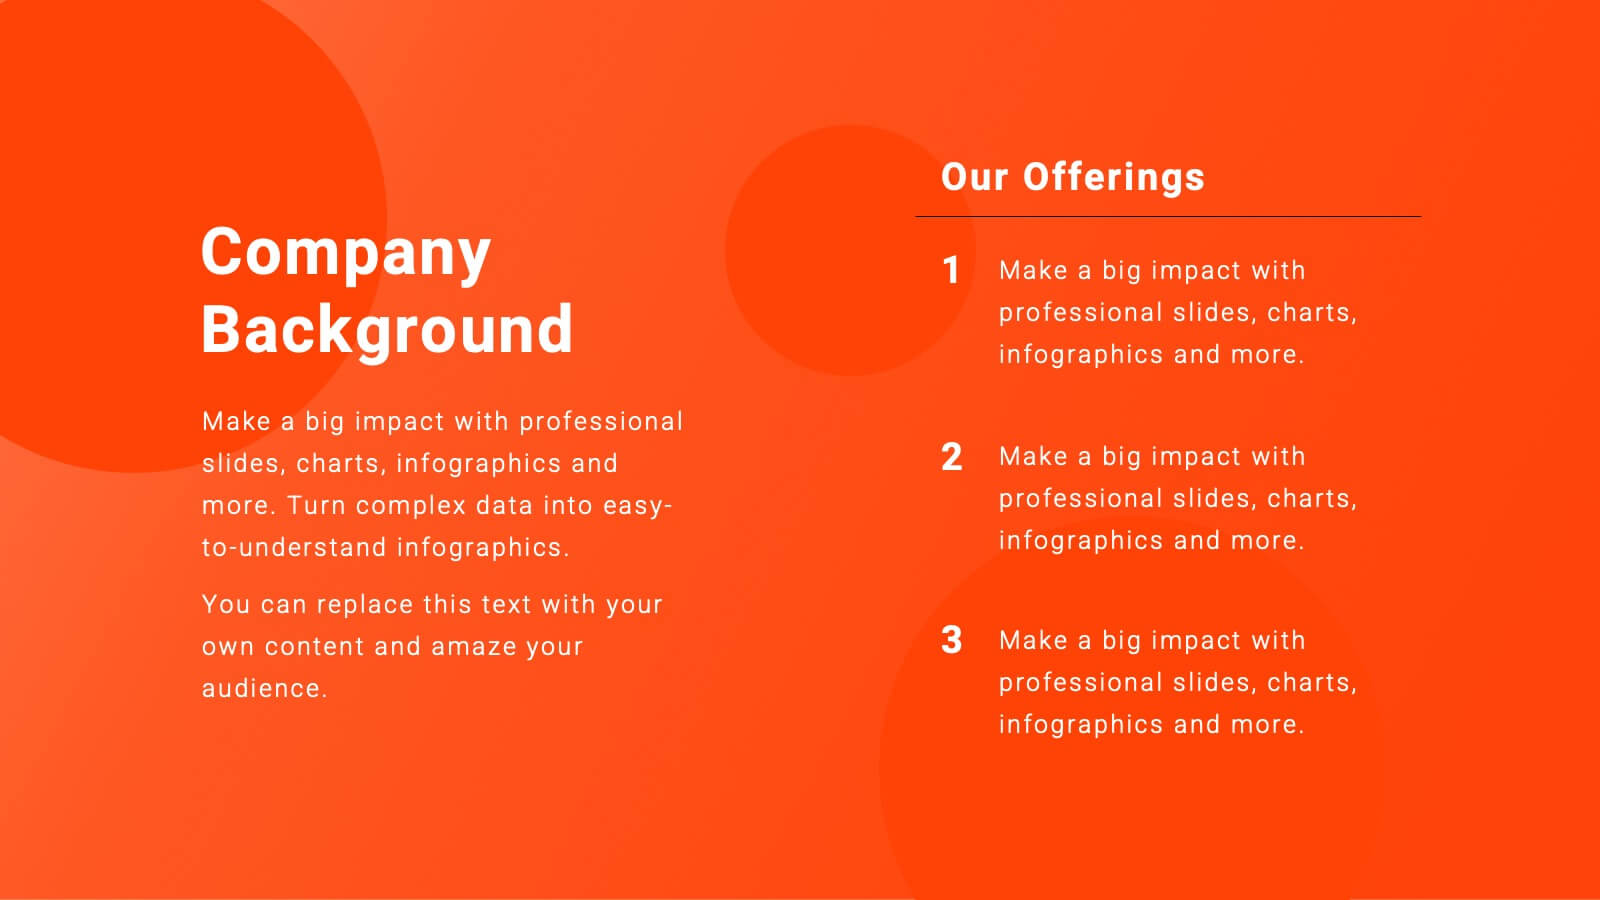
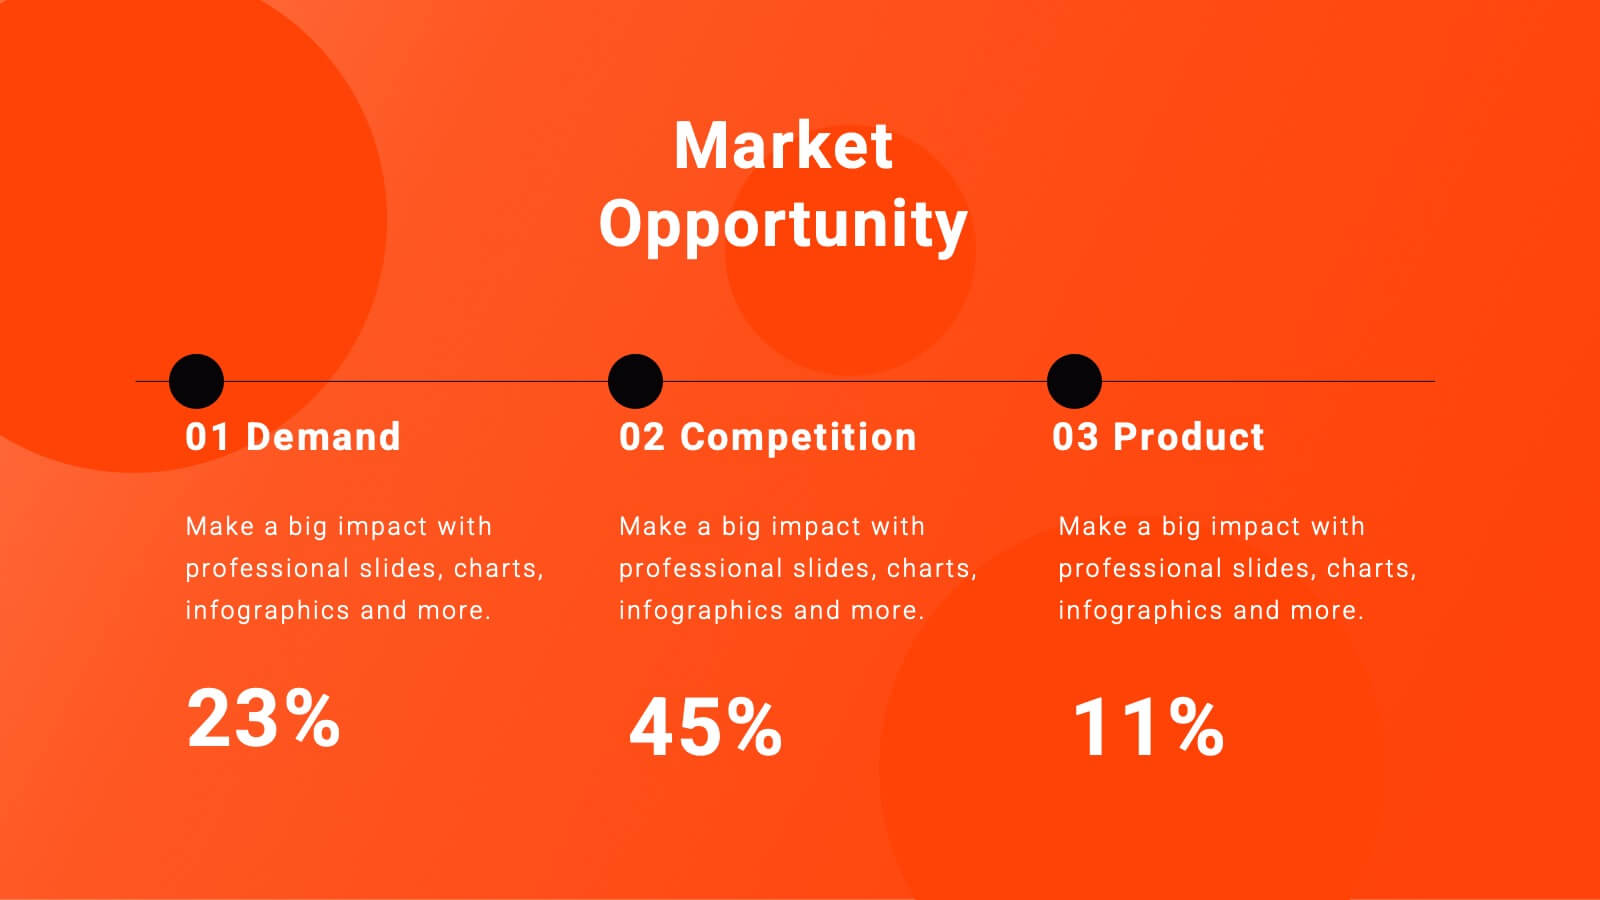
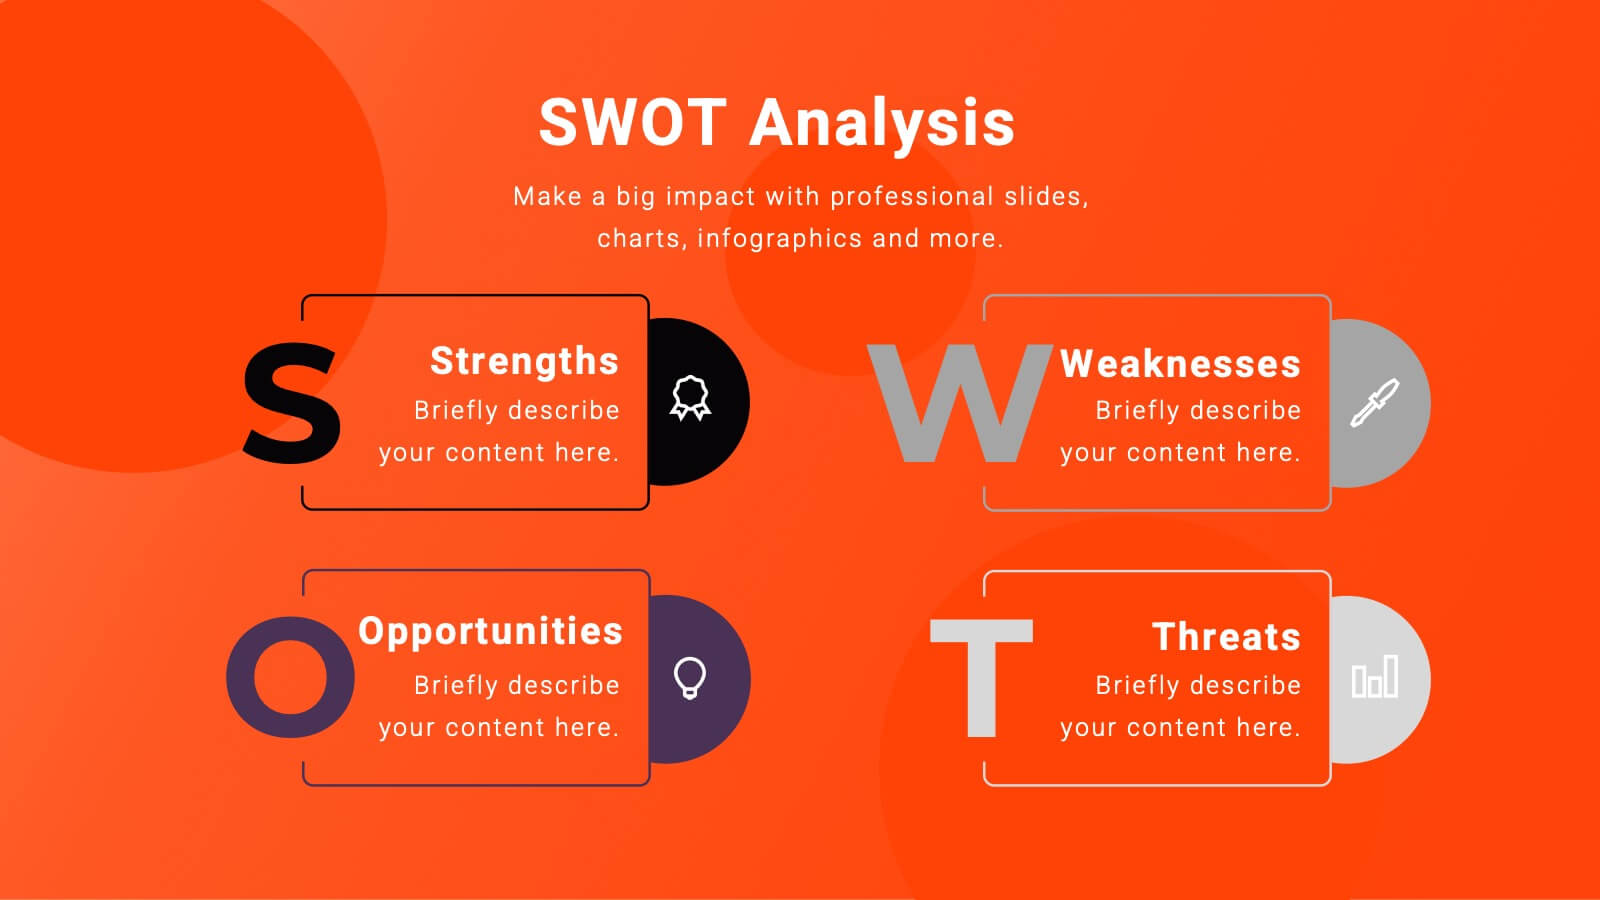
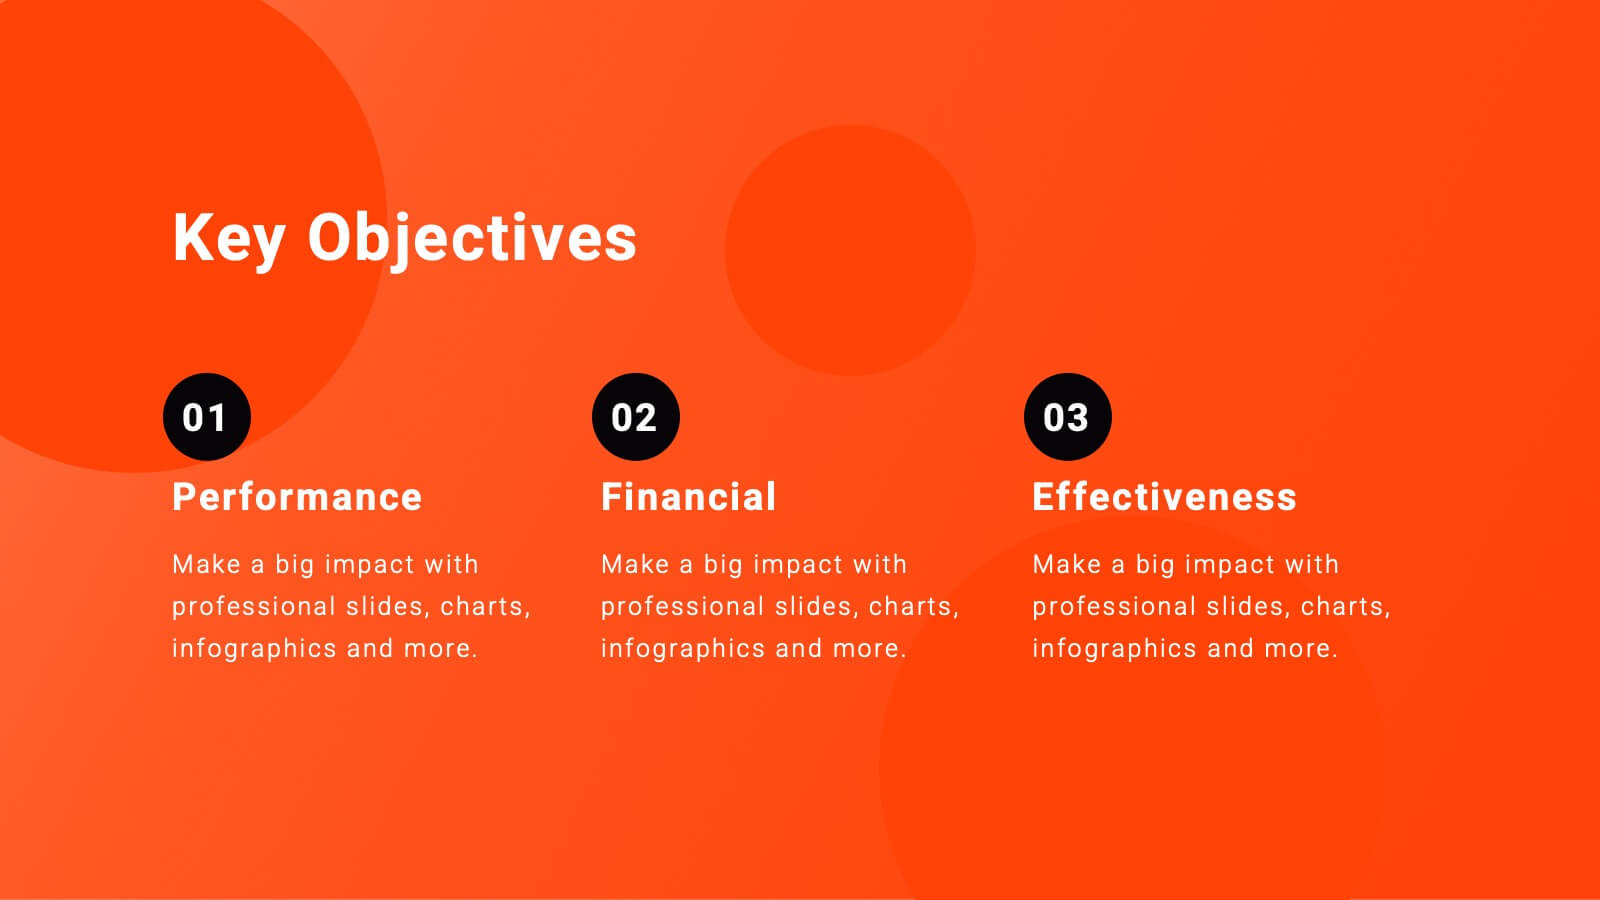
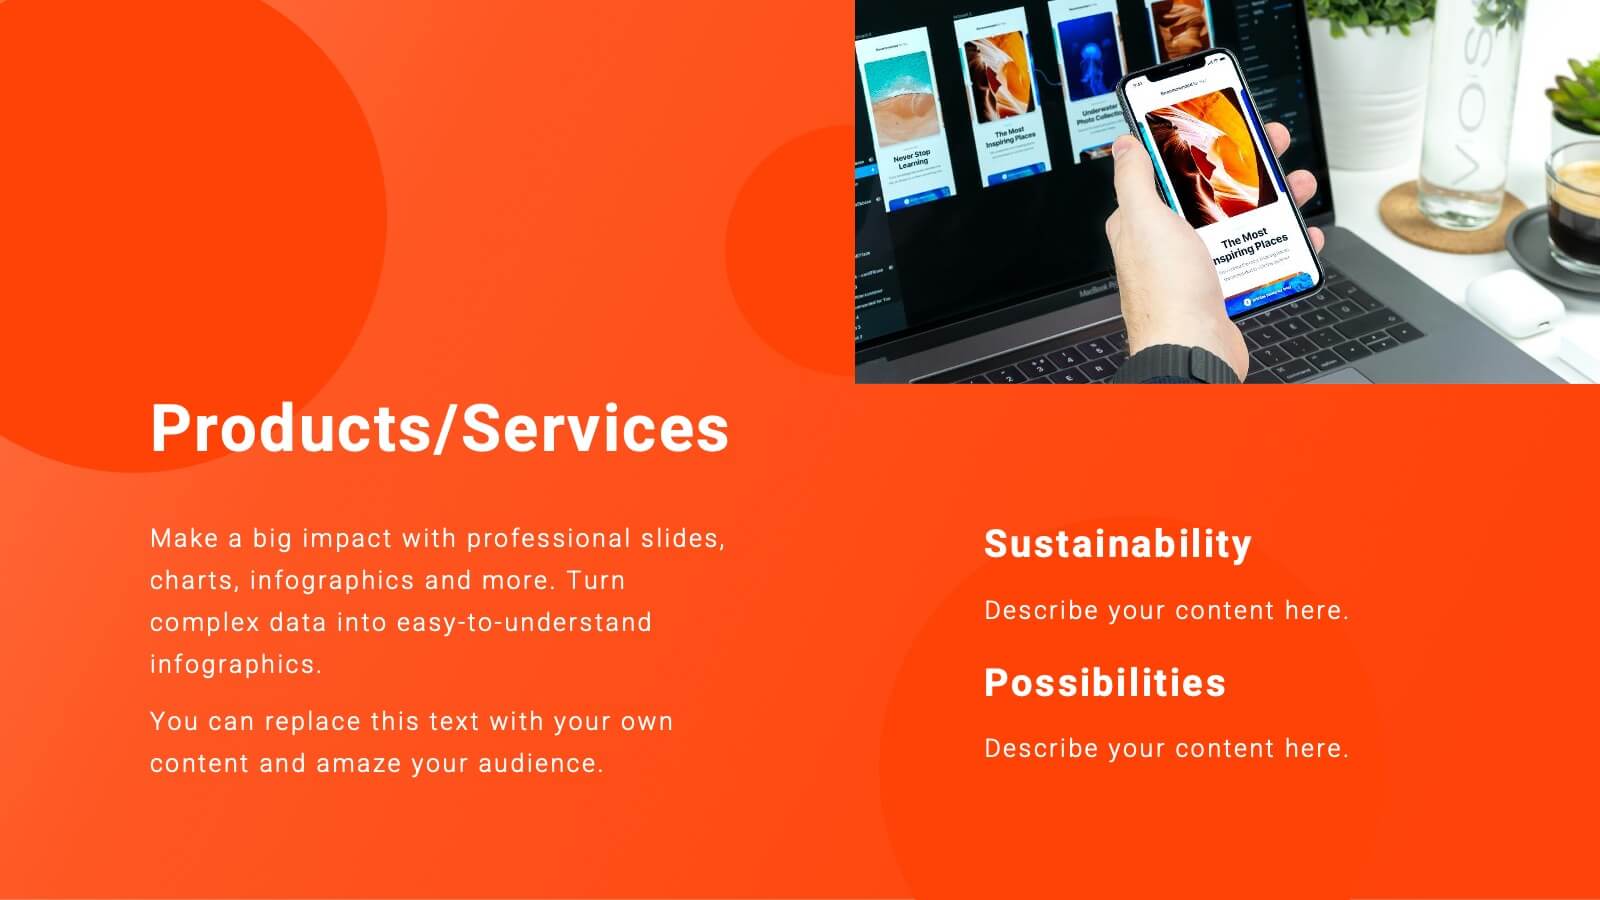
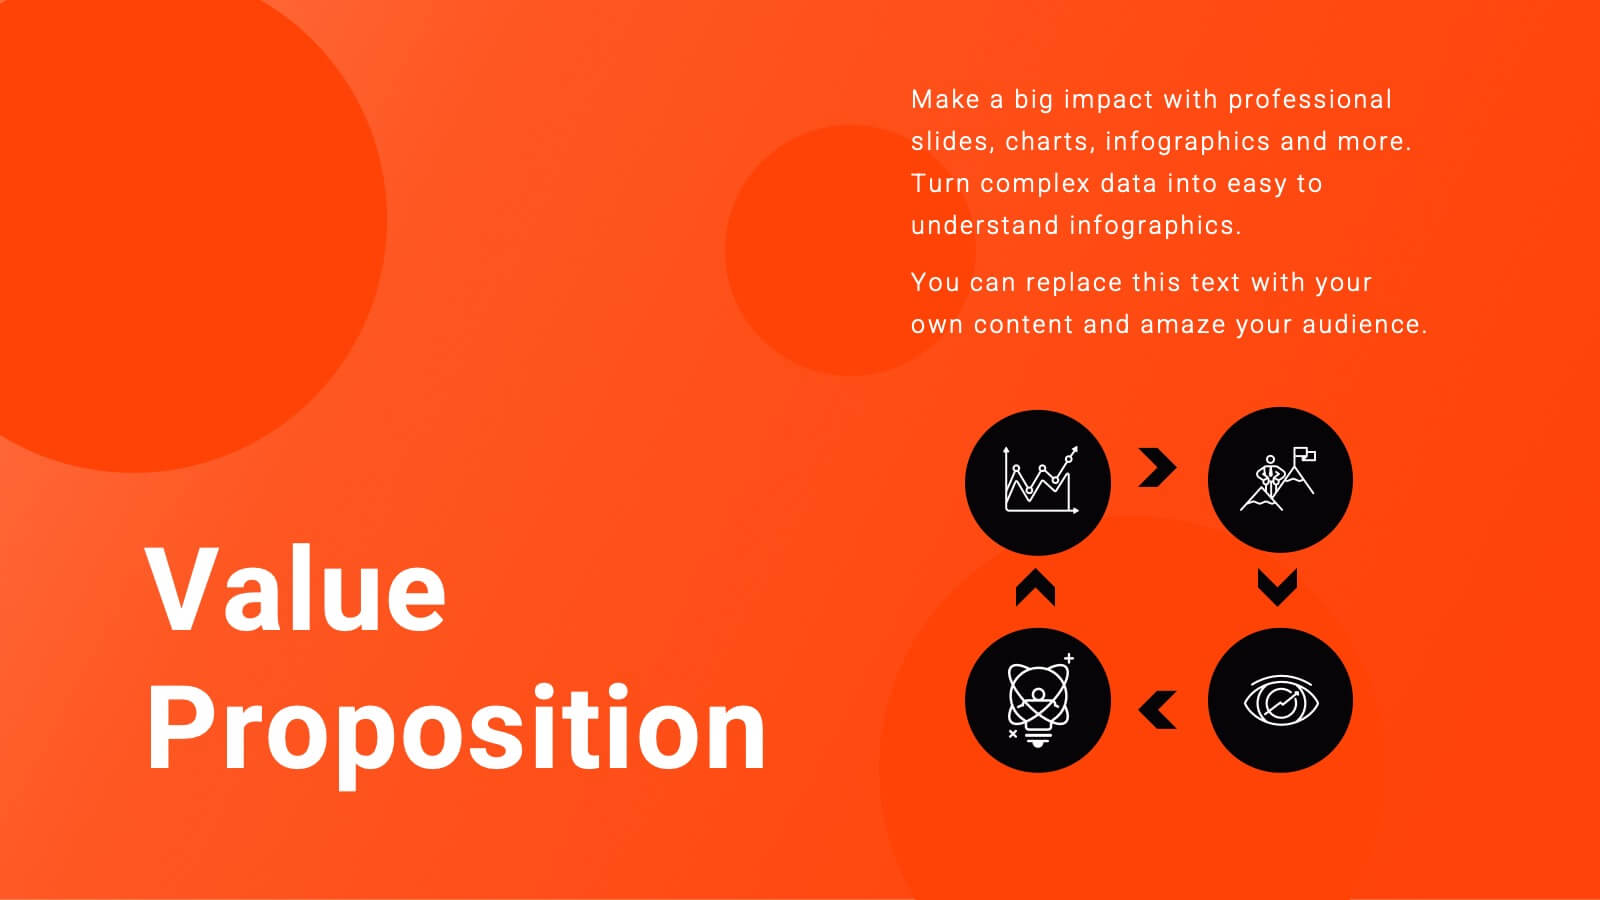
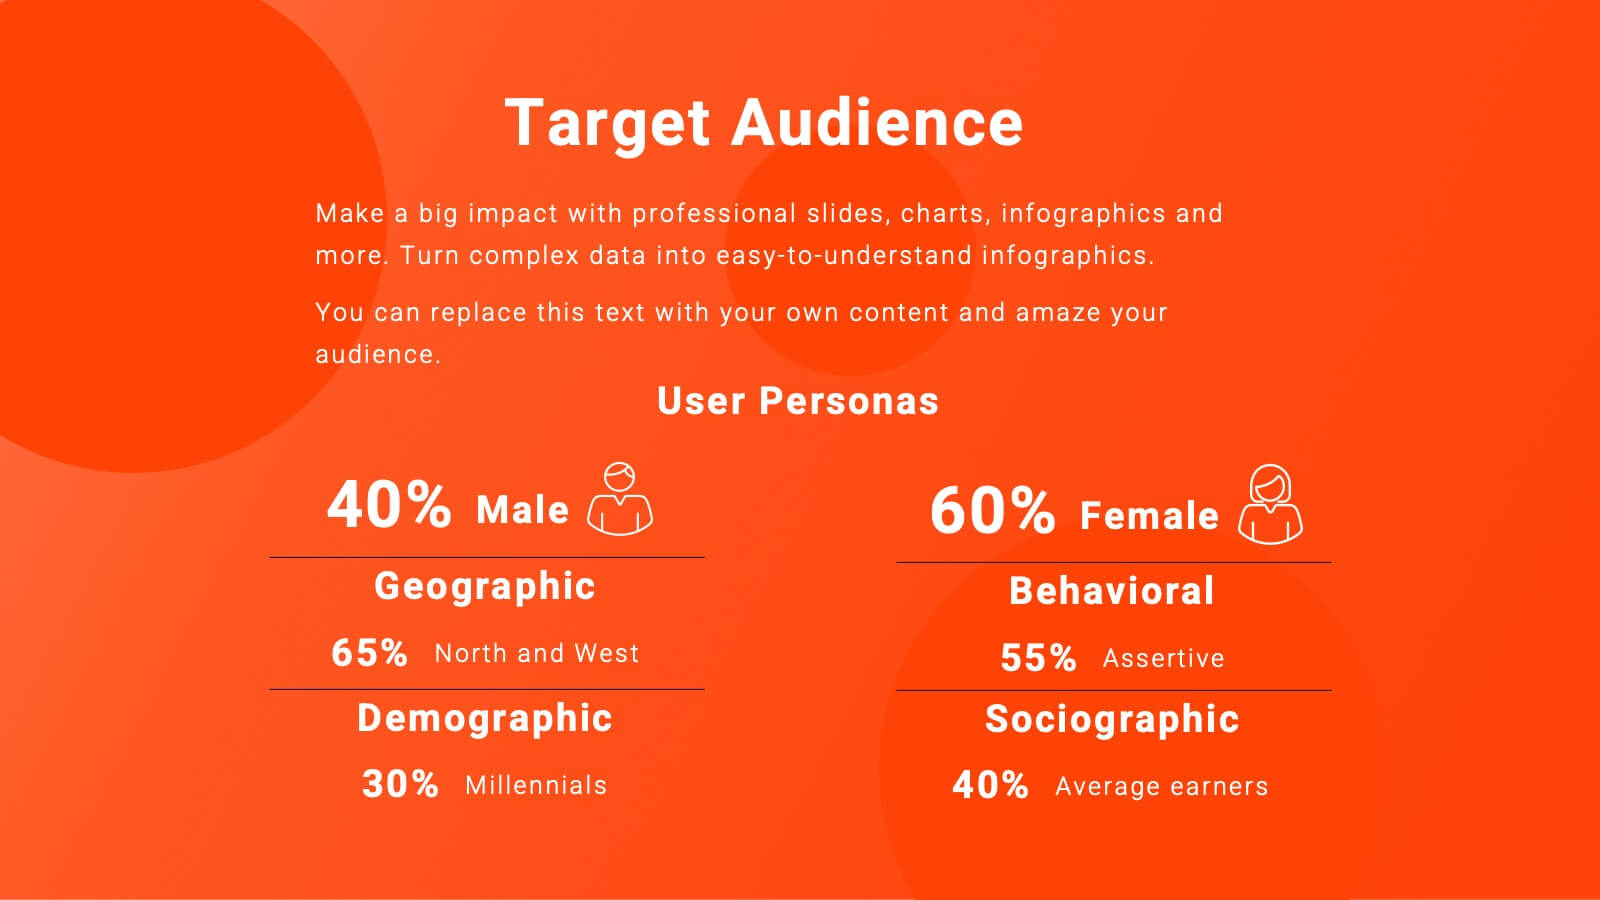
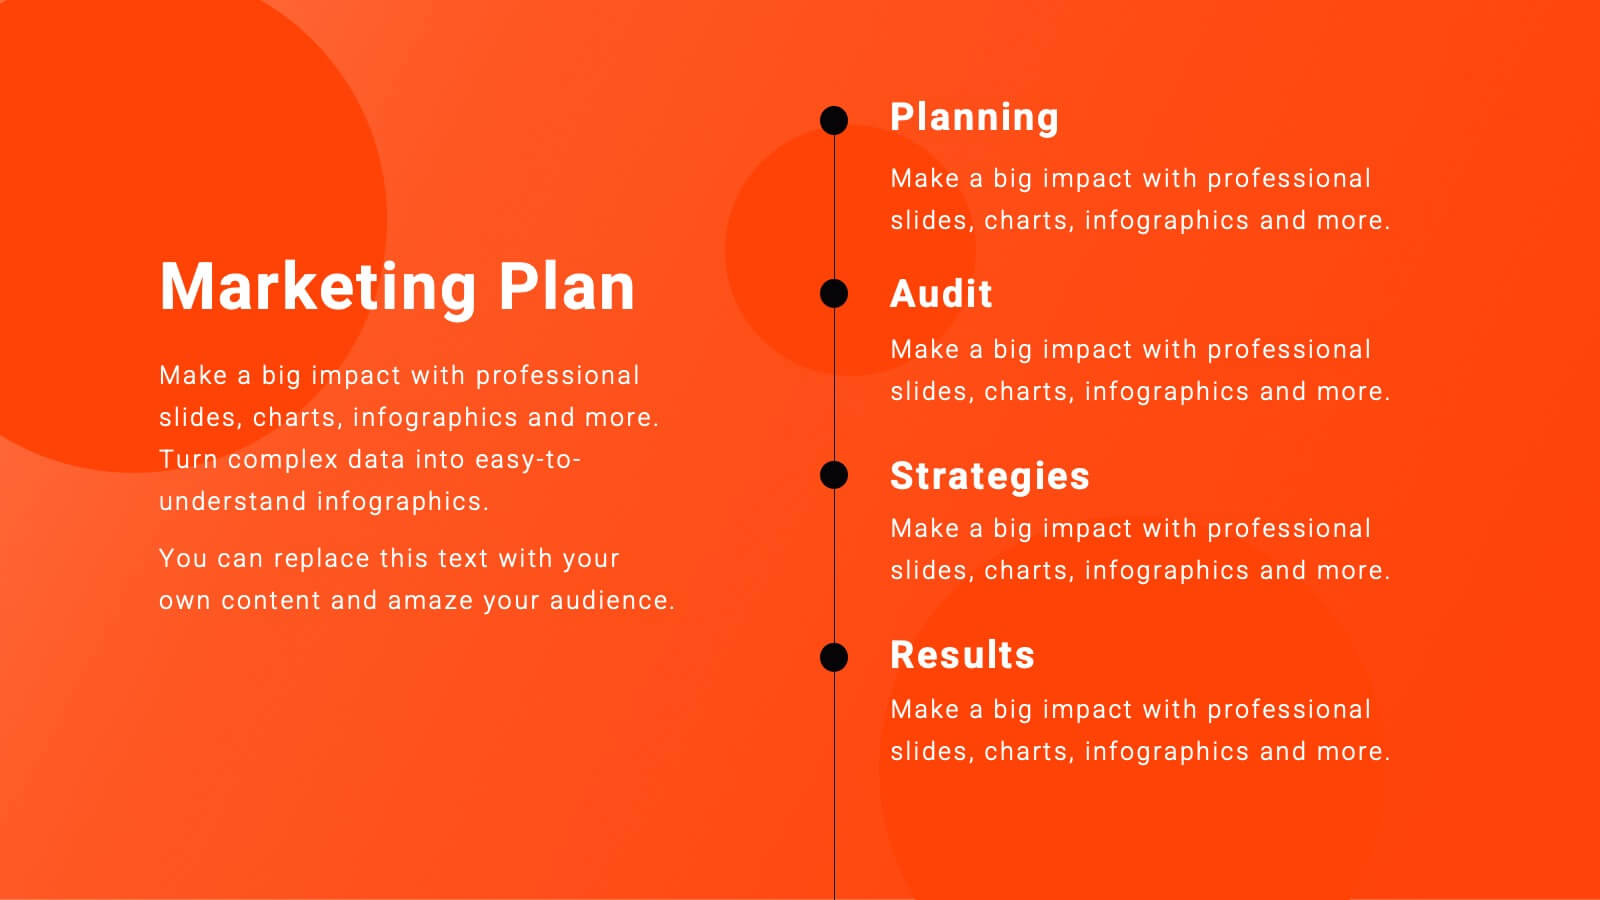
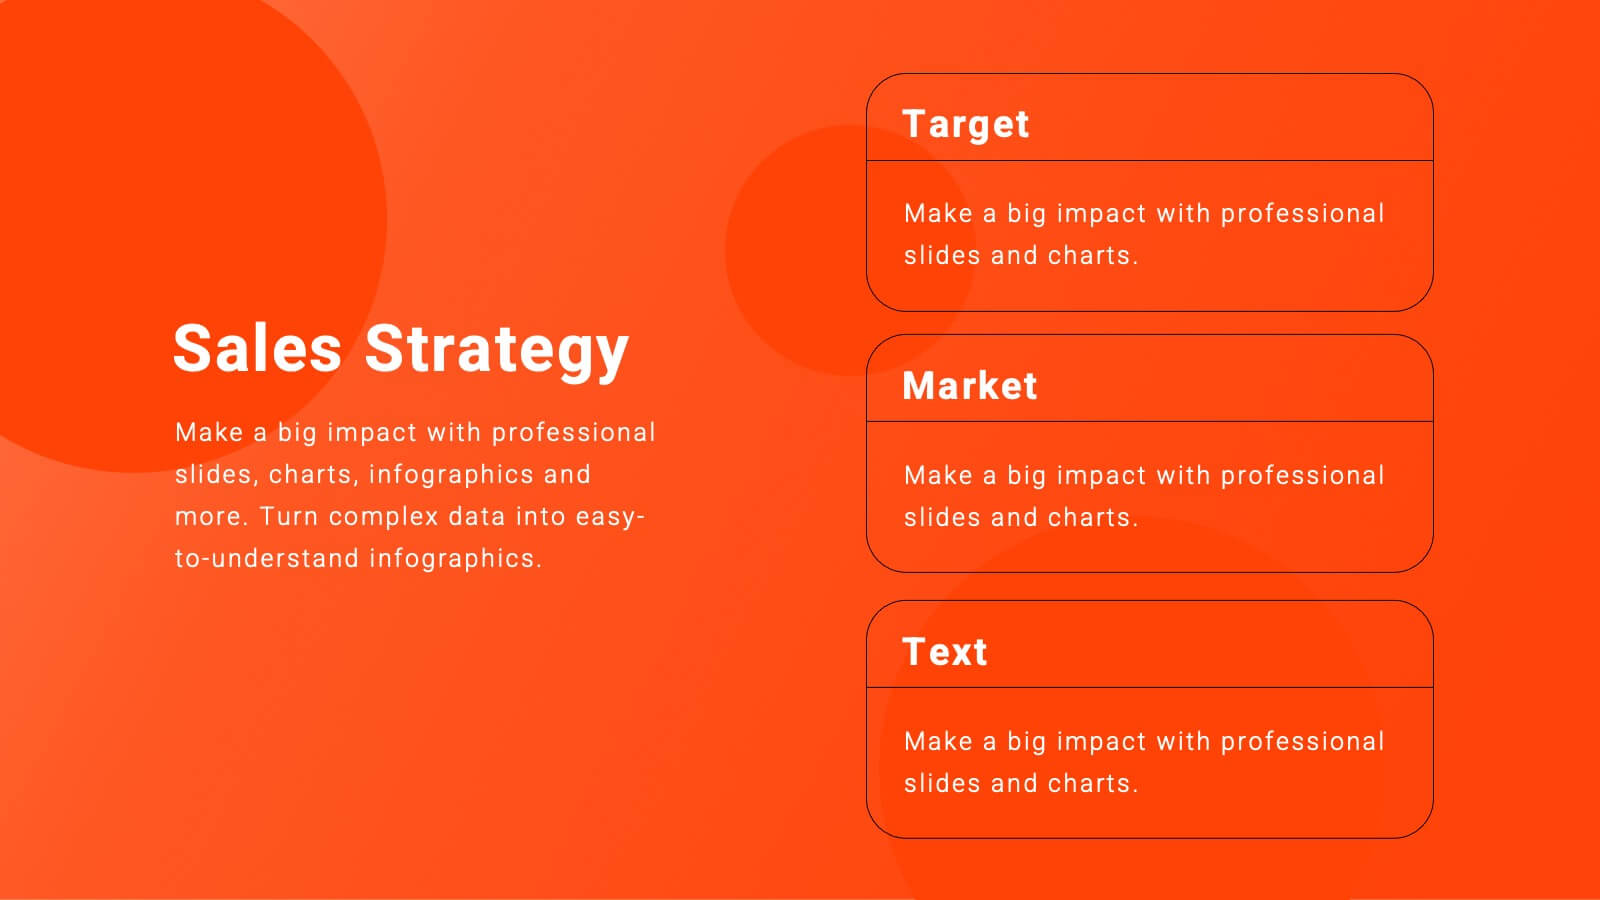
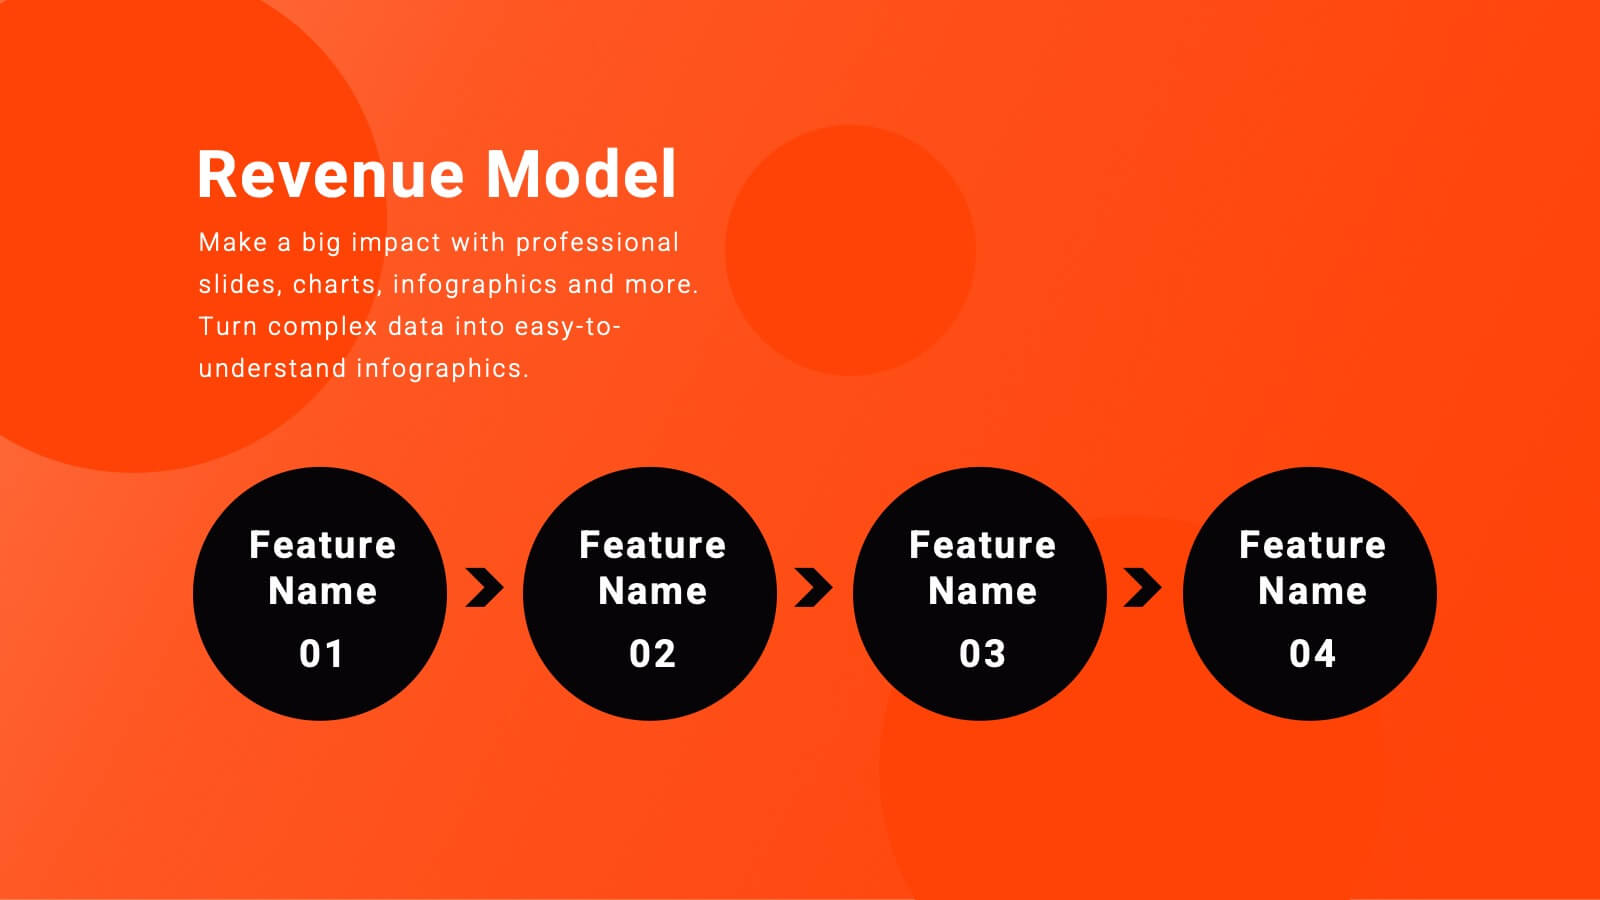
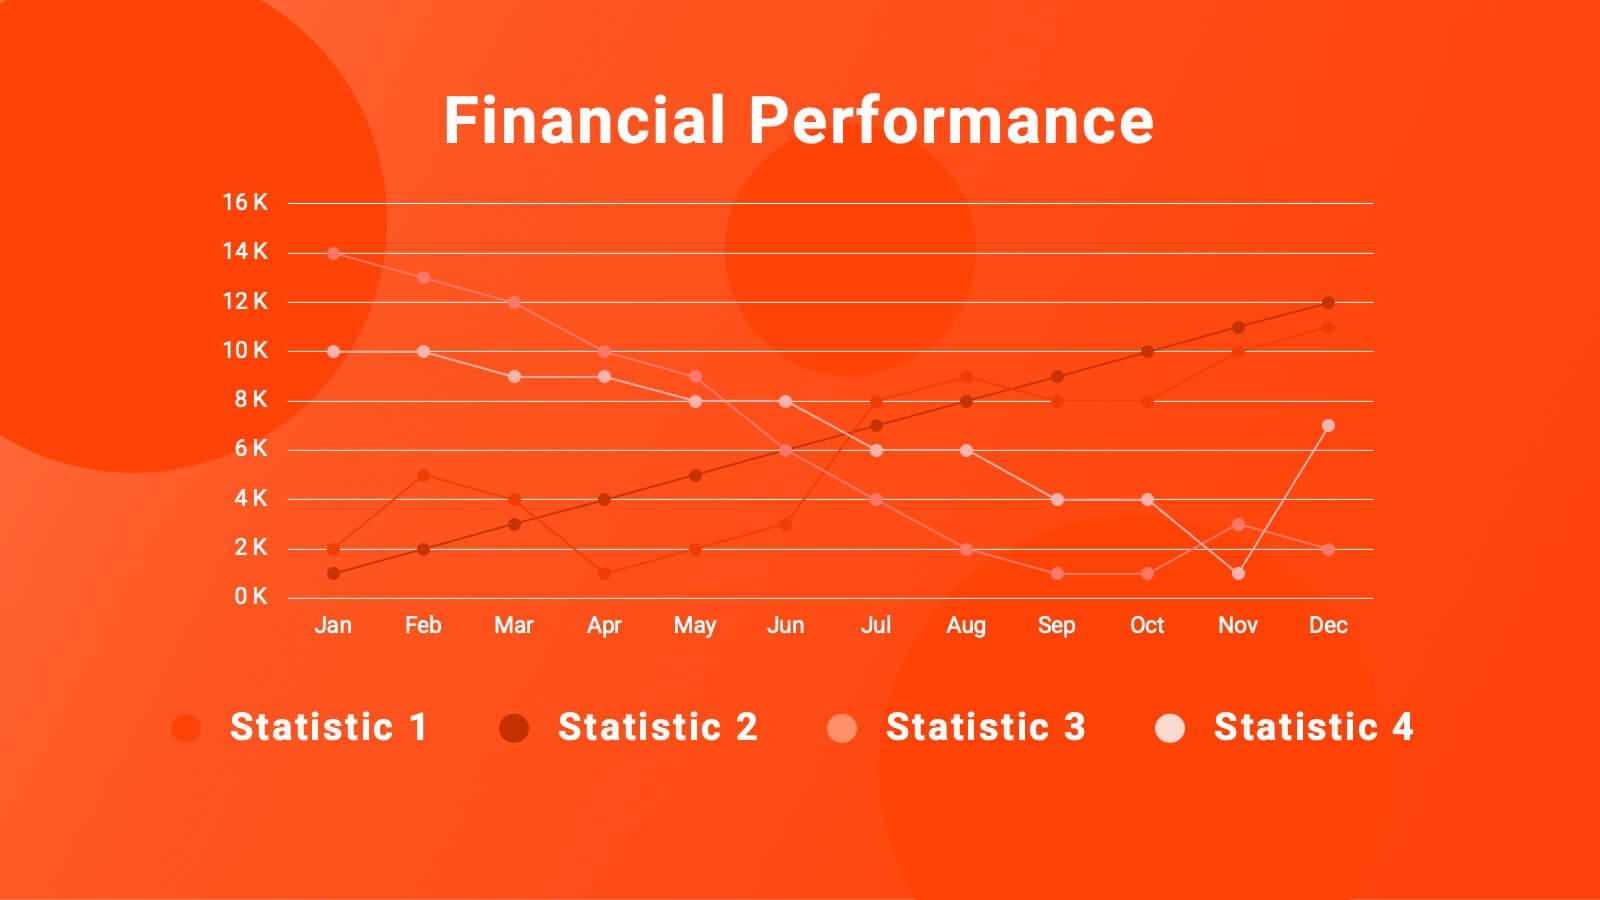
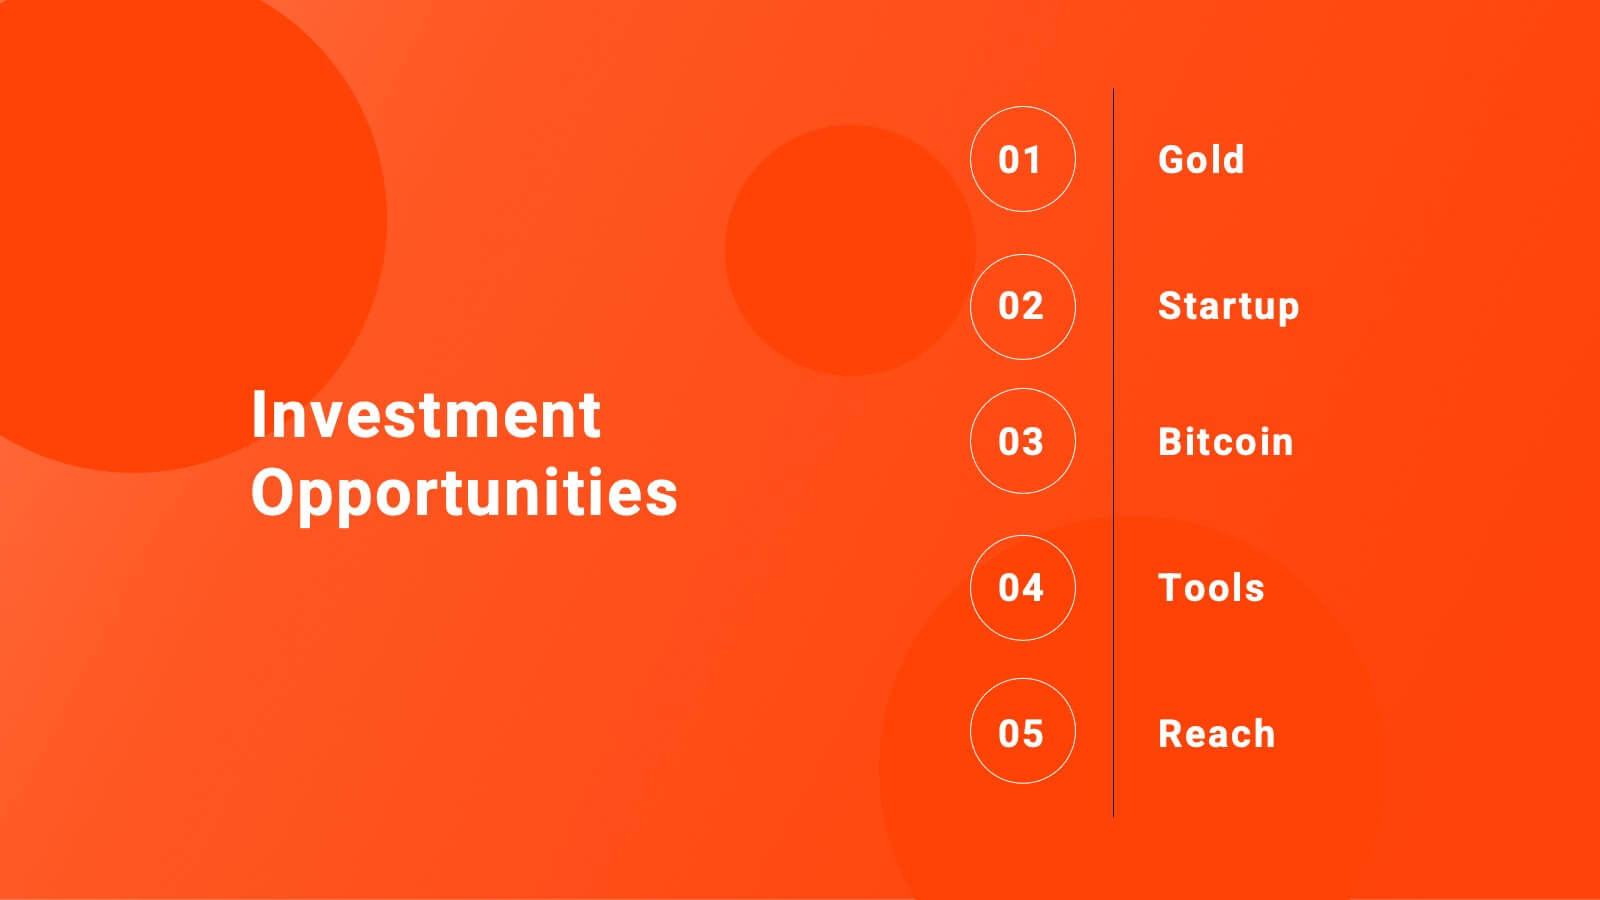
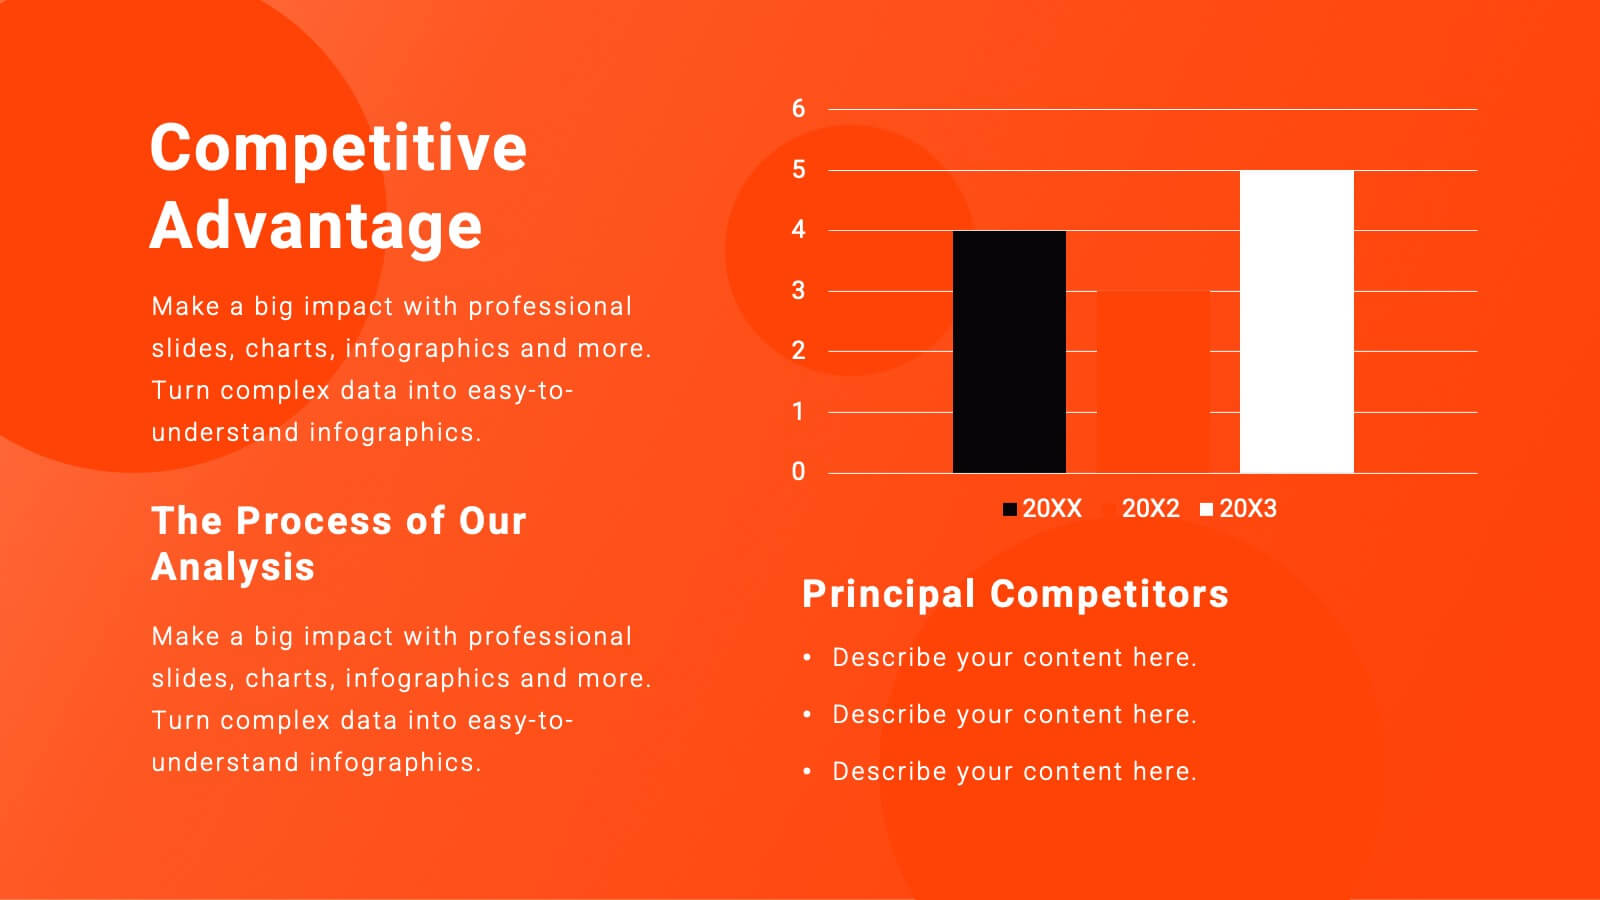
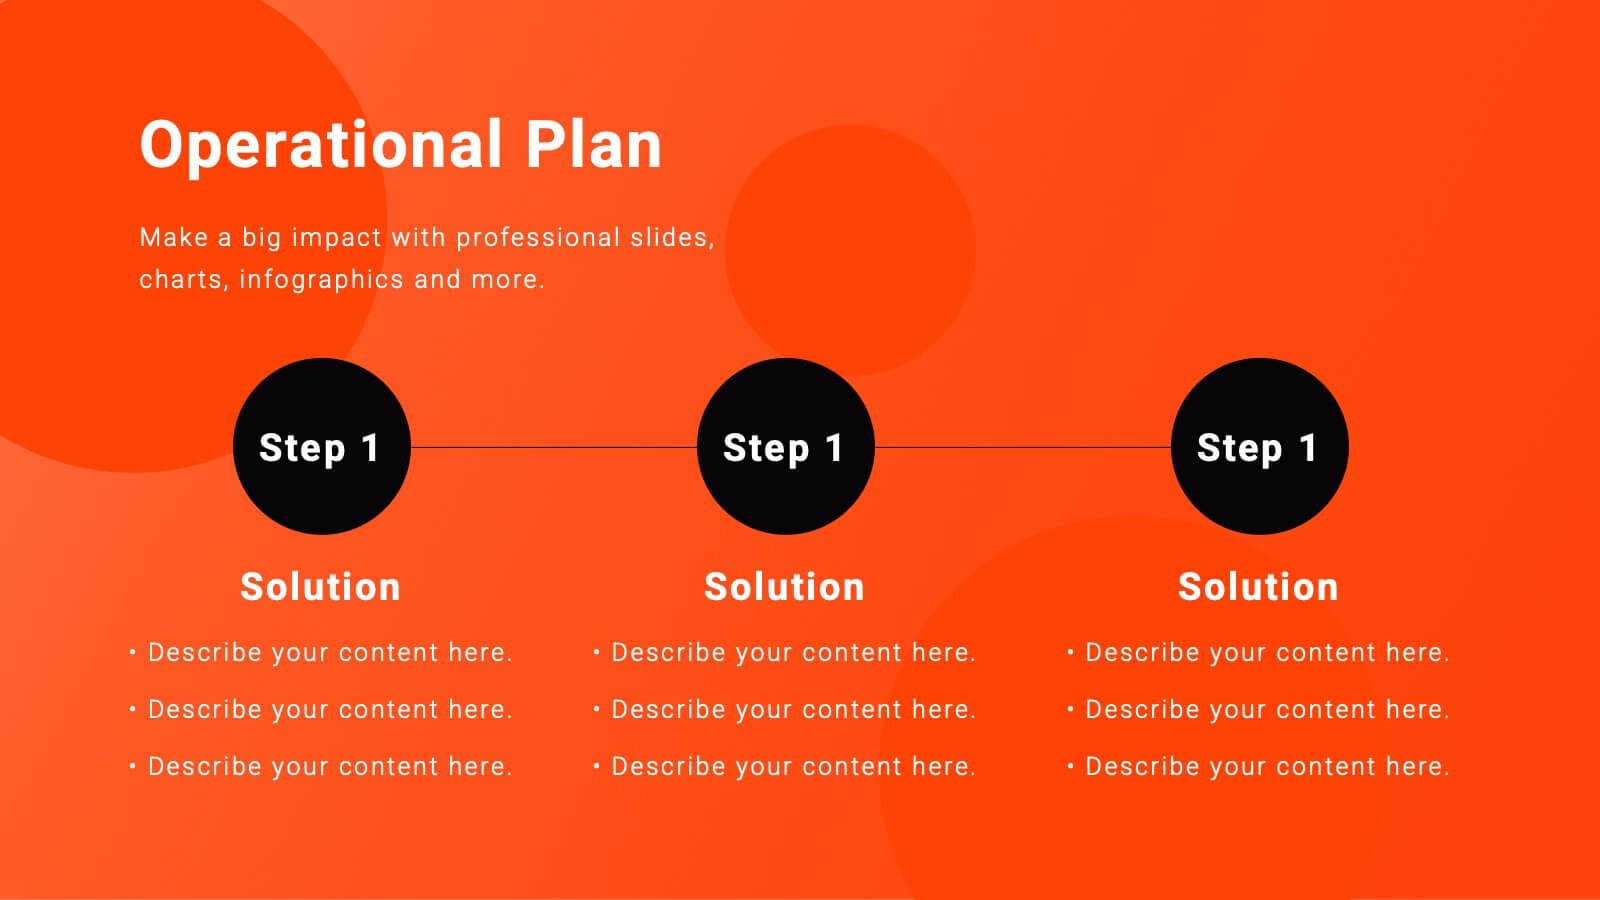
Equinox Business Operations Plan Presentation
Elevate your business operations with this dynamic plan template! Perfect for detailing company background, market opportunities, and strategic objectives. Ideal for business leaders and managers aiming to streamline operations and drive growth. Compatible with PowerPoint, Keynote, and Google Slides, this template ensures your business plan is clear, professional, and impactful. Drive success today!