


Características


¿Tienes alguna pregunta?
Recomendar


6 diapositivas
Veterinary Services Infographic
Veterinary services refer to medical and healthcare services provided to animals by trained and licensed professionals called veterinarians. This infographic template aims to educate pet owners and the general public about the importance of veterinary care for animals' health and well-being. This template serves as a valuable resource for pet owners, animal lovers, and anyone interested in understanding the significance of veterinary care in maintaining the well-being of our beloved animal companions. This infographic aims to promote responsible pet ownership and raise awareness about the importance of regular veterinary visits for pets' health and happiness.


5 diapositivas
Understanding Customer Needs with Empathy Map Presentation
Gain deeper customer insights with the Understanding Customer Needs with Empathy Map Presentation. This template simplifies user research by visually organizing customer thoughts, behaviors, and emotions into a clear layout. Perfect for UX teams, product designers, and marketers aiming to craft user-centric strategies. Fully editable in PowerPoint, Keynote, Canva, and Google Slides.


6 diapositivas
Break Even Options Infographic
Break-even analysis is a financial calculation that helps businesses determine the point at which their total revenue equals their total costs, resulting in neither a profit nor a loss. This infographic template provides a clear visual representation of the concept of breakeven in options trading, helping traders understand the point at which profits and losses balance out. This template is a valuable tool for businesses to assess the level of sales needed to cover their costs and begin making a profit. Use this template to provide your viewers insights and help make informed decisions to optimize operations.


4 diapositivas
Breakthroughs in Scientific Discovery Presentation
Highlight research milestones with this Breakthroughs in Scientific Discovery Presentation Template. Designed with a lab flask graphic that fills up with percentages, this layout is perfect for showcasing progress, success metrics, or phased experimentation. Ideal for researchers, science communicators, and biotech presentations. Fully editable in PowerPoint, Keynote, and Google Slides.


7 diapositivas
SEO Optimization Infographic Presentation
Search engine optimization (SEO) is the practice of optimizing websites and digital content to rank higher in search engine result pages. Use this template to lay out the basics of optimization, including best practices and examples, as well as a checklist for everything you need to know. This template is perfect to show your audience a step by step process of SEO. It includes a great space to enter data, knowledge and helpful tips with a simple design and bright colors. This can be used in an article, presentation or even a blog post to give your audience all the information needed about SEO.

21 diapositivas
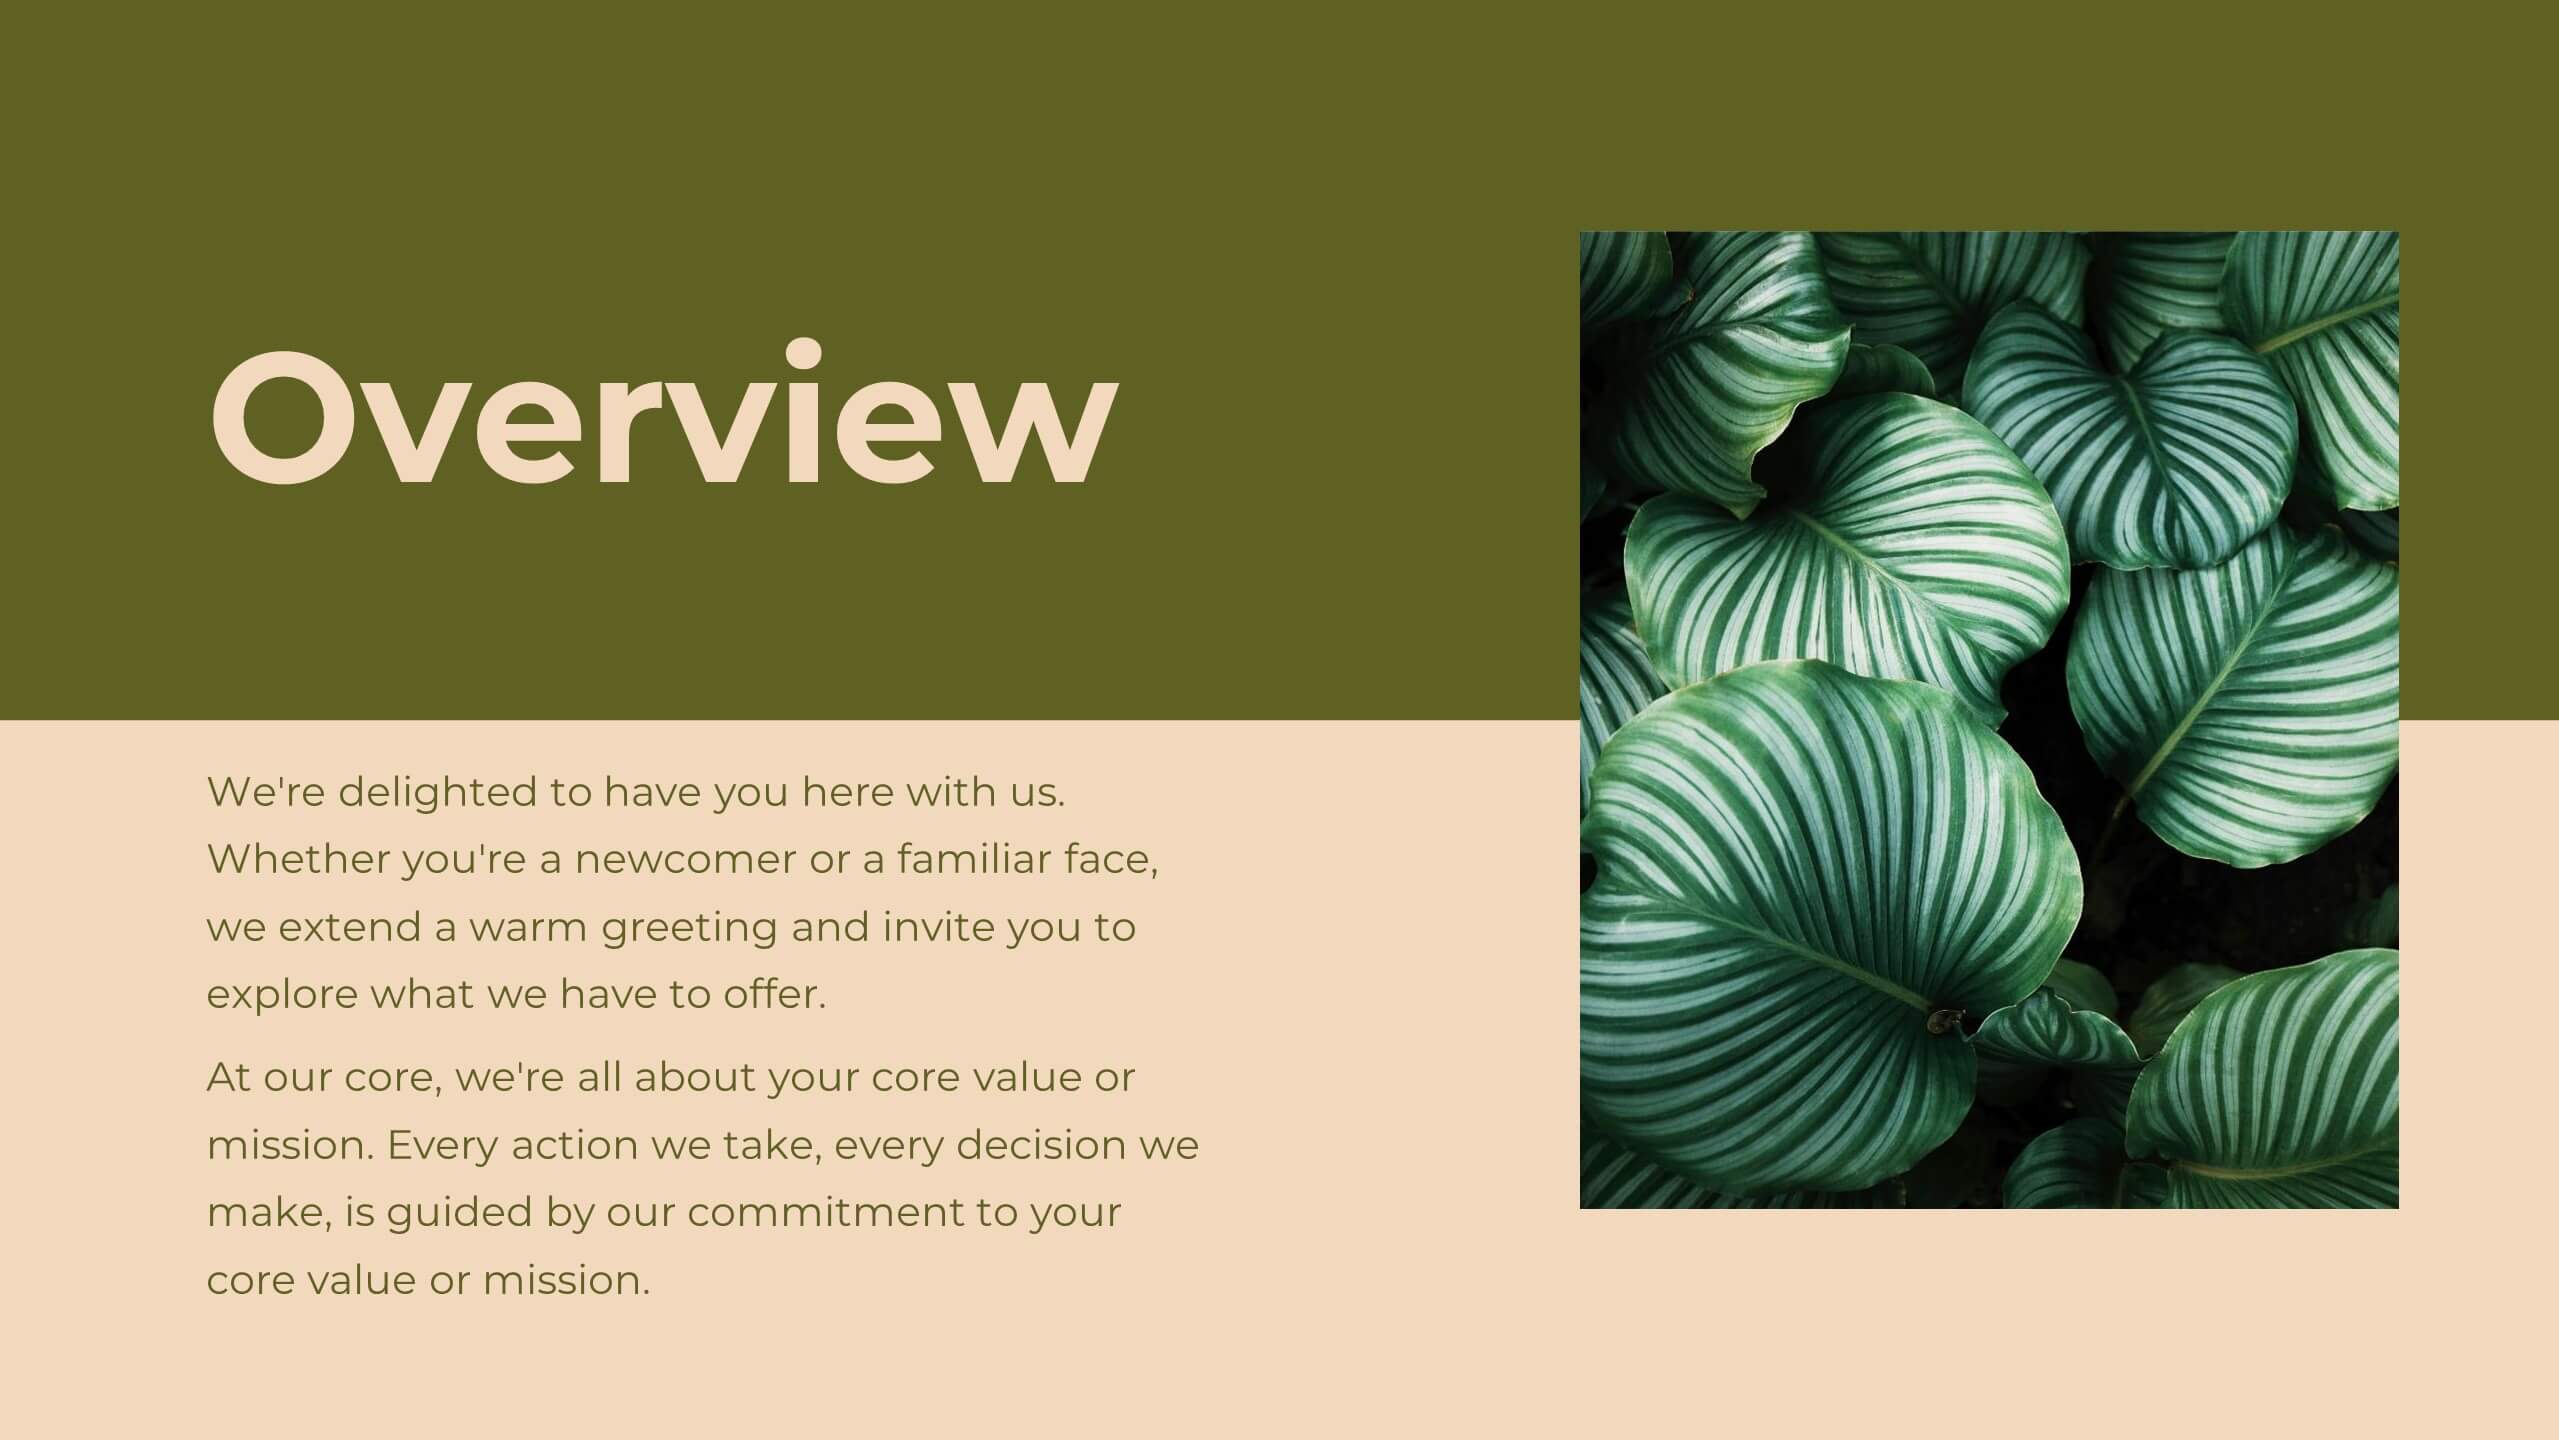
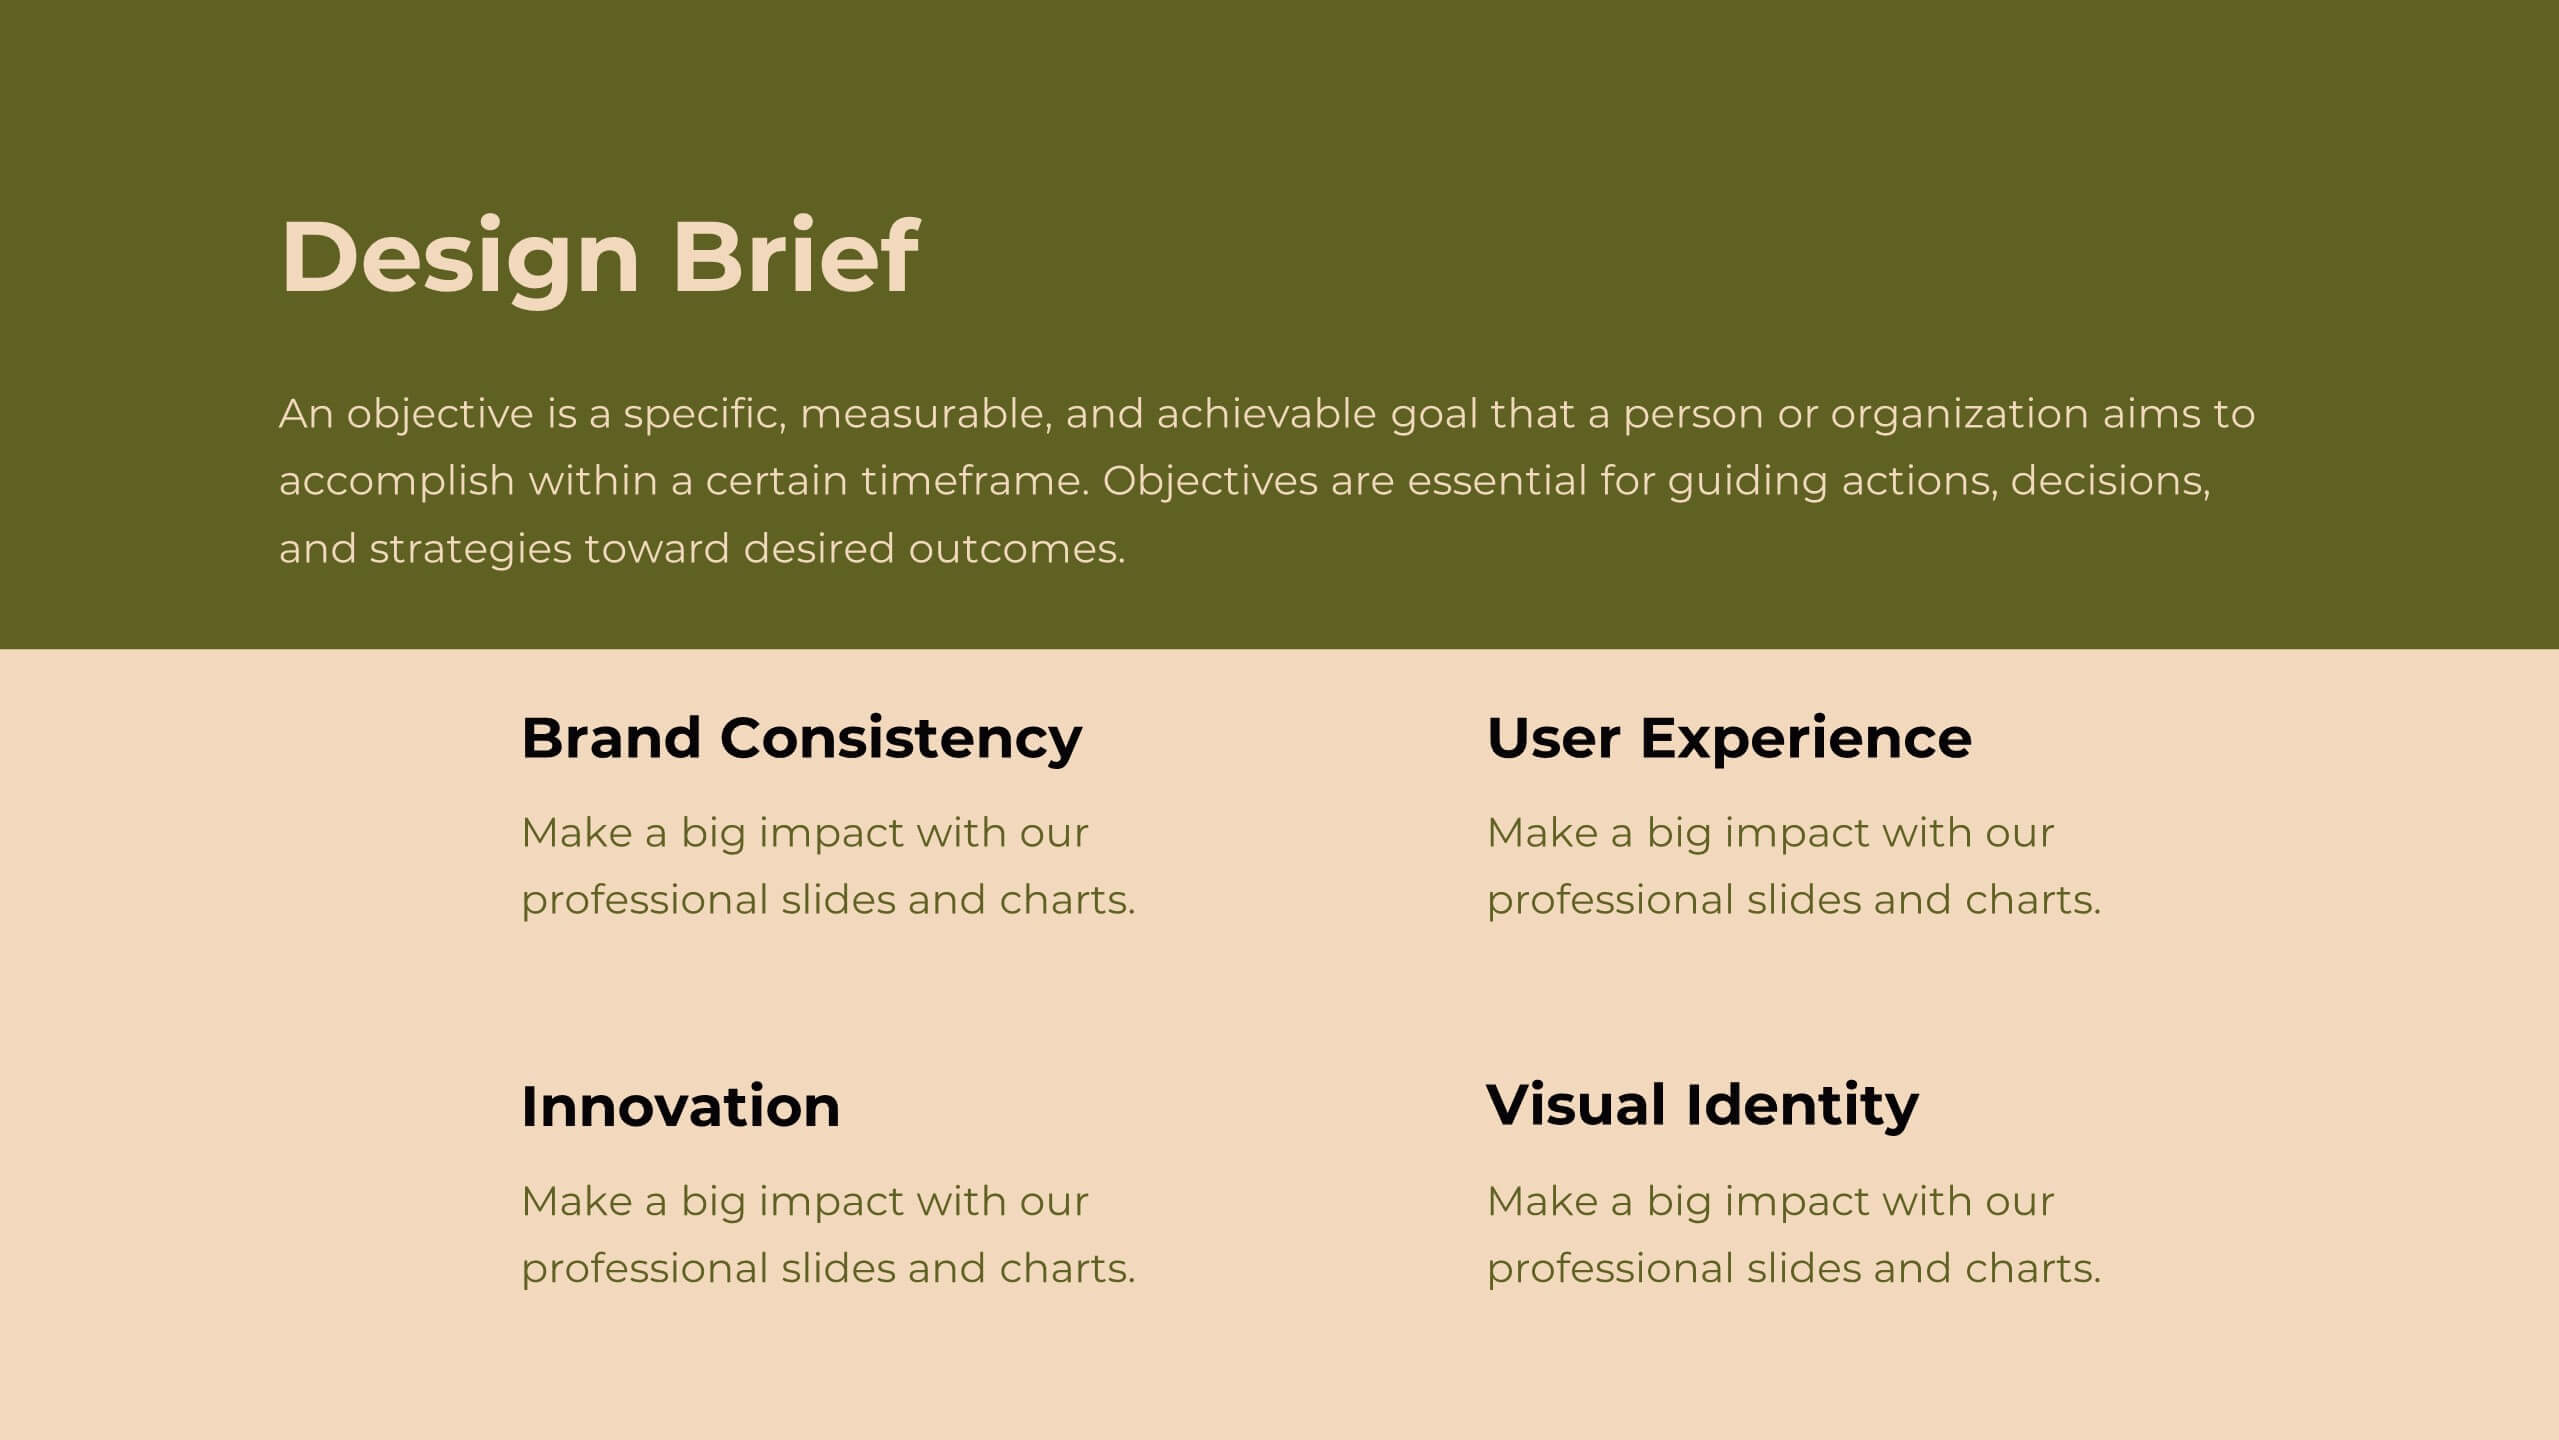
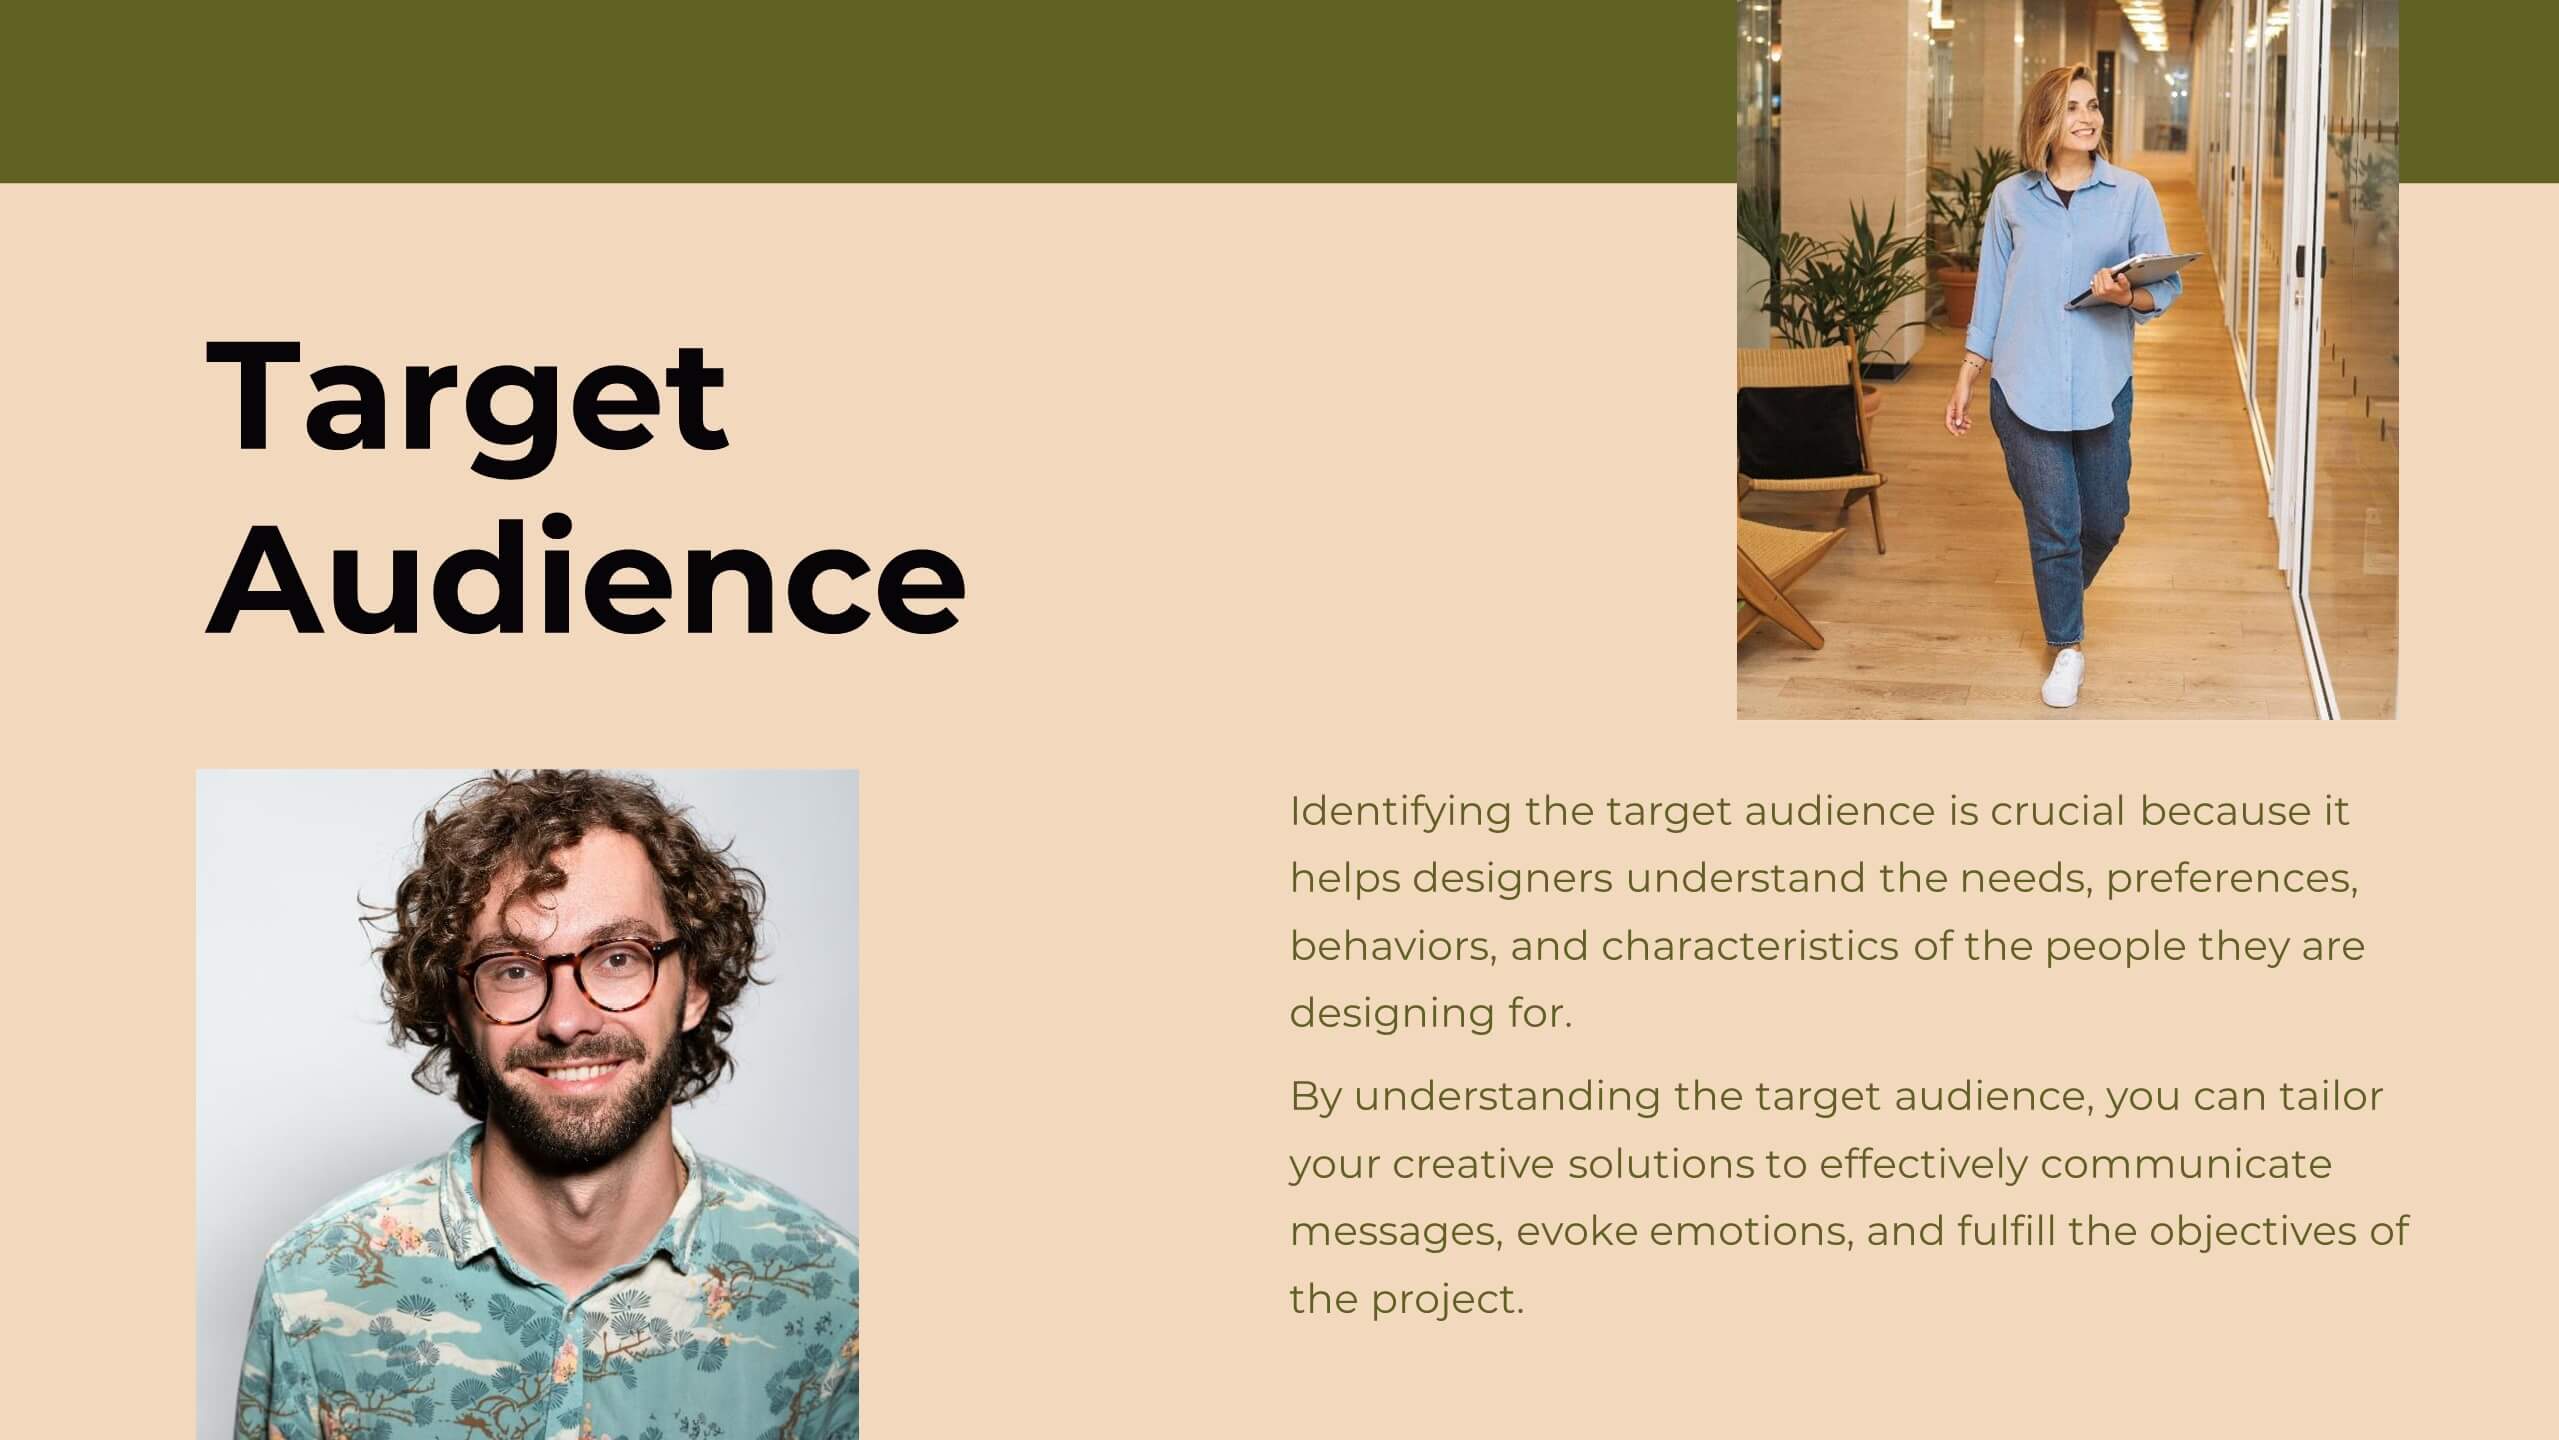
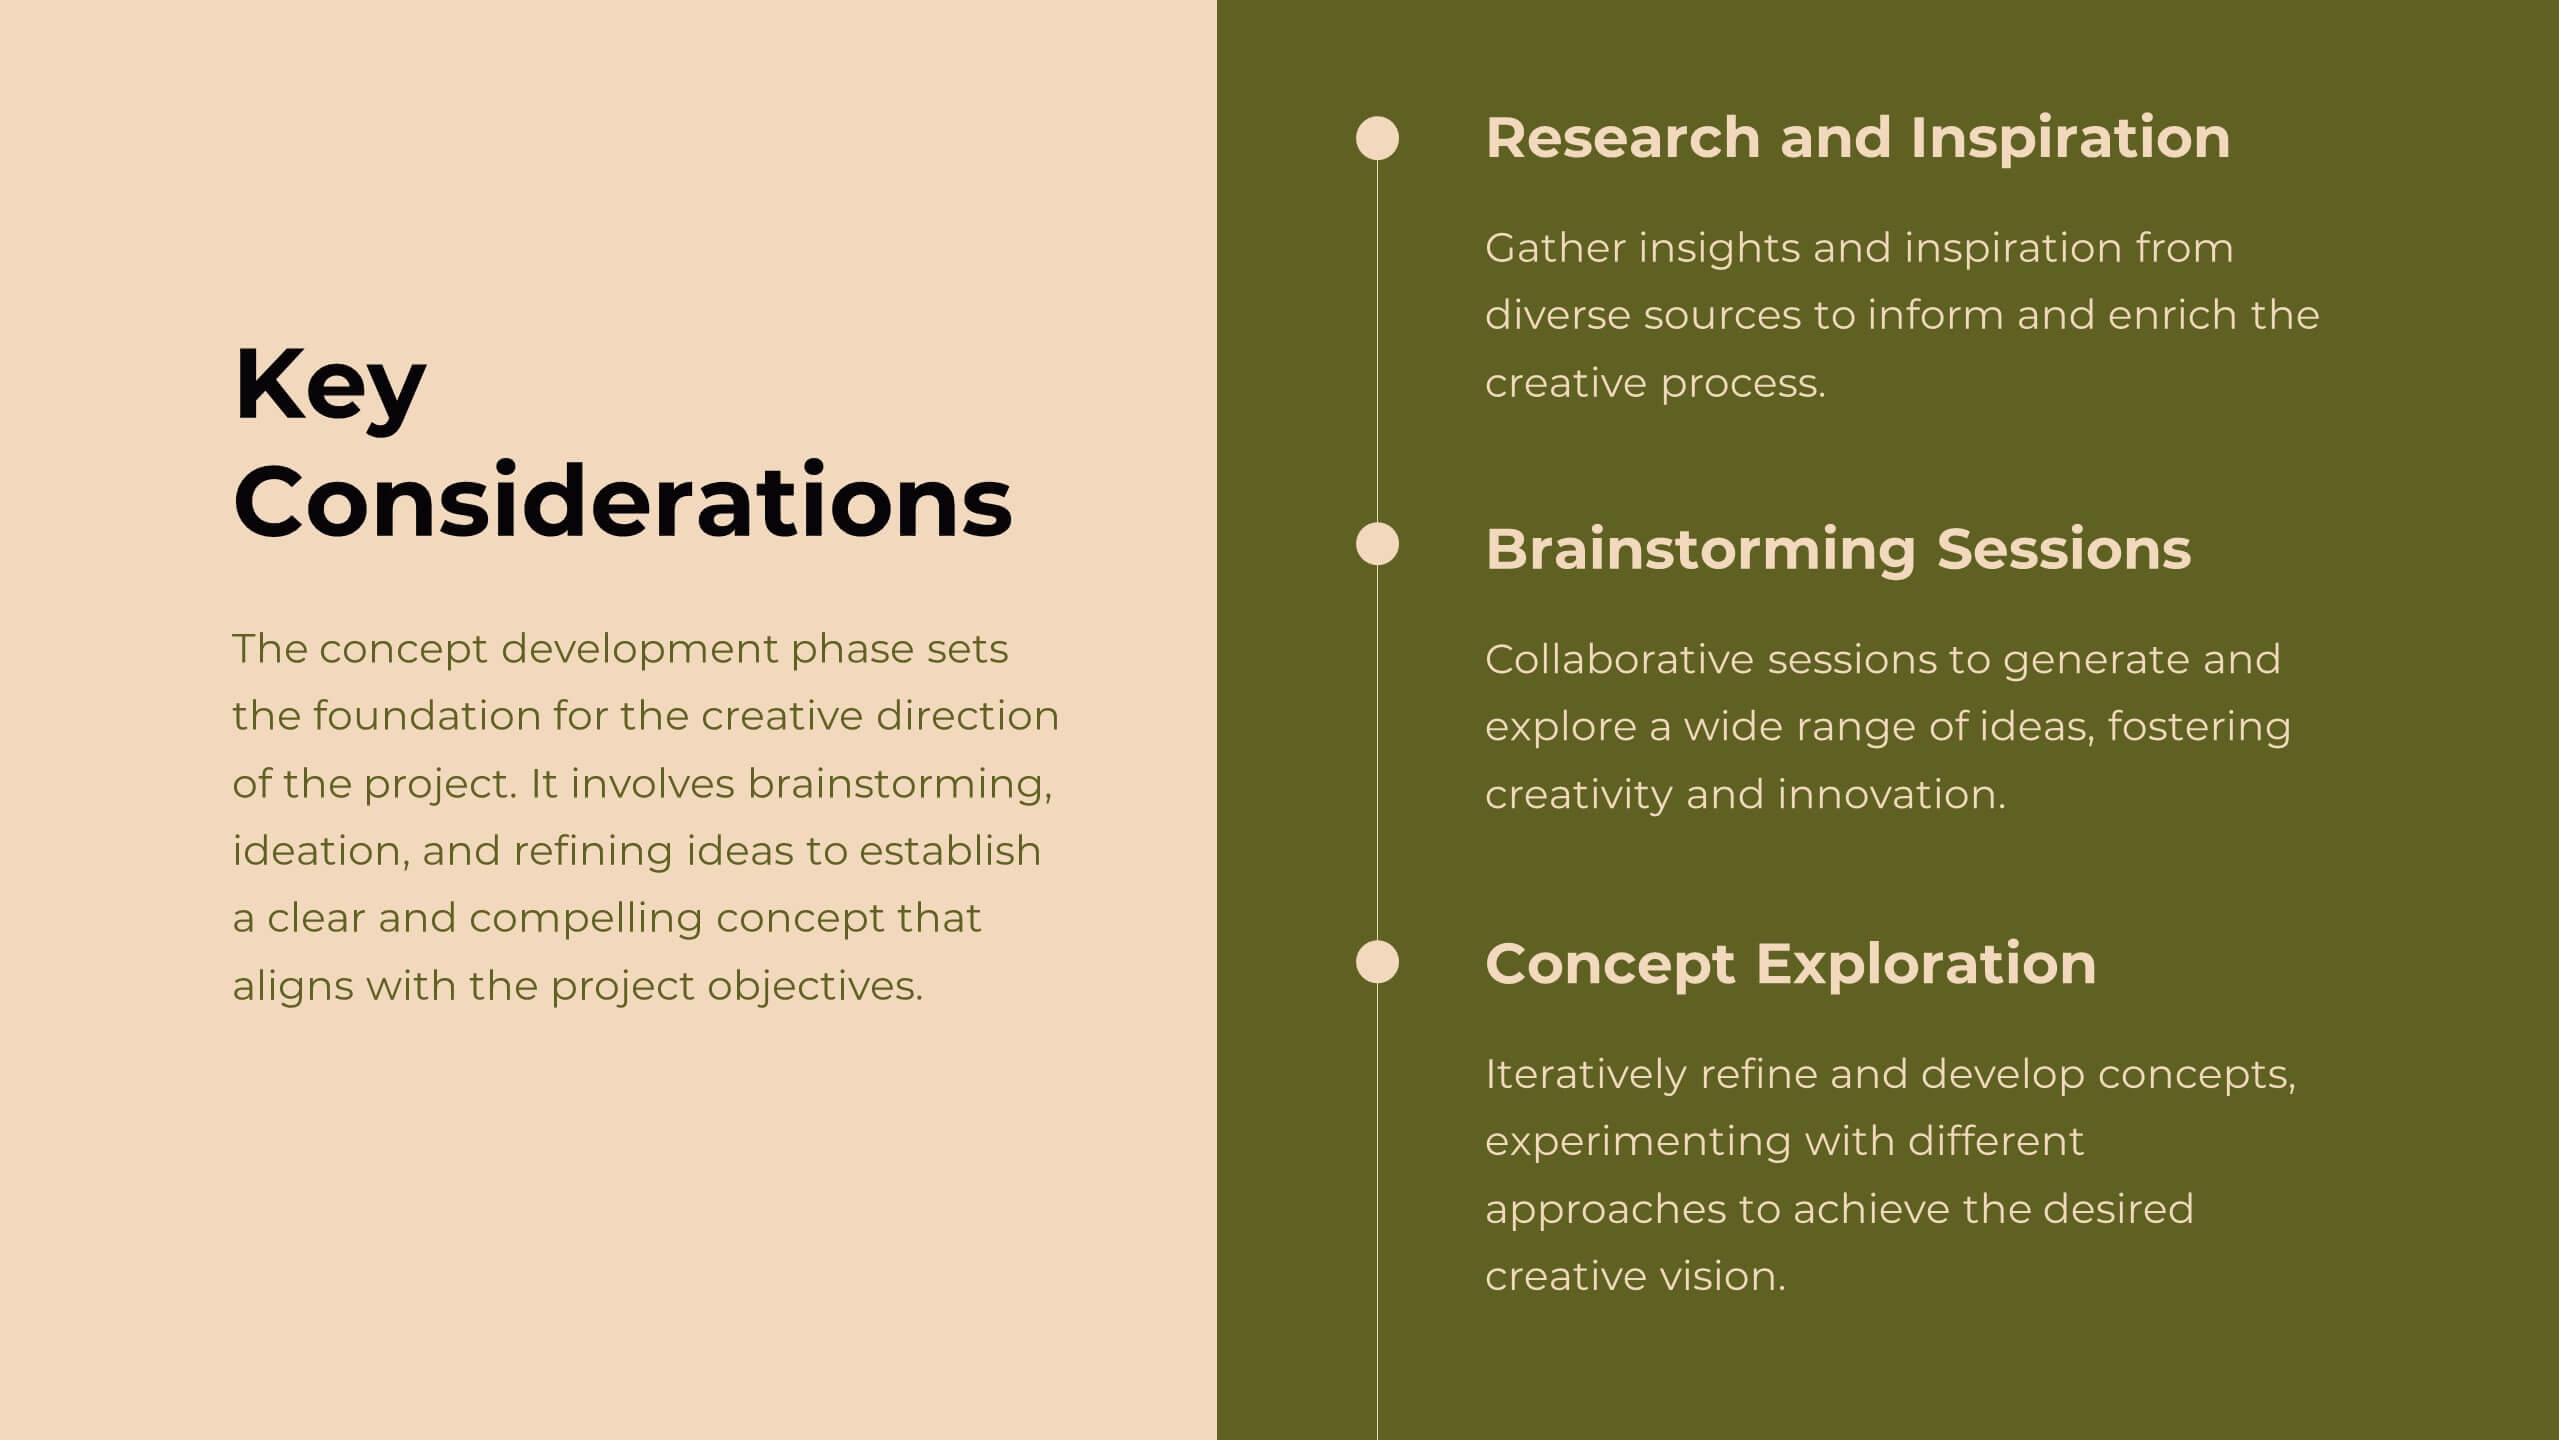
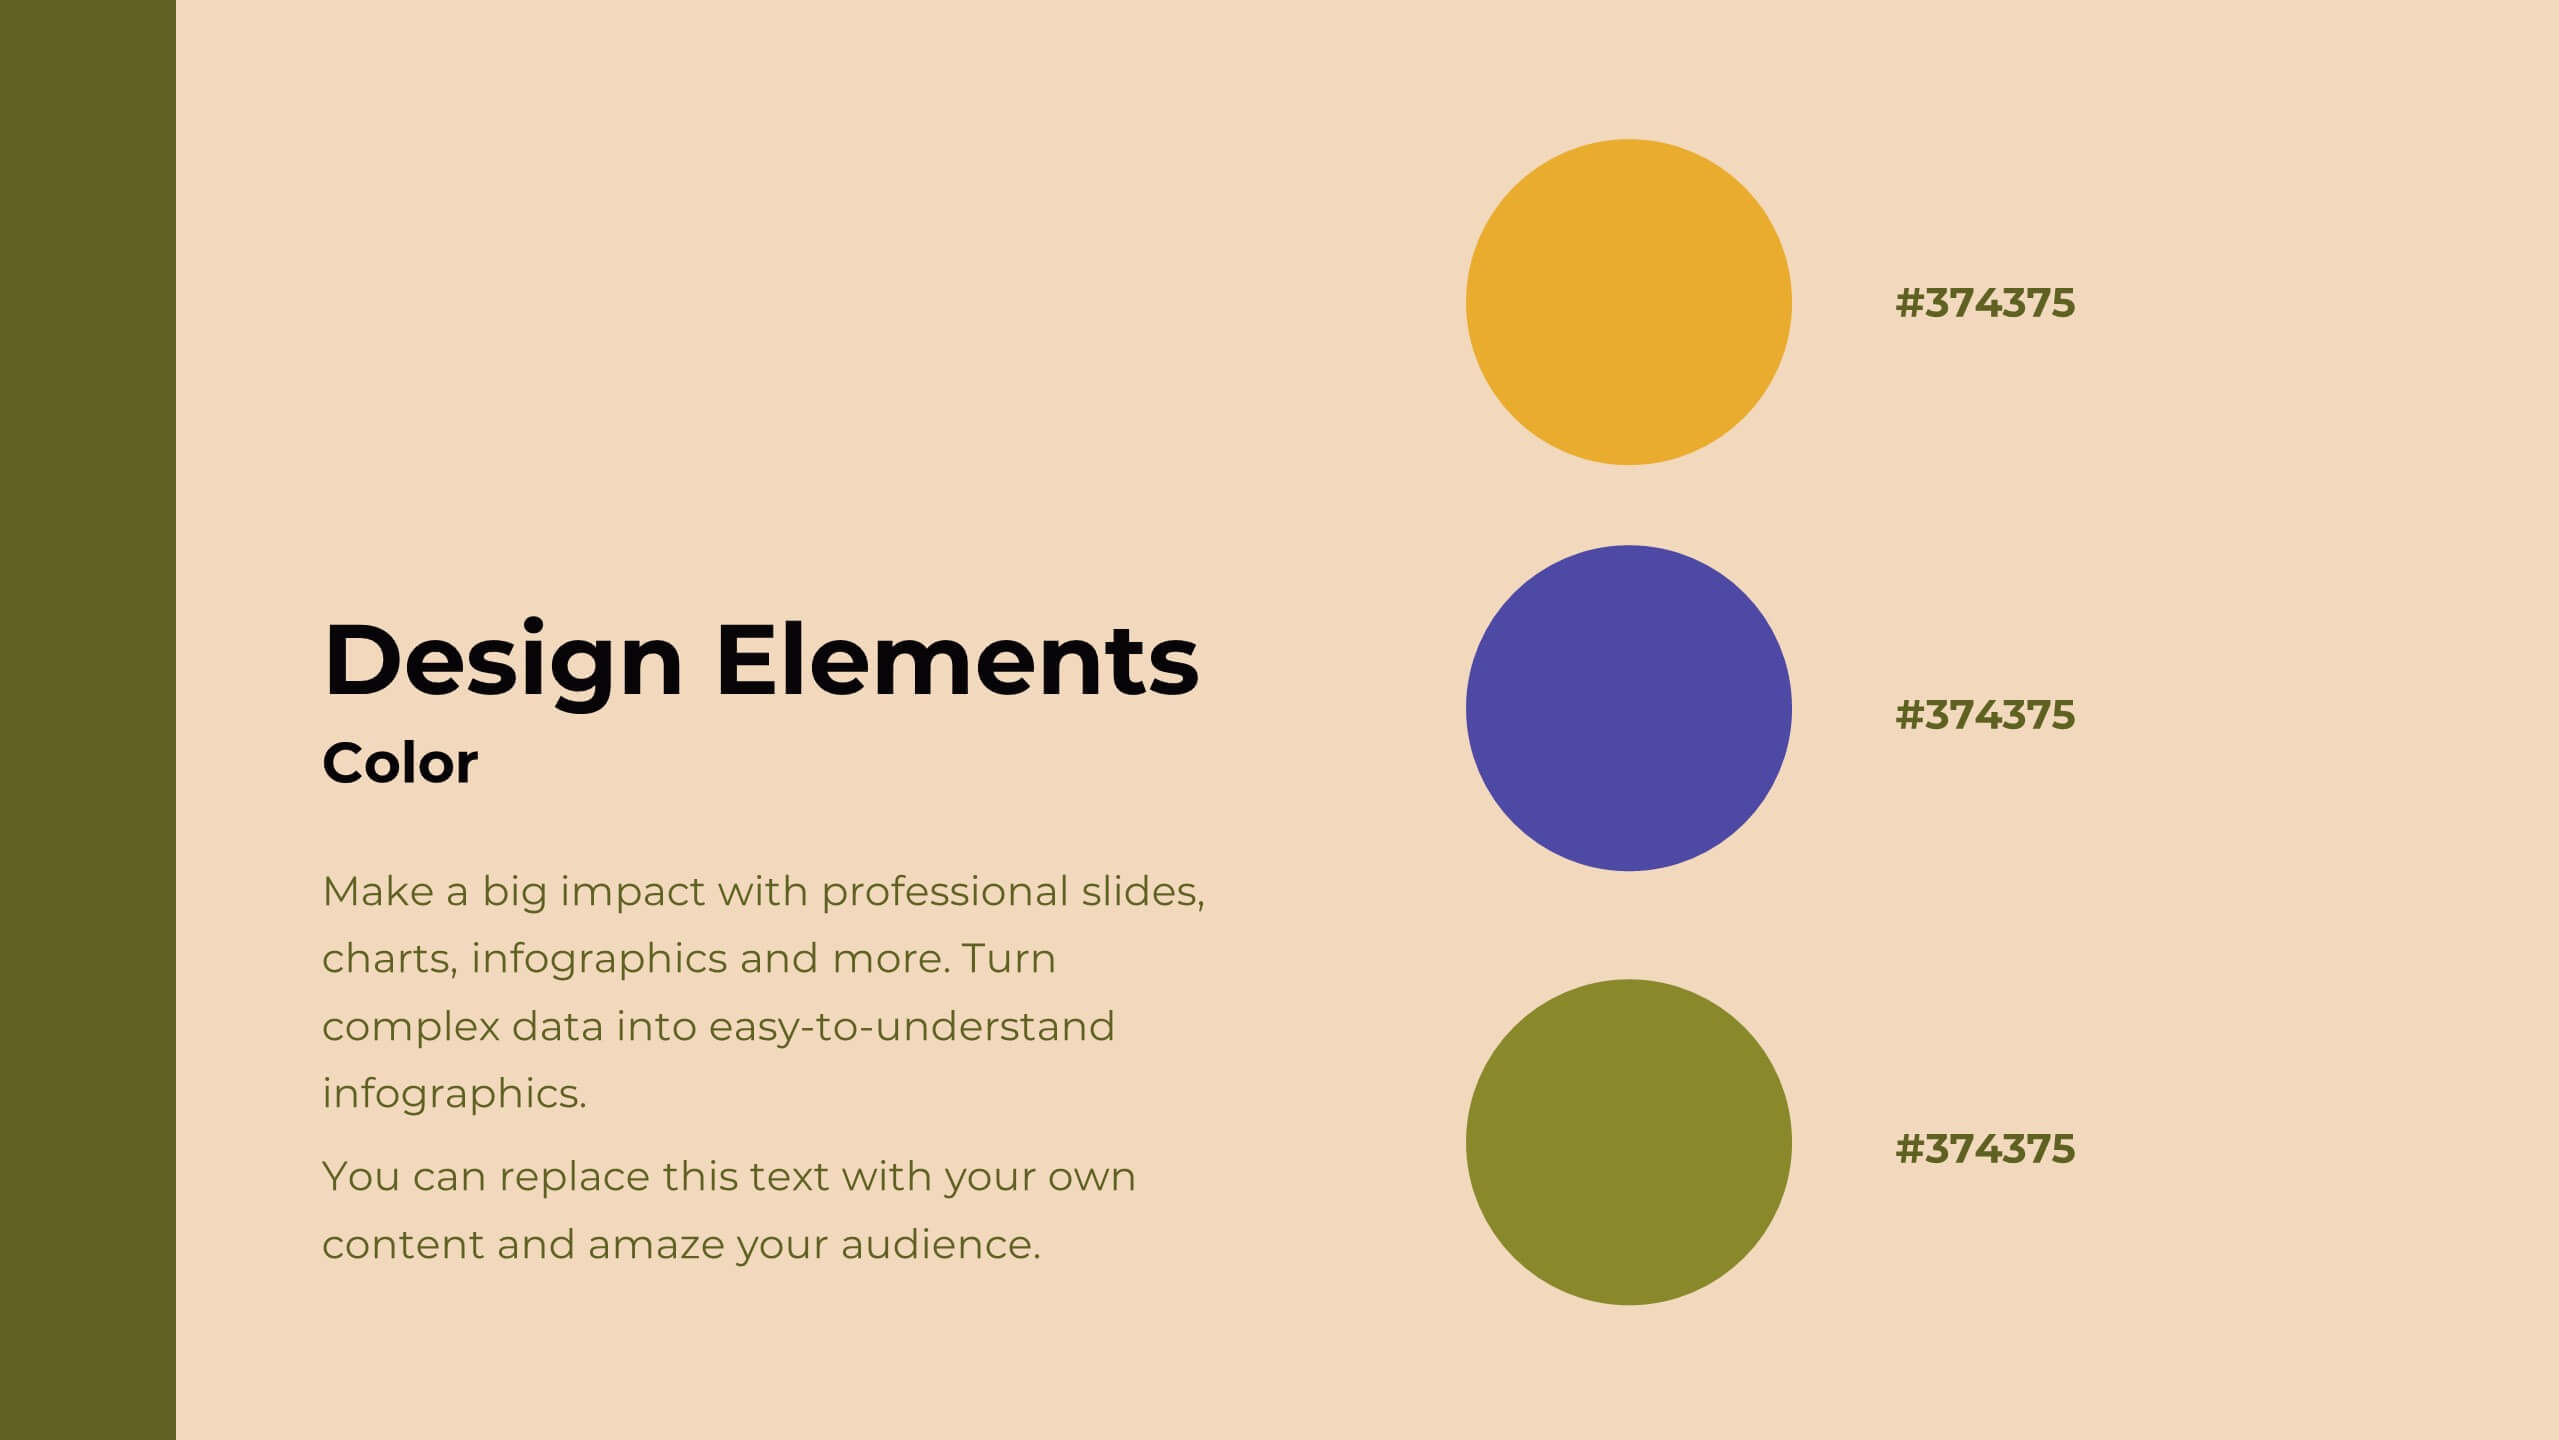
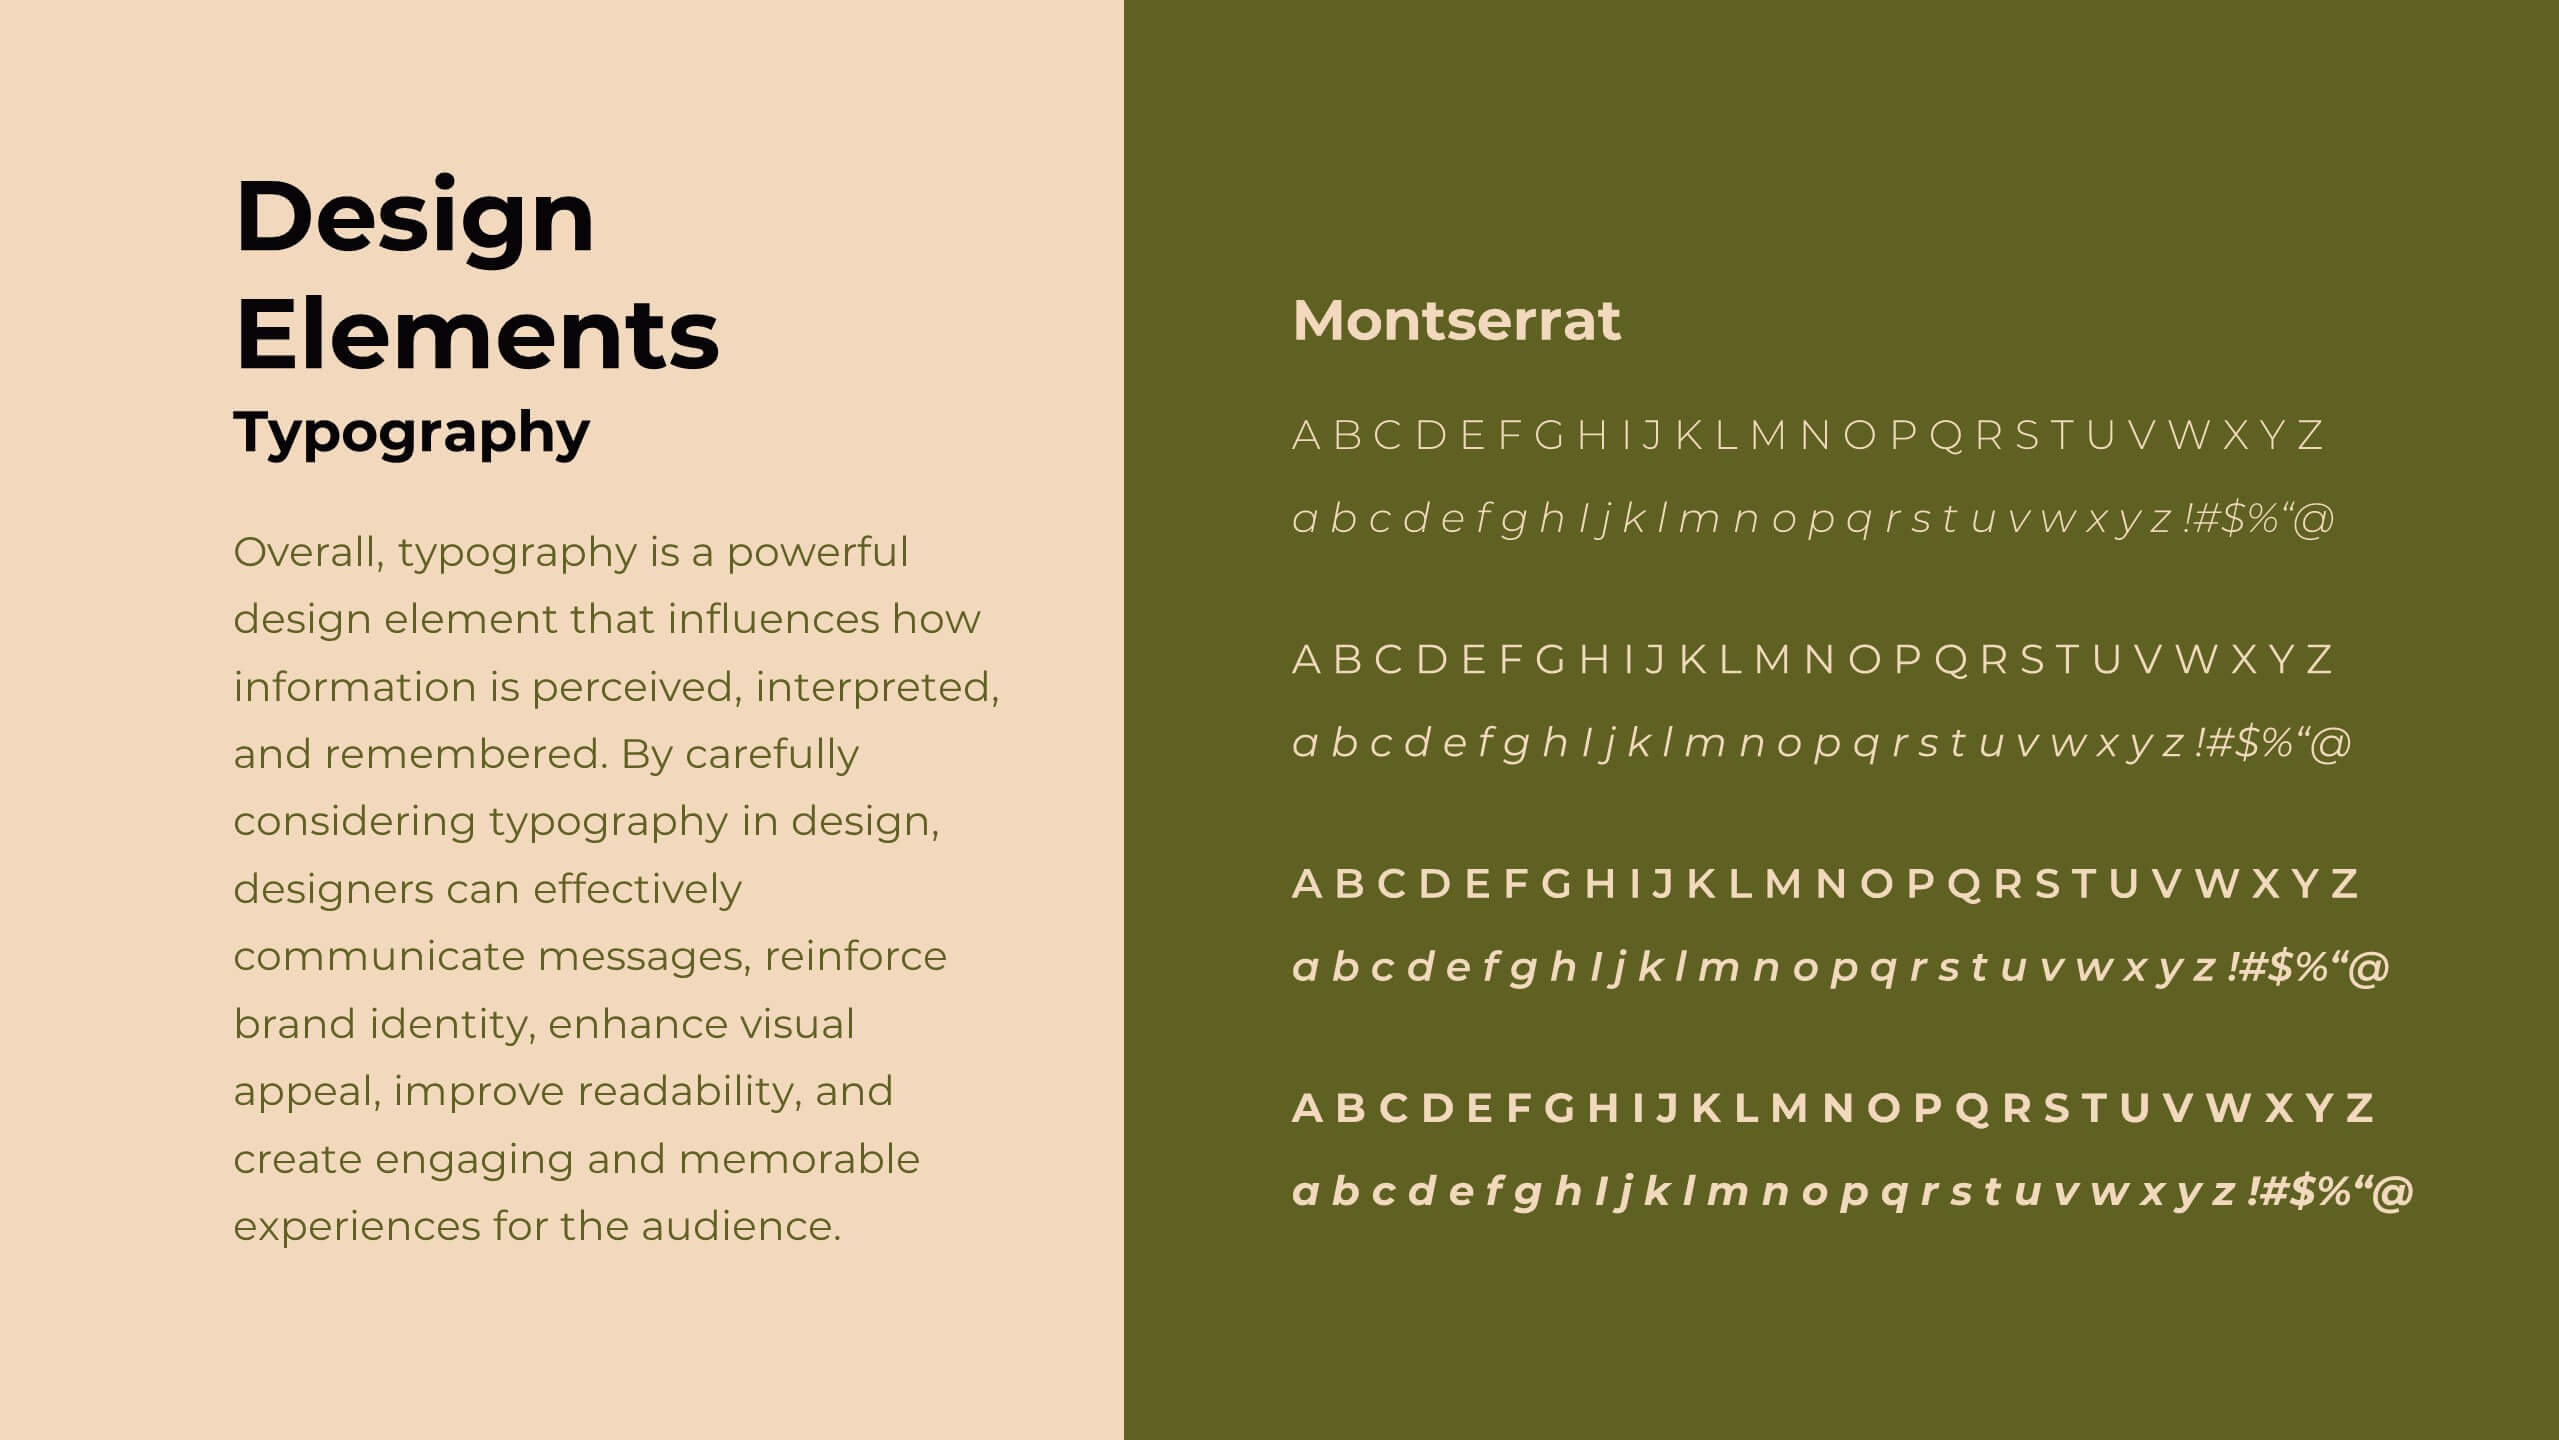
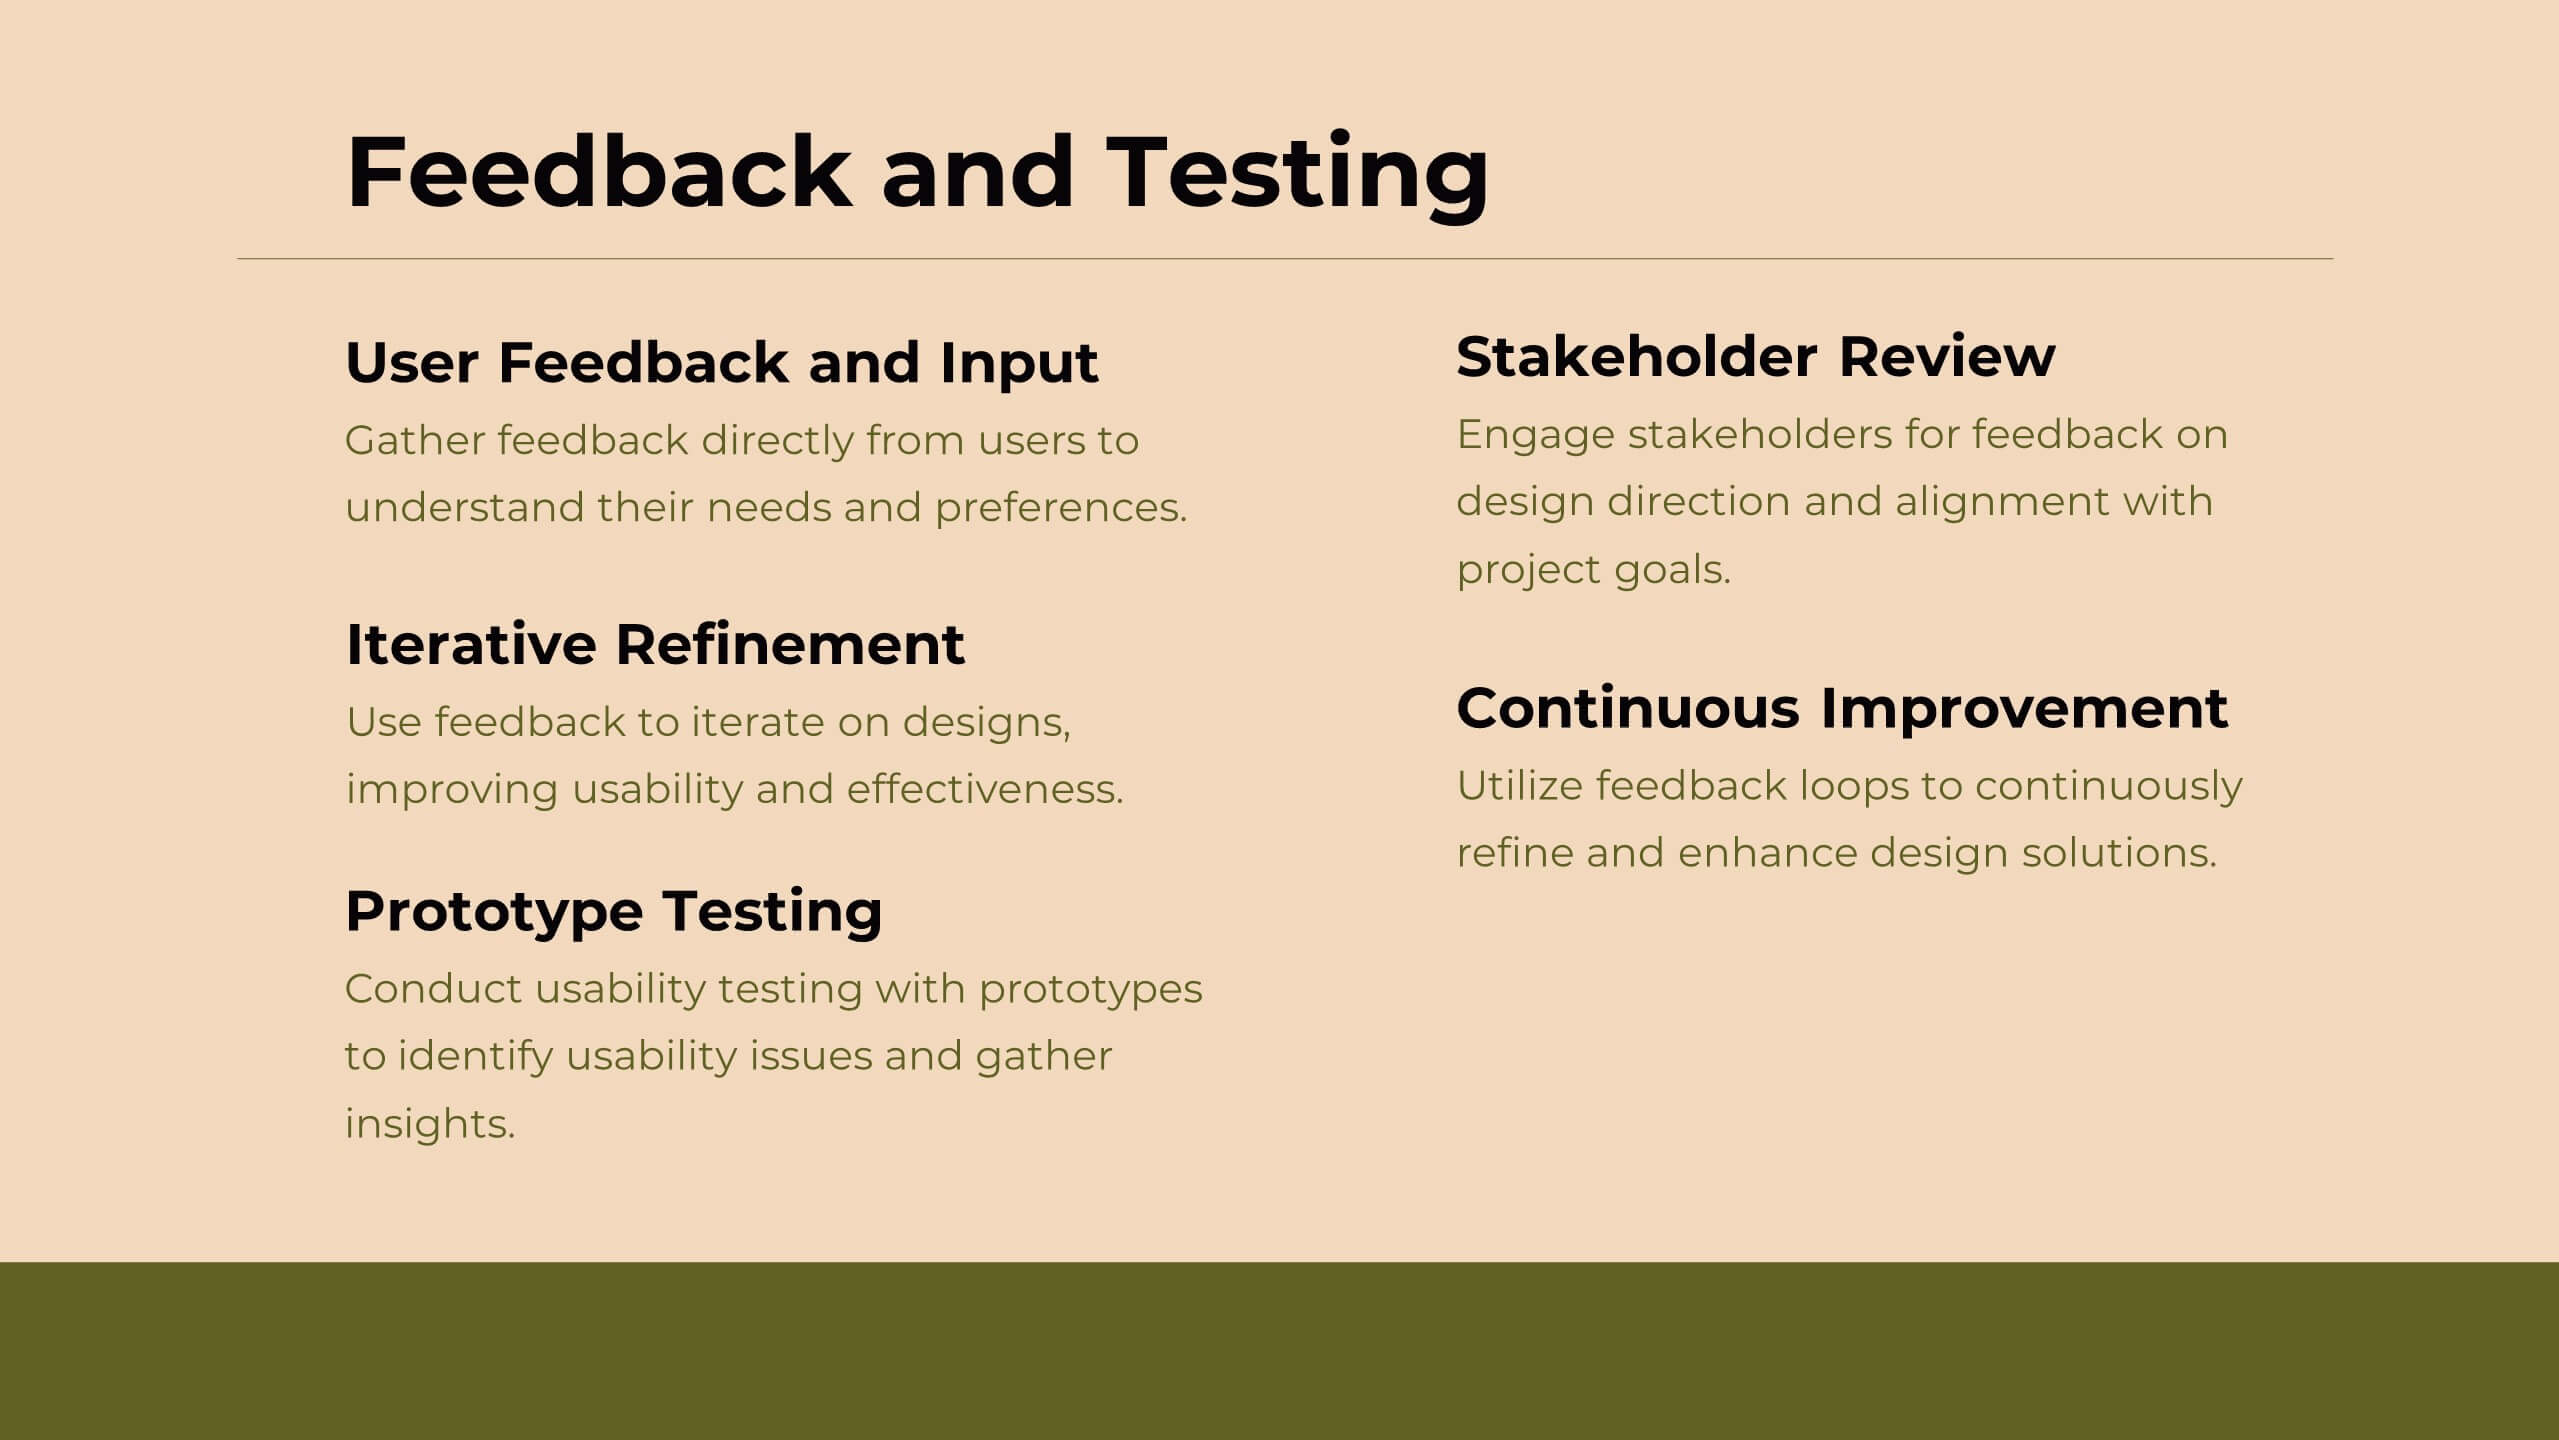
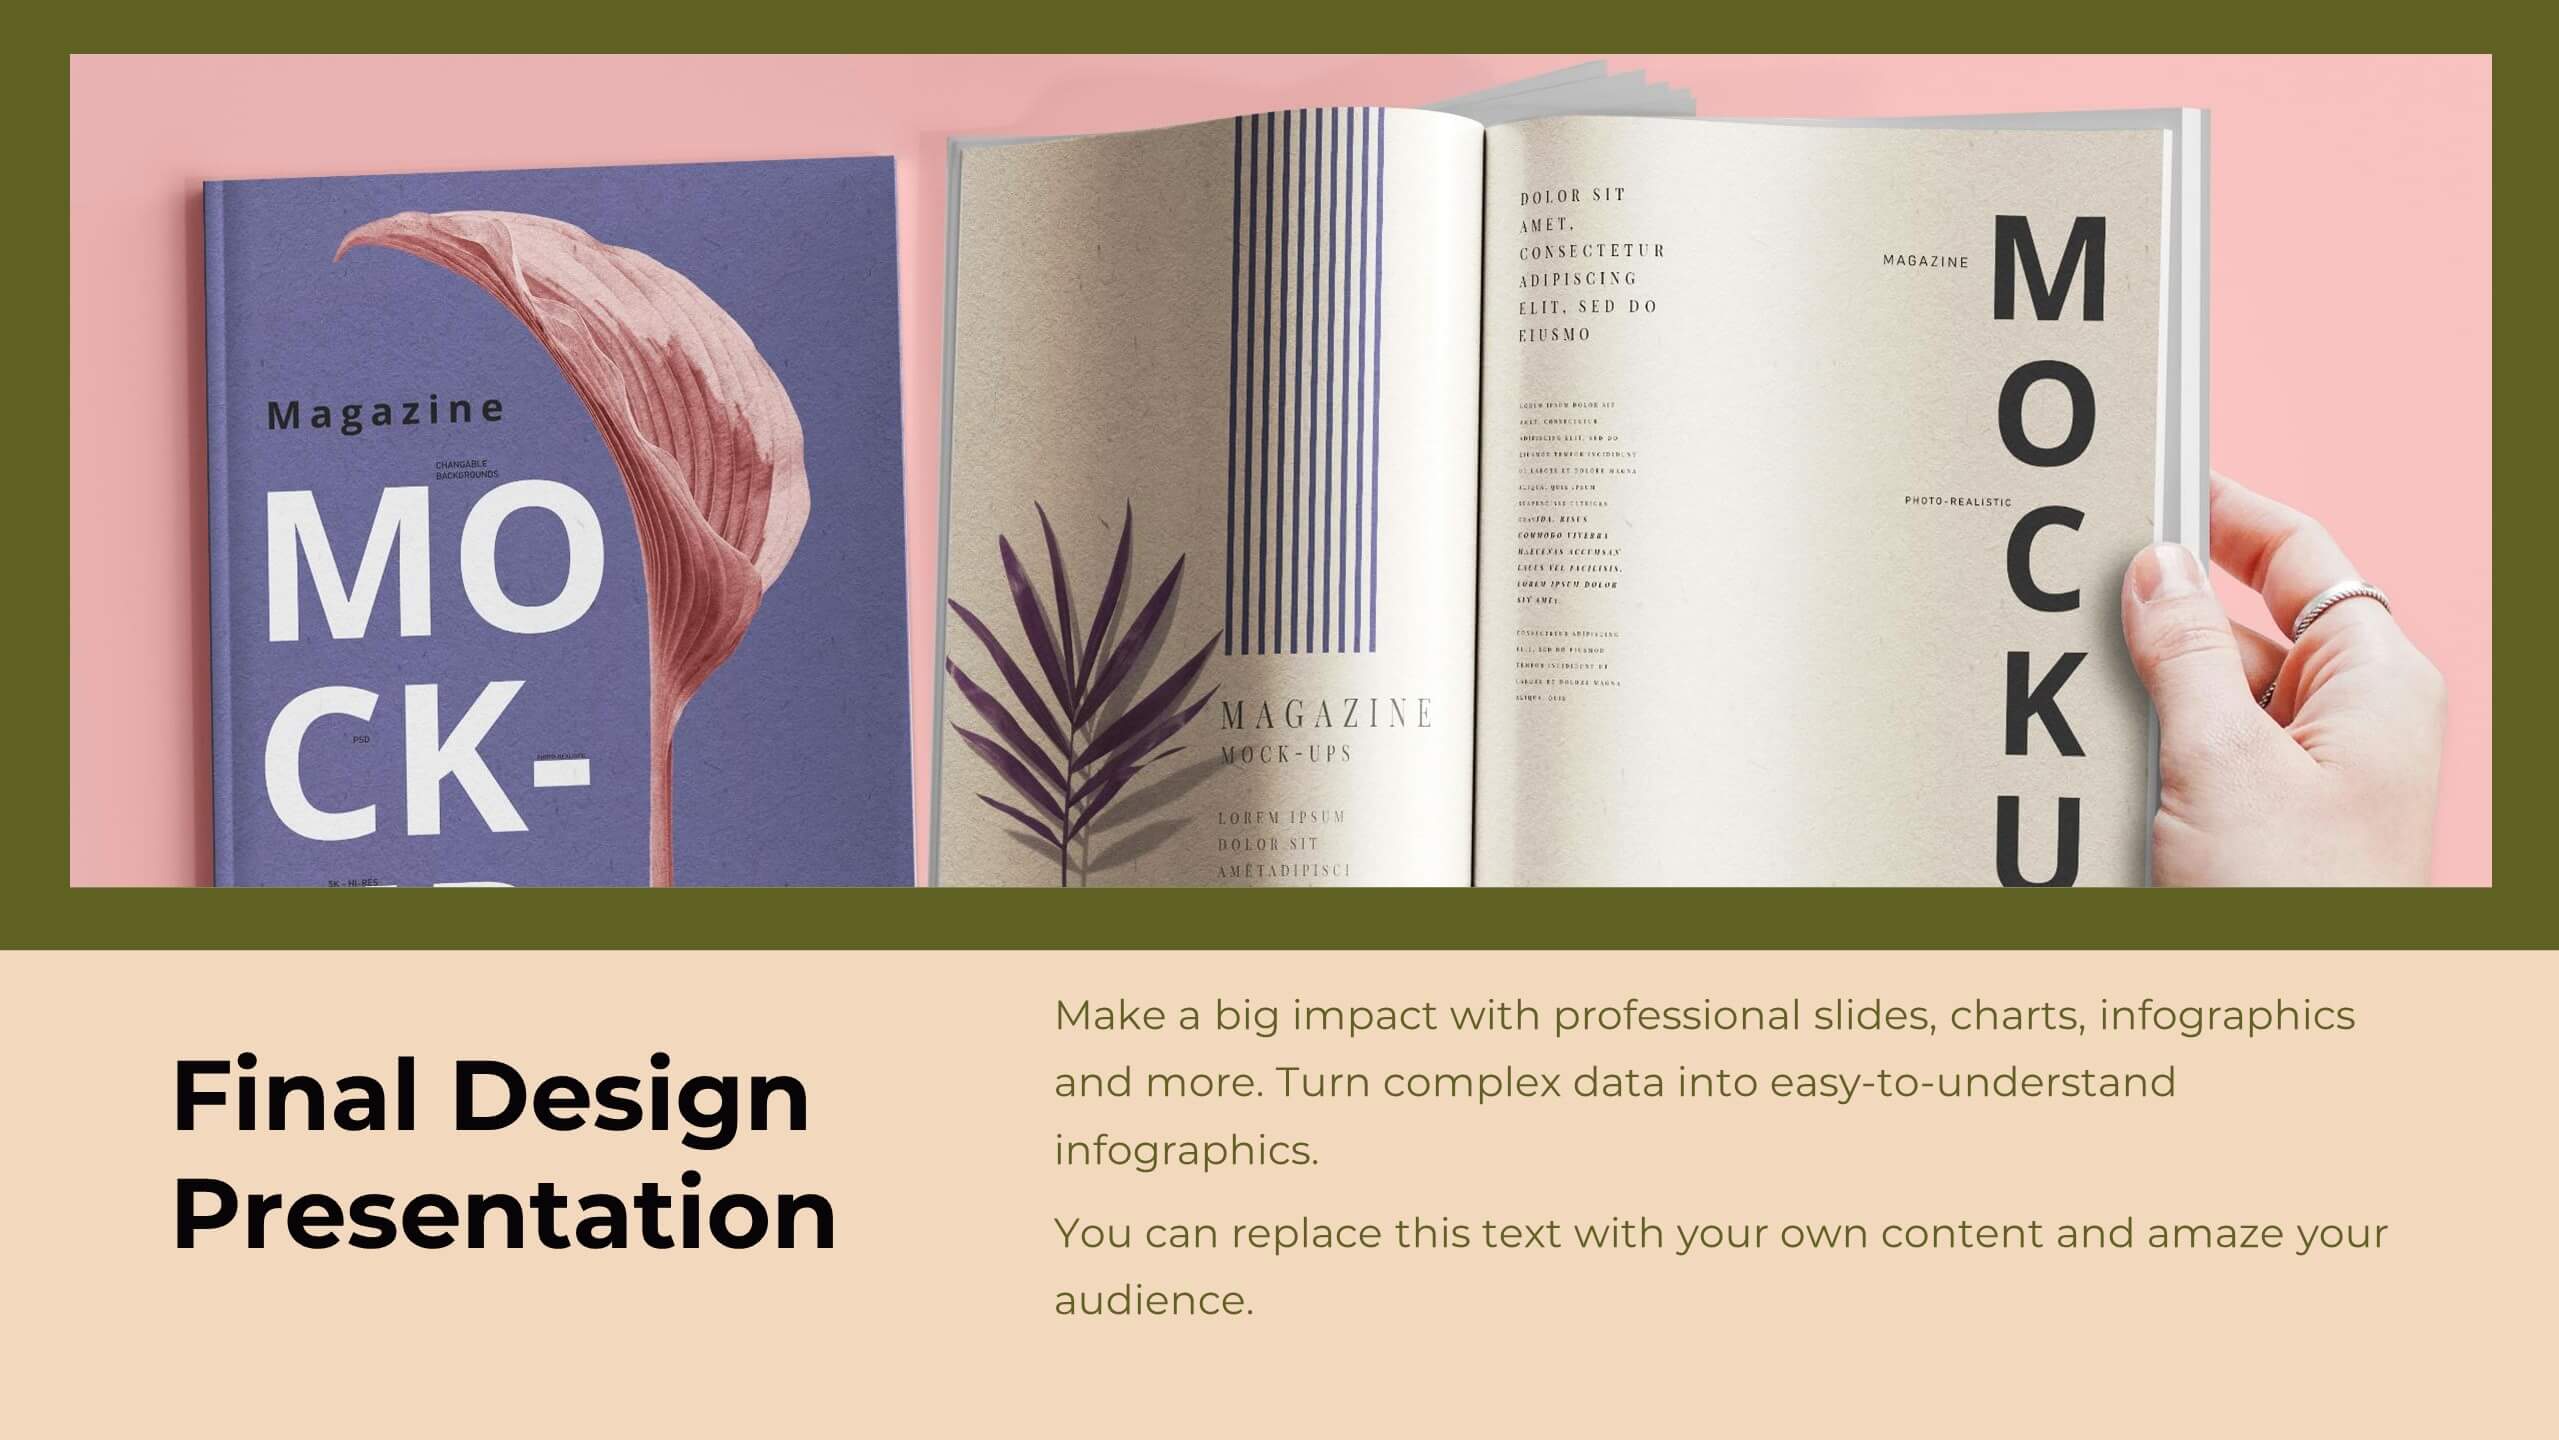
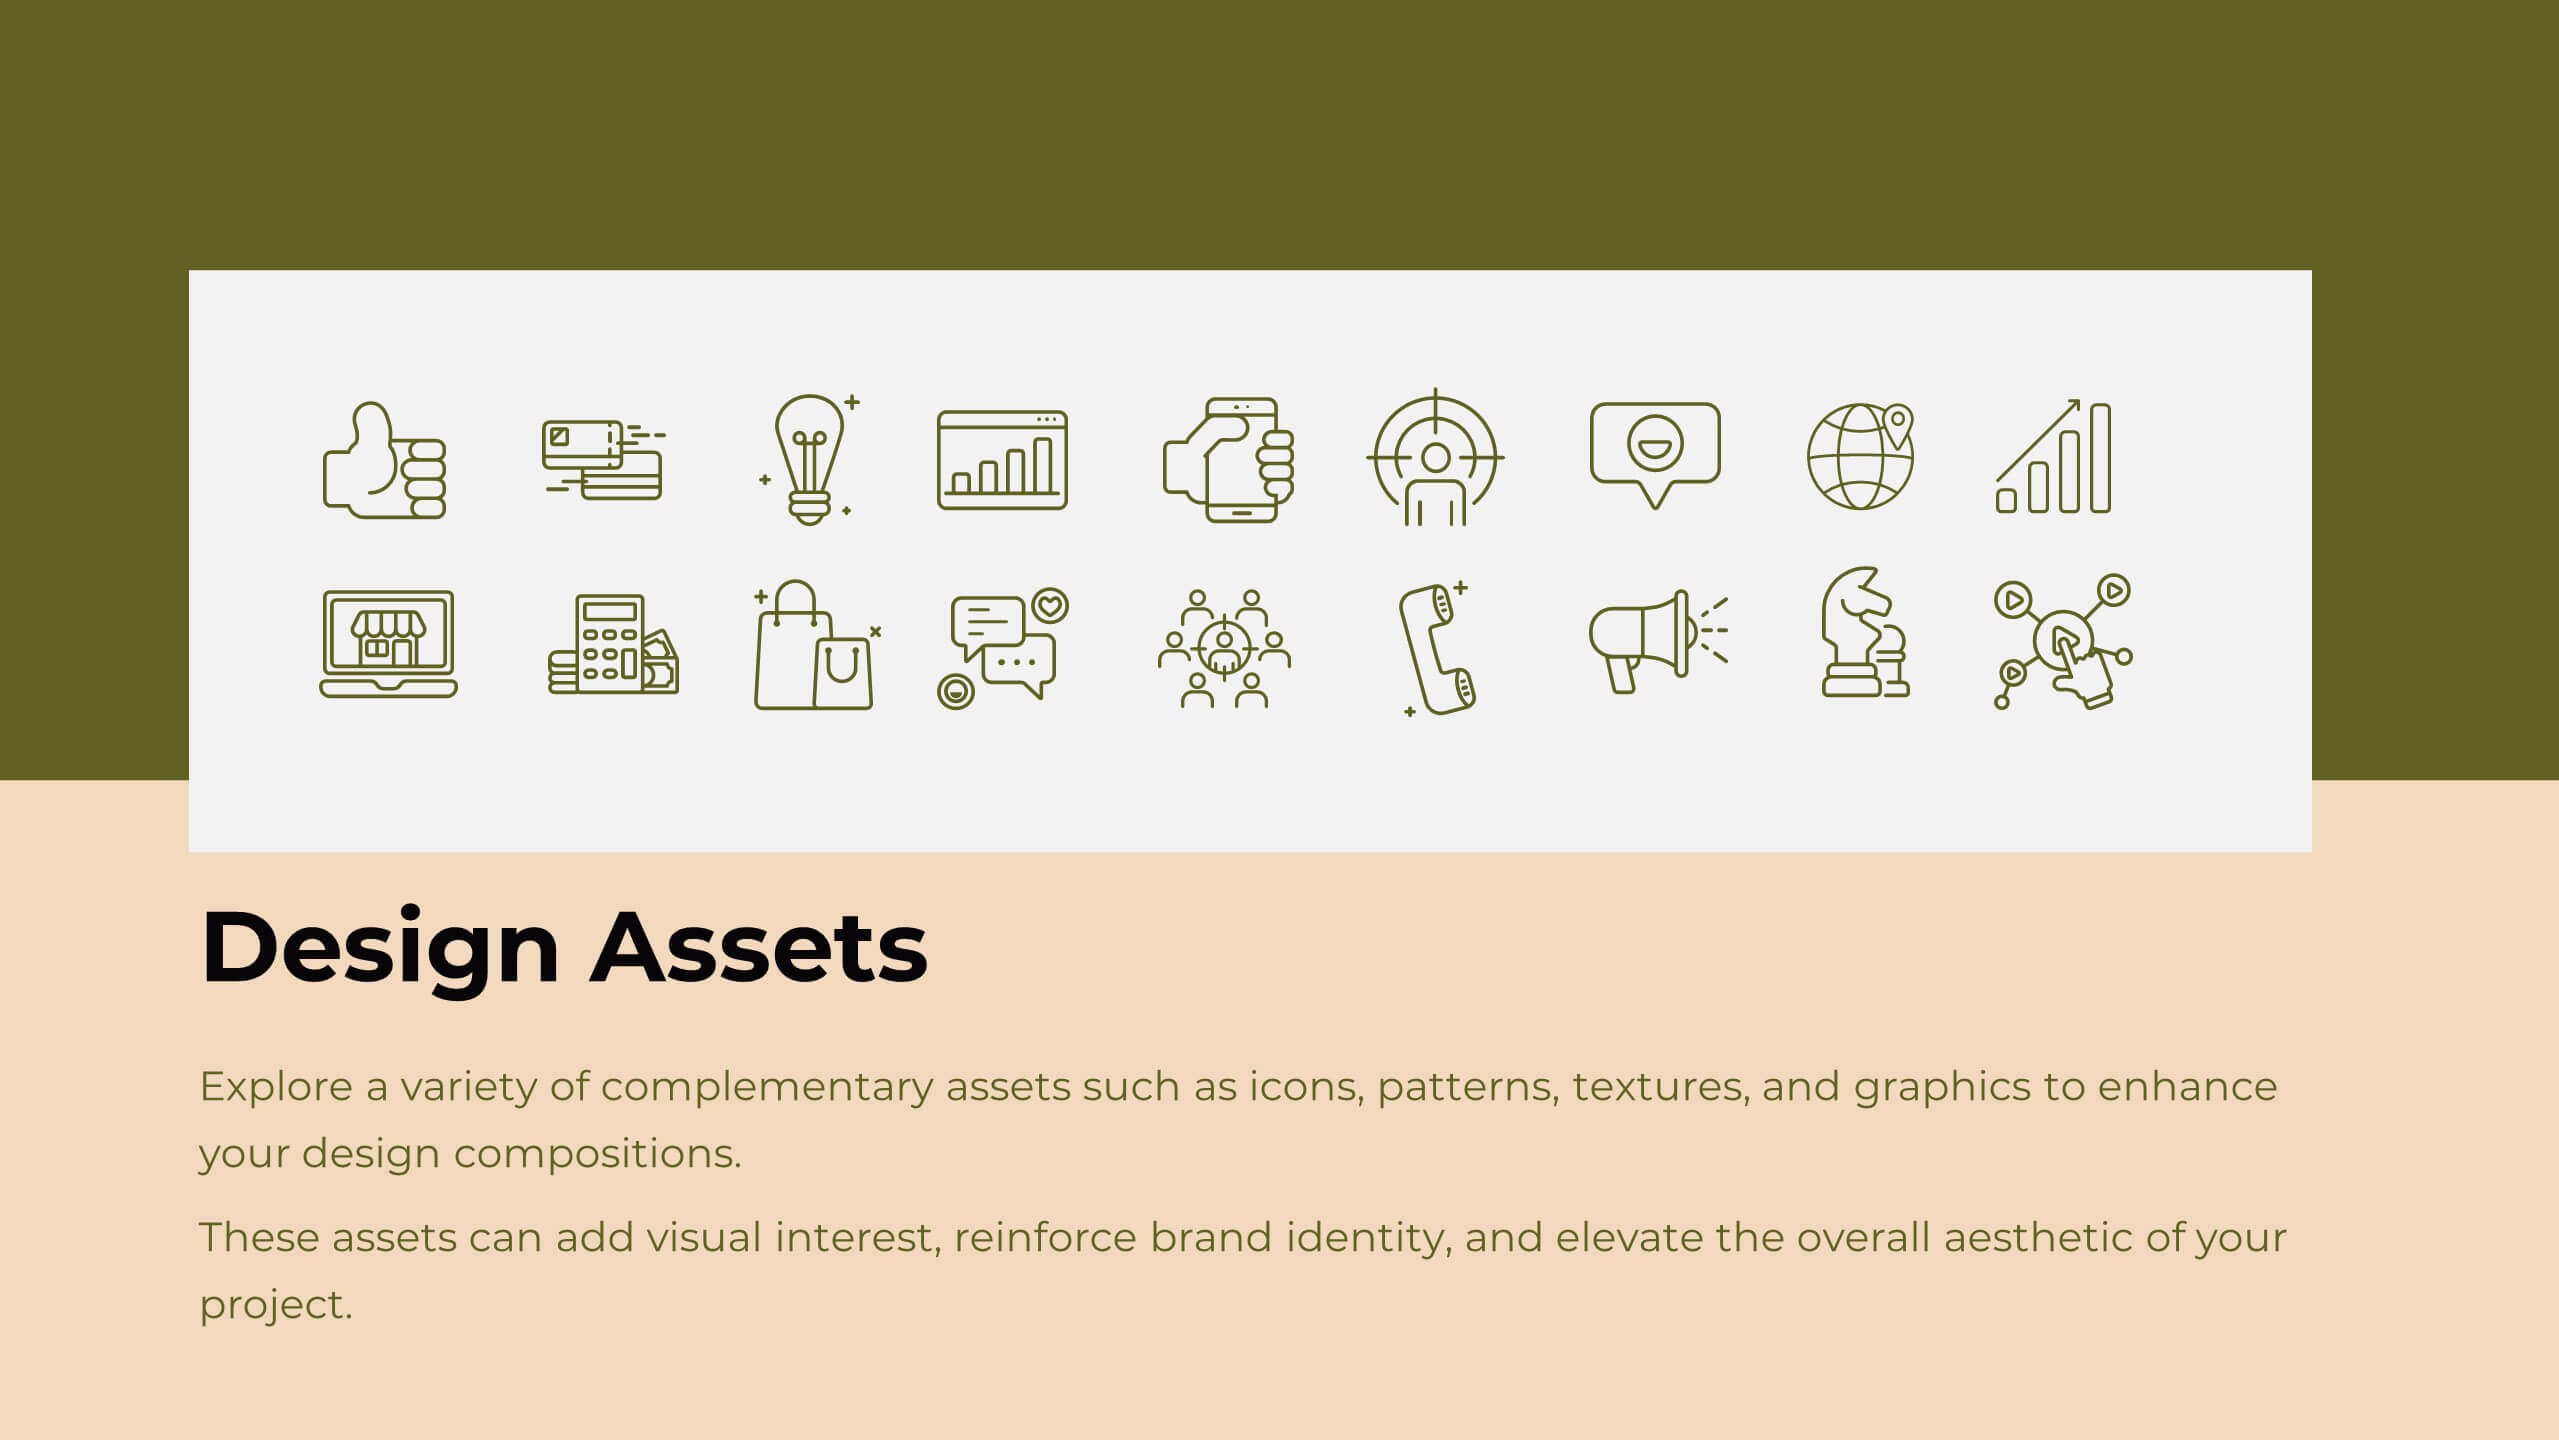
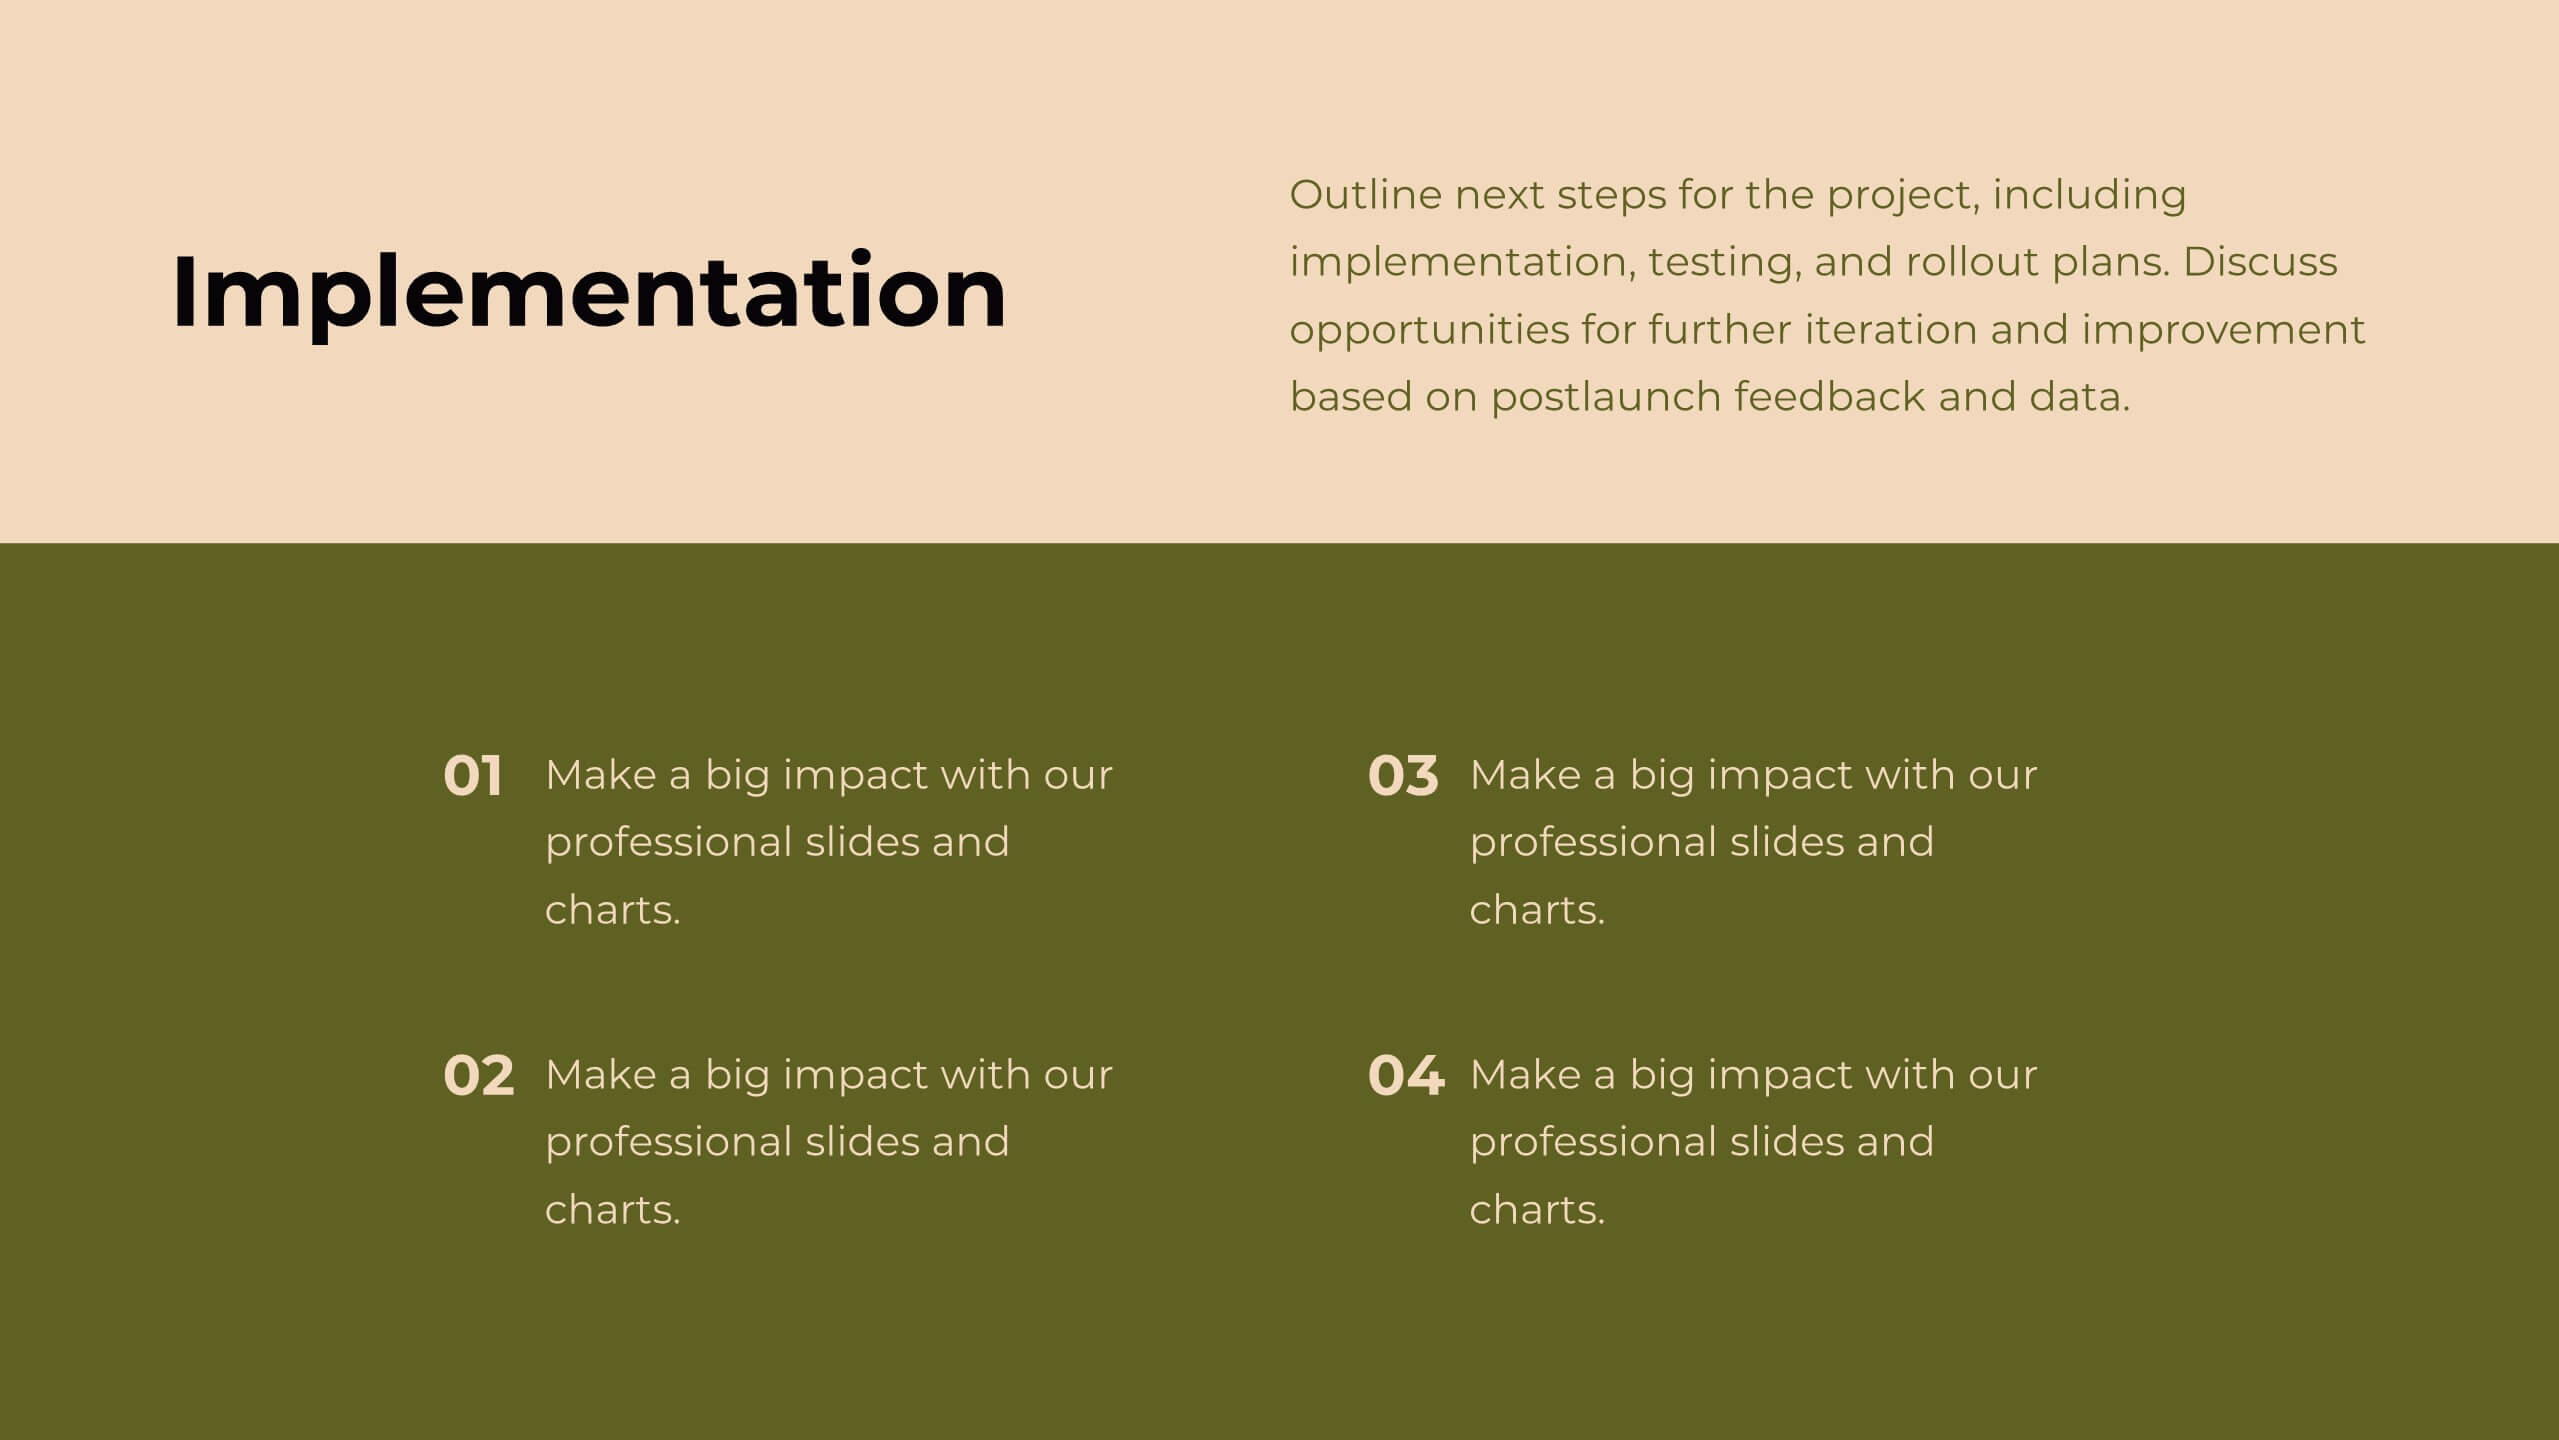
Delta Design Strategy Proposal Presentation
Transform your design strategy with this elegant proposal template! Perfect for presenting design briefs, target audience insights, and concept development. Ideal for designers and creative teams aiming to align vision and execution. Compatible with PowerPoint, Keynote, and Google Slides, this template ensures your design strategy is clear, professional, and compelling. Elevate your projects today!


5 diapositivas
Puzzle-Based Team Alignment Strategy Presentation
Bring collaboration to the forefront with the Puzzle-Based Team Alignment Strategy Presentation. This creative layout uses interlocking puzzle pieces to represent interconnected team roles, milestones, or initiatives—perfect for showcasing synergy and strategic cohesion. Each section is color-coded and icon-enhanced for quick visual recognition, making it ideal for team briefings, onboarding, or workflow planning. Fully editable in PowerPoint, Keynote, and Google Slides.


7 diapositivas
World Map Population Infographic Presentation
A World Map is a representation of the Earth's surface, showing the outlines and its continents, countries, oceans, and other features. This template is designed to show the distribution of the world's population in a visually stunning way. Quickly and easily customize with your own data and you'll have an infographic that will engage your audience and convey your message. It comes in three different colors, so you can divide it how you need and change the color of certain sections. This template also includes several labels with colors, and charts showing distribution across countries.


4 diapositivas
Current vs Future State Gap Presentation
Take your audience on a journey of progress with this dynamic slide, designed to clearly compare where things stand today and where they’re headed next. It helps highlight key gaps, improvement areas, and strategic opportunities with a simple, visual flow. Fully compatible with PowerPoint, Keynote, and Google Slides.


21 diapositivas
Cascade Marketing Proposal Template Presentation
Ignite your creativity with our dazzling Cascade Marketing Proposal Template Presentation! This captivating design brings your ideas to life, ensuring your presentation stands out. The sleek, dark theme is punctuated by electric blue accents, adding a modern, professional touch. Each slide is meticulously crafted, offering a perfect blend of visuals and content that keeps your audience engaged from start to finish. From the Company Overview to Growth Projections, every aspect of your pitch is highlighted with style and clarity. The template is fully customizable, allowing you to tailor it to your brand's identity effortlessly. Whether you're pitching to investors or presenting internally, this template has everything you need to make a lasting impression. Compatible with PowerPoint, Keynote, and Google Slides, it’s versatile and easy to use. Get ready to electrify your next presentation and leave your audience in awe!


8 diapositivas
Business Lifecycle Circle Format Presentation
Present your business stages with clarity using this lifecycle circle diagram. Ideal for showcasing four key phases—planning, execution, growth, and review—in a circular format that emphasizes continuity. Each section includes icons and editable text. Fully customizable in PowerPoint, Keynote, or Google Slides for strategy meetings, reports, or progress updates.


2 diapositivas
Creative Presentation Opening Title Slides
Step into a world of innovation with the "Creative Presentation" title slides, where vibrant geometric shapes meet clean, modern design. Perfect for showcasing your ideas and transforming them into impactful solutions, these slides set the stage for inspiration. Compatible with PowerPoint, Keynote, and Google Slides, they're ideal for anyone looking to make a memorable impression.


5 diapositivas
Rental Business Milestone Timeline Presentation
Showcase your company's growth journey with this clean Rental Business Milestone Timeline layout. Designed for tracking key achievements, it features a horizontal timeline with icons and customizable date markers. Perfect for business reviews or investor updates, it’s fully editable in PowerPoint, Keynote, and Google Slides for a professional presentation


4 diapositivas
Preventive Health Services Layout Presentation
Make health data more human with this modern infographic layout for service-based reporting. This preventive health slide design clearly maps wellness categories to body parts, making it easy to communicate medical insights and early intervention strategies. Fully editable and compatible with PowerPoint, Keynote, and Google Slides for smooth integration into any deck.


5 diapositivas
Aviation Industry Market Analysis
Break down key metrics in the aviation sector with this sleek, aircraft-themed layout. Ideal for highlighting five data points or insights, each icon aligns with a section of the airplane to reinforce structure and clarity. Perfect for presentations on industry trends, airline strategies, or market performance. Fully editable in PowerPoint, Keynote, and Google Slides.


5 diapositivas
Identifying Problems in Projects Presentation
Kickstart your analysis with a bold, colorful layout that makes uncovering project issues feel clear and structured. This presentation helps you outline challenges, compare causes, and guide teams toward practical solutions using a simple, organized flow. Fully compatible with PowerPoint, Keynote, and Google Slides.


6 diapositivas
Vision Statement Development Guide
Craft a powerful company vision with this eye-catching layout—literally. Centered around a bold visual icon, this slide helps you organize six core ideas or values that shape your future direction. It’s perfect for strategy workshops, leadership meetings, or branding sessions. Fully compatible with PowerPoint, Keynote, and Google Slides.