


Características


¿Tienes alguna pregunta?
Recomendar


7 diapositivas
Sales Infographic Presentation Template
A Sales Infographic is a visual representation of data or information related to sales. They can include charts, graphs, and diagrams that show how much money a company has made, how many products they have sold, and what their best-selling products are. This template is perfect for anyone who wants to show off their sale numbers in a fun and easy-to-understand way. This template has colorful pictures and charts that make it easy to see how much you've sold and how well your sales are doing. This template is a perfect way to help a company make decisions and track progress.


5 diapositivas
Business Pillars and Core Values Presentation
Showcase your organization's foundational strengths with our Business Pillars and Core Values presentation template. This versatile tool visually represents your key principles and commitments, ensuring your audience clearly understands the essence of your corporate identity.


5 diapositivas
RAPID Decision-Making Model Presentation
The RAPID Decision-Making Model template simplifies complex decision processes, laying out steps from recommending to deciding in an easily digestible format. It's ideal for team leaders and managers who want to streamline decision-making. The template is designed for seamless use across PowerPoint, Keynote, and Google Slides, ensuring broad compatibility and user-friendly presentations.


27 diapositivas
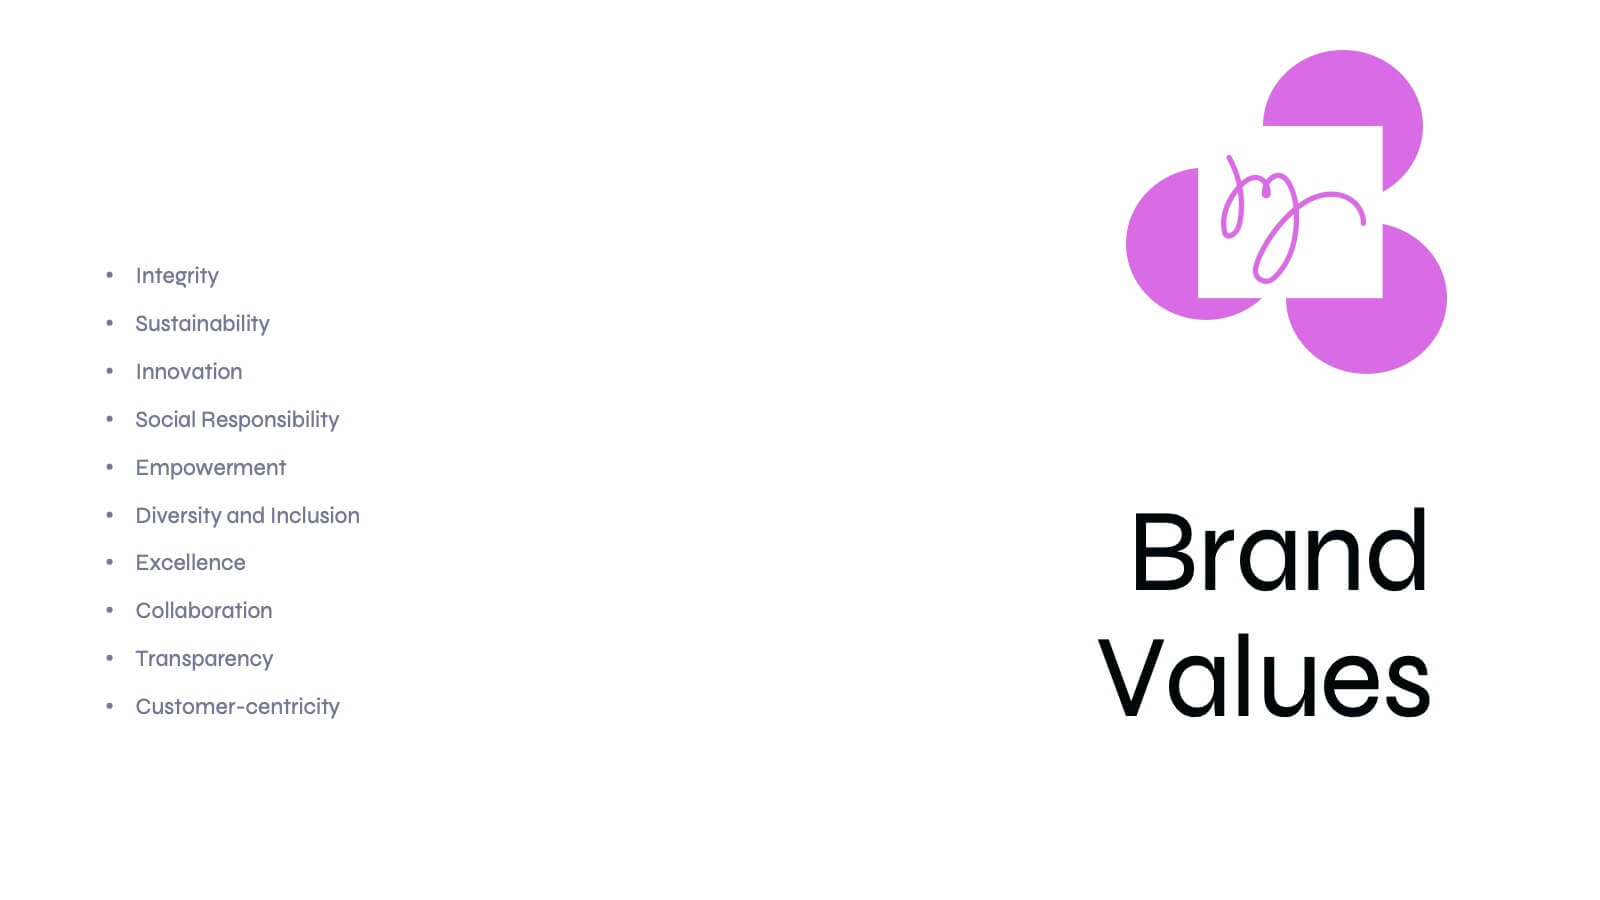
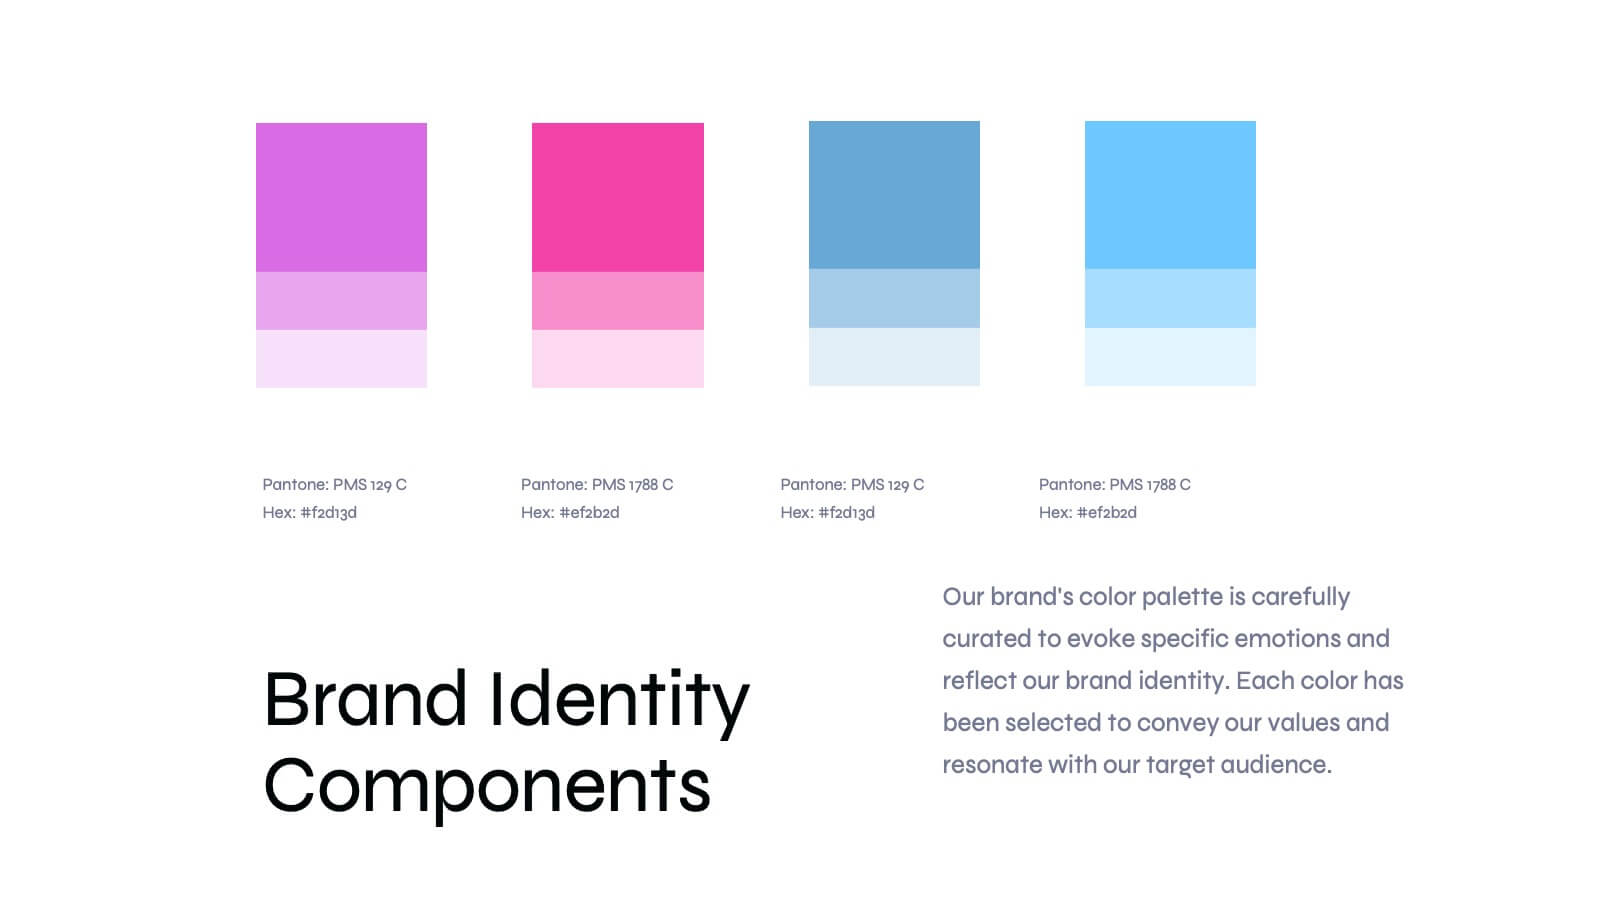
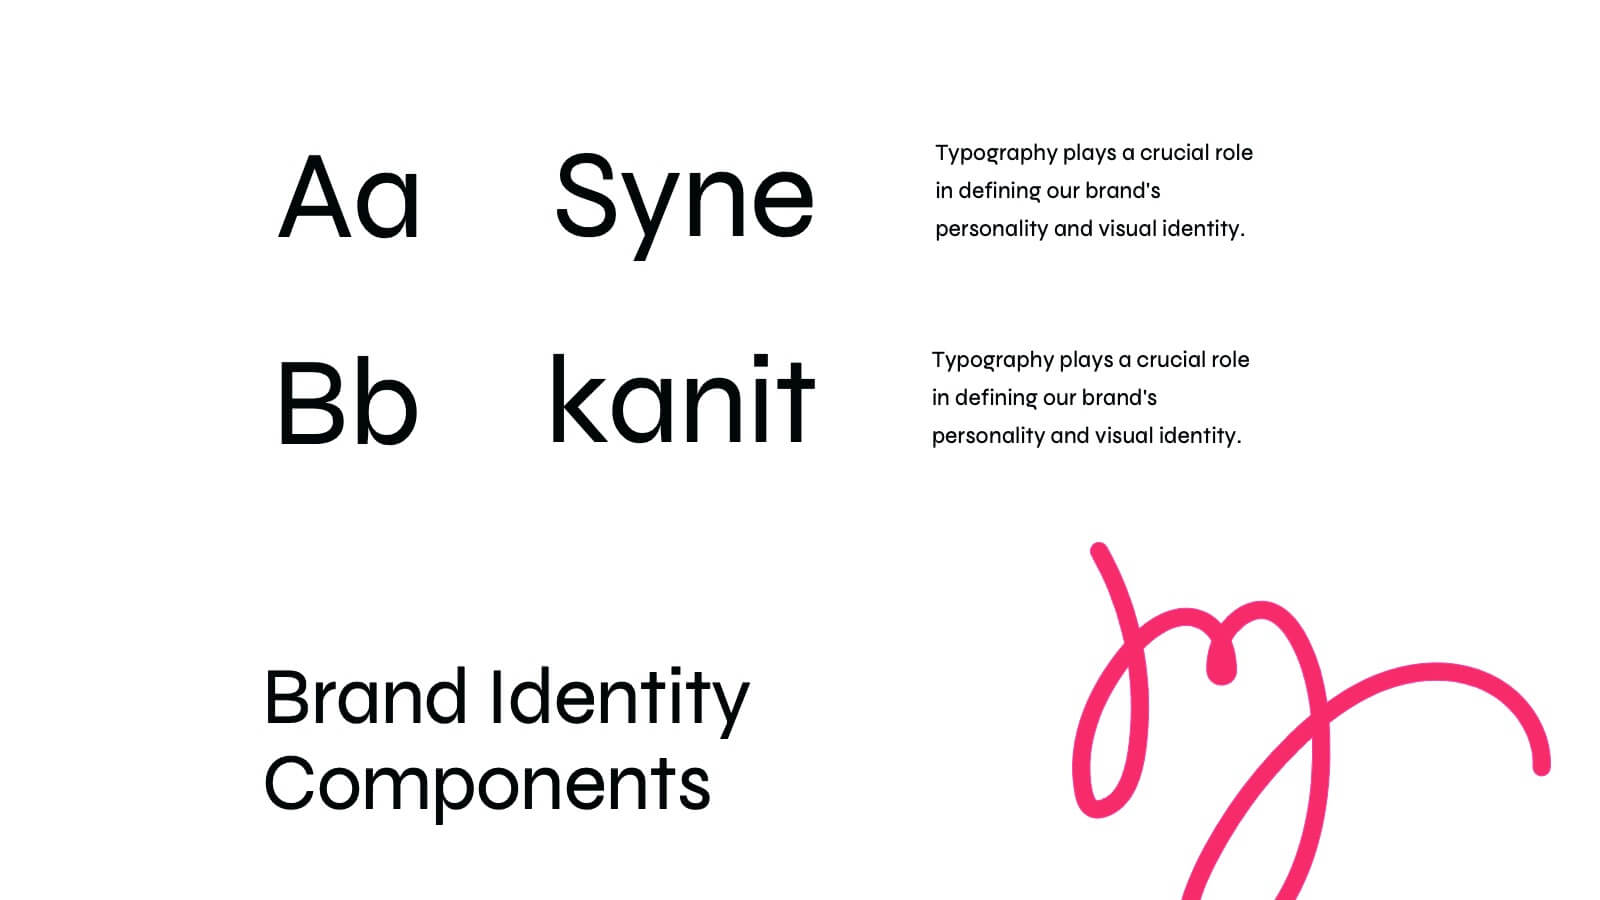
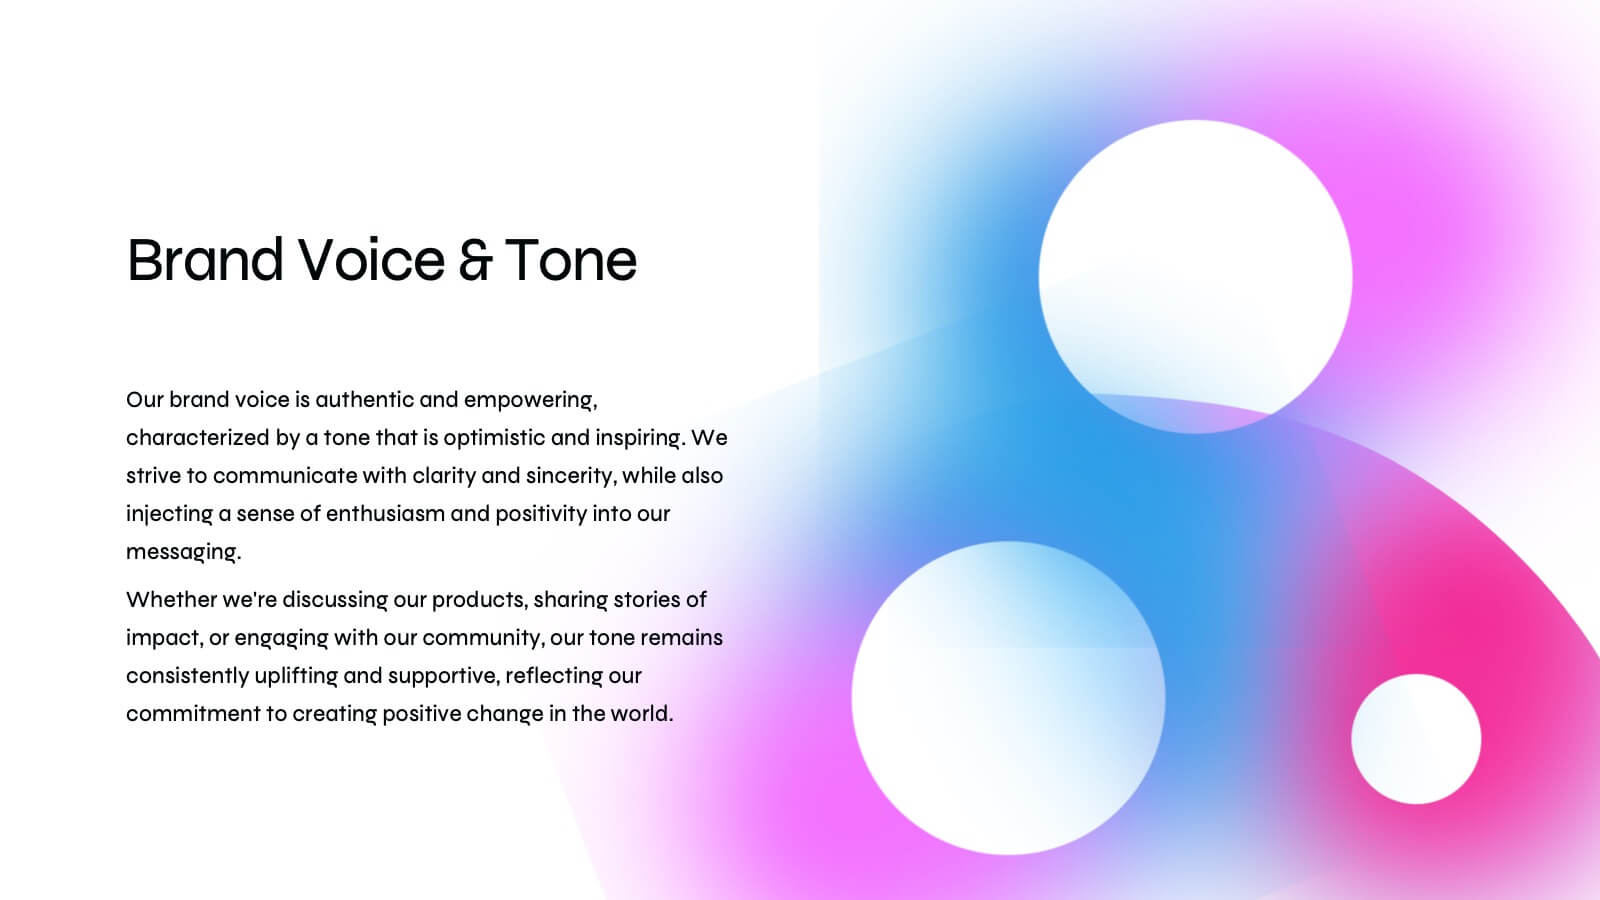
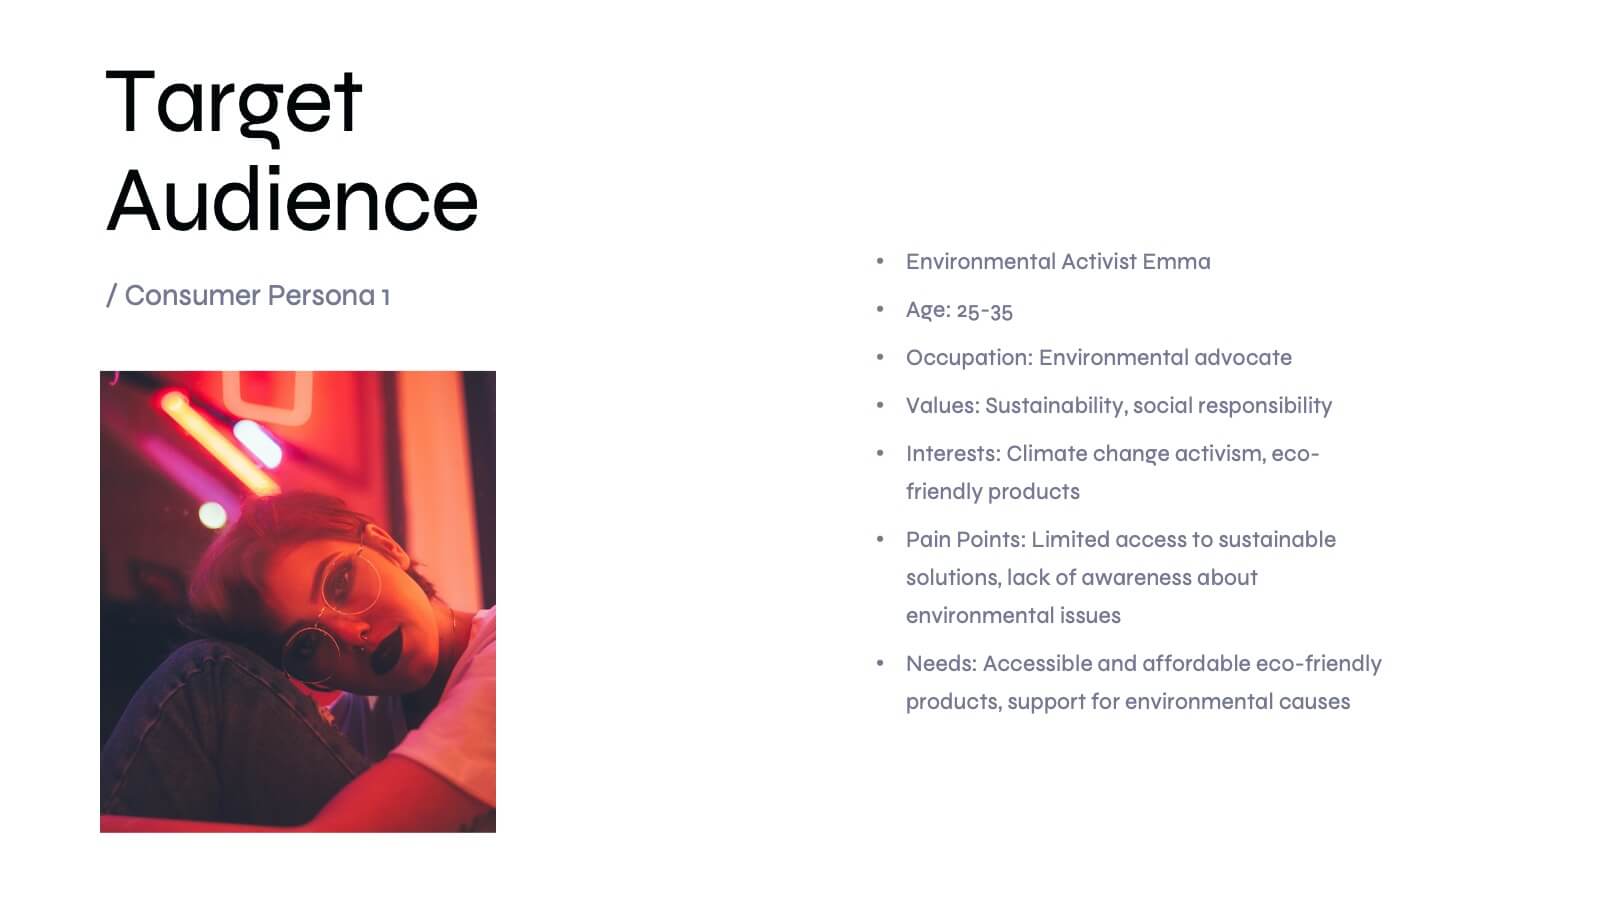
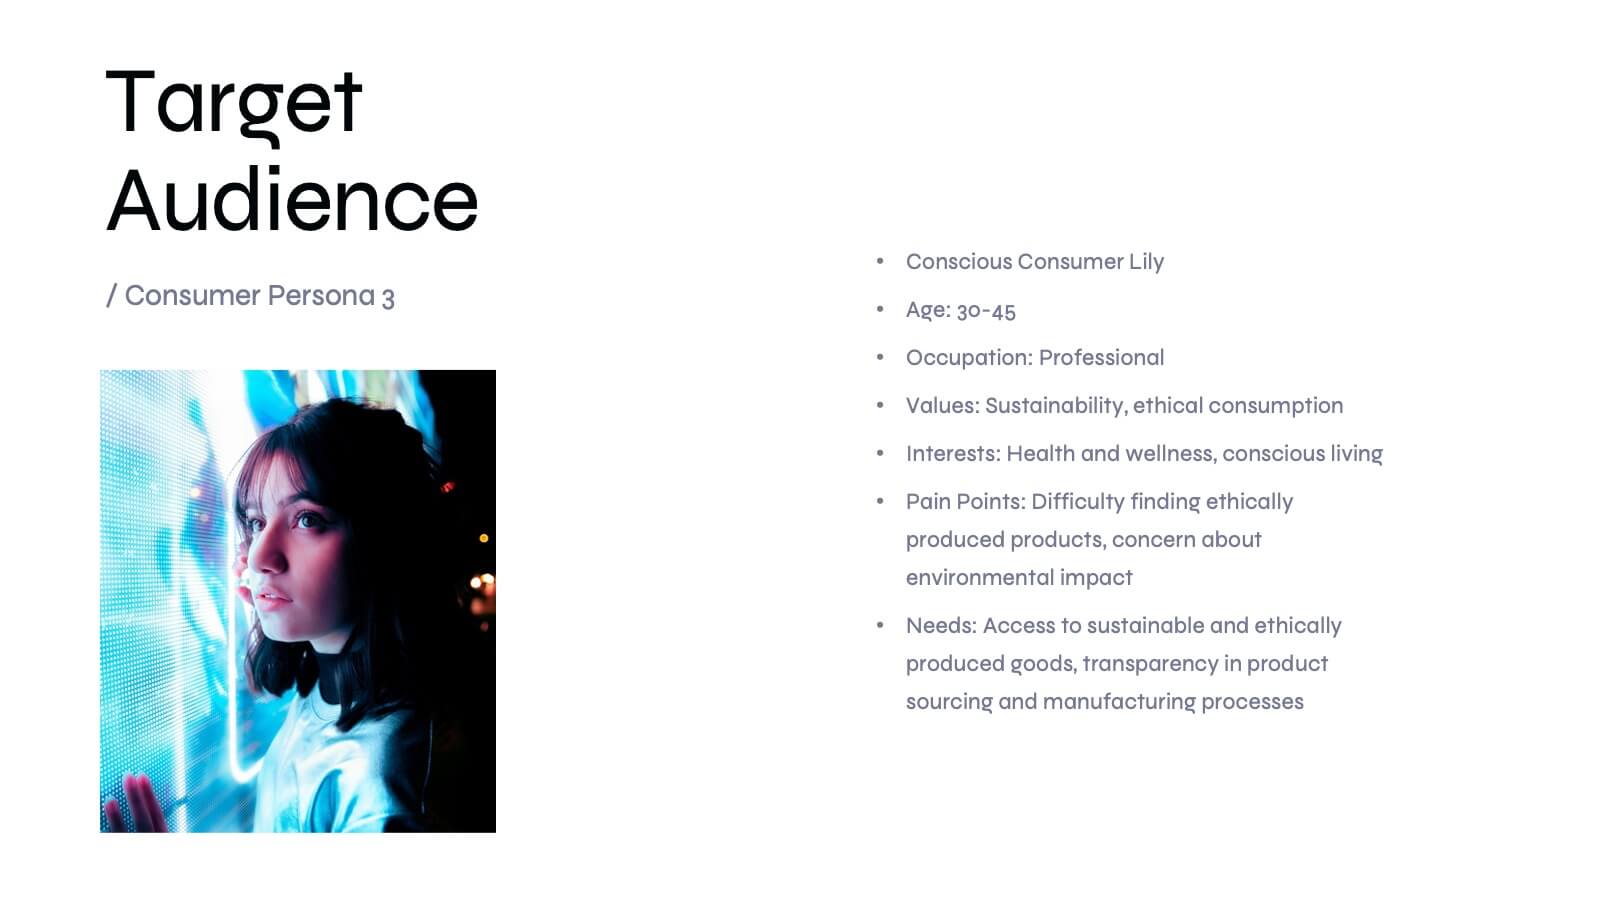
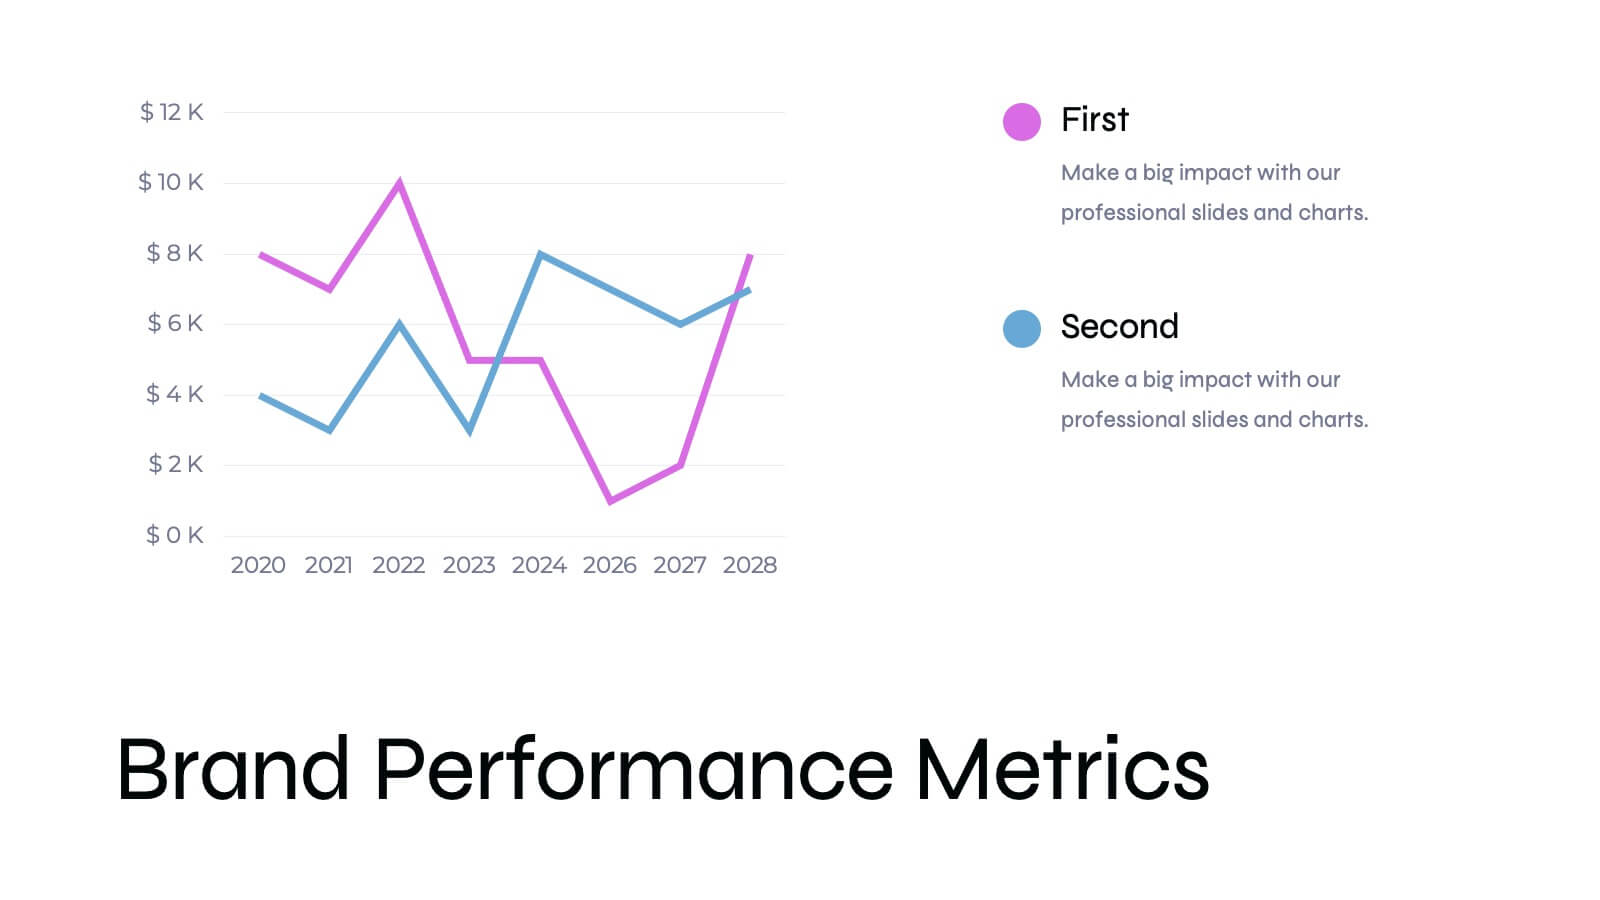
Basilisk Brand Guidelines Proposal Presentation
Present your brand strategy effectively with this modern brand guidelines proposal template! It includes sections for brand vision, values, identity, and market analysis. Fully customizable and compatible with PowerPoint, Keynote, and Google Slides, it’s perfect for showcasing your brand's identity and ensuring consistency across all platforms.


5 diapositivas
Client Success Story Presentation
Celebrate achievements and highlight results with a vibrant, storytelling layout that turns client wins into memorable visuals. Perfect for showcasing success milestones, project outcomes, and impact metrics, this presentation helps build trust and credibility. Fully compatible with PowerPoint, Keynote, and Google Slides for easy editing and smooth professional delivery.


7 diapositivas
Ecology Infographic Presentation Template
An Ecology Infographic is a visual representation of information and data related to ecology and the environment. This template is designed in the form of charts, graphs, diagrams, illustrations, and other elements, and is made to make complex information about the environment and ecology easier to understand and more engaging. The goal of this ecology infographic template is to provide clear, concise, and visually appealing information about various environmental issues, such as climate change, pollution, habitat destruction, and other topics related to the health of our planet.


7 diapositivas
Safety Rules Infographic
Safety rules are crucial in various settings, including workplaces, public spaces, and homes, because they play a fundamental role in protecting individuals from harm and ensuring their well-being. This infographic template aims to present essential safety rules and guidelines in a visually appealing manner. Compatible with Powerpoint, Keynote, and Google Slides. Tailor the content to suit your specific safety guidelines and ensure the infographic effectively communicates the importance of safety across different contexts. This will allow you to effectively communicate essential safety guidelines in your presentations.


5 diapositivas
Human Body Anatomy Diagram Presentation
Bring your content to life with a clean, modern visual that makes learning feel surprisingly engaging. This presentation breaks down key body systems in a simple, approachable way, helping you explain functions, processes, or health concepts with clarity. Perfect for medical training, wellness education, or anatomy lessons. Fully compatible with PowerPoint, Keynote, and Google Slides.


5 diapositivas
IT Operations Management
Illustrate complex workflows with this gear-themed infographic designed for IT operations management. Each gear represents a key step or stage, perfect for showcasing interconnected processes, system automation, or IT service flow. Easy to customize in PowerPoint, Keynote, and Google Slides. Clean, professional layout with space for icons and concise text.


6 diapositivas
Veterinary Services Infographic
Veterinary services refer to medical and healthcare services provided to animals by trained and licensed professionals called veterinarians. This infographic template aims to educate pet owners and the general public about the importance of veterinary care for animals' health and well-being. This template serves as a valuable resource for pet owners, animal lovers, and anyone interested in understanding the significance of veterinary care in maintaining the well-being of our beloved animal companions. This infographic aims to promote responsible pet ownership and raise awareness about the importance of regular veterinary visits for pets' health and happiness.


7 diapositivas
Iceberg Model Infographic Presentation
Iceberg diagrams are versatile, multi-purpose infographics that can be used to show all the factors that will affect your company. It is a great way to visualize information and organize it into one place. With this template, you’ll have the perfect way to analyze your vision and drive growth. The iceberg is used to divide and give detailed information that can be valuable in planning your strategy. Analyze, evaluate and provide data on a specific product or service. This eye-catching template is compatible with PowerPoint, Keynote and Google Slides and includes customizable photo layouts.


3 diapositivas
Agricultural Business Plan Presentation
Showcase your farming strategies with this agricultural business plan template, featuring plant growth visuals and clean, modern layouts. Ideal for agribusiness proposals, sustainability reports, and agricultural project planning. Fully editable in Canva, PowerPoint, and Google Slides, allowing you to customize text, icons, and colors to match your brand identity.


7 diapositivas
Modern Food Menu Presentation
Bring your ideas to the table with a clean and modern layout that turns any food-related content into an easy, visually appealing story. This presentation helps you showcase dishes, categories, or menu insights with clarity and style, making information simple to follow. Fully compatible with PowerPoint, Keynote, and Google Slides.


7 diapositivas
Business Office Scenes Infographic Presentation
Office Scene Infographics can be a valuable tool for businesses or organizations that want to showcase their workplace culture or attract potential employees by providing a visual representation of what it's like to work at their company. This template is designed to provide a visual representation of different office scenarios and activities. The template is fully customizable and can be used for a variety of purposes, such as internal communication, training, marketing, and educational. It has a unique design, easy customization, and compatibility with Powerpoint, Keynote and Google Slides.


5 diapositivas
Social Myths & Facts Infographics
A Social Myth might be a certain belief, while a Social Fact would be the correct answer with data. This engaging and informative Infographics template is designed to help you dispel common misconceptions and provide accurate information on various social topics. With this template you can cover stereotypes, challenge myths, or present facts to promote understanding and awareness. The template features a modern design with vibrant colors and captivating visuals, making it visually appealing and easy to navigate. It includes a variety of design elements such as icons, illustrations and timelines that can all be customized.


6 diapositivas
Detailed Case Analysis Report Presentation
Turn complex findings into a clear and engaging story with this modern, data-focused layout. Ideal for professionals presenting research, performance reviews, or audit results, it helps you organize insights with precision and clarity. Fully editable and compatible with PowerPoint, Keynote, and Google Slides for effortless customization and presentation delivery.


5 diapositivas
Insurance Policy Structure Presentation
Add a touch of creativity to your financial reports with this clean and modern presentation design. Perfect for explaining coverage breakdowns, risk management strategies, or policy frameworks, it simplifies complex ideas through visuals. Fully editable and compatible with PowerPoint, Keynote, and Google Slides for a seamless presentation experience.