


Características


¿Tienes alguna pregunta?
Recomendar


10 diapositivas
Environmental Sustainability Strategy
Bring your green initiatives to life with this vibrant, four-step sustainability roadmap. Ideal for visualizing eco-friendly practices, CSR programs, or environmental policy rollouts. The organic flow, icons, and plant-themed accents enhance clarity and engagement. Fully customizable in PowerPoint, Keynote, and Google Slides.


7 diapositivas
Security Framework Infographic
A security framework, also known as a cybersecurity framework, is a structured set of guidelines, best practices, standards, and processes that help organizations design, implement, monitor, and manage robust security measures to protect their information systems and resources. This infographic template is a fortress of knowledge, guiding you through the pillars of a robust security infrastructure that safeguards your digital realm. Compatible with Powerpoint, Keynote, and Google Sides. Every element in this infographic embodies a facet of a comprehensive security framework.


6 diapositivas
Territorial Presence Across the Globe Presentation
Visualize your worldwide footprint with this territorial presence map. Highlight key regions using color-coded markers linked to strategic points, teams, or operations. Ideal for corporate overviews, investor updates, and expansion plans. Fully editable and easy to customize in PowerPoint, Keynote, or Google Slides for impactful global presentations.


8 diapositivas
30-60-90 Day Business Plan Presentation
Set clear goals and track progress effortlessly with this 30-60-90 day business plan template! Designed for professionals, managers, and entrepreneurs, this structured layout helps outline priorities, set milestones, and ensure a smooth transition from planning to execution. Fully customizable and compatible with PowerPoint, Keynote, and Google Slides for seamless presentations.


20 diapositivas
Starbound Sales Proposal Presentation
Close deals with confidence using this polished and professional sales proposal presentation! It covers everything from target market analysis and pricing strategies to sales objectives, performance metrics, and future opportunities, ensuring a complete pitch. Perfect for client meetings and business proposals, this template works seamlessly with PowerPoint, Keynote, and Google Slides.


4 diapositivas
Big Data Analytics Business
Simplify data complexity with this layered stack diagram designed for big data workflows and insights. Ideal for IT professionals, analytics teams, and consultants, it visually represents data input, processing, and output stages. Fully editable in PowerPoint, Keynote, and Google Slides for flexible customization.


21 diapositivas
Fahrenheit Scientific Research Presentation
Present your findings with clarity using this scientific research presentation template. Designed for researchers, it includes sections for objectives, methodology, data analysis, results, and recommendations. Perfect for academic and professional use, this template ensures a polished, organized presentation and is fully compatible with PowerPoint, Keynote, and Google Slides.


8 diapositivas
Yearly Calendar Planning Presentation
The "Yearly Calendar Planning" presentation template is designed to help visualize task progress over a 12-month period. Each row represents a specific task, labeled as Task 01 through Task 04, with each month represented by a square. The color coding—orange for "Done", gray for "In Progress", red for "Revision", and yellow for "Hold On"—provides a clear visual status of each task's progress. This template is ideal for project managers and team leads who need to track and report on the status of multiple tasks over the course of a year, ensuring a comprehensive view of project timelines and milestones.


5 diapositivas
Digital Marketing Agency Infographics
Elevate your agency's presentation game with our digital marketing agency infographics template. Designed in a vibrant palette of pink, white, and blue, this vertical infographic is a powerhouse tool tailored for marketing professionals, digital agencies, and consultants aiming to showcase their services, success stories, and unique strategies effectively. The template is a visual feast, featuring compelling graphics, diverse icons, and designated spaces for images that capture the essence of digital trends and marketing breakthroughs. Its intuitive design aids in breaking down complex information, ensuring your agency's innovative solutions are client-ready.


5 diapositivas
Product Development to Decline Model Presentation
Showcase the full journey of a product from its inception to phase-out with the Product Development to Decline Model presentation. This circular diagram clearly outlines the four core stages, ideal for product managers, business analysts, and strategic planners. Each section features clean icons and editable text zones to highlight key insights and milestones. Fully customizable in PowerPoint, Keynote, and Google Slides.


5 diapositivas
Process Improvement Using Five Steps Framework Presentation
Visualize progress with clarity using the Process Improvement Using Five Steps Framework Presentation. This stepped layout helps you illustrate sequential actions, milestones, or improvements across five stages. Ideal for strategy, operations, or performance initiatives. Easy to customize in PowerPoint, Keynote, Google Slides, and Canva to fit your workflow needs.


12 diapositivas
Real Estate Business Proposal Presentation
Present your Real Estate Business Proposal with this structured and visually compelling template. Designed for real estate professionals, investors, and agencies, this slide helps communicate investment strategies, market opportunities, and property insights effectively. Fully customizable and compatible with PowerPoint, Keynote, and Google Slides for seamless editing.


4 diapositivas
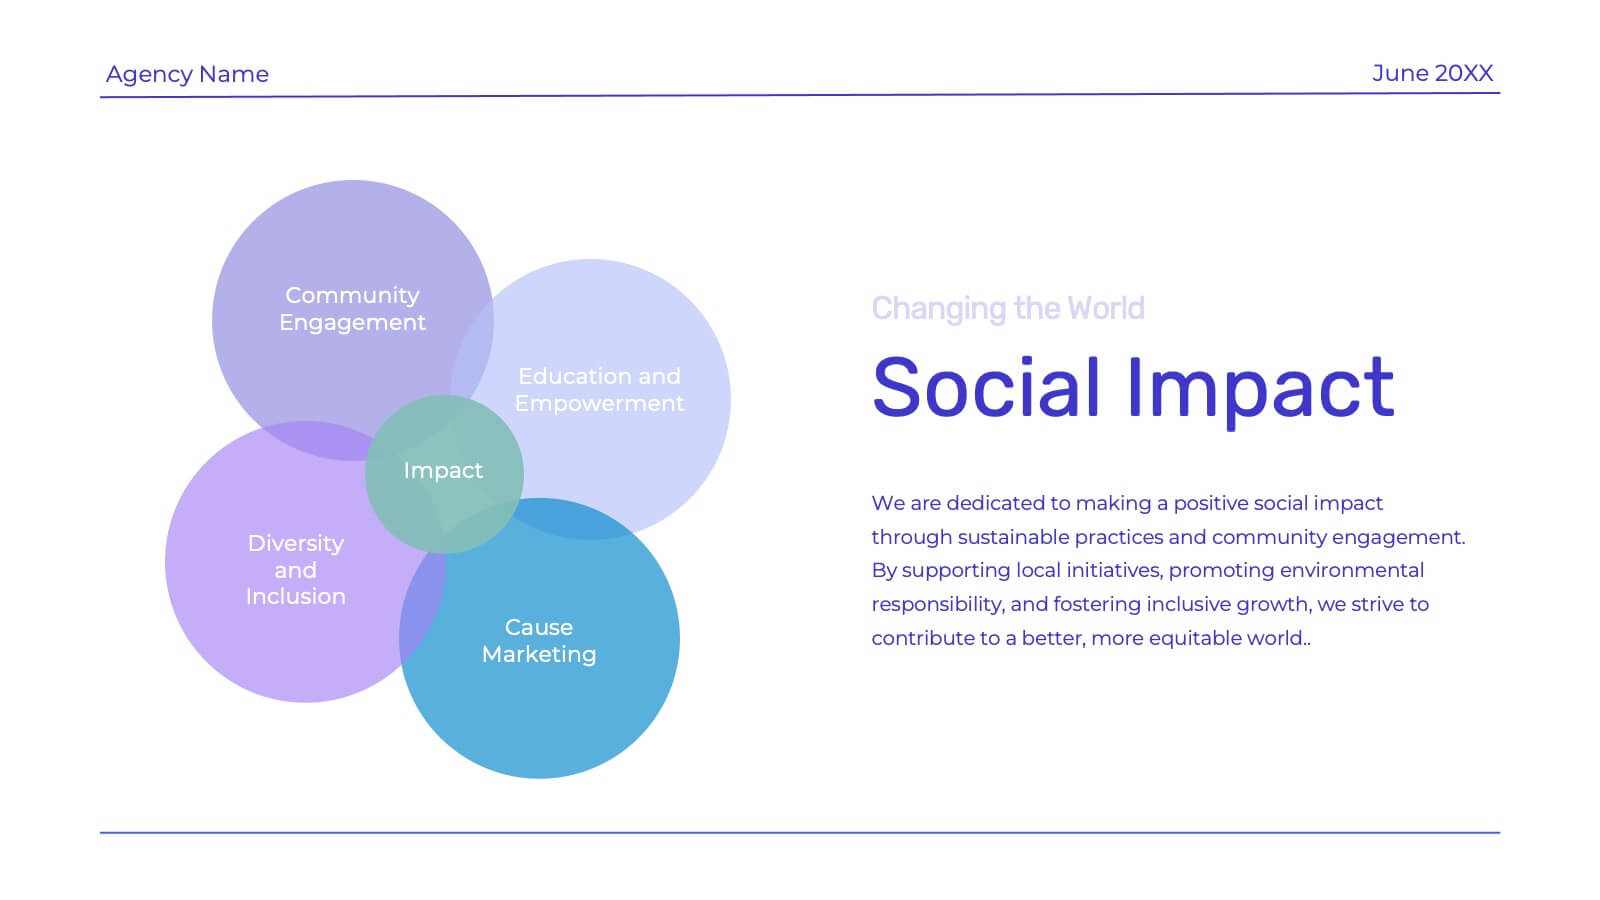
3-Circle Venn Diagrams Presentation
Unlock clarity with a bold visual that highlights how ideas, data, or teams connect at key intersection points. This presentation makes complex relationships easy to explain with clean circles, labels, and structured insights. Fully editable and compatible with PowerPoint, Keynote, and Google Slides.


20 diapositivas
Lumen Marketing Proposal Presentation
Pitch your marketing strategy effectively with this sleek and professional proposal presentation! Covering sections like project summary, proposed solutions, deliverables, and budget breakdowns, it ensures all your ideas are communicated clearly. Perfect for client pitches or internal strategy sessions, this template is fully compatible with PowerPoint, Keynote, and Google Slides.

22 diapositivas
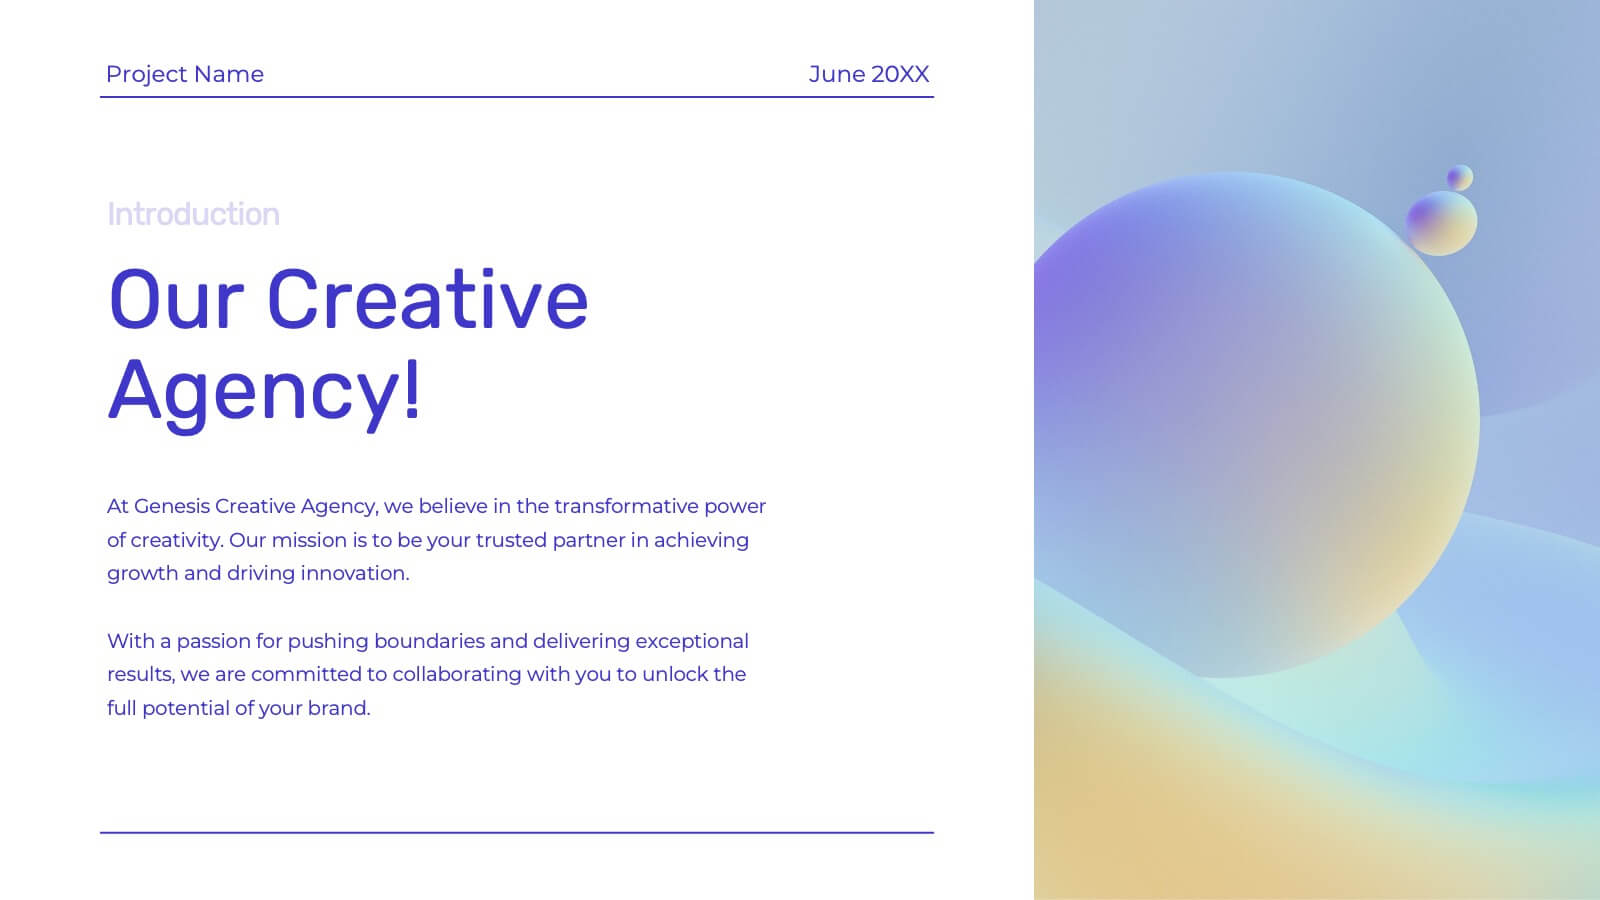
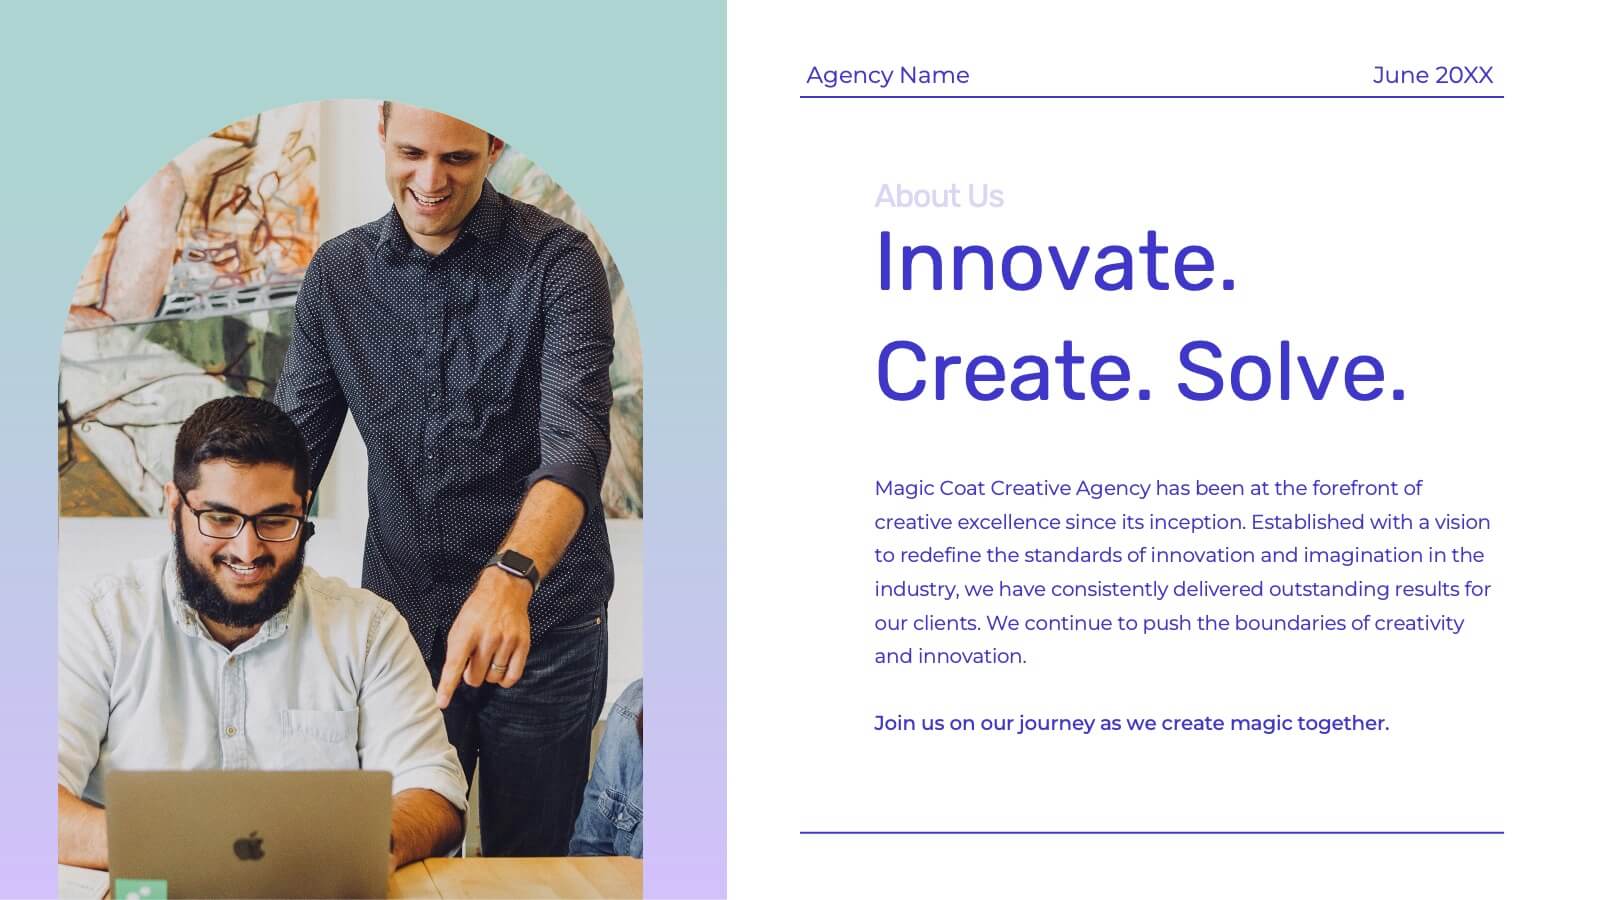
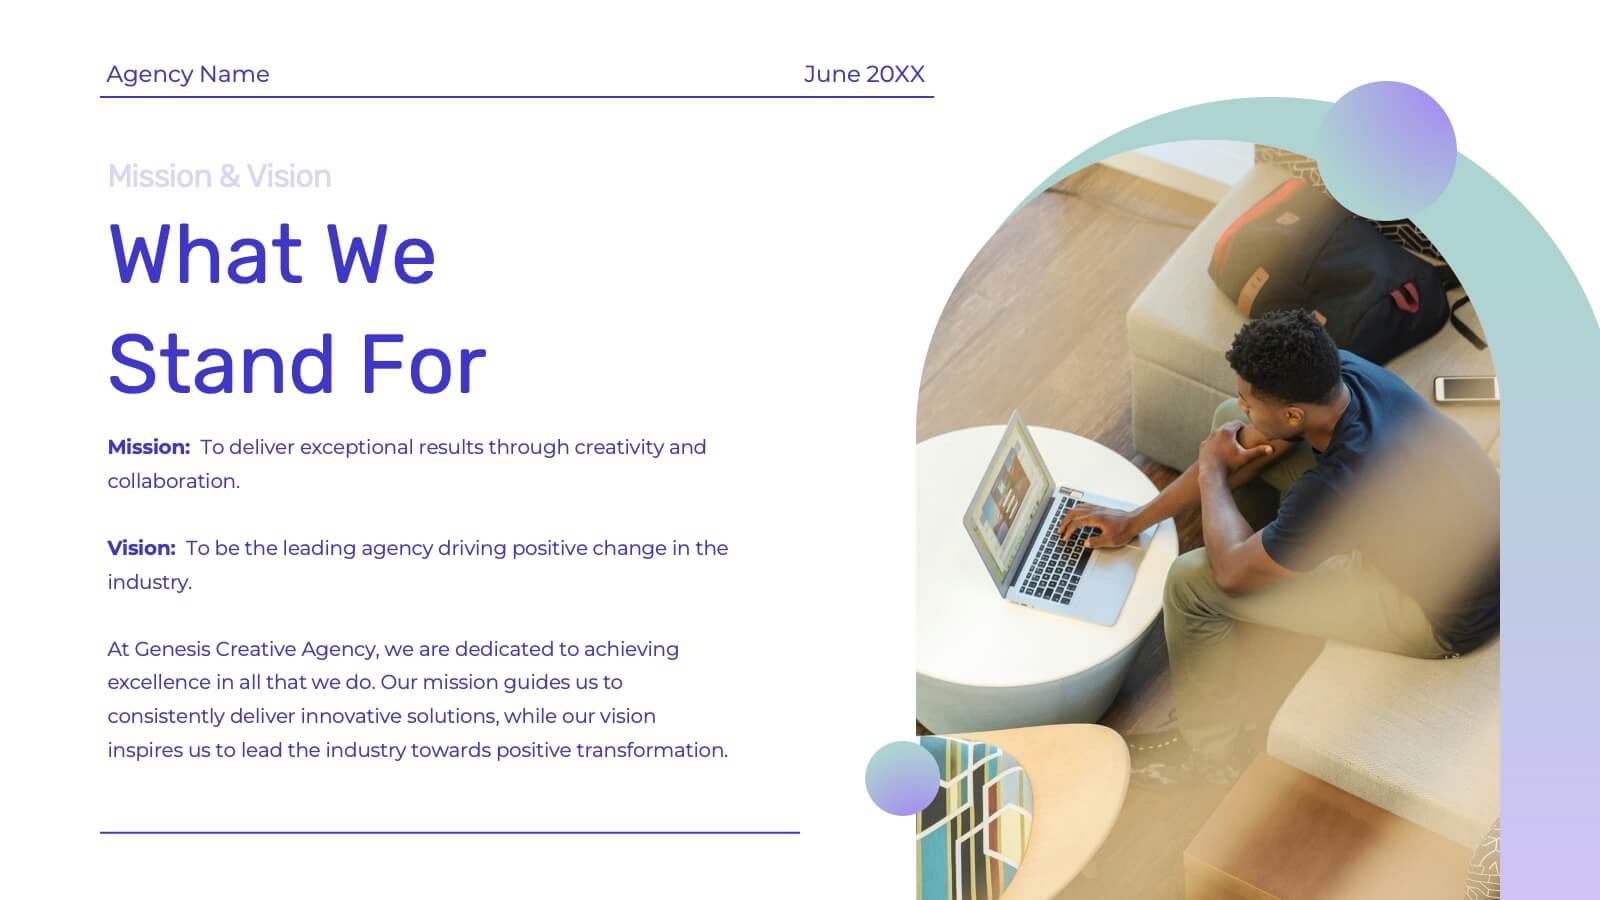
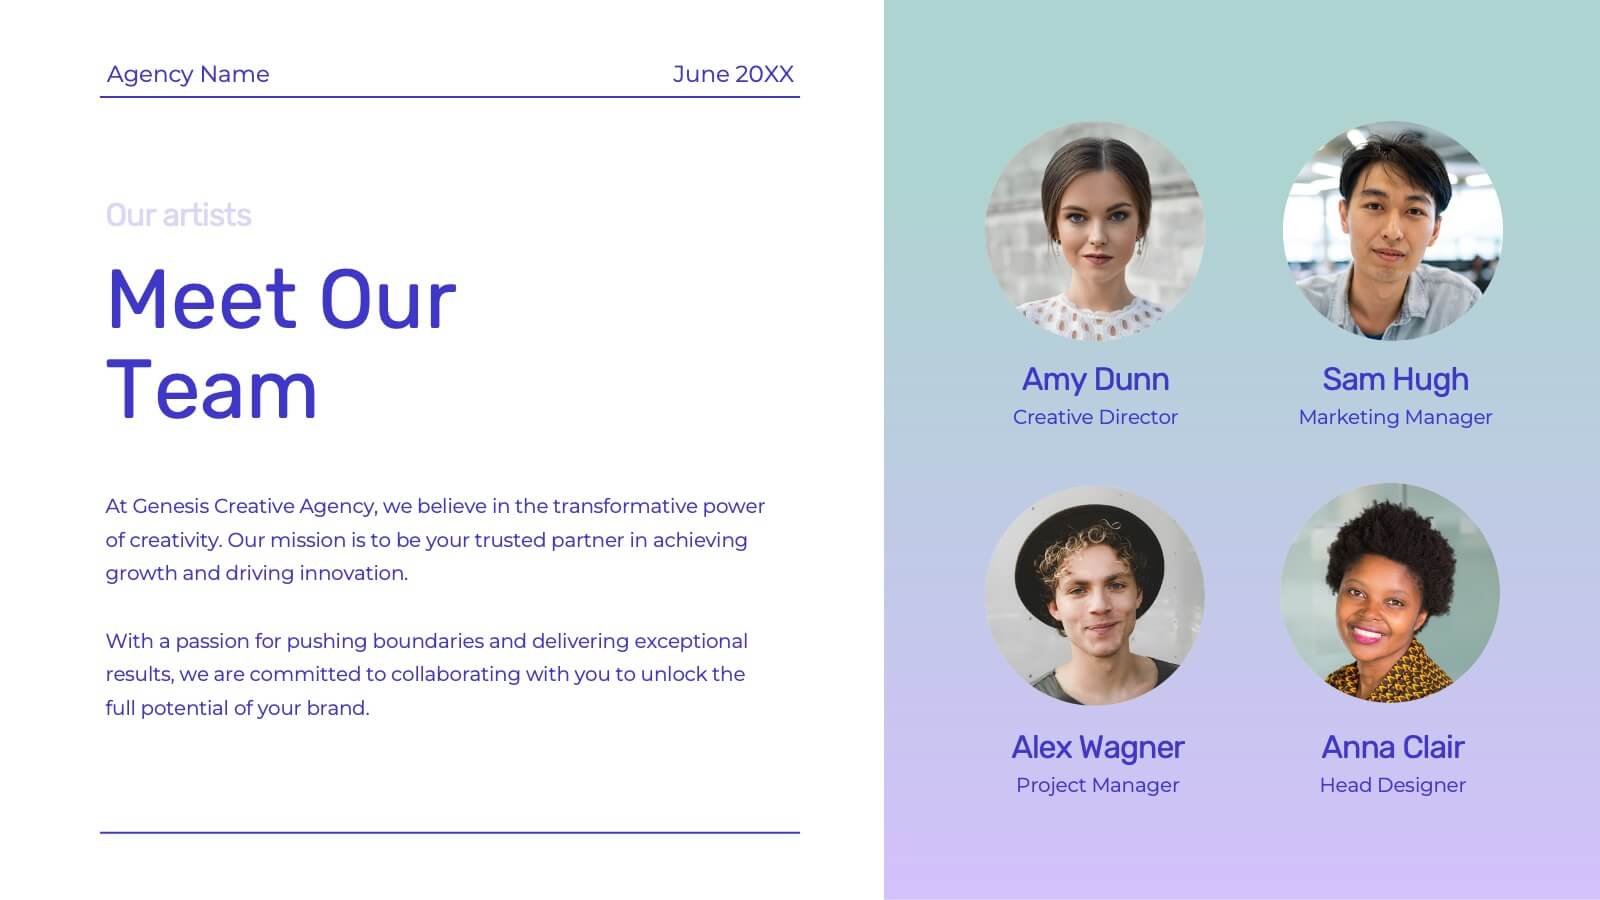
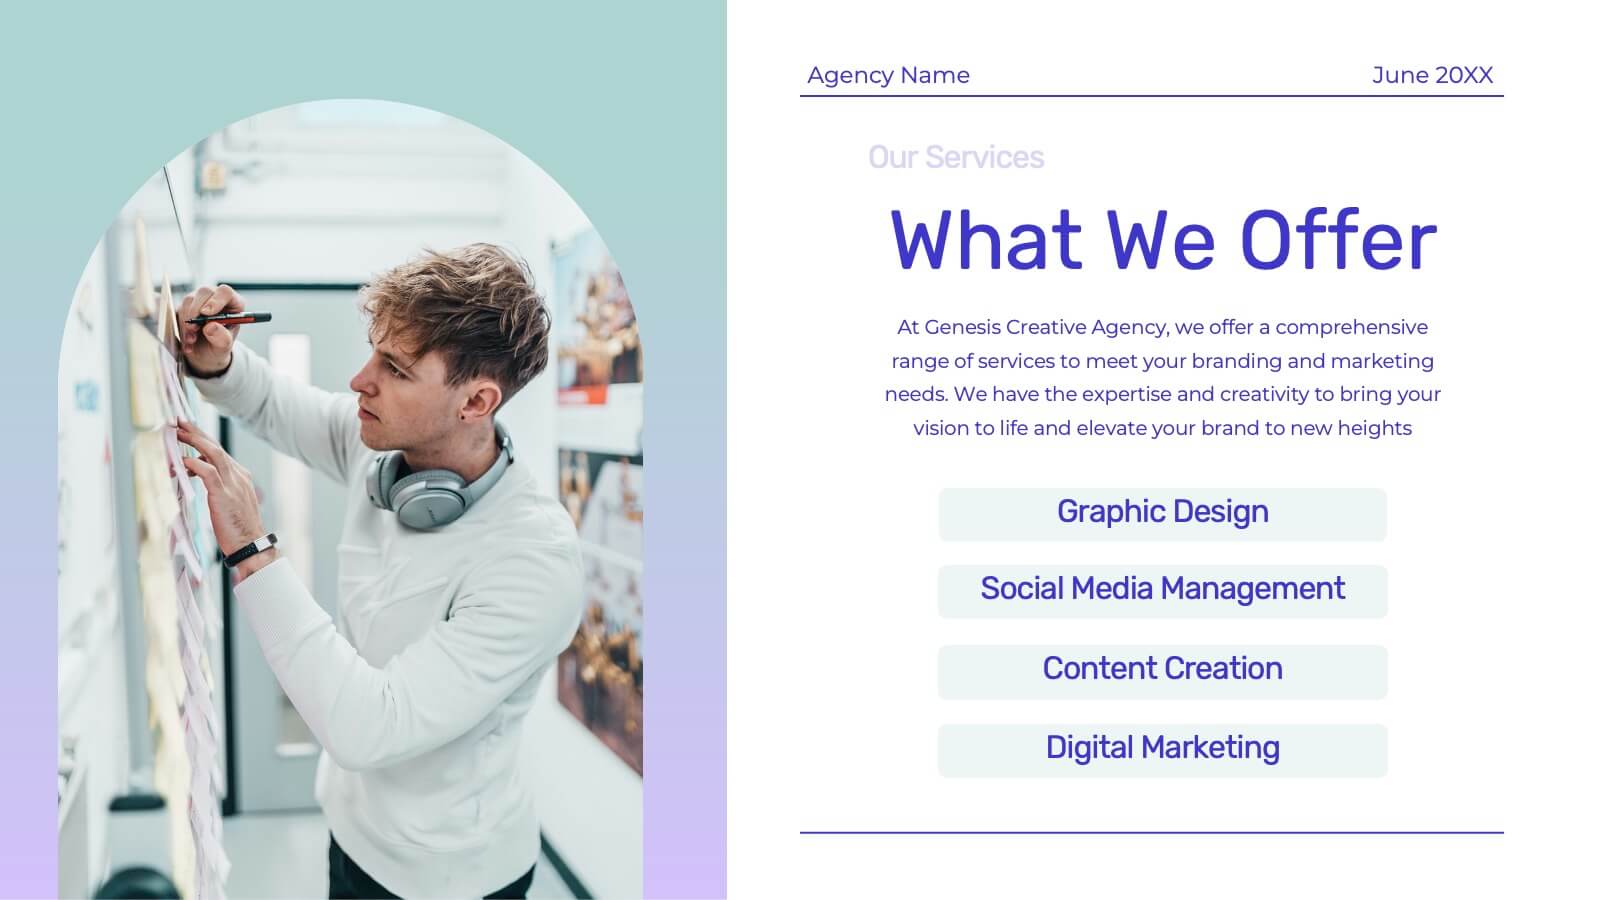
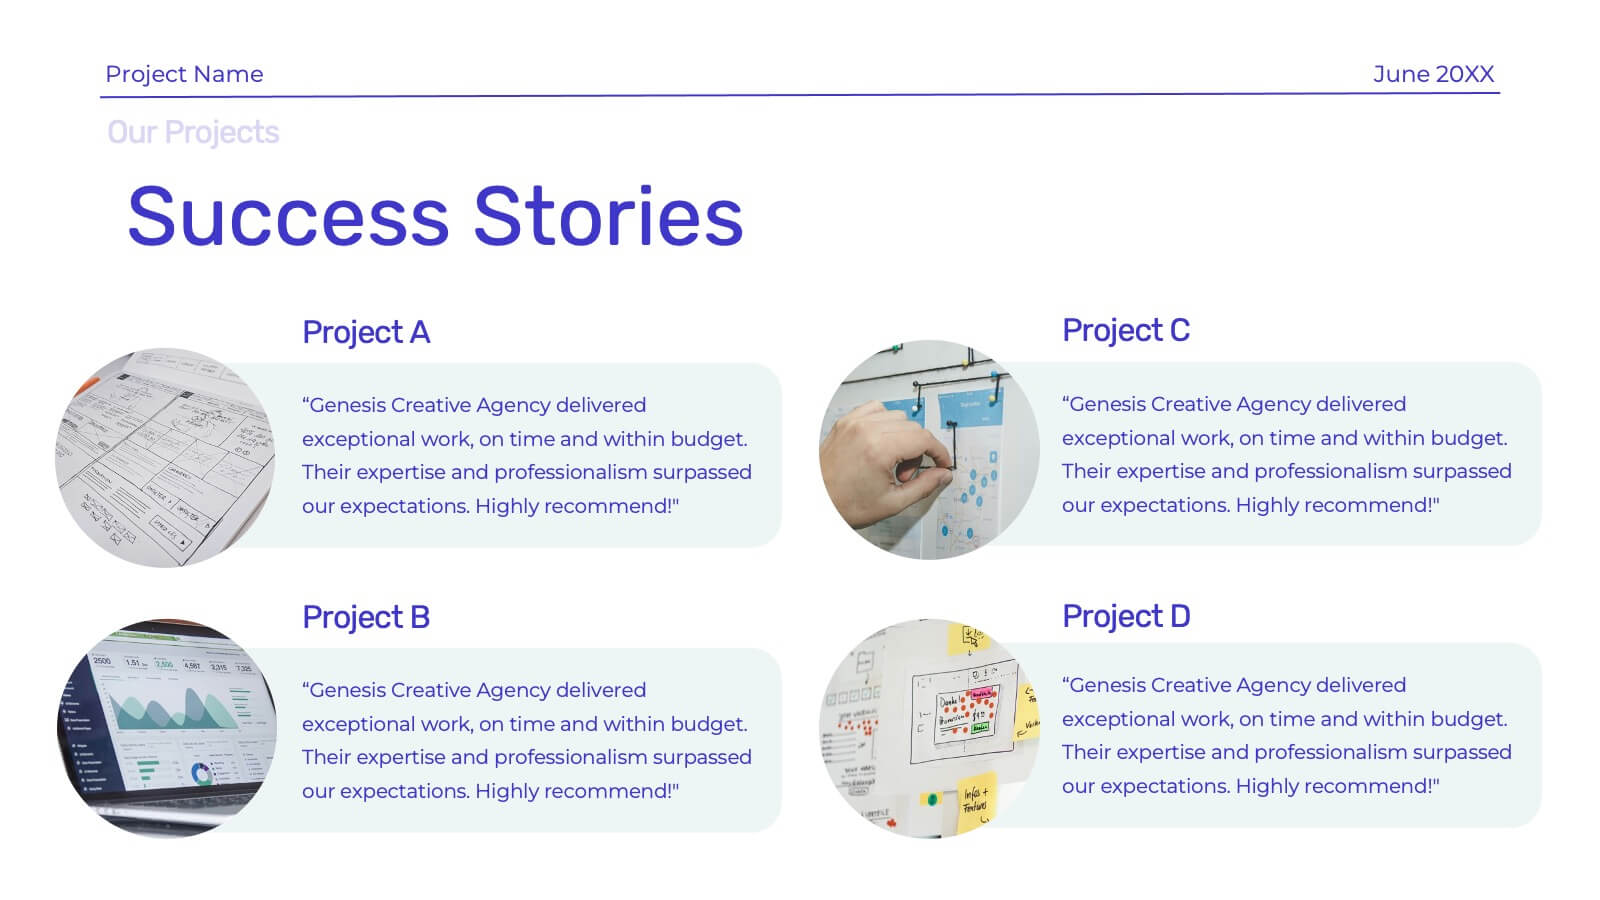
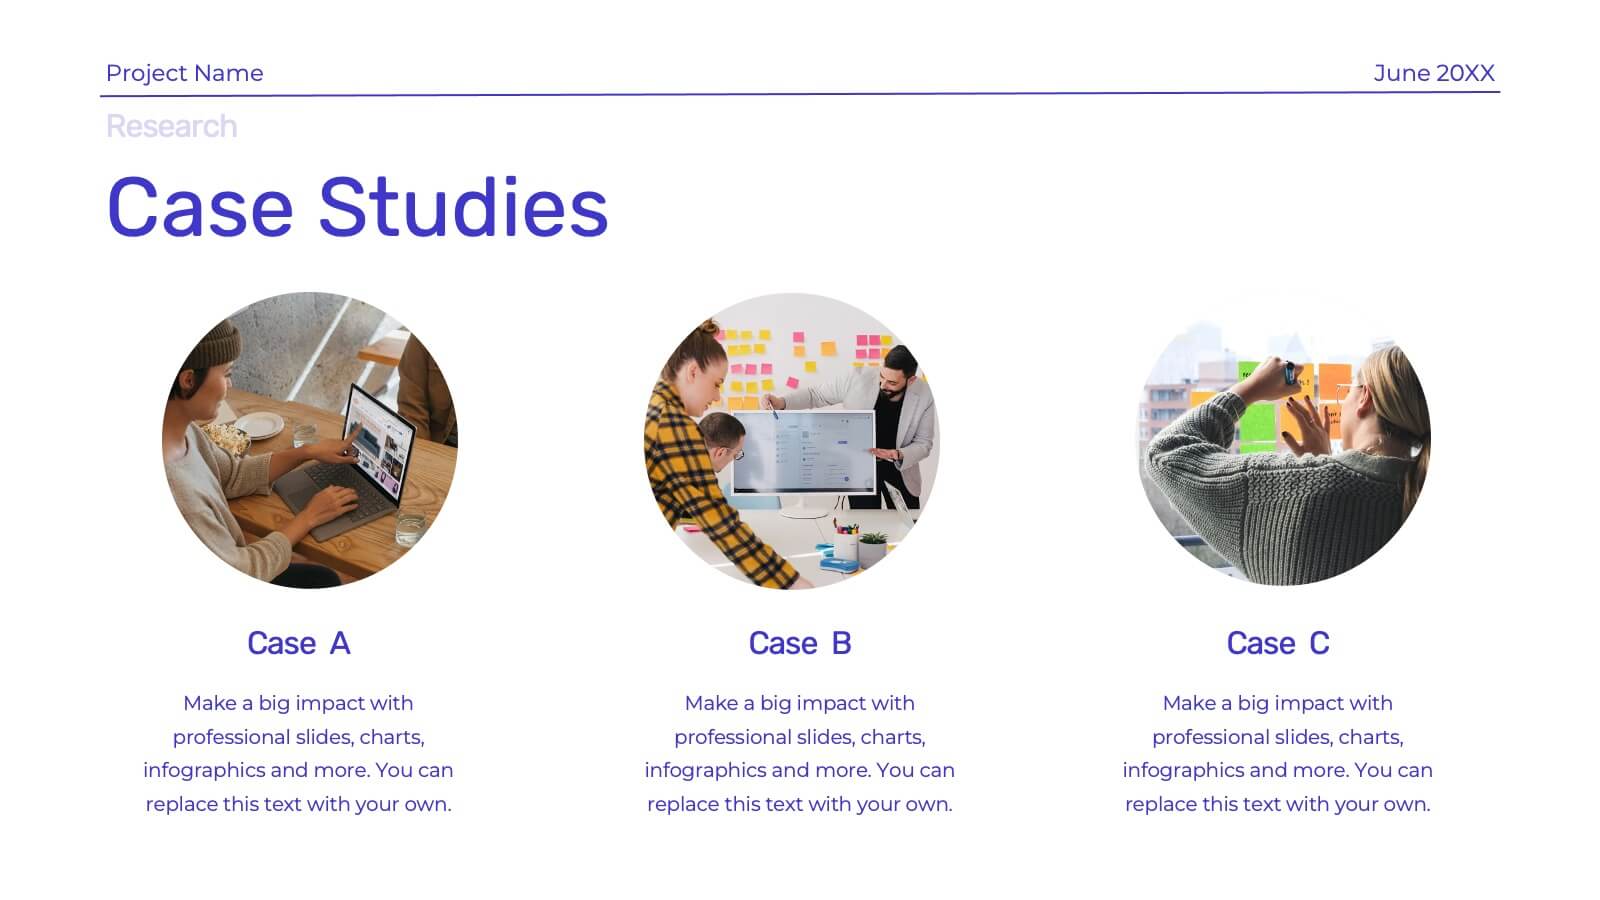
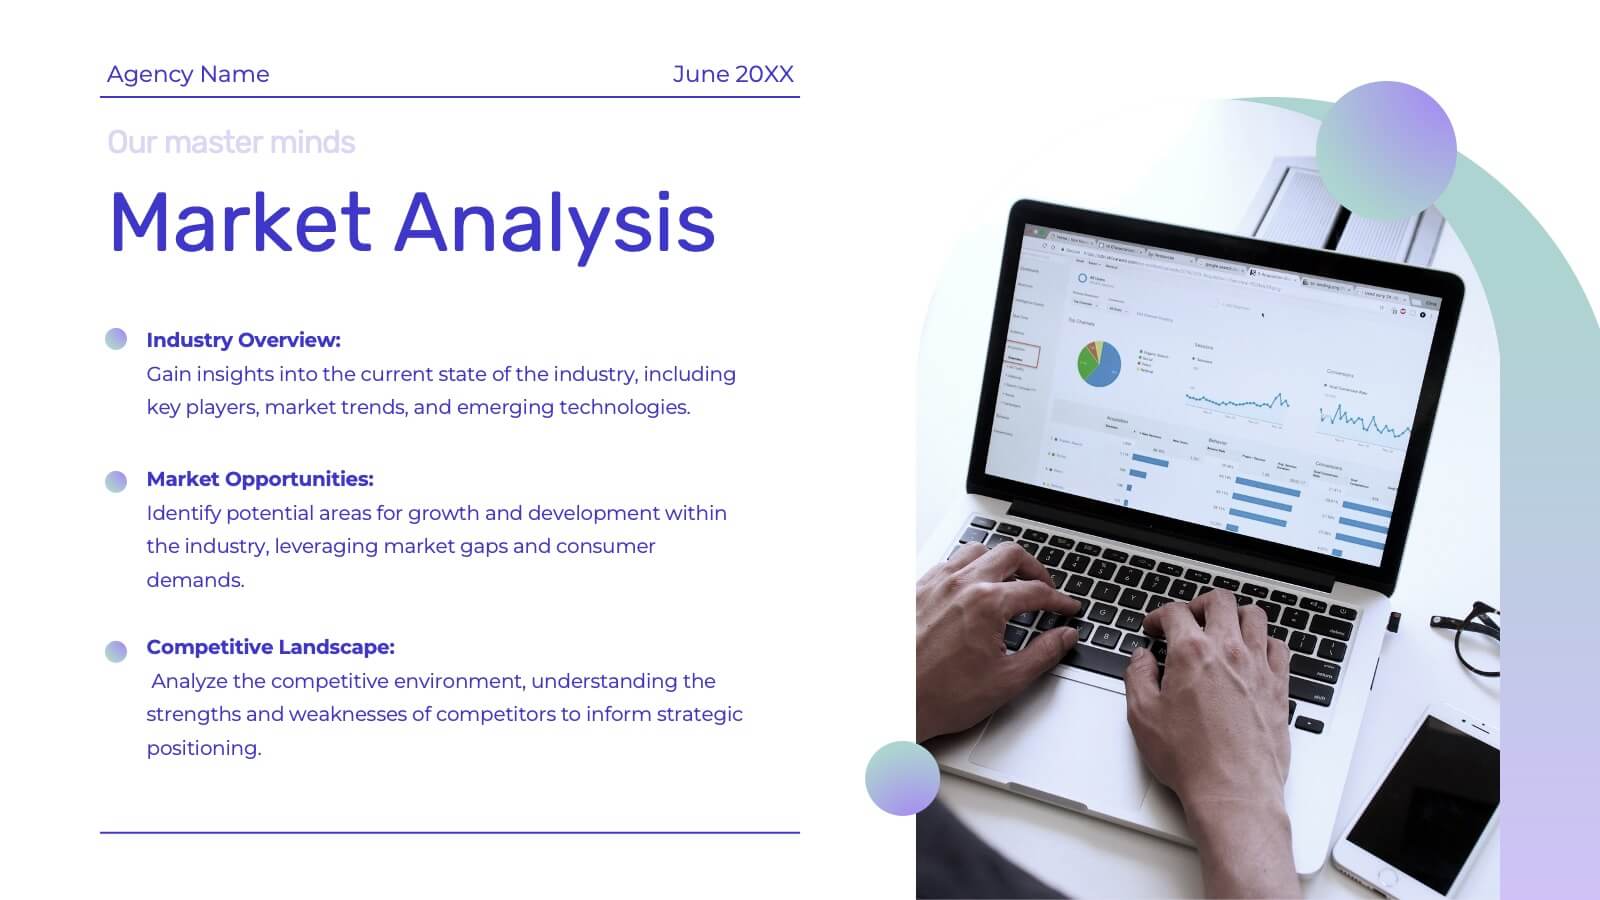
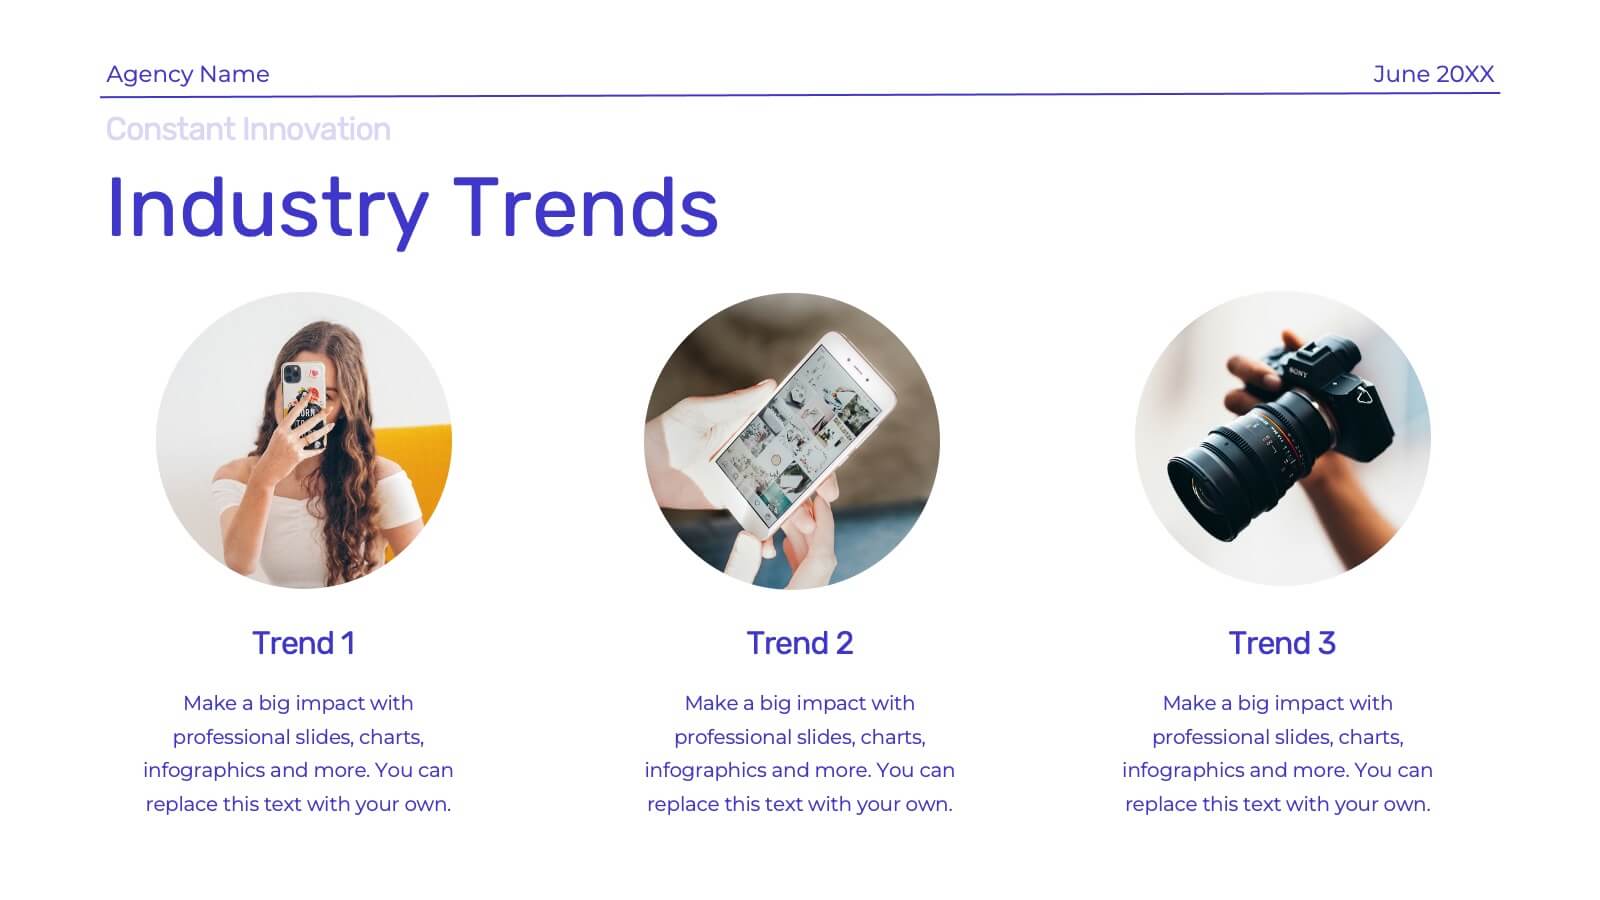
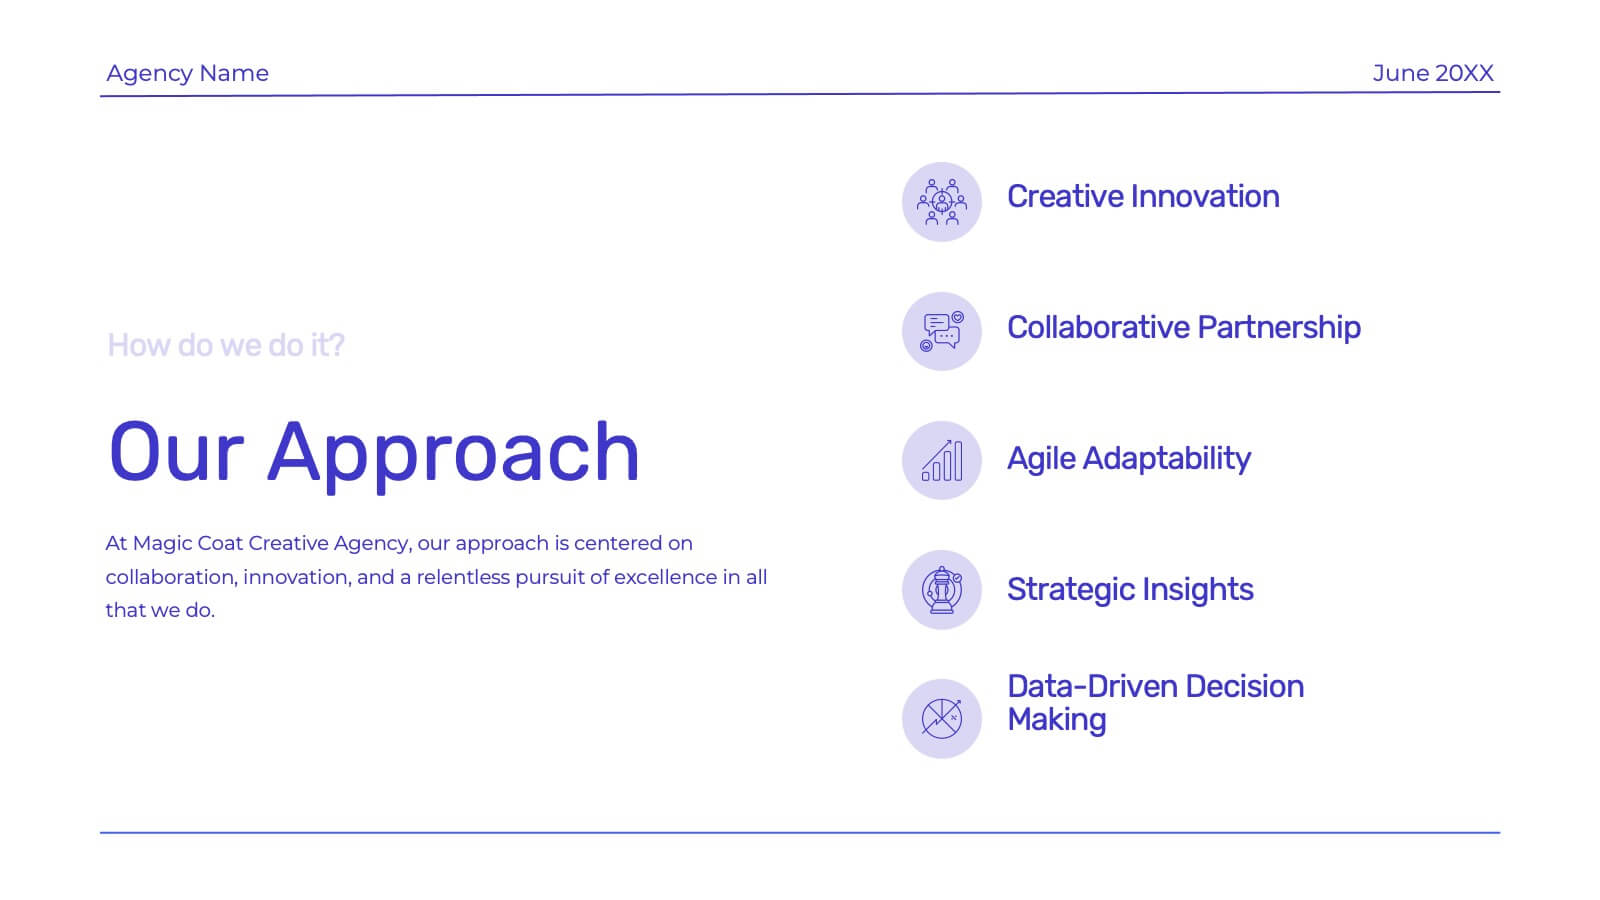
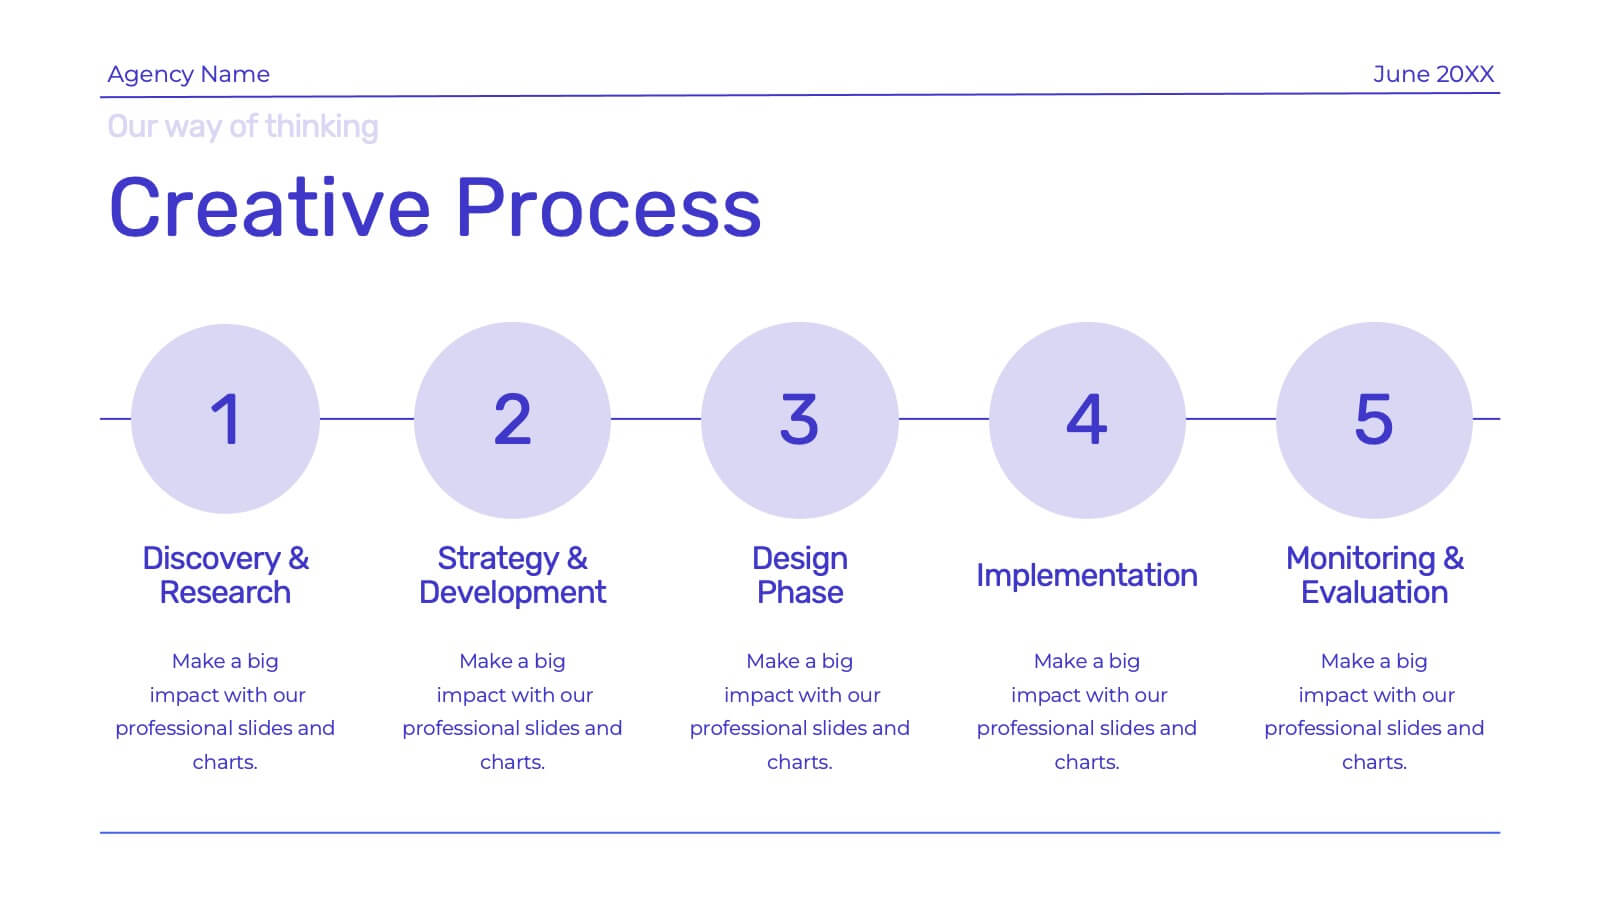
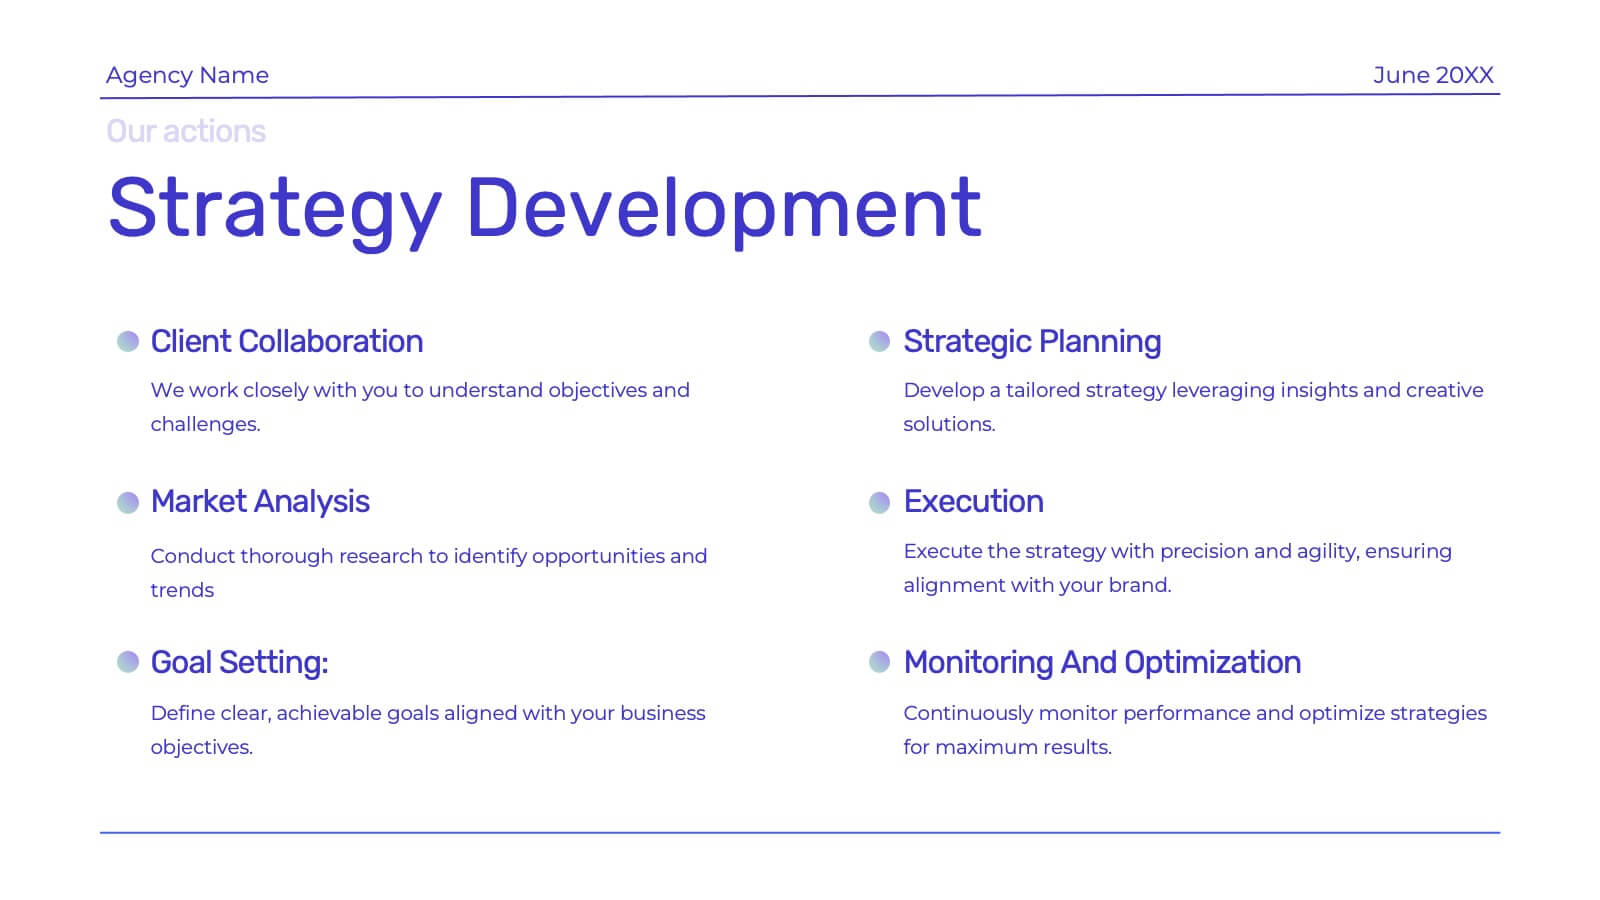
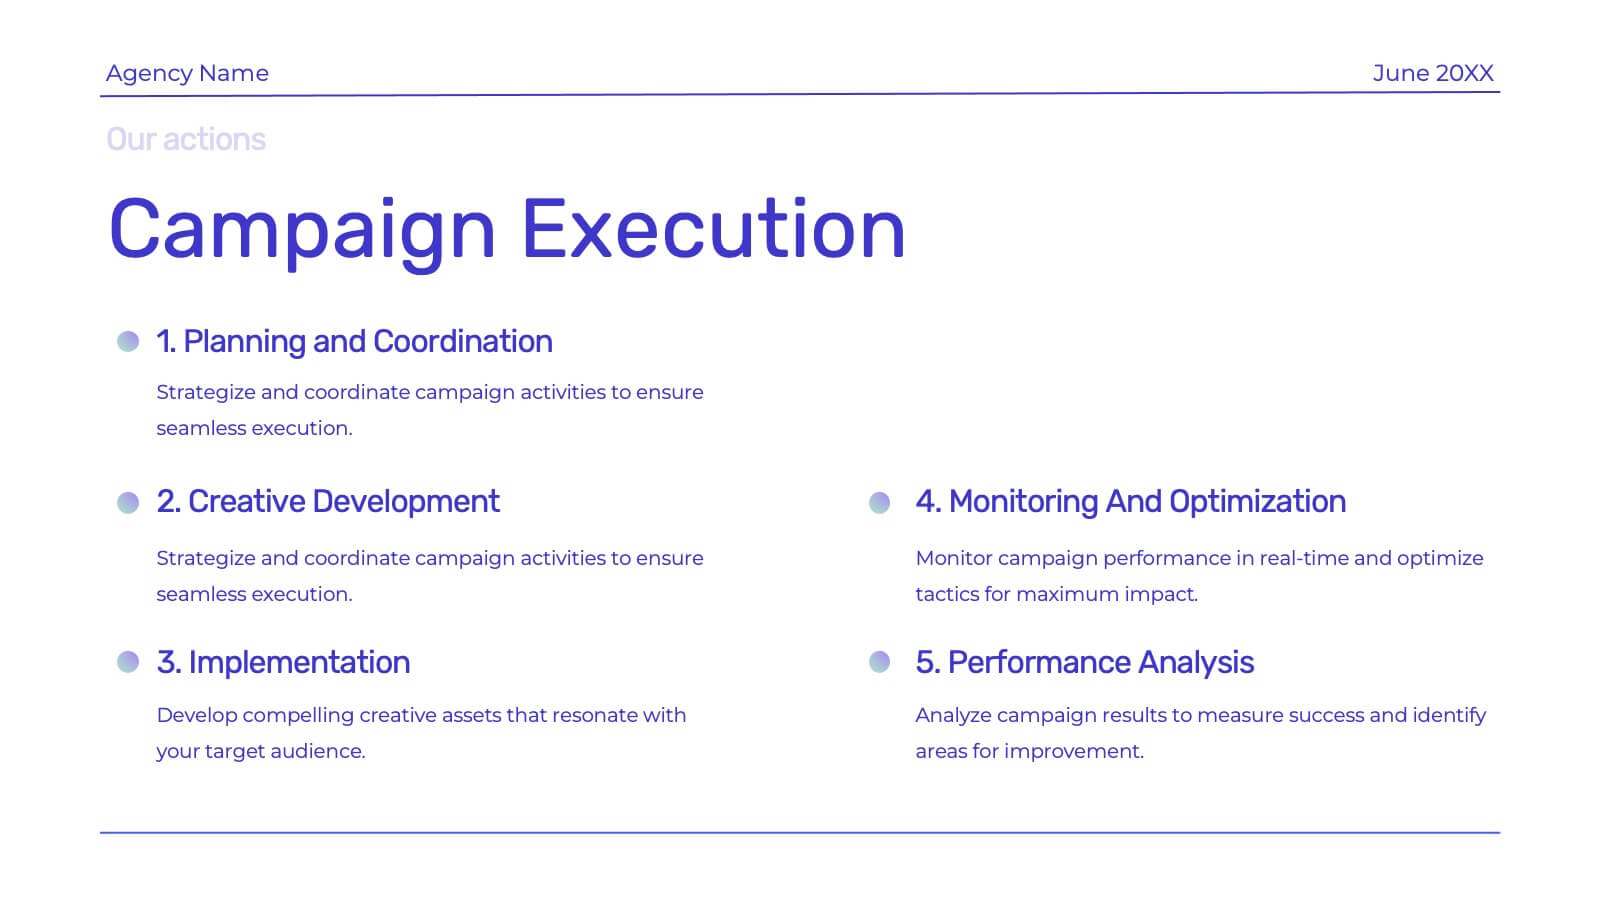
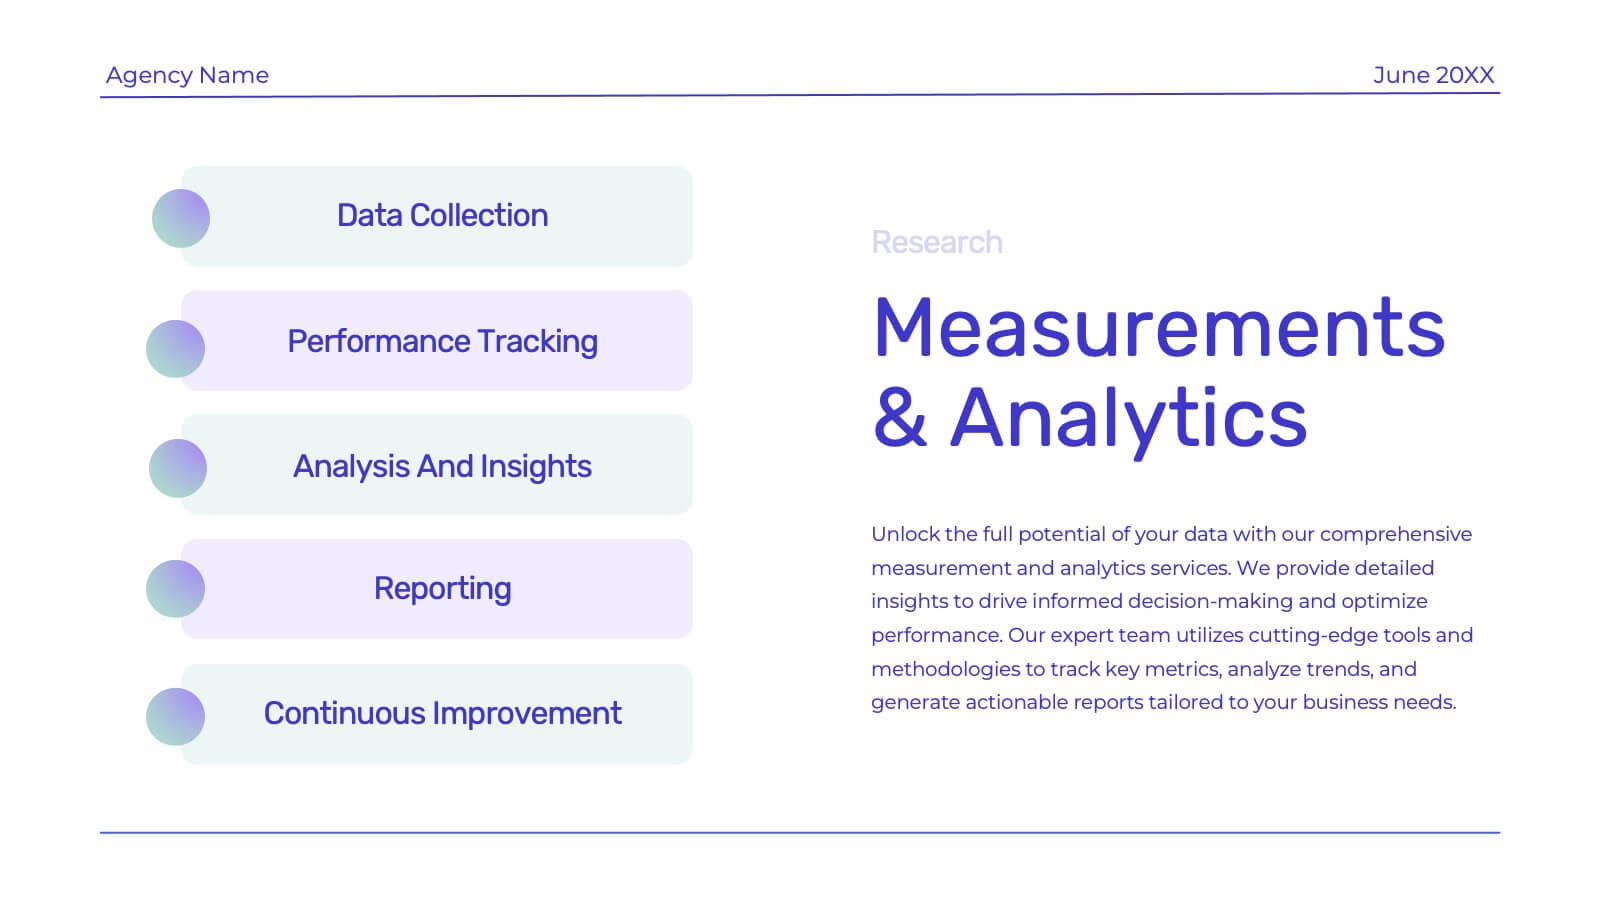
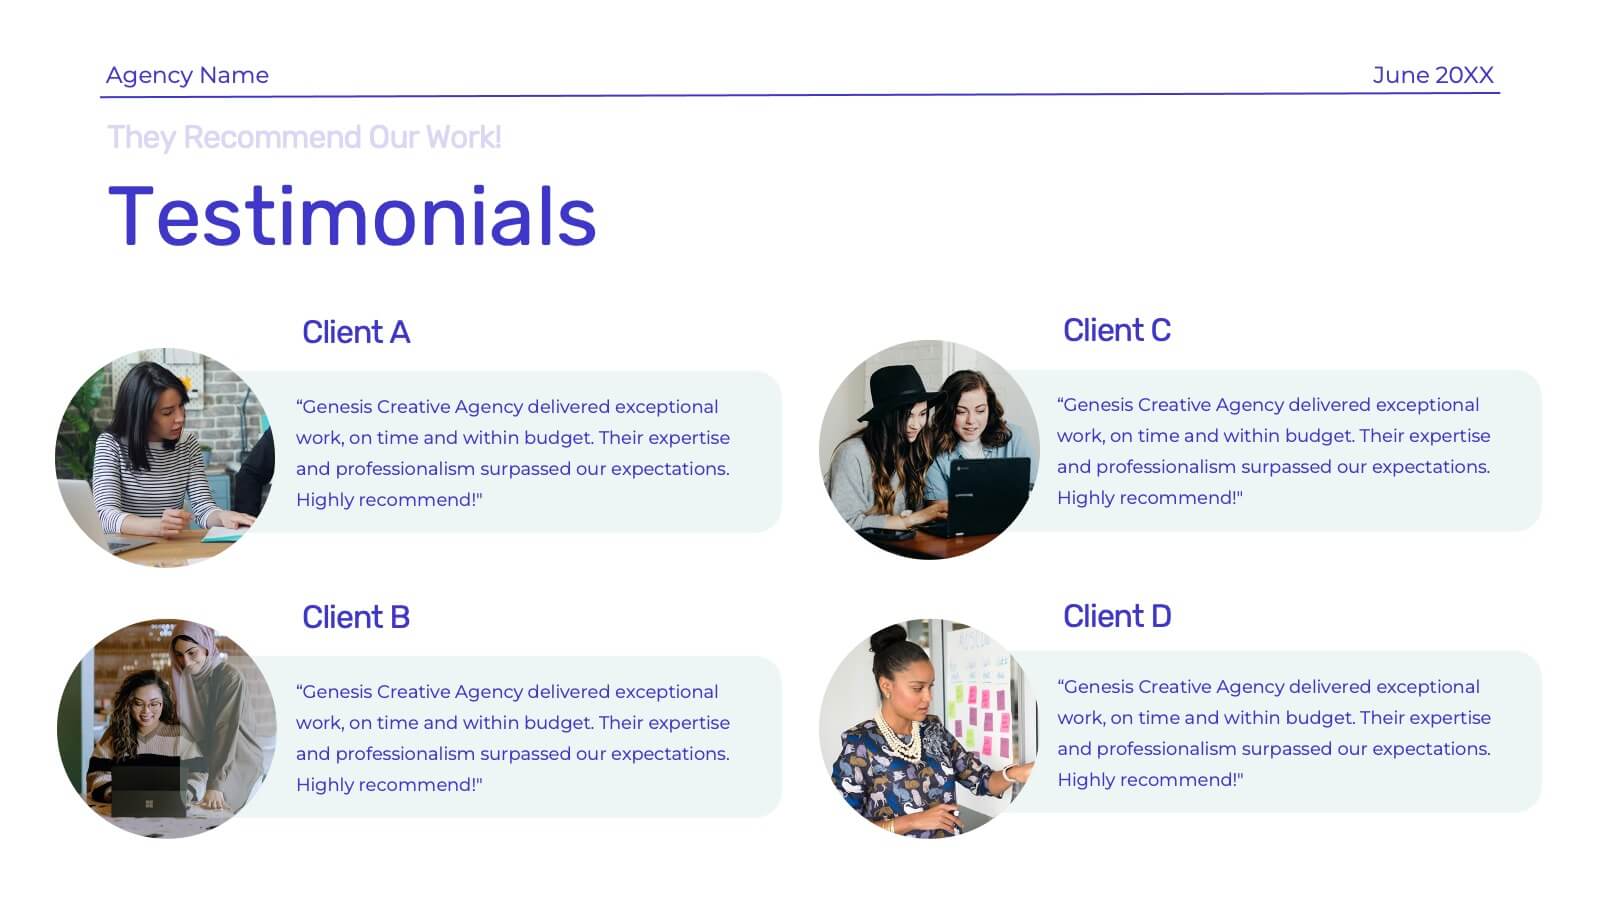
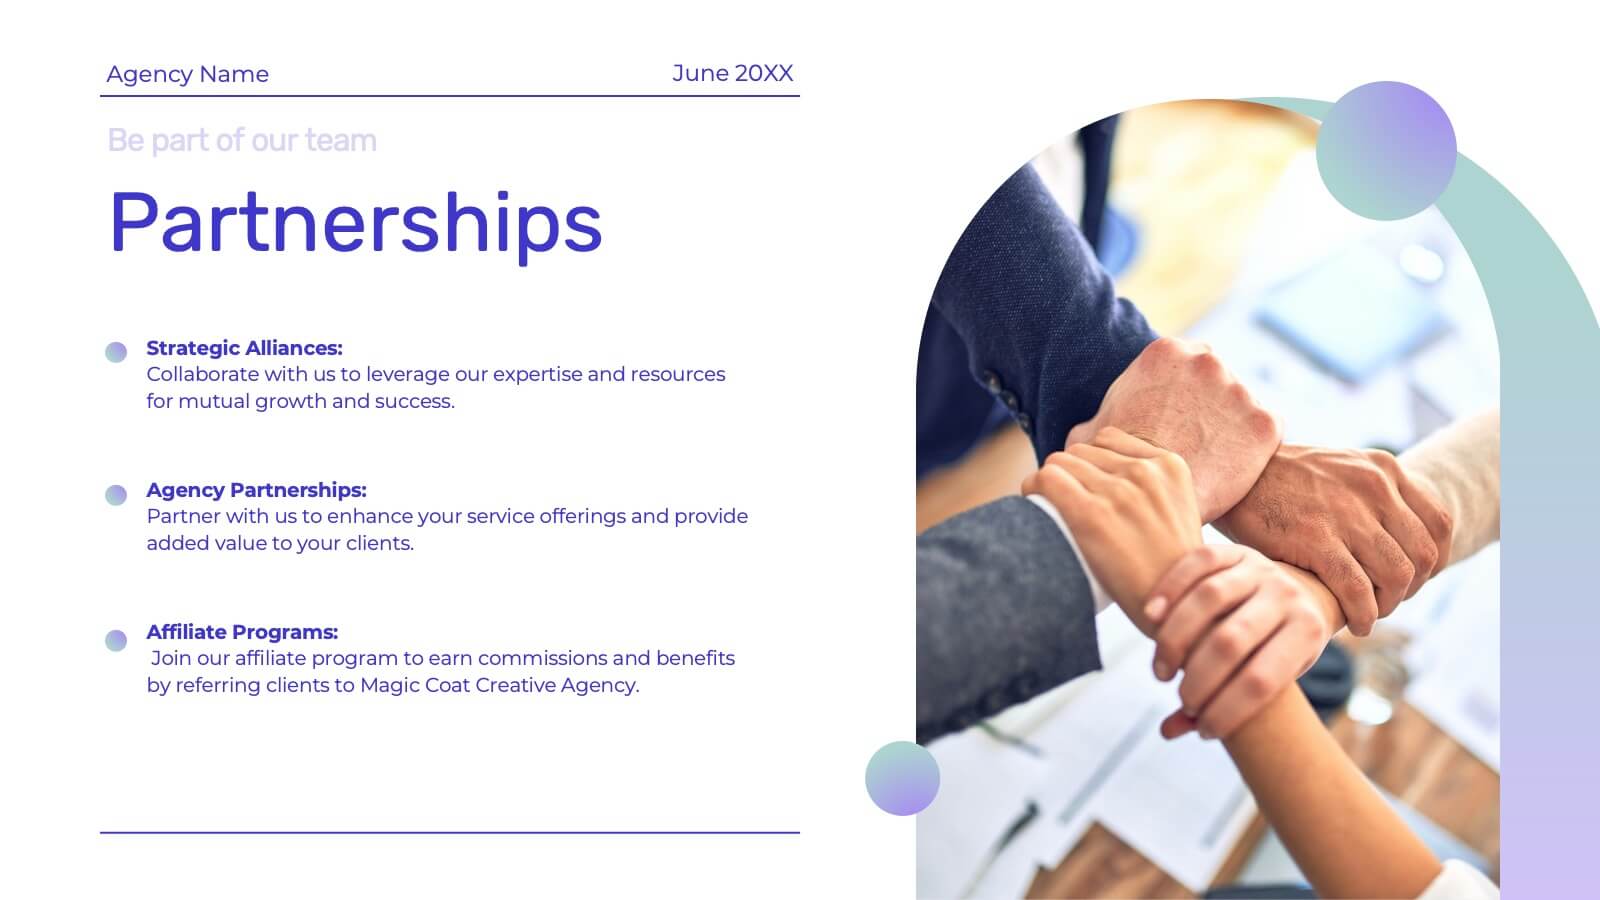
Genesis Creative Agency Pitch Deck Presentation
Showcase your creative agency’s strengths with this vibrant template. Highlight your team, services, success stories, and unique approach. Ideal for case studies, market analysis, and campaign execution. Fully compatible with PowerPoint, Keynote, and Google Slides.


7 diapositivas
Buyer Persona Guide Infographic
Elevate your marketing strategy with our Buyer Persona Guide Infographic Template, designed to distill complex customer data into stunning, easy-to-understand visual profiles. This template is a canvas for creativity, allowing marketers to paint detailed portraits of their ideal customers using a mix of vibrant colors, engaging layouts, and succinct text. Craft each persona with care, detailing demographics, preferences, behaviors, and needs, all laid out in an aesthetically pleasing format that makes data pop off the page. Whether you're presenting to stakeholders, guiding your content strategy, or training your sales team, these visuals serve as your roadmap to deeper customer connections. Fully customizable to reflect your brand's unique voice and style, this template adapts seamlessly to your needs, ensuring that every insight into your audience is not just informative but also visually captivating. It's an essential tool for anyone looking to enhance their understanding of their market and refine their approach to meet customer demands.


26 diapositivas
Efficient Time Management Presentation
Optimize your time management skills with a presentation designed to streamline your productivity. The template offers a professional and calming color palette, encouraging focus and clarity. It's structured to address the key principles of time management, from prioritizing tasks to strategic planning. Within the slides, you’ll find tools to introduce time management concepts, team profiles to assign roles efficiently, and charts to monitor progress. Engaging graphics and infographics are used to outline processes and time allocation, making it easier to visualize effective time management strategies. This template is a perfect match for workshops, personal organization sessions, or corporate training programs, compatible with popular platforms like PowerPoint, Keynote, and Google Slides. It’s designed to aid professionals and teams in harnessing their time effectively, ensuring every second counts towards achieving their goals.