


Características


¿Tienes alguna pregunta?
Recomendar


21 diapositivas
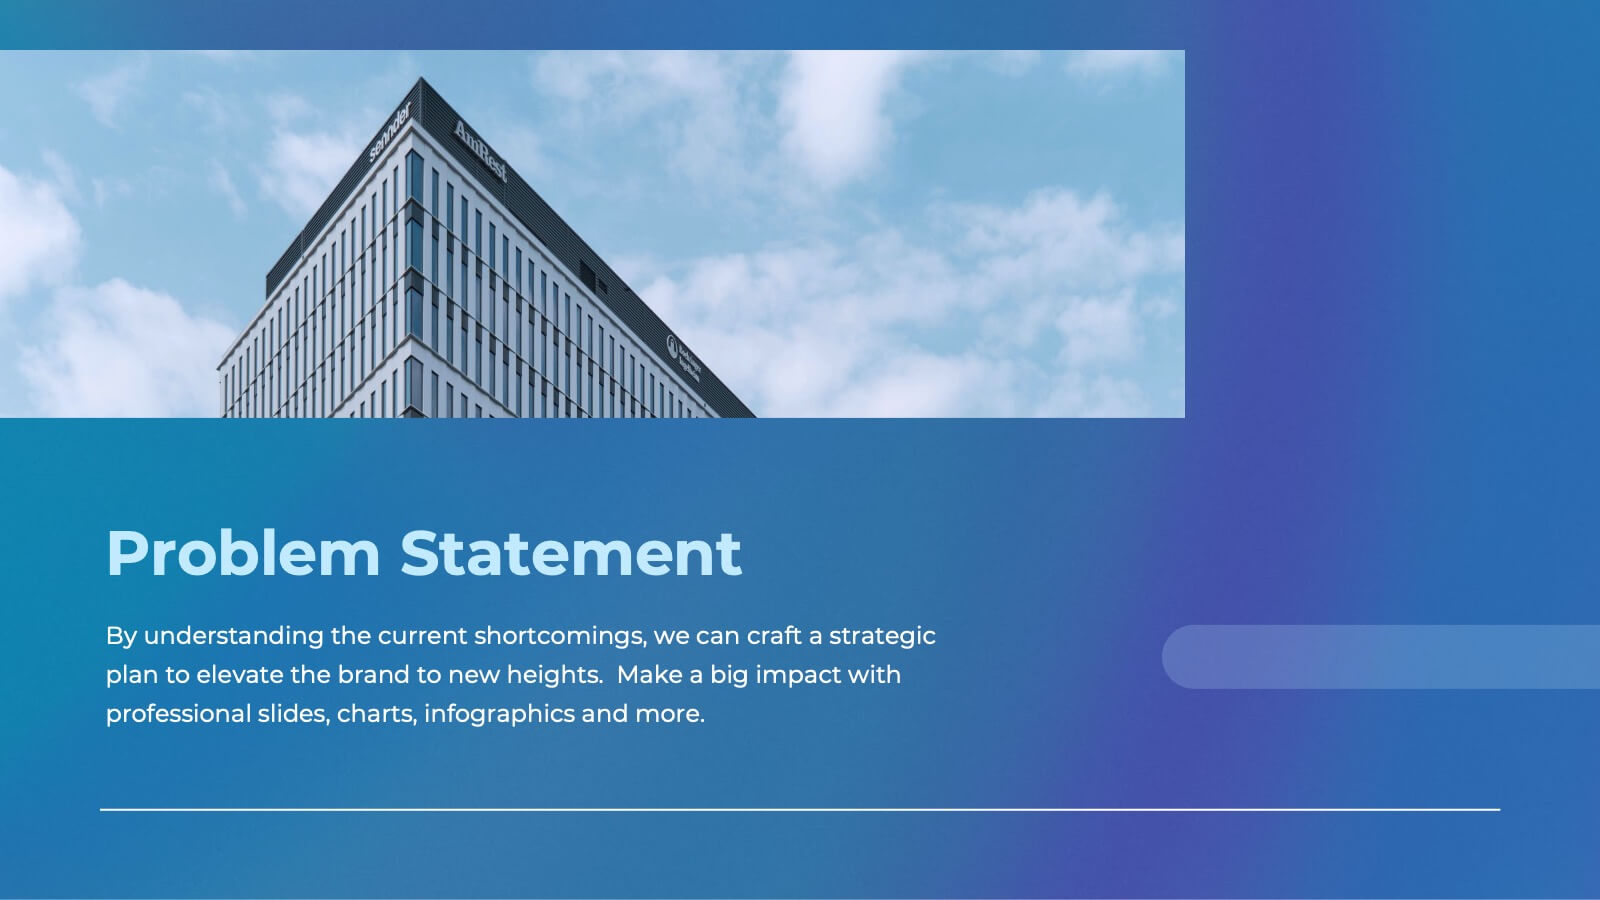
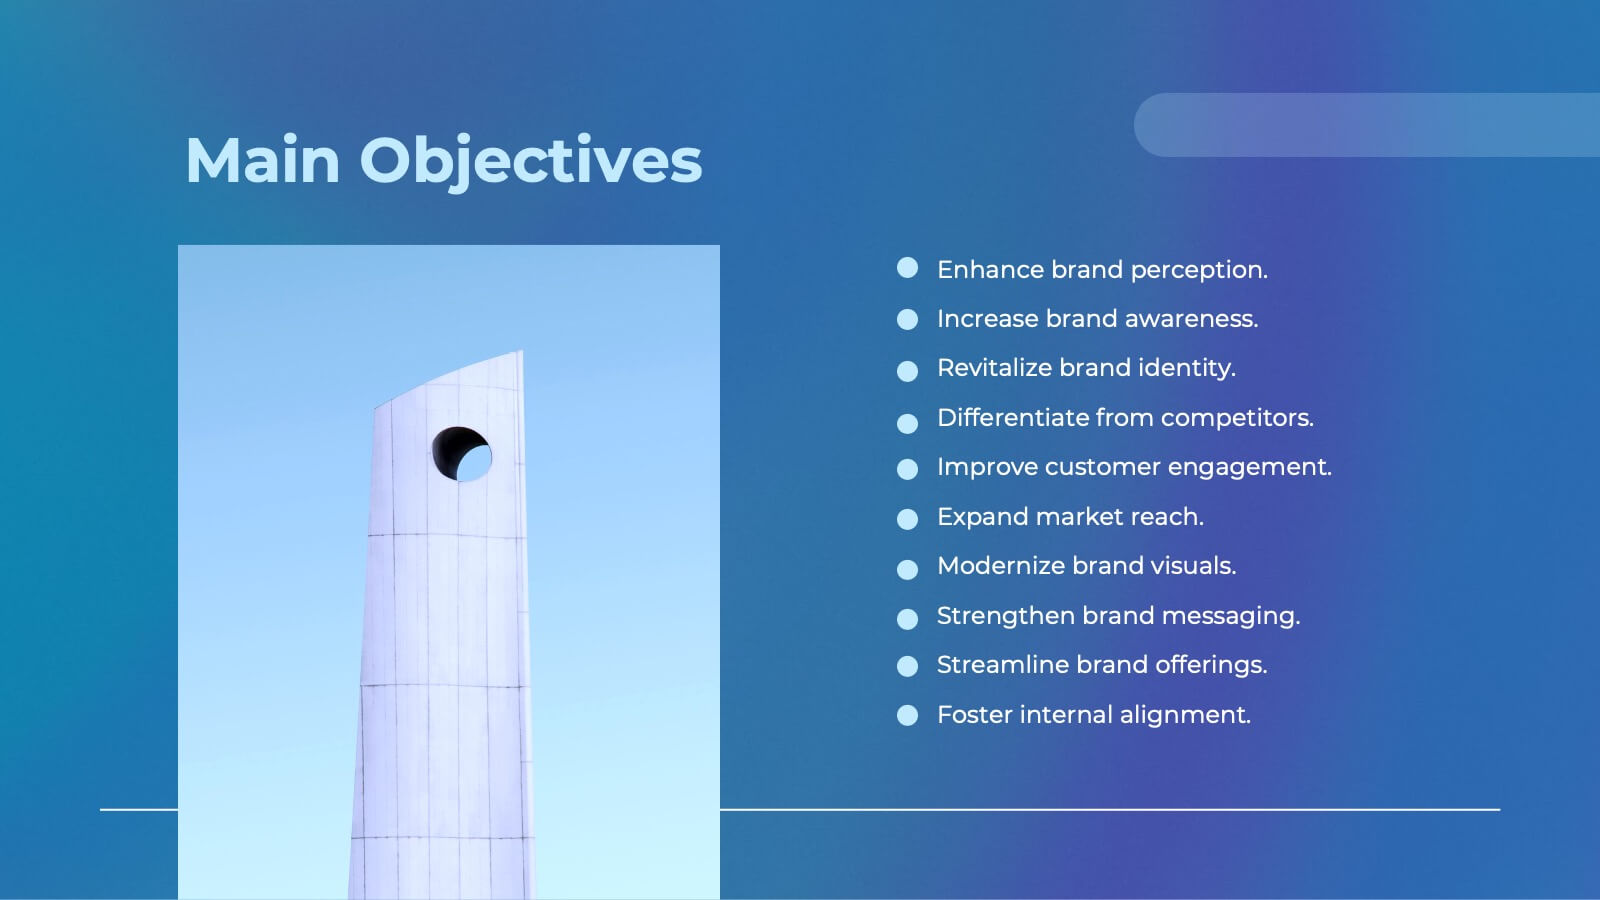
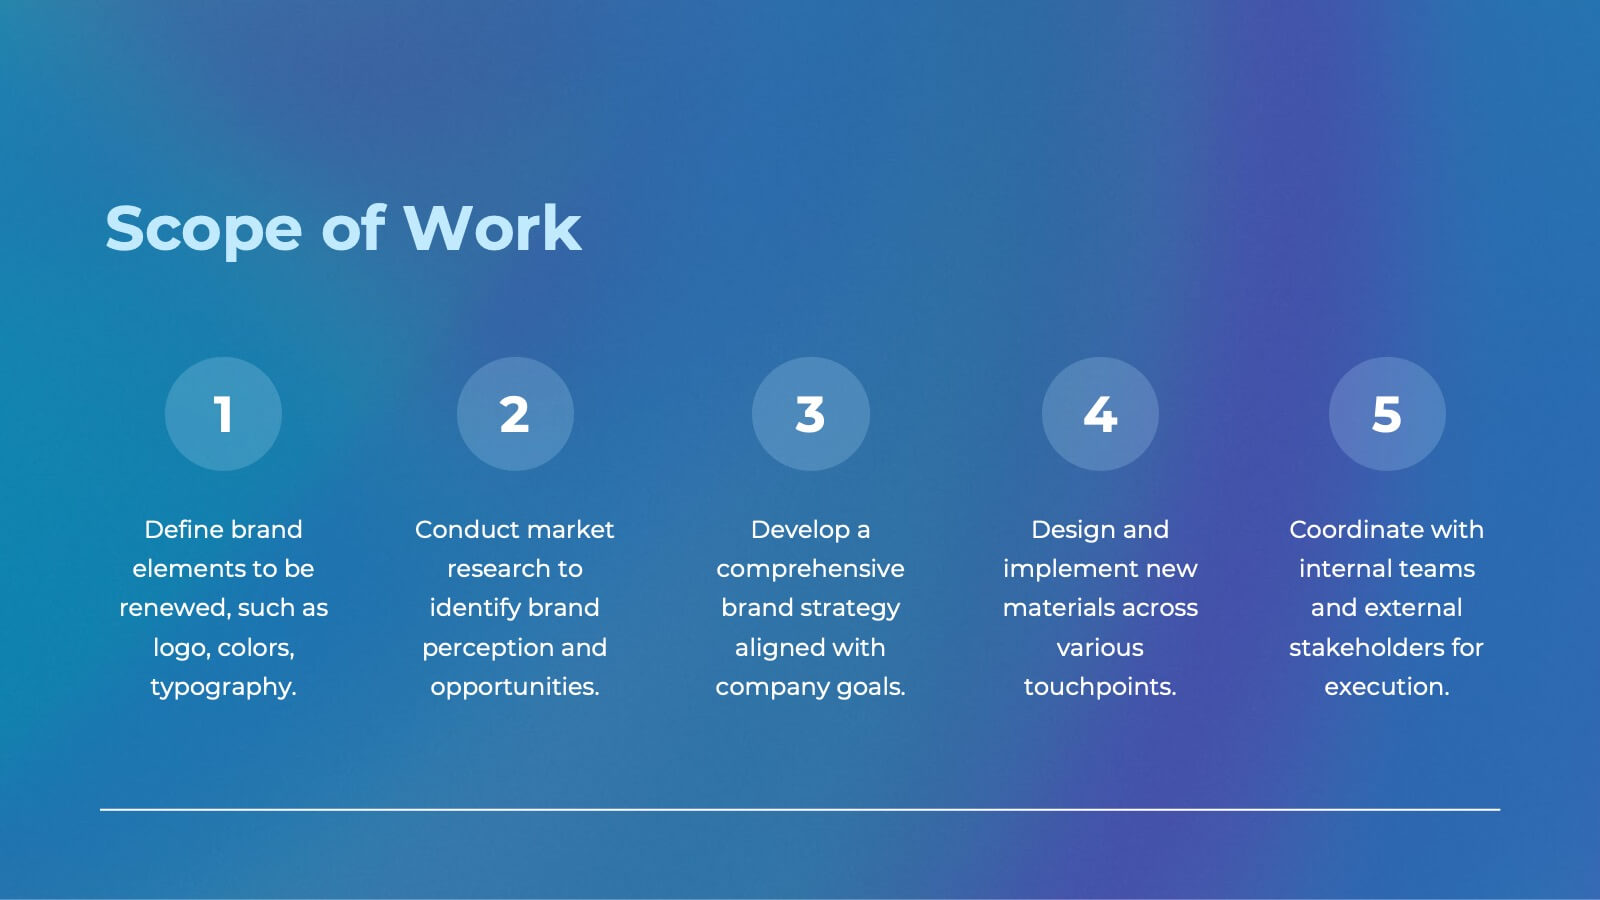
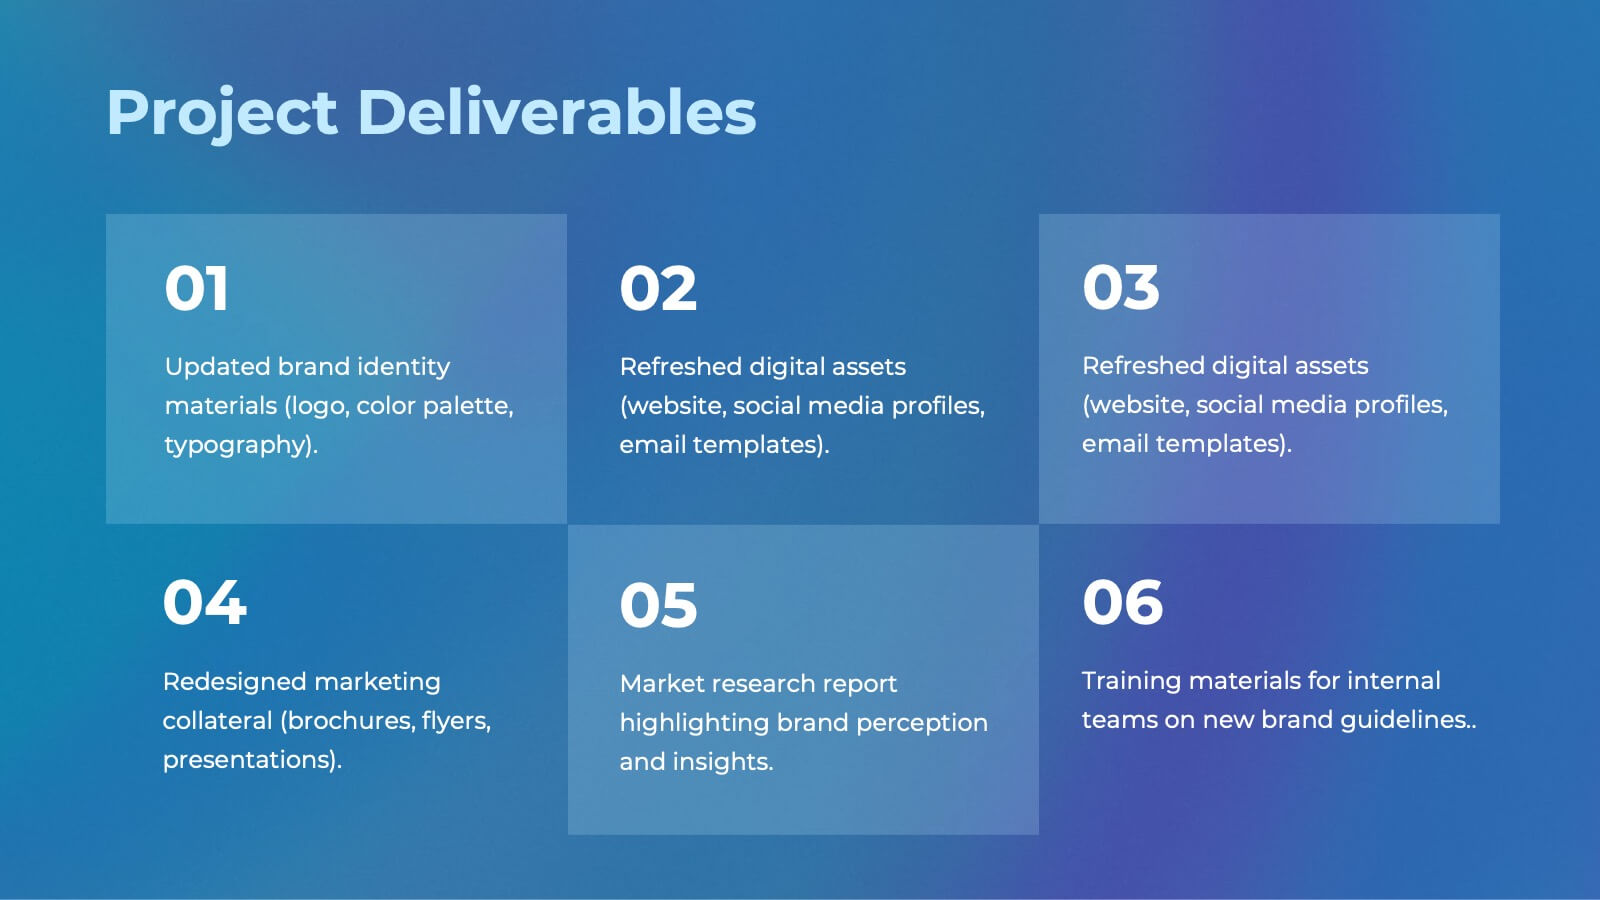
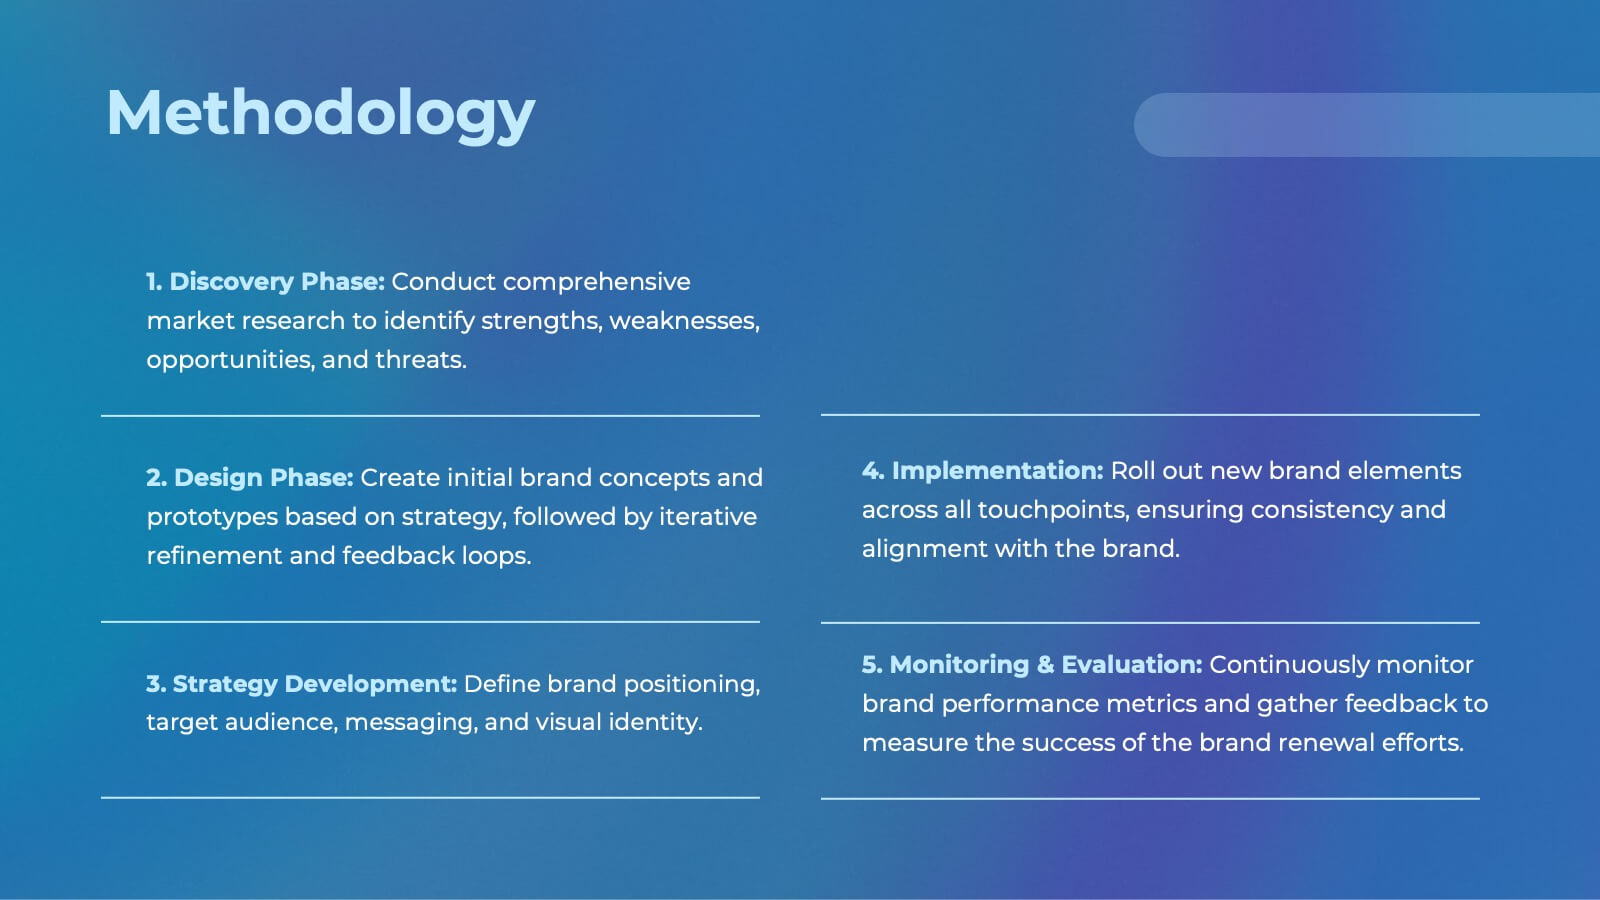
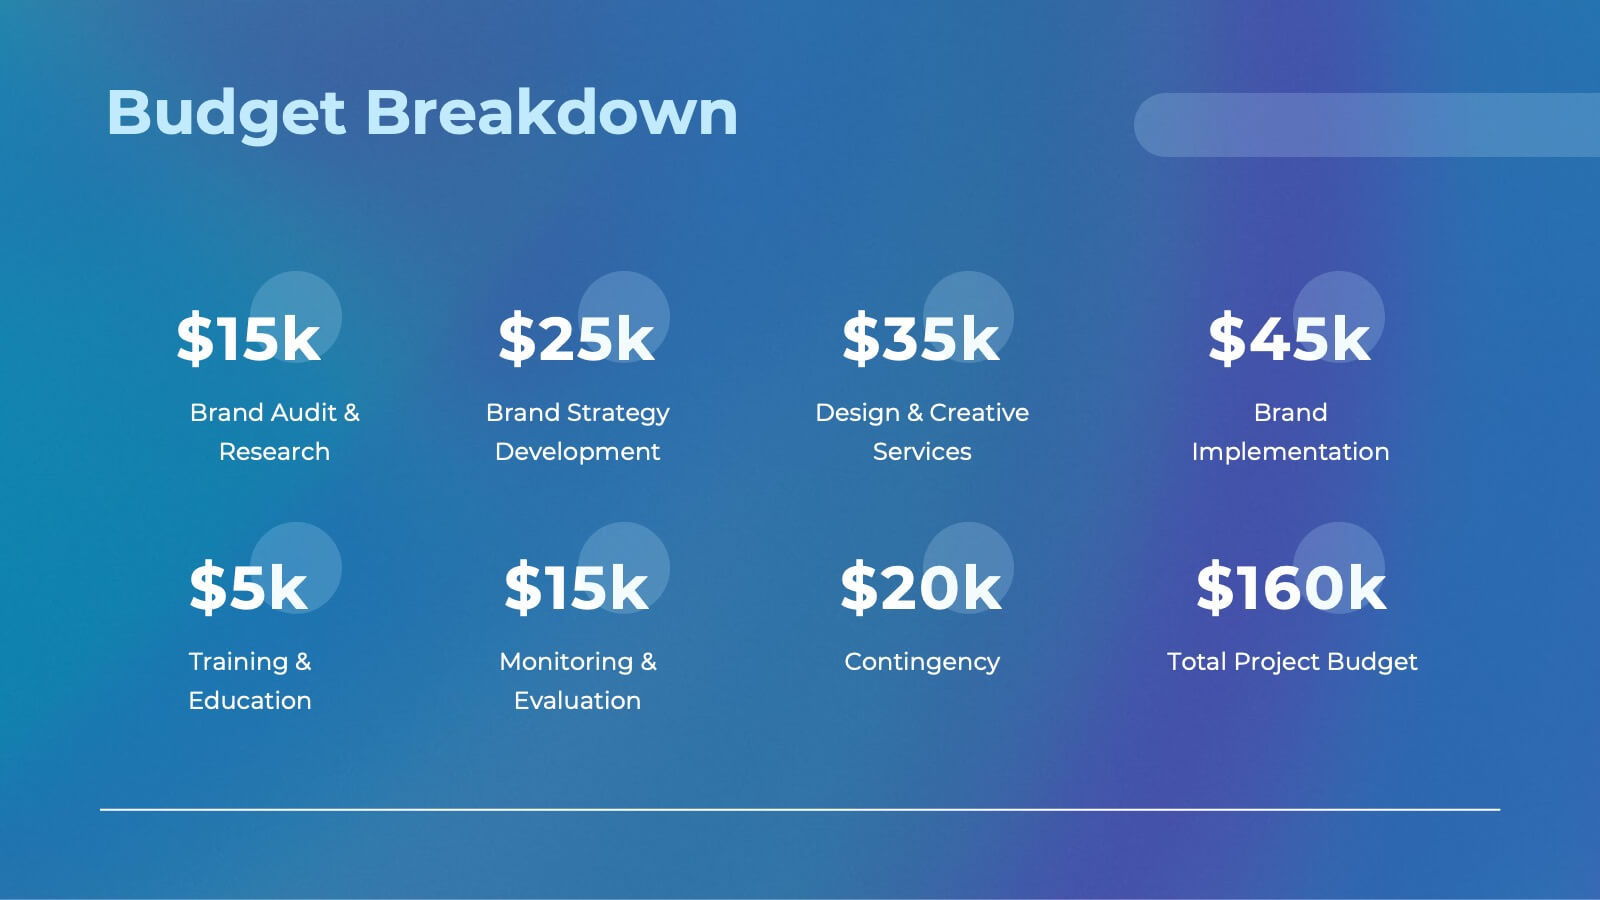
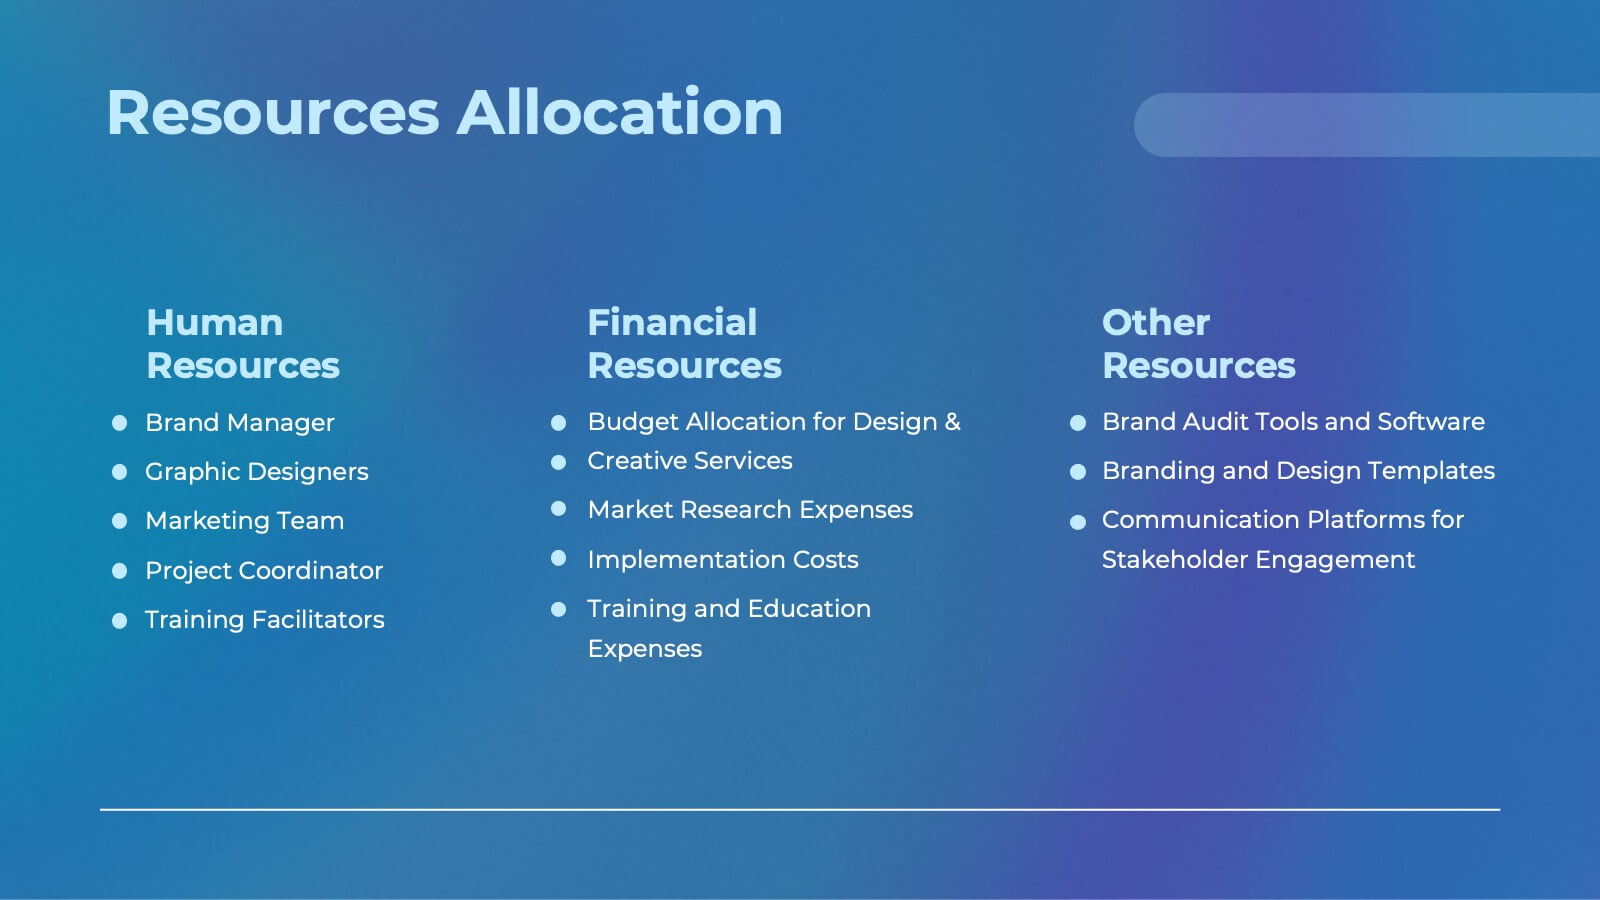
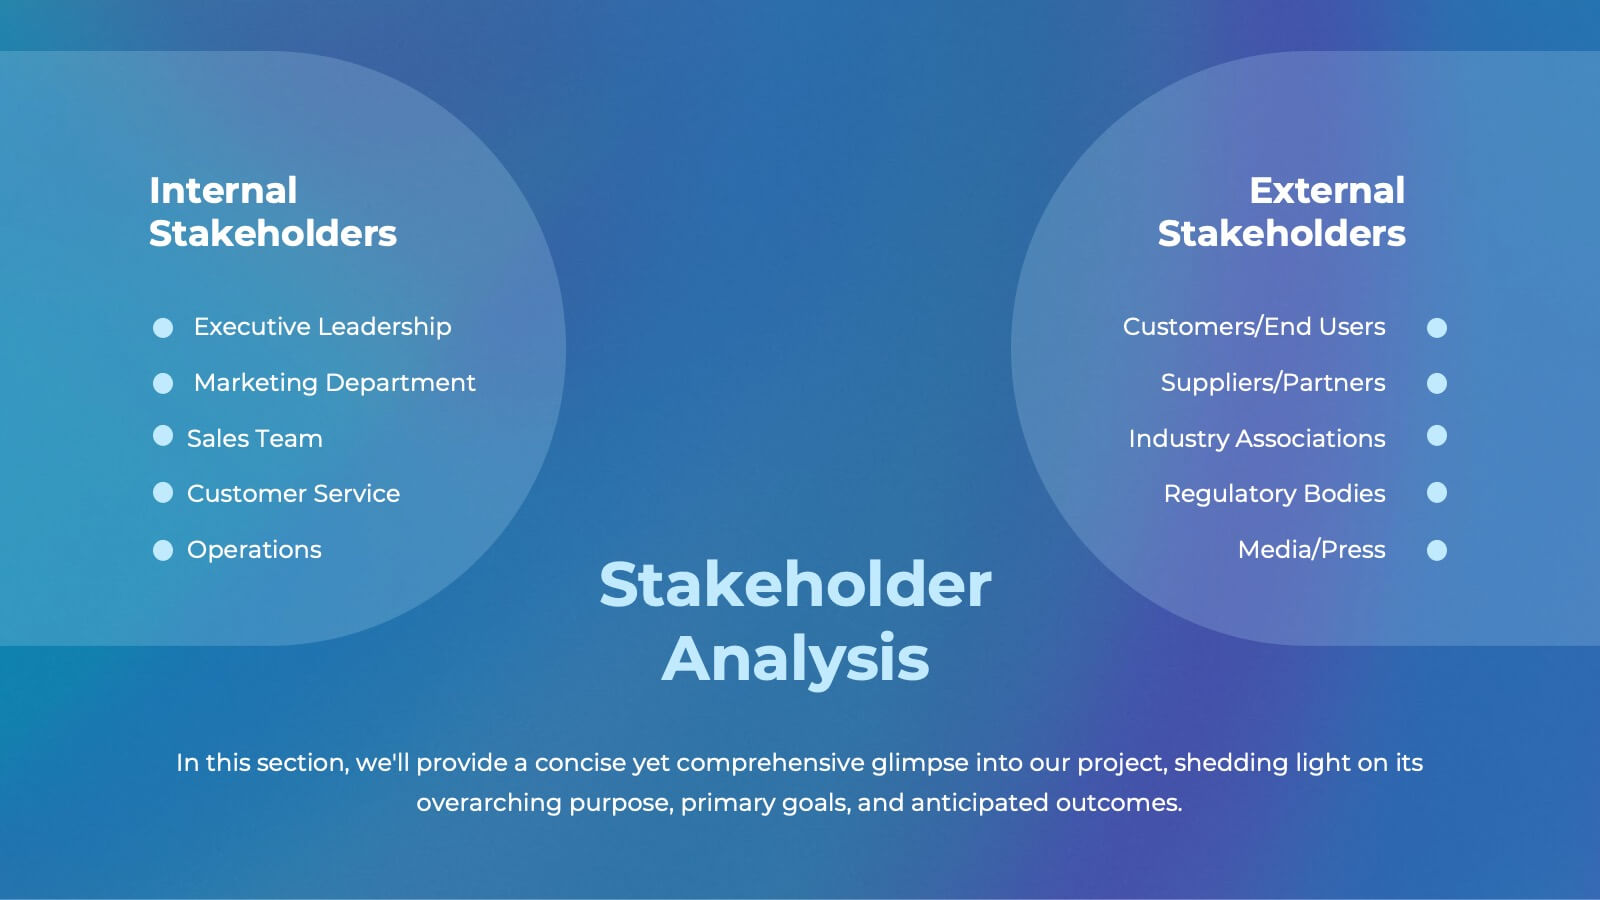
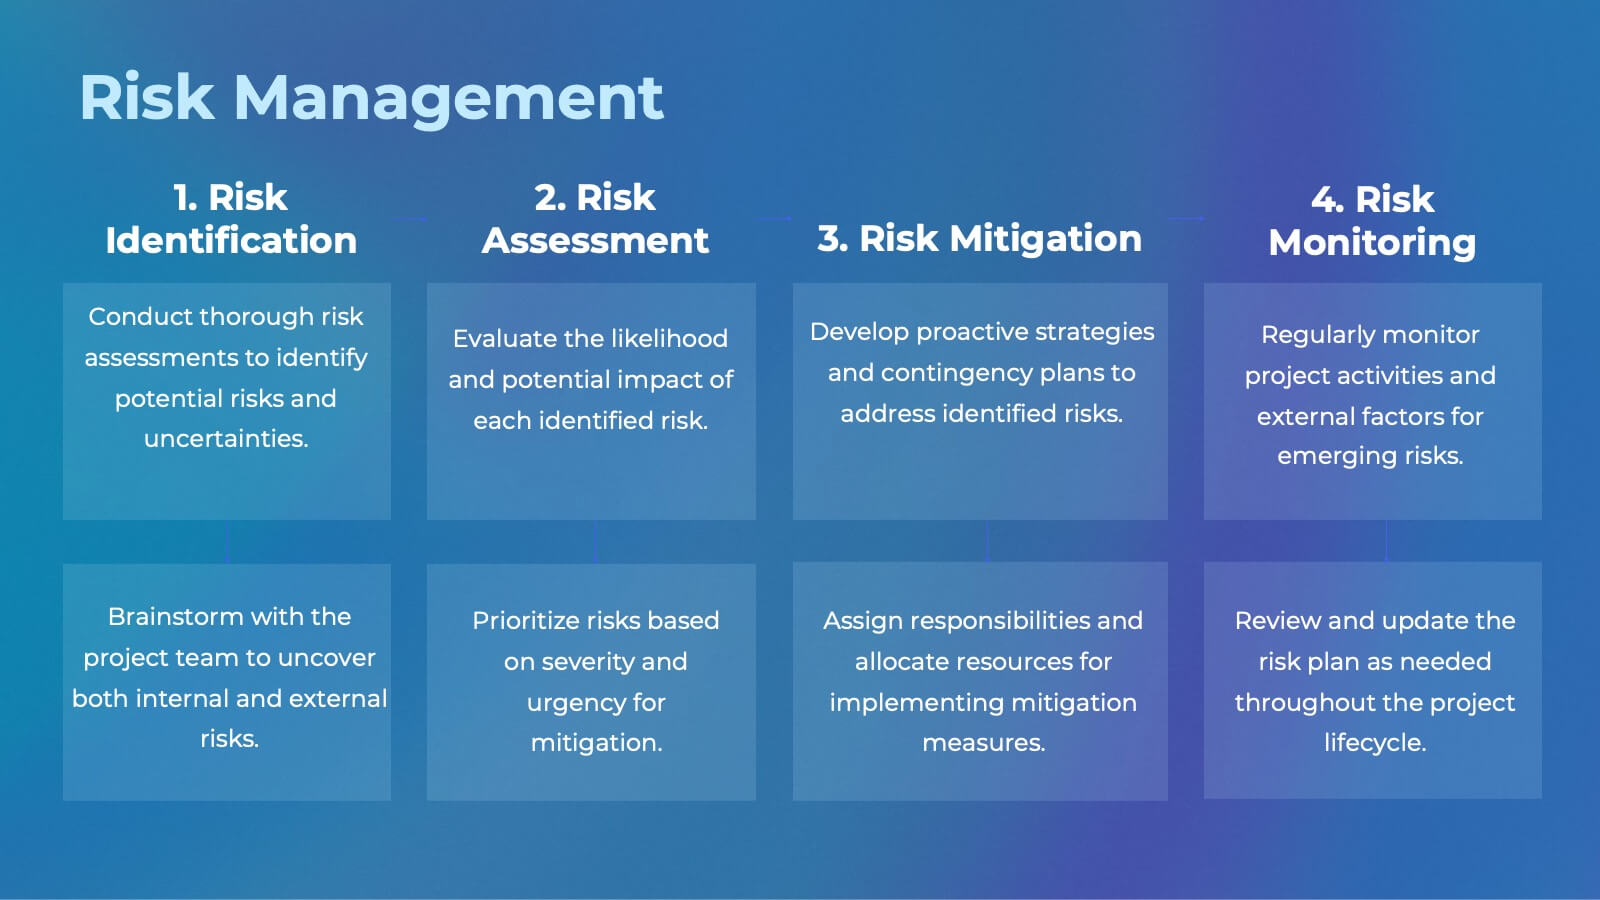
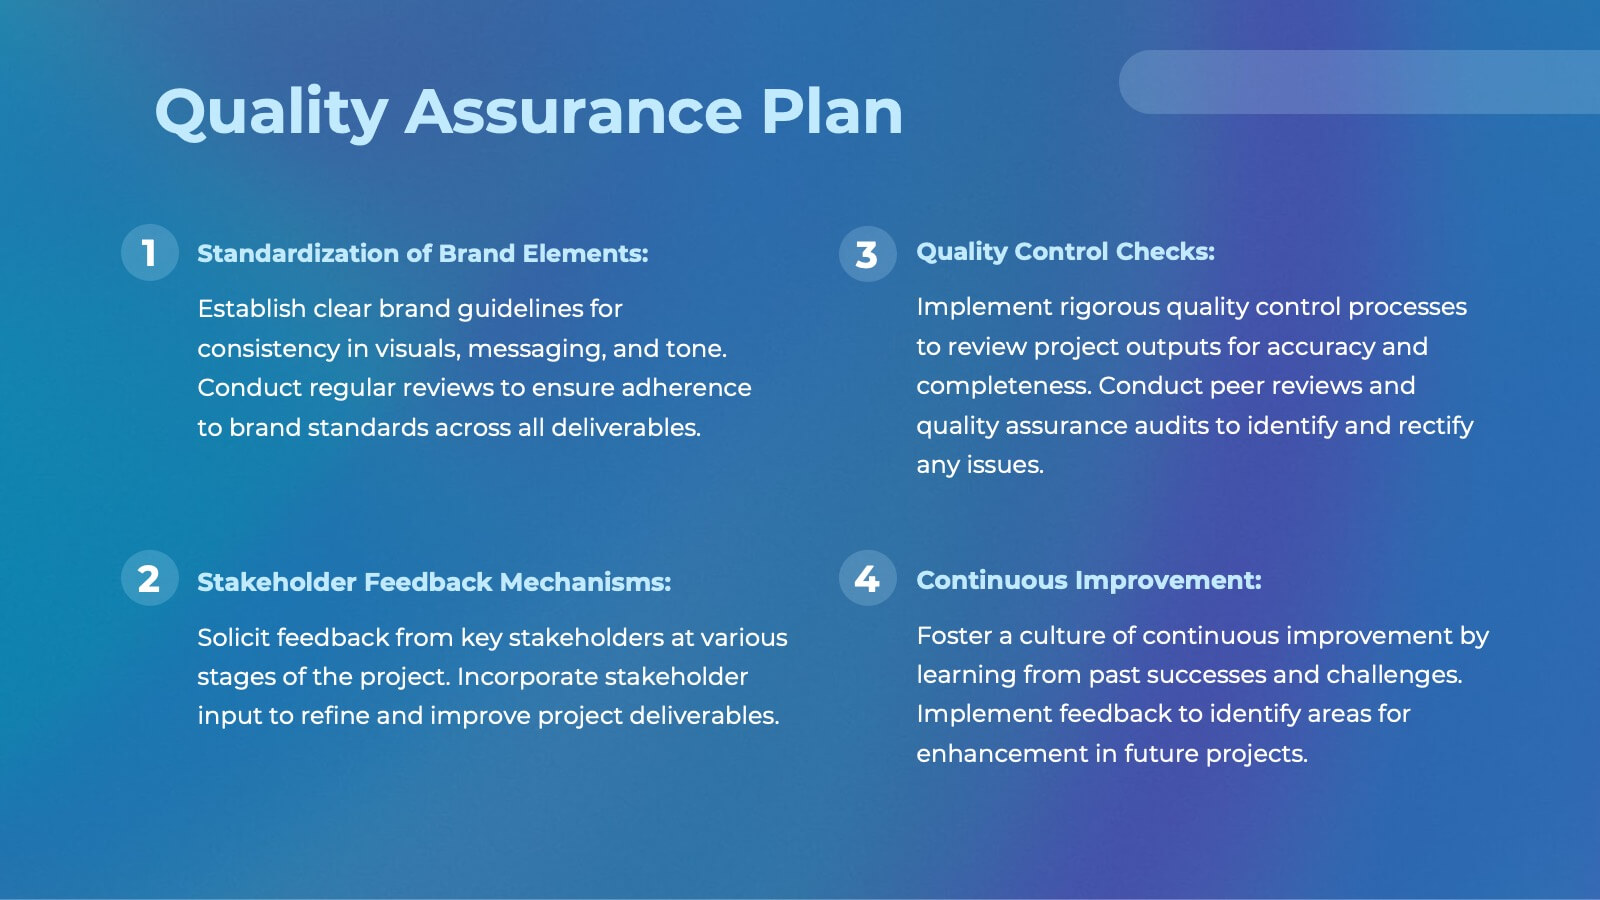
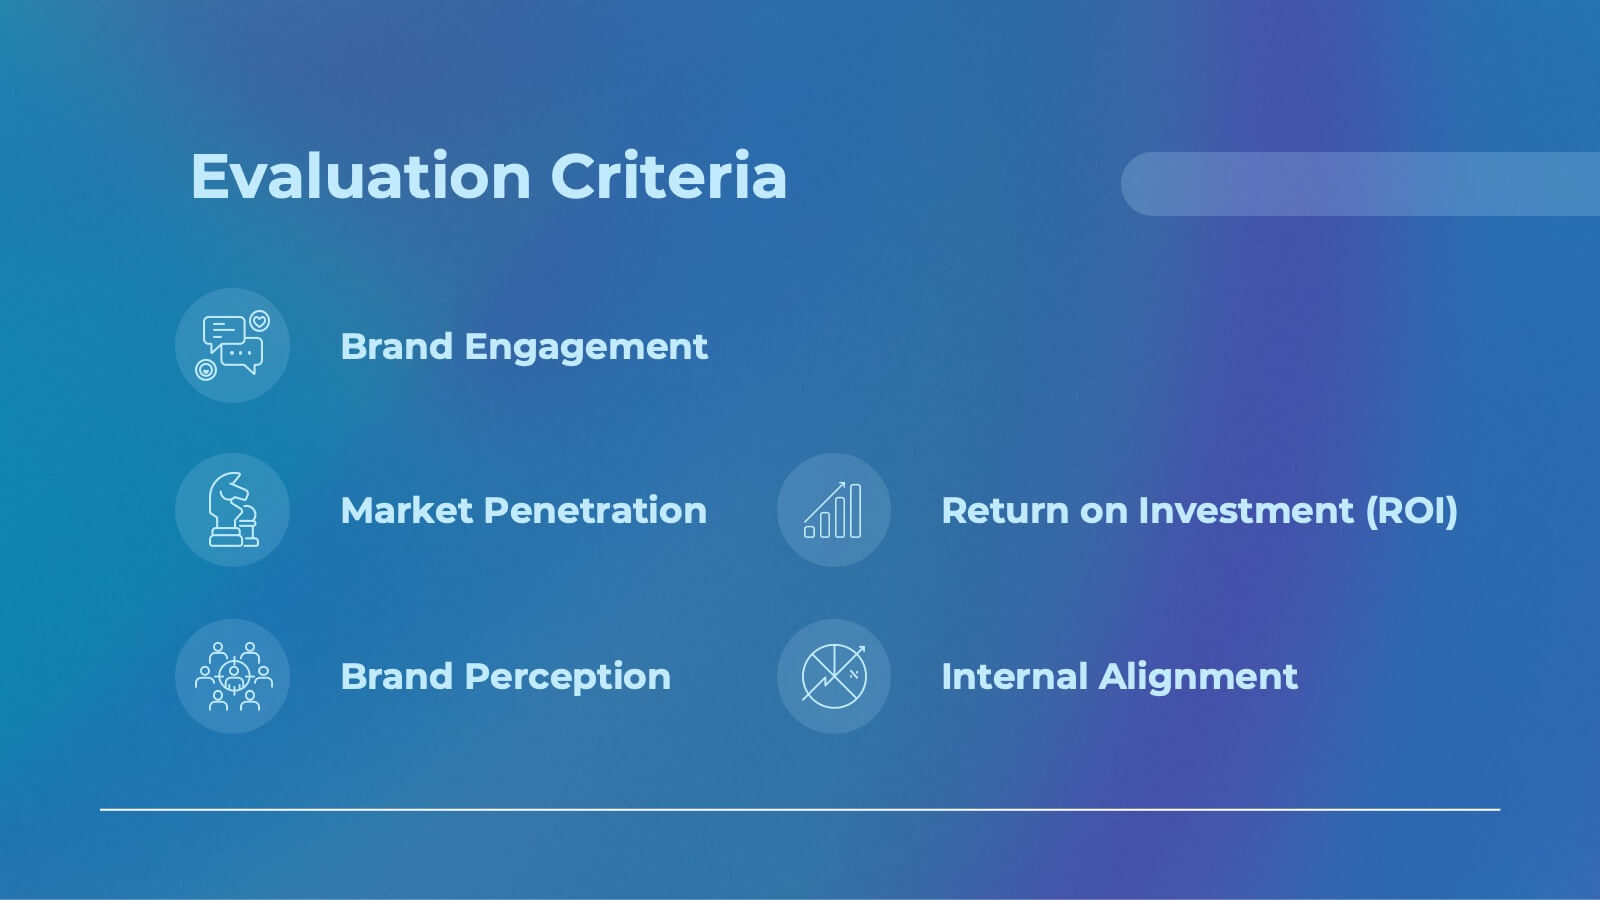
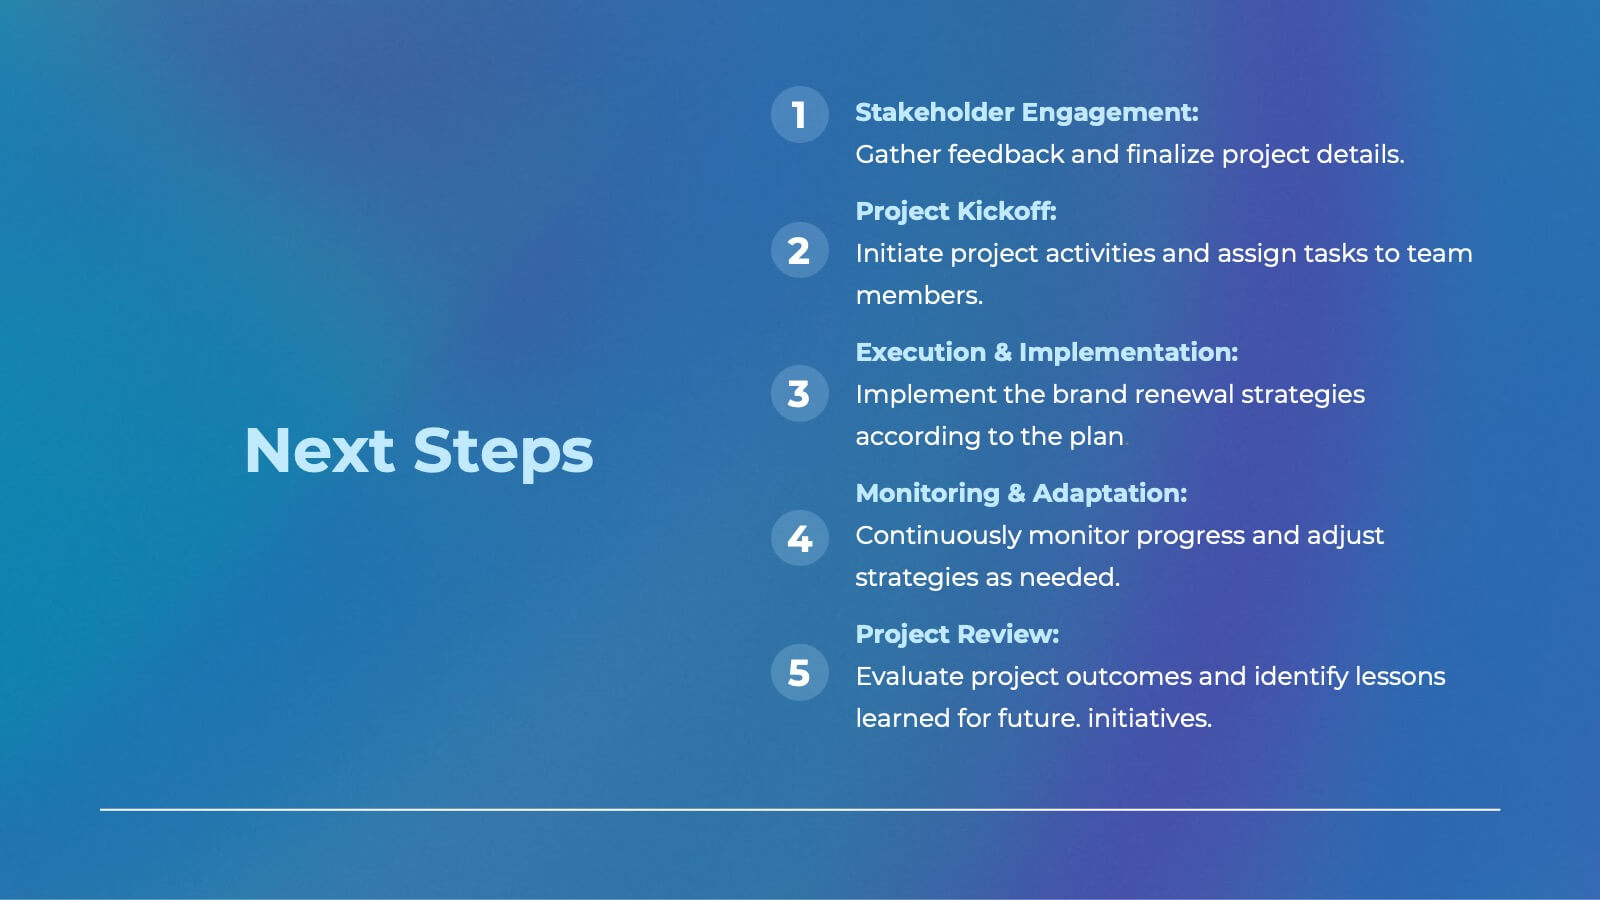
Ember Agile Project Plan Presentation
Ready to ace your next project proposal? This sleek presentation template is perfect for outlining objectives, timelines, and budgets. Designed for professionals aiming to impress stakeholders and secure approvals. Compatible with PowerPoint, Keynote, and Google Slides, it ensures a smooth and professional presentation every time. Ideal for project managers and business leaders.


5 diapositivas
Layered Business Pyramid Framework
Visualize business hierarchy and strategic layers with the Layered Business Pyramid Framework Presentation. This editable slide features a five-tier pyramid diagram aligned with corresponding text sections, ideal for showcasing organizational structures, workflow levels, or growth stages. Each layer is color-coded for clarity and impact, making your insights easy to digest. Fully compatible with PowerPoint, Keynote, and Google Slides.


7 diapositivas
Enforcement Law Infographic Presentation
A Law Enforcement Infographic is a visual representation of key concepts, statistics, and procedures related to law enforcement. This template can be used to provide an overview of various aspects of law enforcement, such as crime rates, policing strategies, and legal procedures. This infographic includes a variety of icons, illustrations, and other design elements law themed to enhance the visual appeal and make it more appealing for your viewers. This template is compatible with Powerpoint, Keynote and Google Slides making it easy to customize and edit with your own text and information.


21 diapositivas
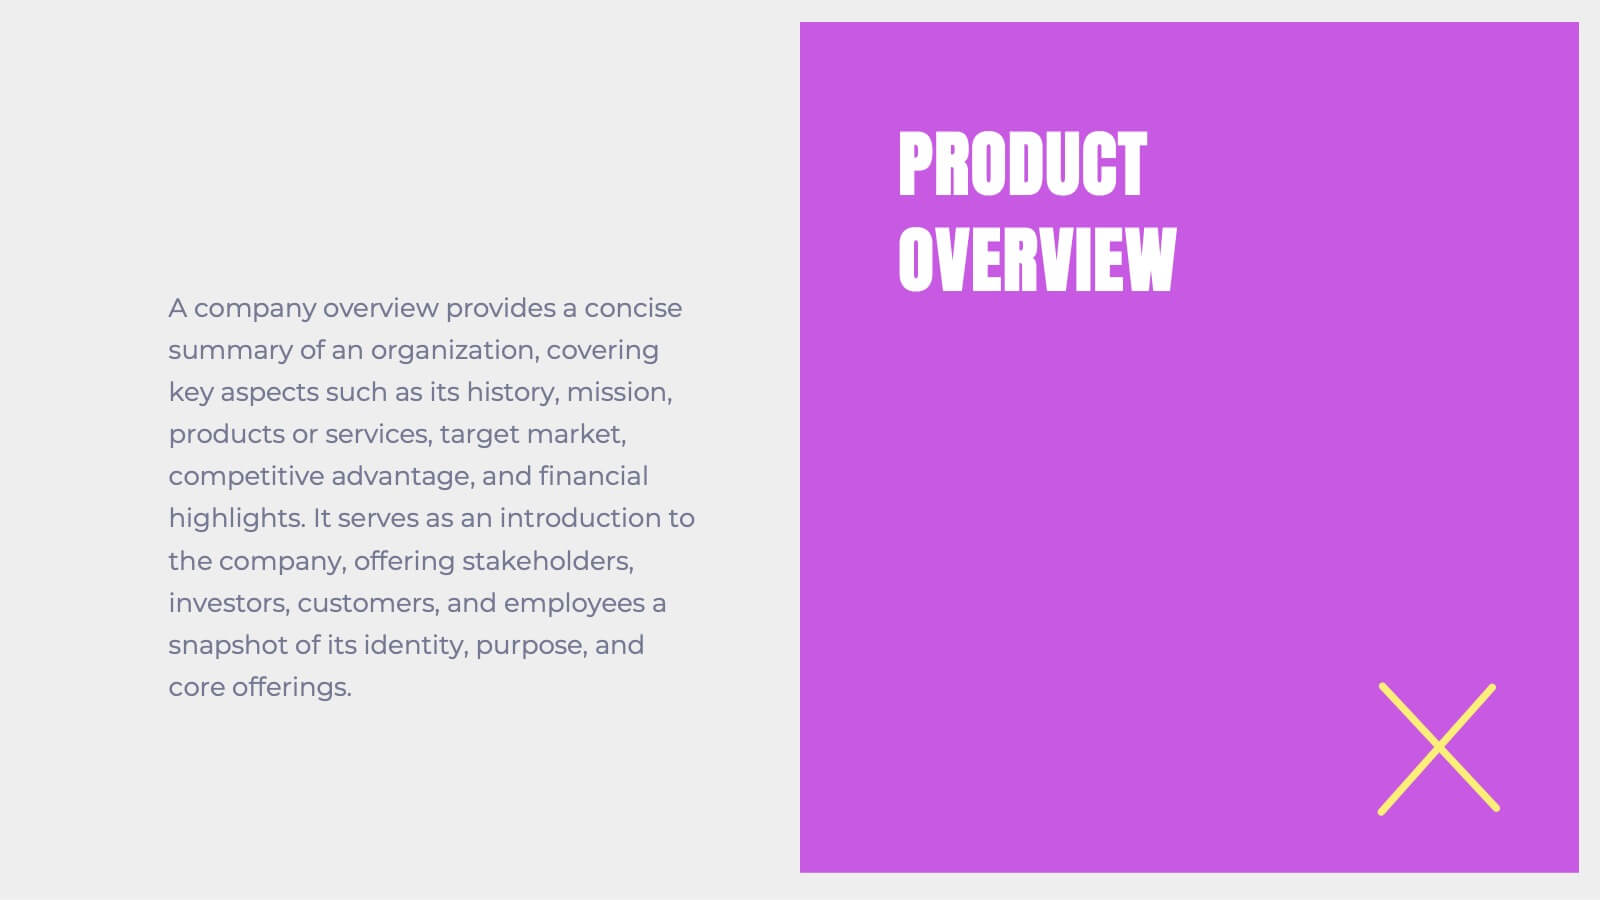
Whisperleaf Startup Strategy Presentation
This vibrant startup strategy template sets the stage for success with structured content and bold design. Highlight your mission, vision, product overview, and competitive landscape all in one place. Perfect for conveying business models, market insights, and growth strategies with clarity. Editable in PowerPoint, Keynote, and Google Slides for ultimate flexibility.


5 diapositivas
Collaboration Tools for Team Efficiency Presentation
Visualize teamwork like never before with the Collaboration Tools for Team Efficiency Presentation. Featuring a puzzle-style layout, this slide highlights four interconnected ideas or steps—perfect for team workflows, project milestones, or tool comparisons. Easy to customize in Canva, PowerPoint, or Google Slides.


4 diapositivas
4-Quadrant RACI Chart Slide Presentation
Bring structure and clarity to your workflow with a bold, pyramid-style layout that makes responsibilities instantly understandable. This presentation helps teams outline who leads, supports, approves, and informs across key tasks, turning complex processes into a clean visual map. Fully editable and compatible with PowerPoint, Keynote, and Google Slides.


6 diapositivas
Ideal Buyer Persona Customer Profile Presentation
Define your perfect customer with the Ideal Buyer Persona Customer Profile Presentation. This clear and visually structured layout helps you map out key traits, behaviors, and needs of your target audience. Easy to edit in Canva, PowerPoint, or Google Slides—ideal for marketing teams, strategists, and business development presentations.


5 diapositivas
Annual Business Roadmap Timeline Presentation
Kick off your planning journey with a clean, modern visual timeline that makes every milestone easy to follow. This presentation helps outline yearly goals, track progress, and communicate strategic priorities with clarity and flow. Perfect for business planning and reporting. Fully compatible with PowerPoint, Keynote, and Google Slides.


5 diapositivas
Revenue and Cost Breakdown Presentation
Present your financial insights with clarity using this 4-point revenue and cost analysis layout. Ideal for summarizing earnings, expenses, or budget comparisons. The circular icon design keeps information clean and engaging. Fully customizable in Canva, PowerPoint, or Google Slides to fit your brand’s data and presentation needs.


6 diapositivas
Europe Education Map Infographics
Explore our versatile Europe Education Map infographic template, a valuable resource for visualizing the educational landscape across the continent of Europe. This template is fully compatible with popular presentation software such as PowerPoint, Keynote, and Google Slides, allowing you to effortlessly customize it to meet your specific needs. The Europe Education Map infographic template provides a solid foundation for illustrating data related to educational institutions, literacy rates, and academic trends throughout Europe. Whether you're an educator, researcher, or interested in European education, this template offers a user-friendly platform to create informative presentations and educational materials. Impress your audience with this SEO-optimized Europe Education Map infographic template, designed for clarity and ease of use. Customize it to showcase educational opportunities, achievements, and regional insights, making it a valuable asset for your projects and presentations. Begin crafting your personalized infographic today!


19 diapositivas
Fableia Marketing Research Report Presentation
Deliver data-driven insights with a professional and visually engaging marketing research report presentation. This template is tailored for marketing professionals, agencies, and businesses looking to showcase research findings with precision and clarity. Highlight key sections such as market trends, consumer behavior analysis, and campaign performance using dynamic visuals and well-structured layouts. Share your insights on emerging technologies, social media strategies, and customer targeting with easy-to-edit graphs, charts, and infographics. Use dedicated slides for SEO analytics, value propositions, and recommendations to present actionable strategies that resonate with your audience. This template is fully customizable and works seamlessly with PowerPoint, Google Slides, and Keynote, ensuring you can adapt it to your unique needs. Present your research with confidence and leave a lasting impact on stakeholders and decision-makers.


21 diapositivas
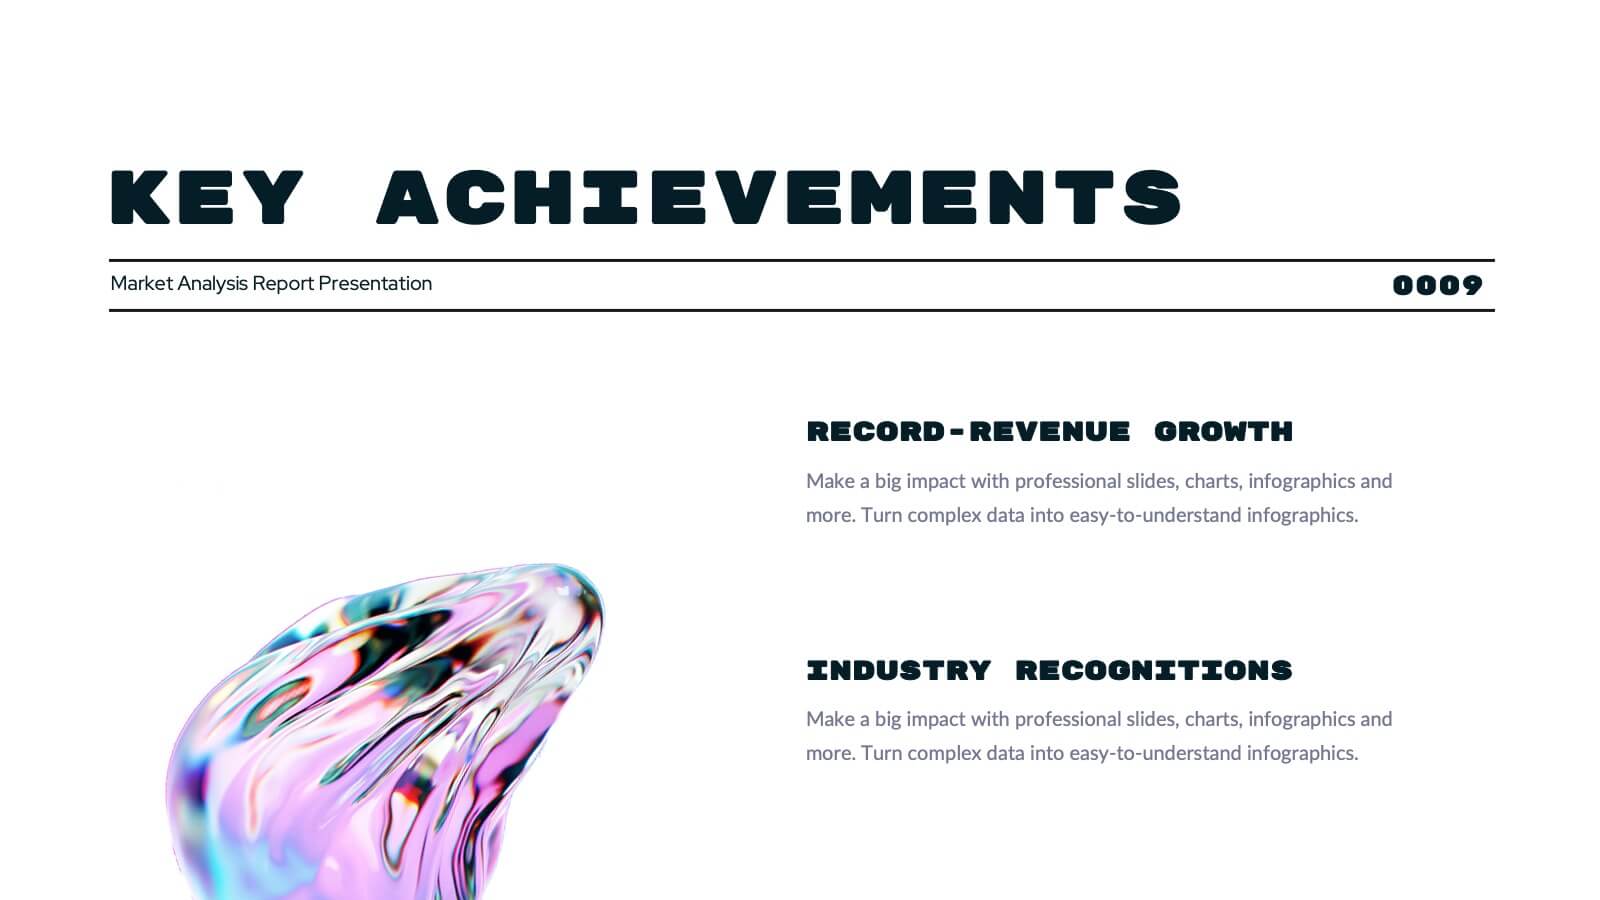
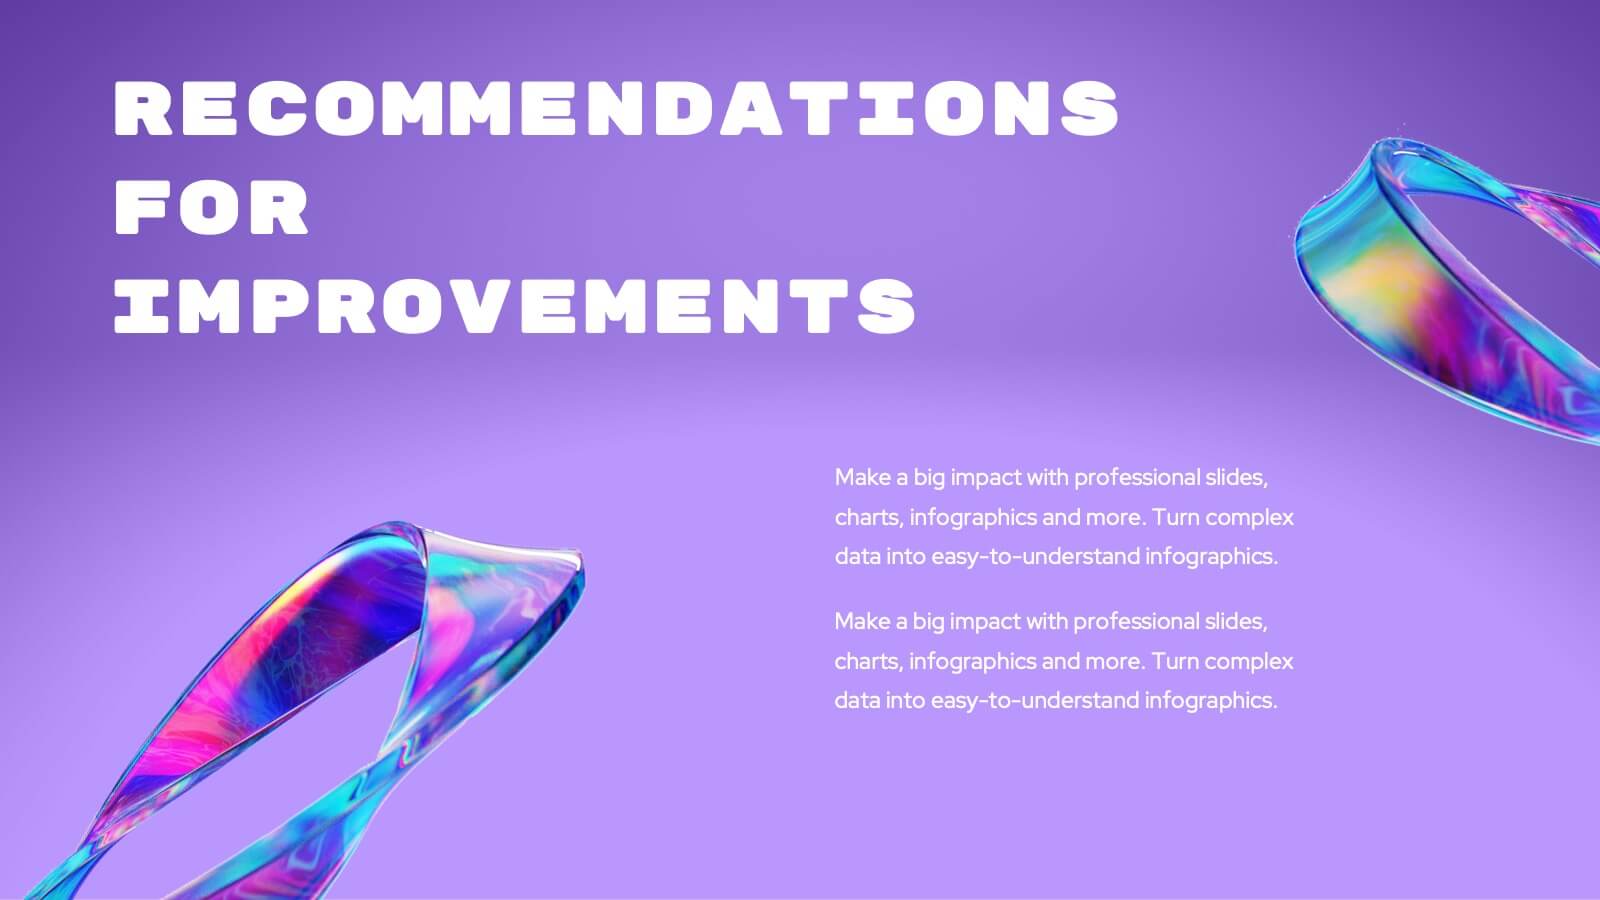
Turquoise Market Analysis Report Presentation
This sleek report presentation template covers essential sections like key performance metrics, market analysis, and strategic initiatives. It’s designed for a professional yet modern look, perfect for showcasing updates and insights. Compatible with PowerPoint, Keynote, and Google Slides, it’s ideal for delivering engaging and impactful business reports.


7 diapositivas
Alphabet Letters Infographic
An alphabet infographic is a visual representation or graphic that presents information related to the alphabet, often used for educational purposes or to convey information in a creative and engaging manner. Get ready to embark on a joyful journey through the wonderland of letters and words with our alphabet letters infographic. This infographic template includes various elements like letters, words, examples, pronunciation guides, or related images. This is more than just an infographic—it's a vibrant celebration of language, learning, and pure happiness. Dive into the kaleidoscope of alphabets and spread the cheer!


7 diapositivas
Network Infographics Presentation Template
Networking is a great way to meet people in your same field and gain valuable information. It's a great way to meet and connect with other professionals, find out about job opportunities, and keep up with what's new in your field. This template is perfect for becoming informed on the benefits of networking. Networking is a powerful way to expand your circle of contacts and get in touch with people who can help you advance in your career. This template includes a helpful infographic that explains the standard process, visualizations and diagrams, providing you with a great starting point.


23 diapositivas
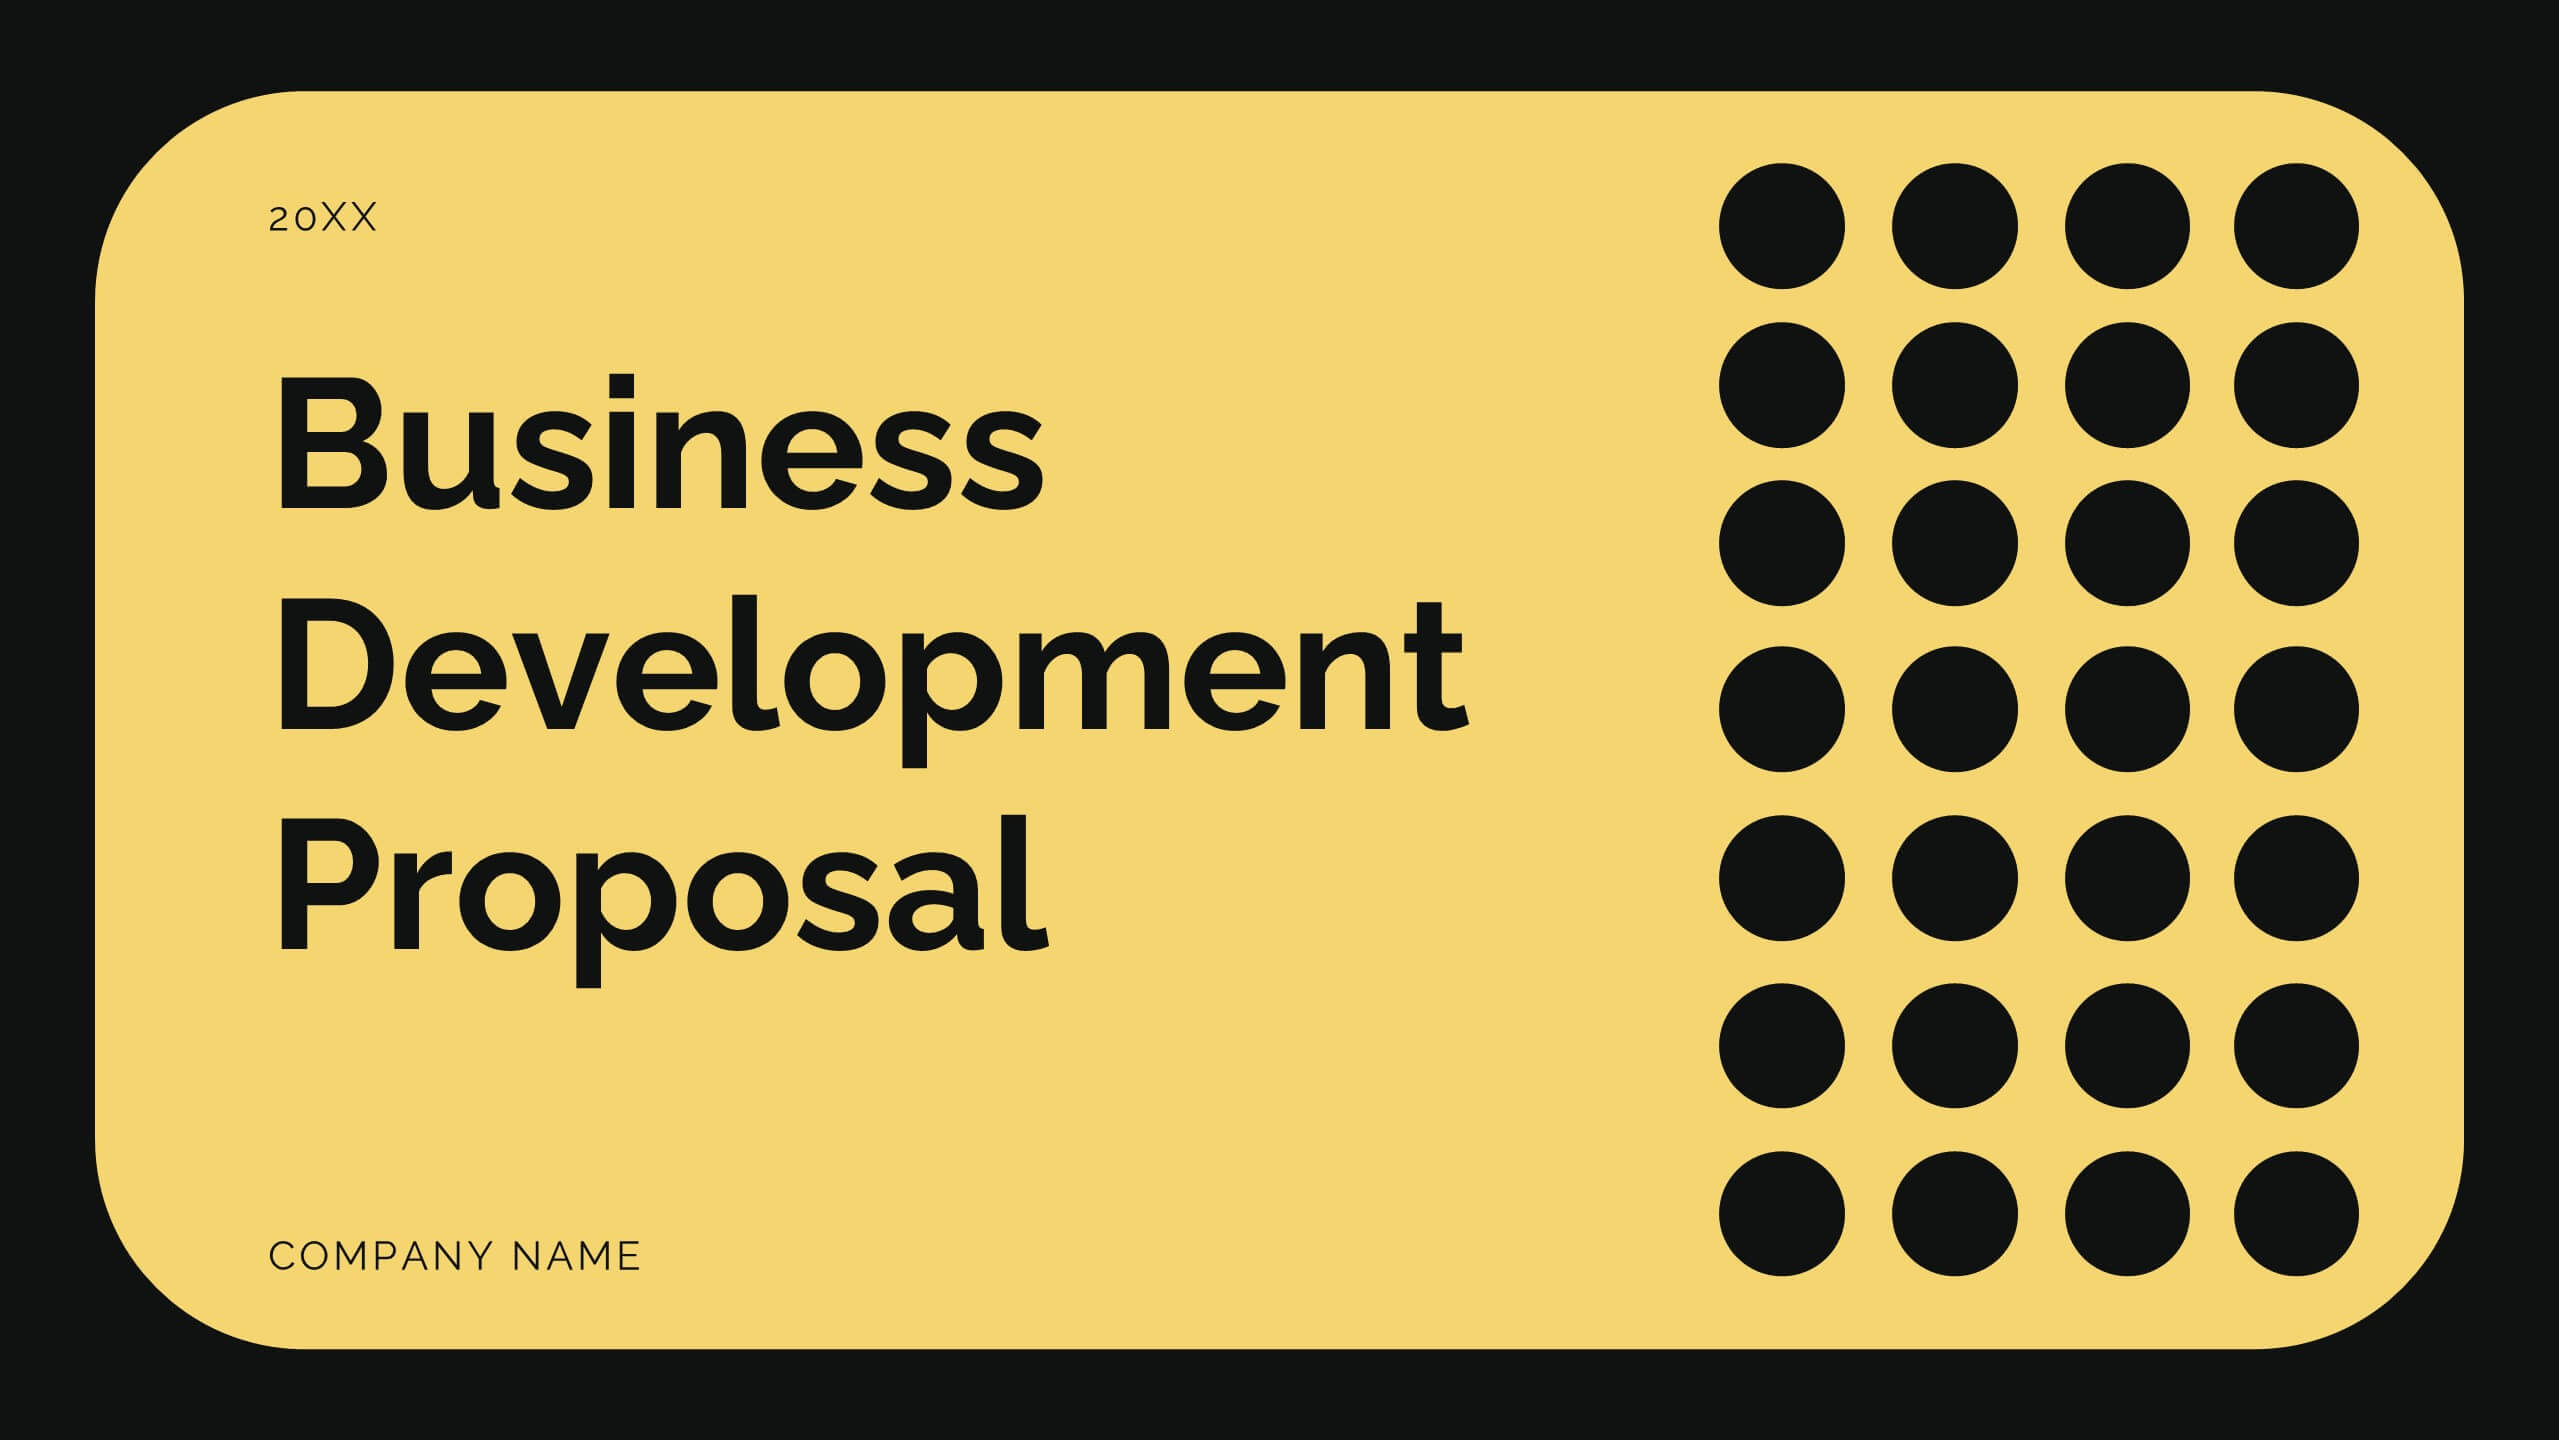
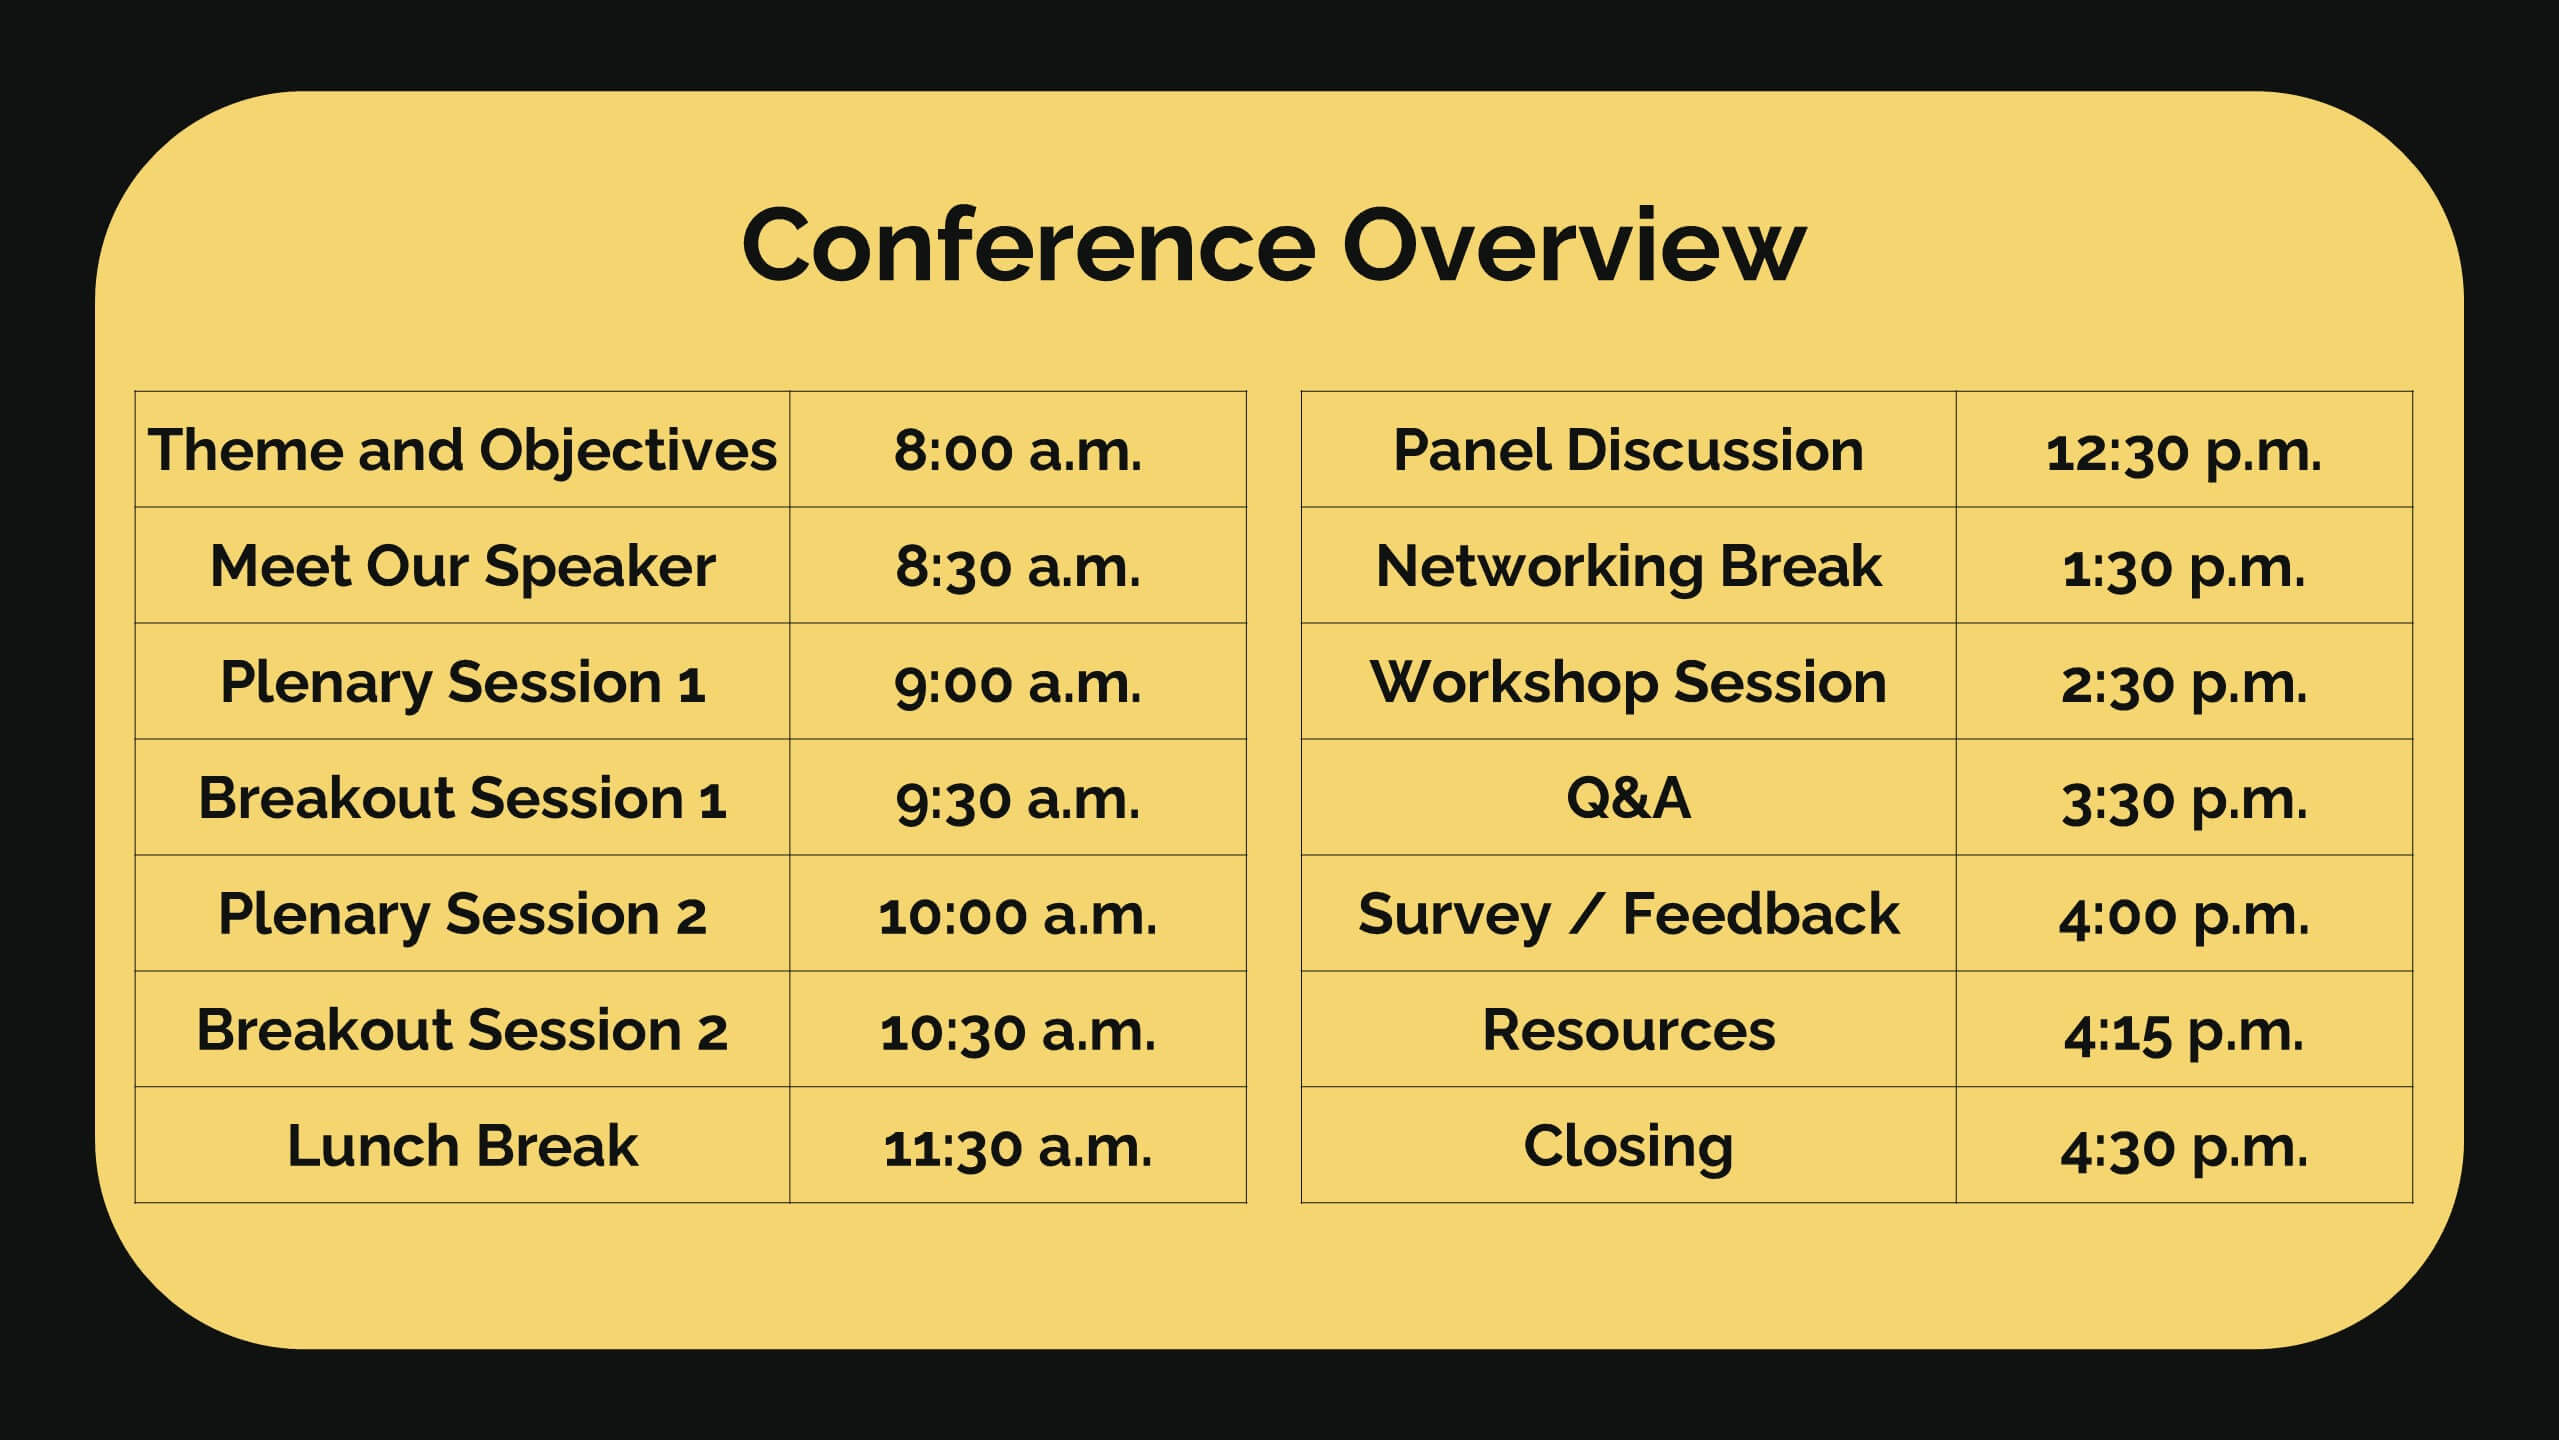
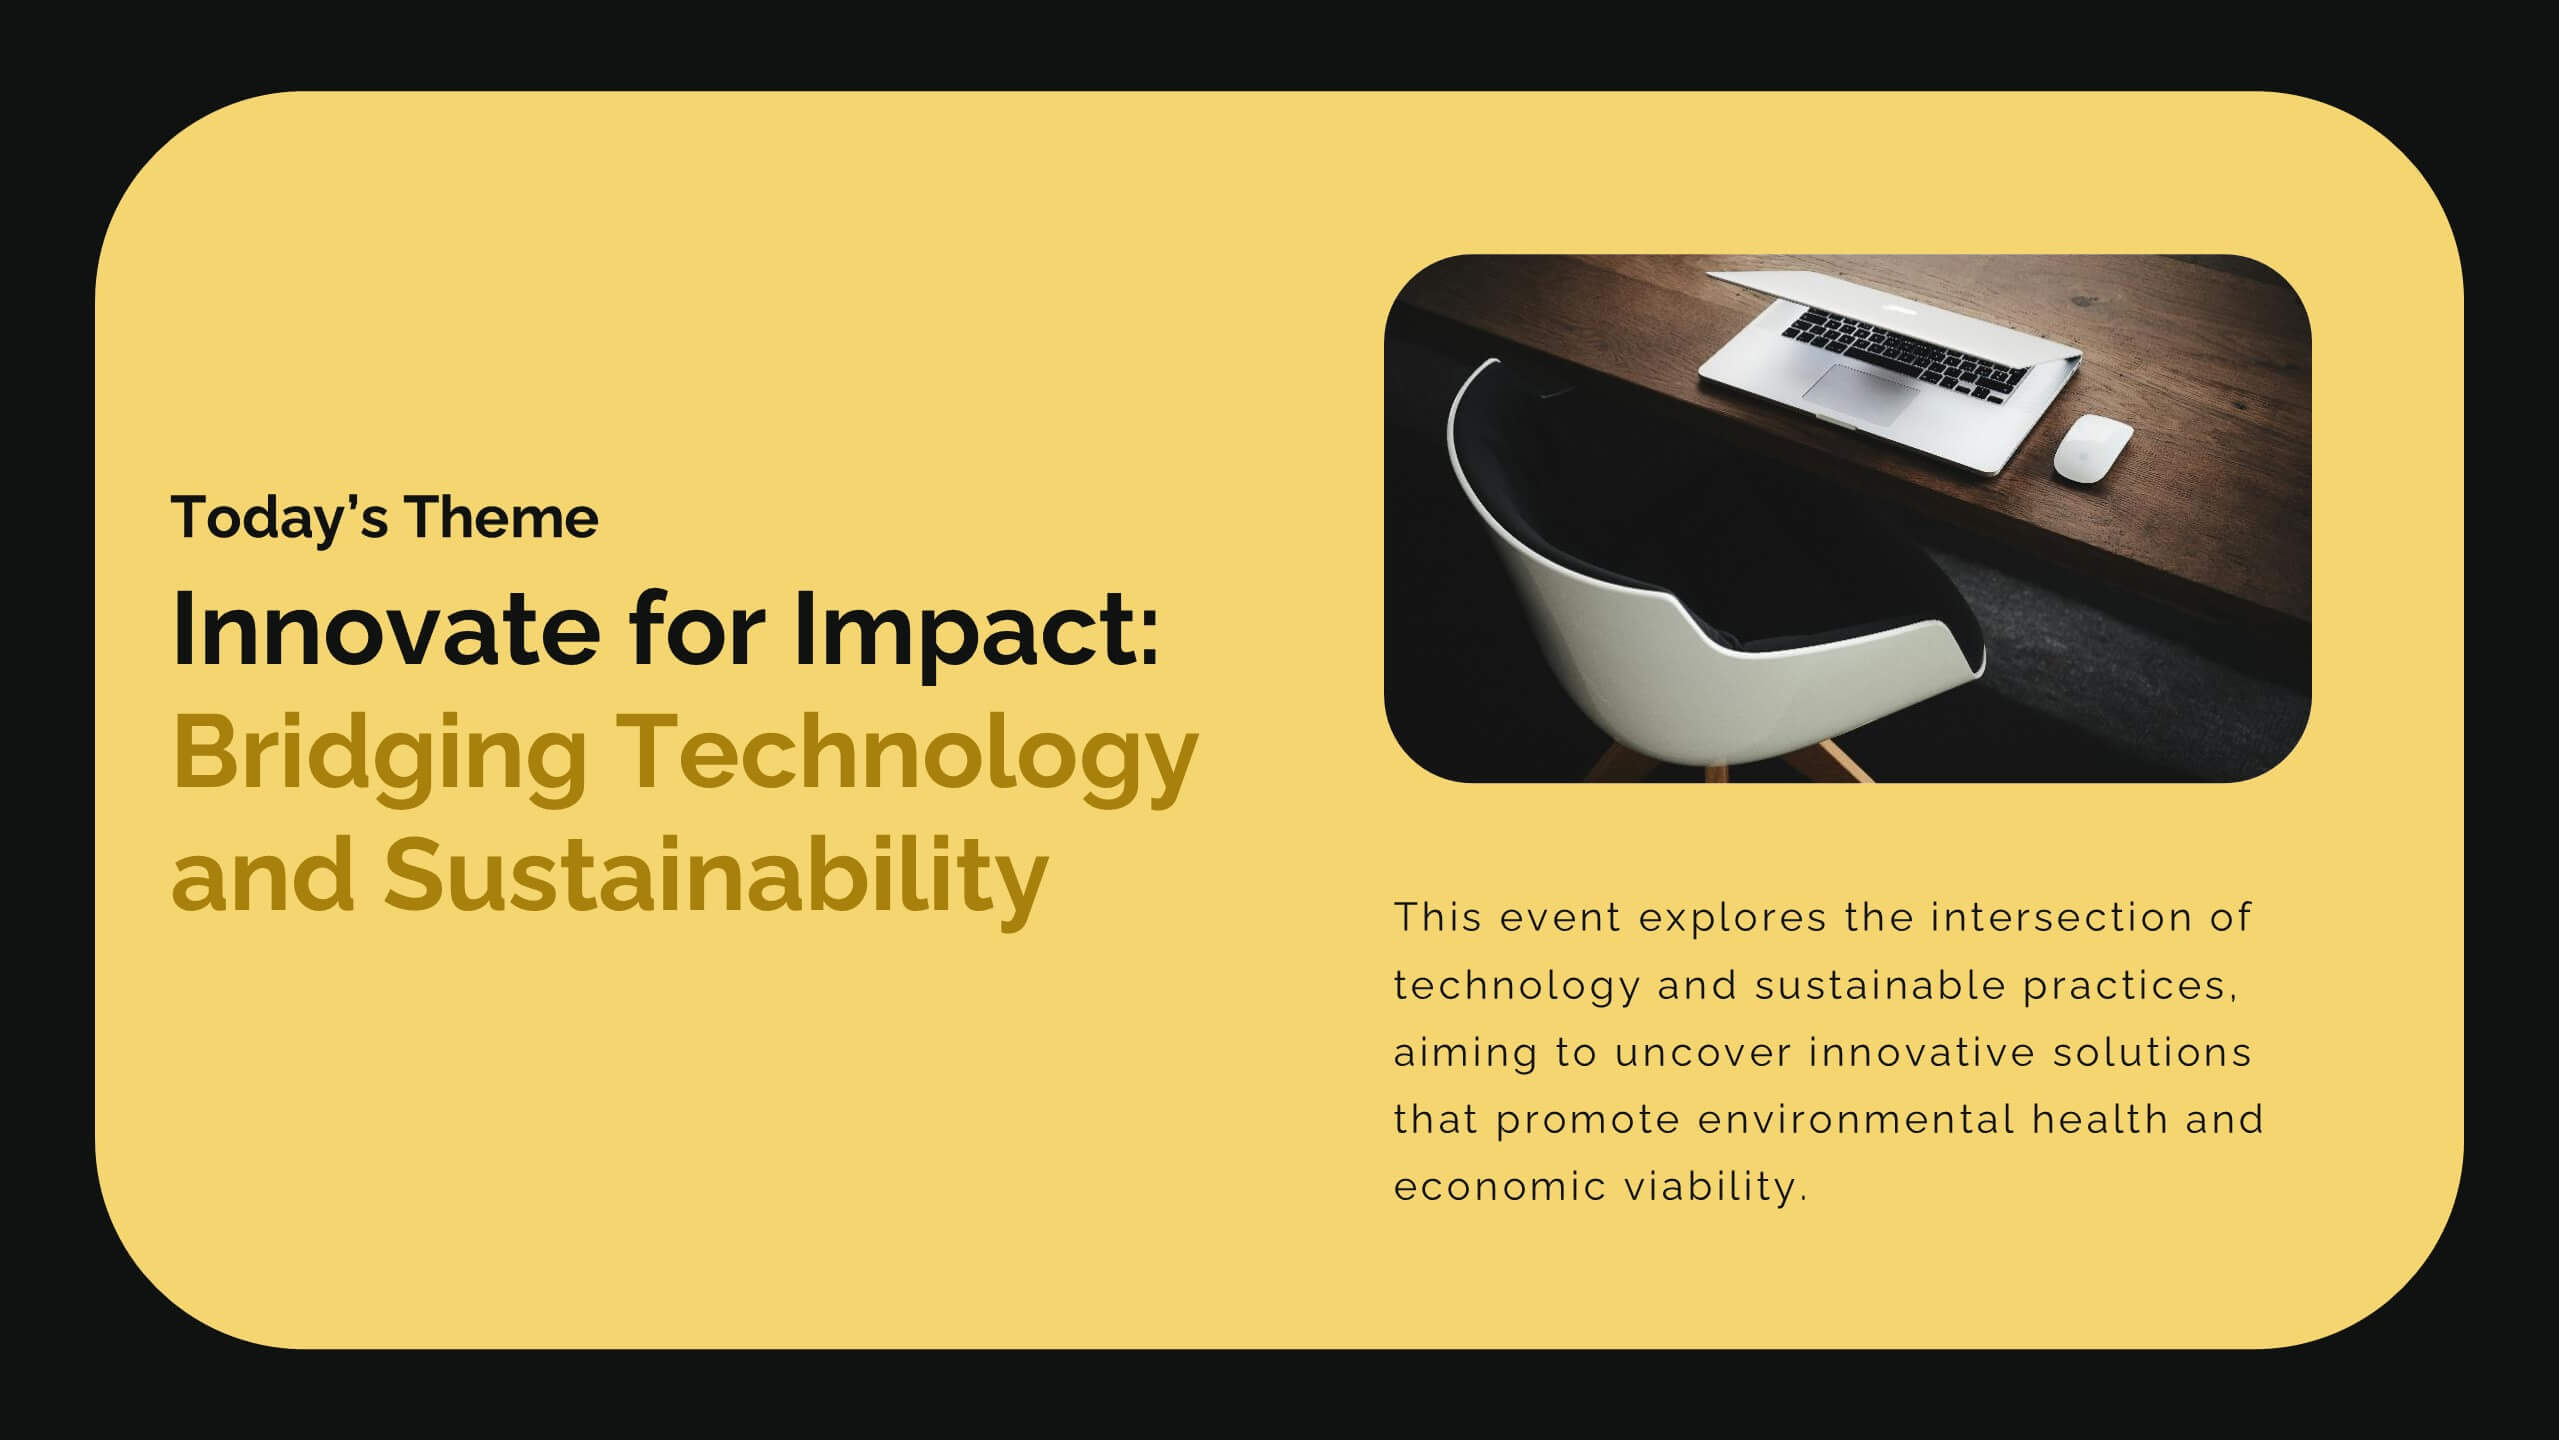
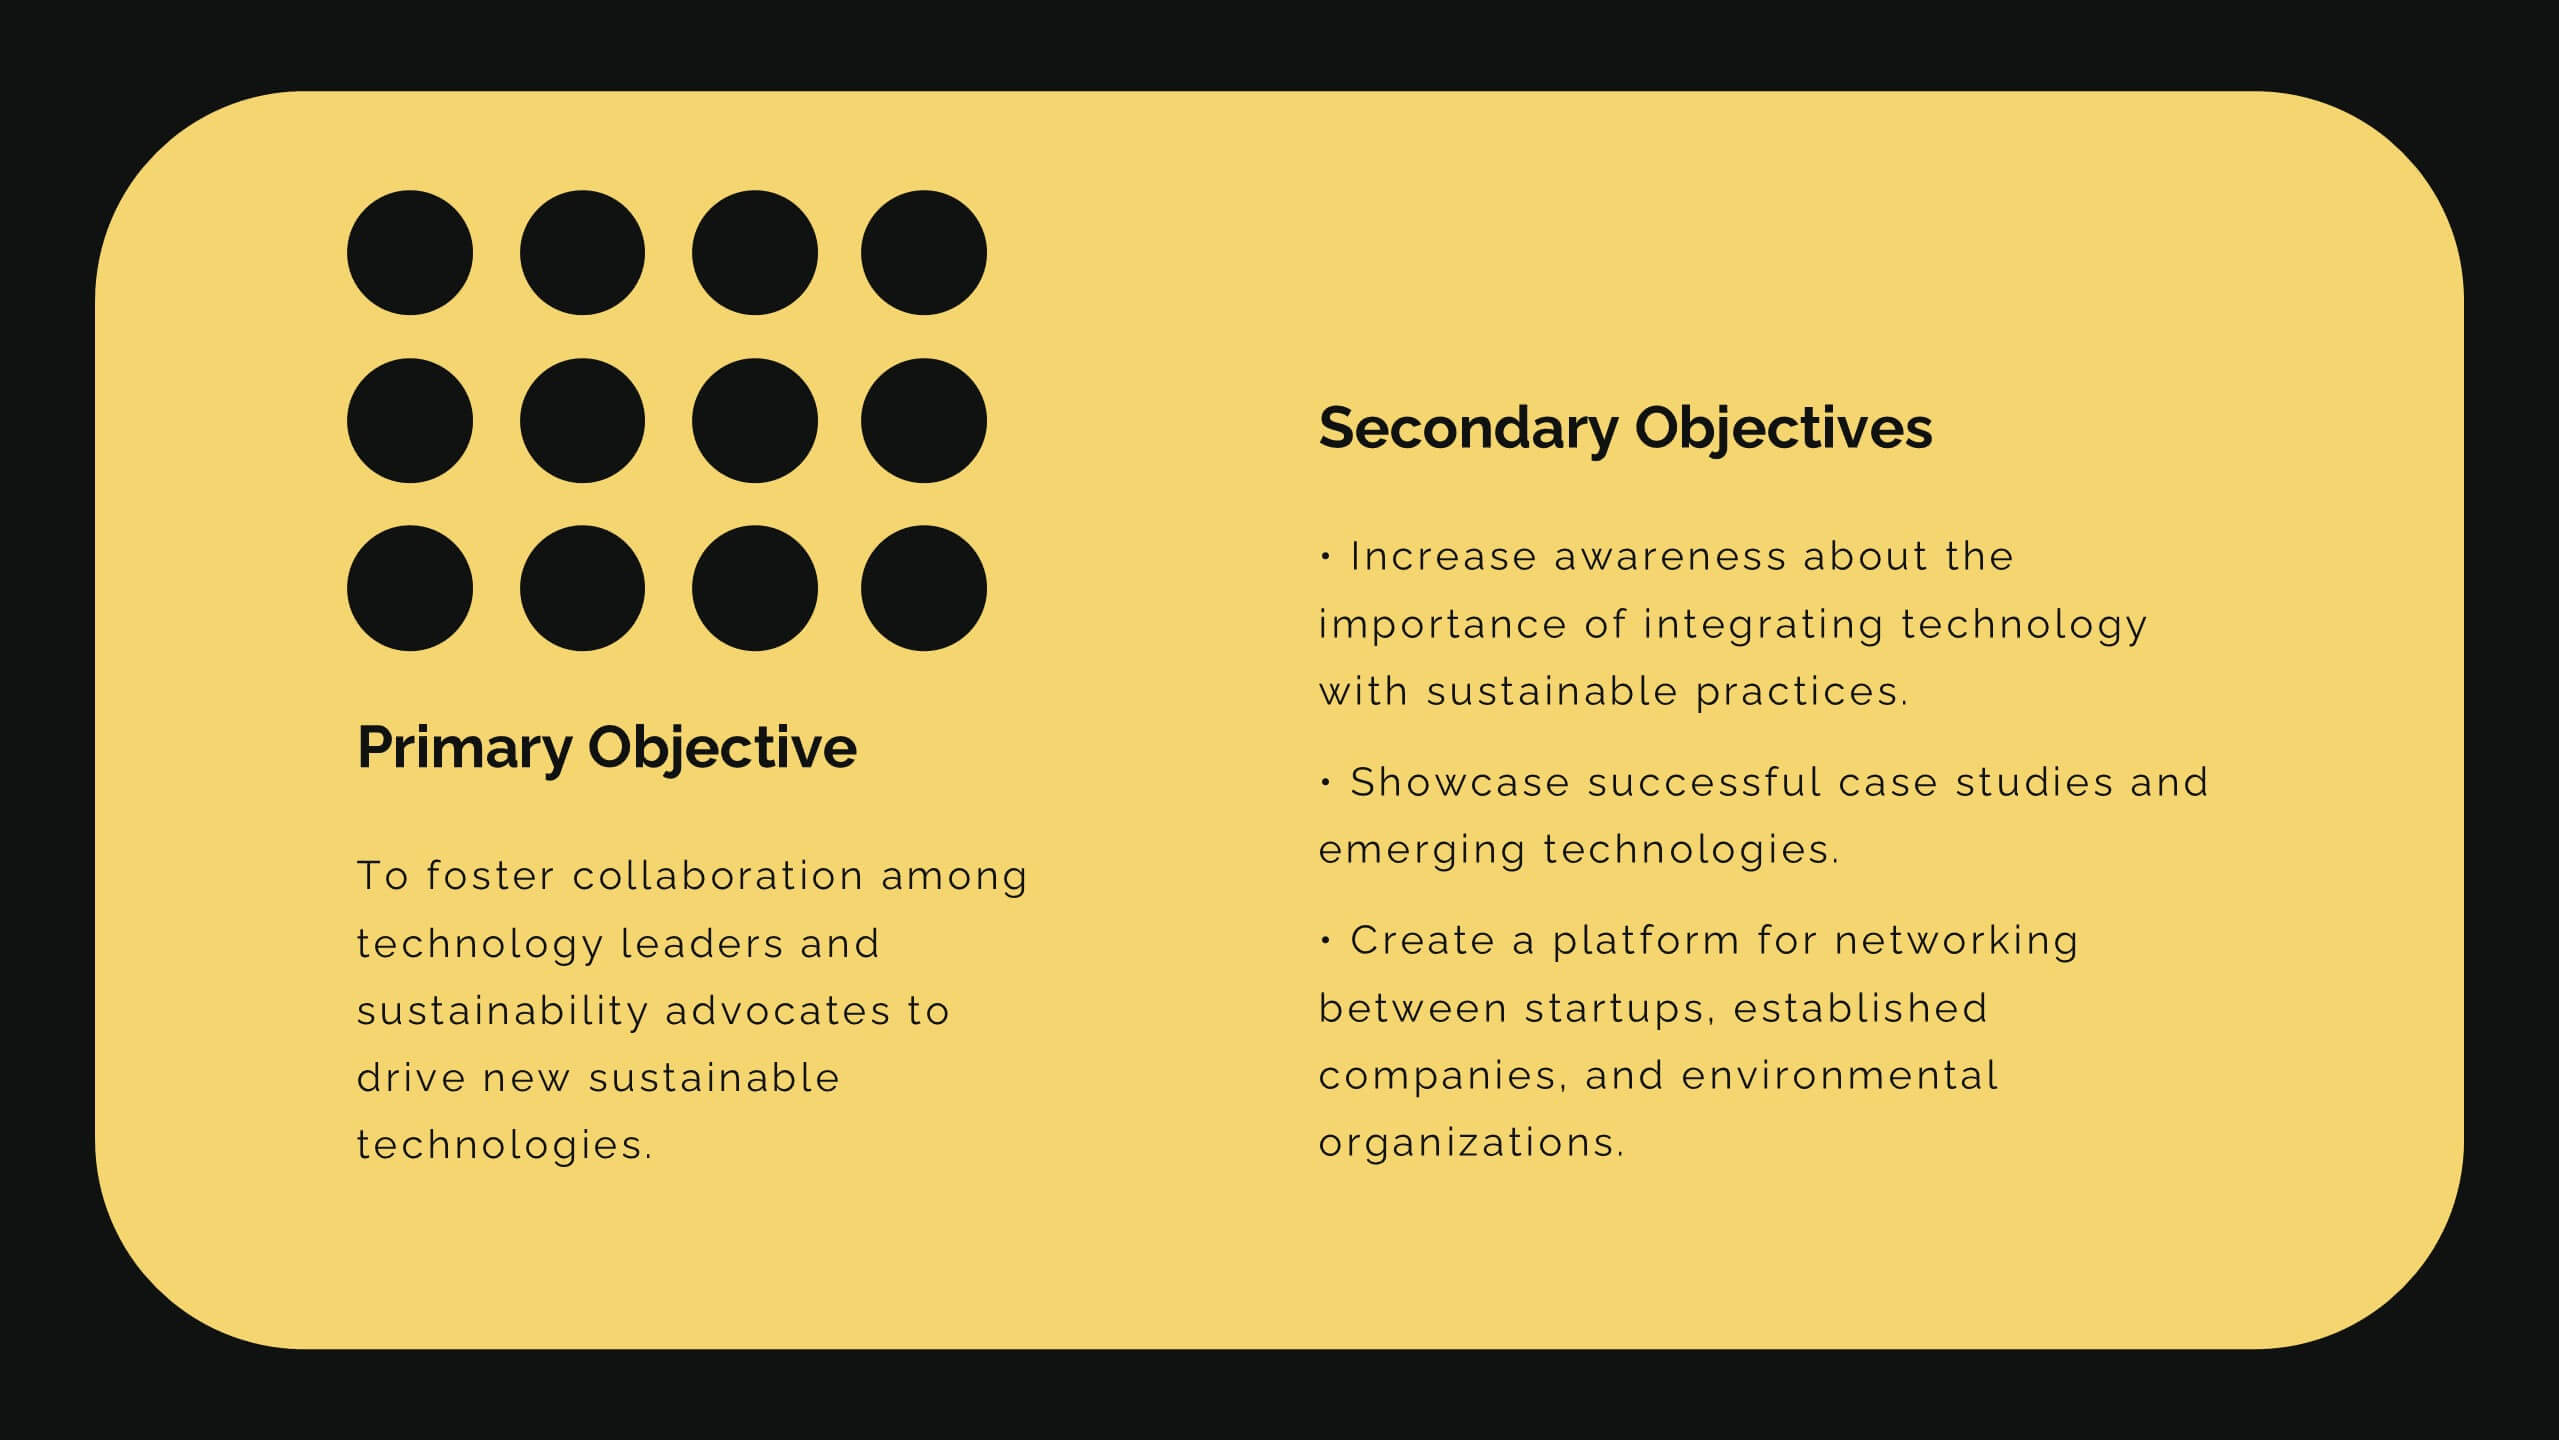
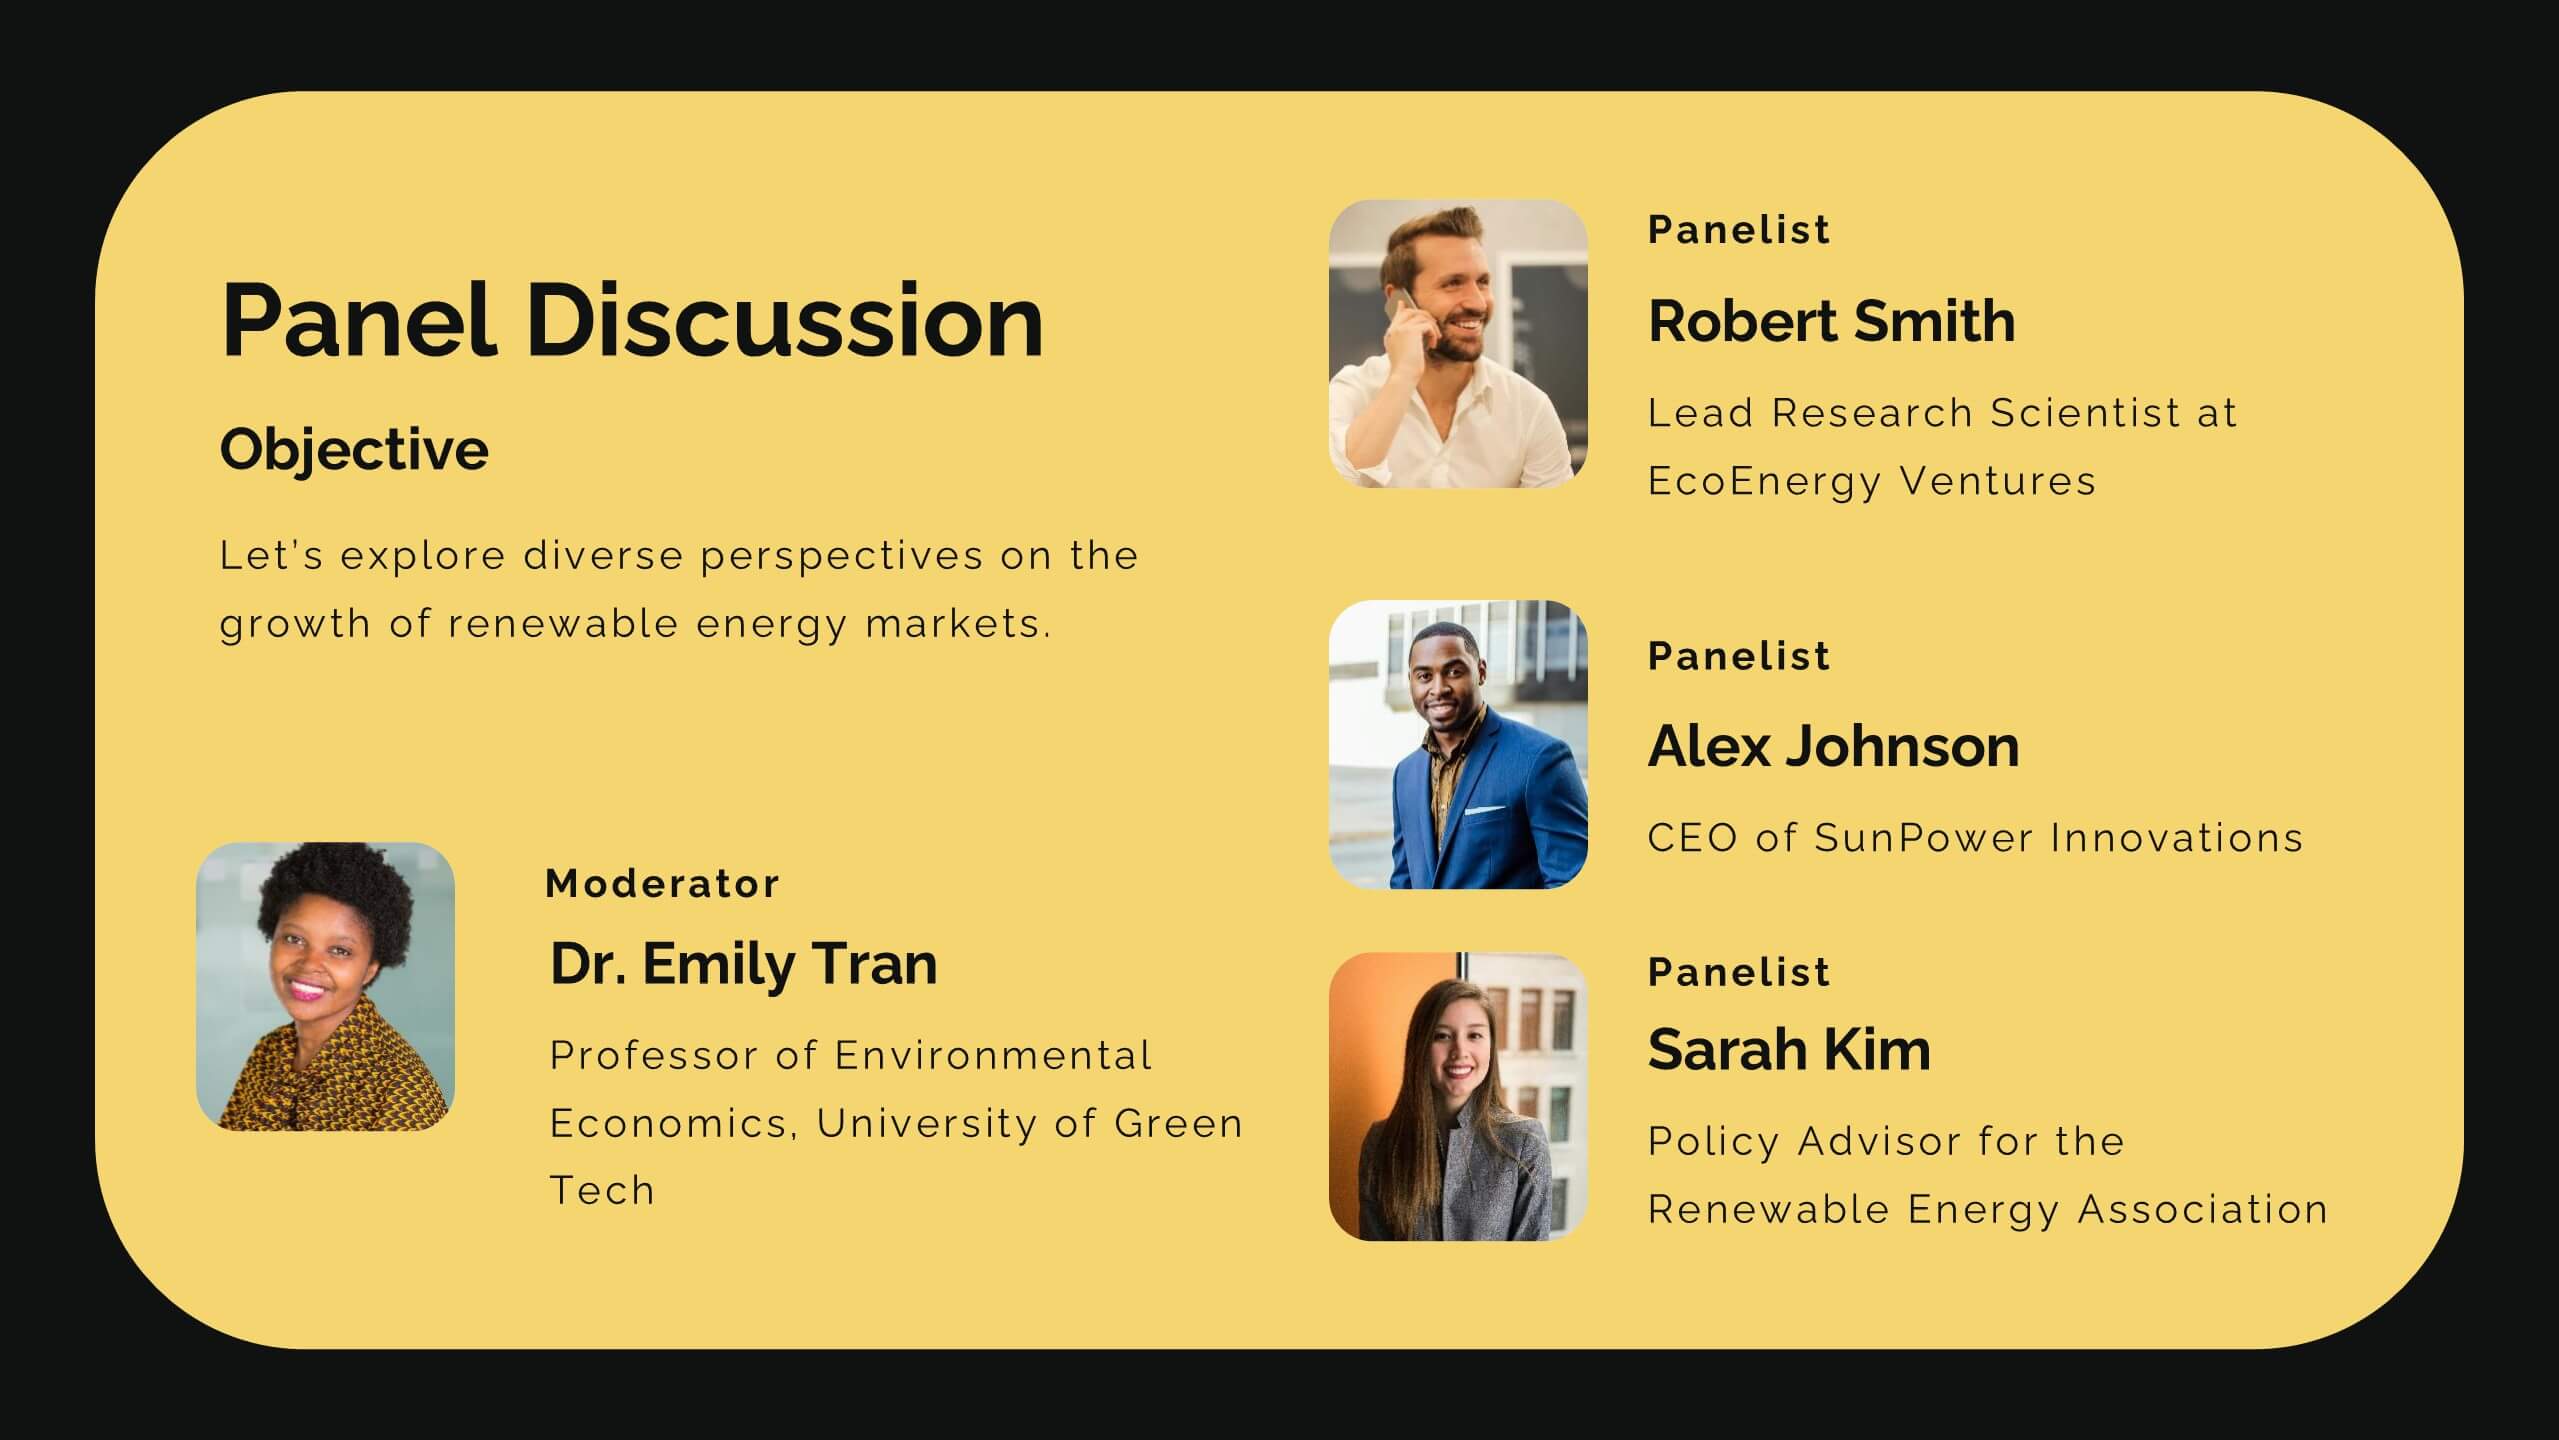
Diamond Business Development Proposal Presentation
Unlock the potential of your business proposals with this bold and engaging presentation template! Perfect for business development pitches, conferences, and workshops, it includes sections for speaker introductions, panel discussions, and session breakdowns. With its clean and professional design, this template ensures clarity and impact. Fully customizable and compatible with PowerPoint, Keynote, and Google Slides.


4 diapositivas
Financial KPI Analysis Presentation
Present key financial metrics with clarity using the Financial KPI Analysis slide. This layout highlights four essential indicators—MRR, Customer Count, Gross Profit Margin, and NPM—each with colorful data blocks and corresponding mini charts. A dynamic line graph and column chart provide deeper insight into monthly and categorical performance. Fully editable in PowerPoint, Keynote, and Google Slides for streamlined reporting.


3 diapositivas
Project Proposal Executive Summary
Summarize your project proposal with clarity and visual appeal using this clean executive slide. Highlight key metrics, growth indicators, and progress updates alongside a modern photo layout that keeps your audience engaged. This template is fully customizable and compatible with PowerPoint, Keynote, and Google Slides for easy, polished presentations.