


Características


¿Tienes alguna pregunta?
Recomendar


5 diapositivas
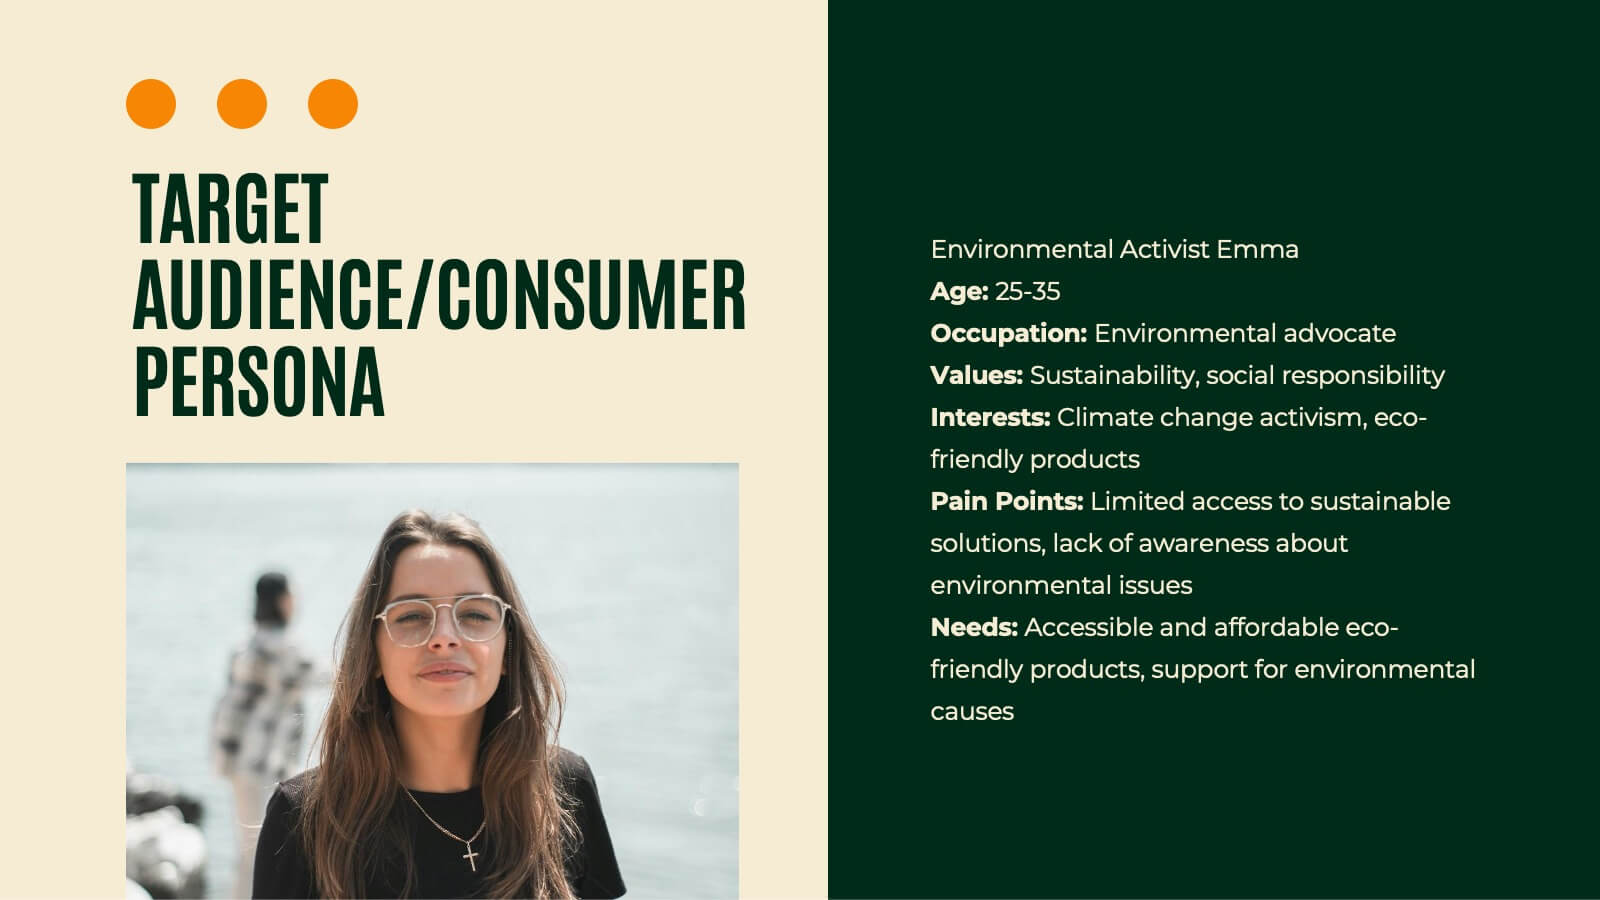
Target Audience Demographics
Present gender-based audience insights with this clean, dual-bar infographic slide. Ideal for showing comparative statistics between men and women across five demographic categories. Use this layout to support marketing analysis, campaign targeting, or consumer behavior reports. Editable in PowerPoint, Keynote, and Google Slides.


5 diapositivas
Messaging Strategy and Flow Presentation
Communicate with clarity using this streamlined messaging strategy and flow presentation template. Designed to visualize the stages of message planning—from audience segmentation to final delivery—this layout helps teams align communication goals and channels. Ideal for marketing, PR, or internal comms presentations. Fully compatible with PowerPoint, Keynote, and Google Slides.


26 diapositivas
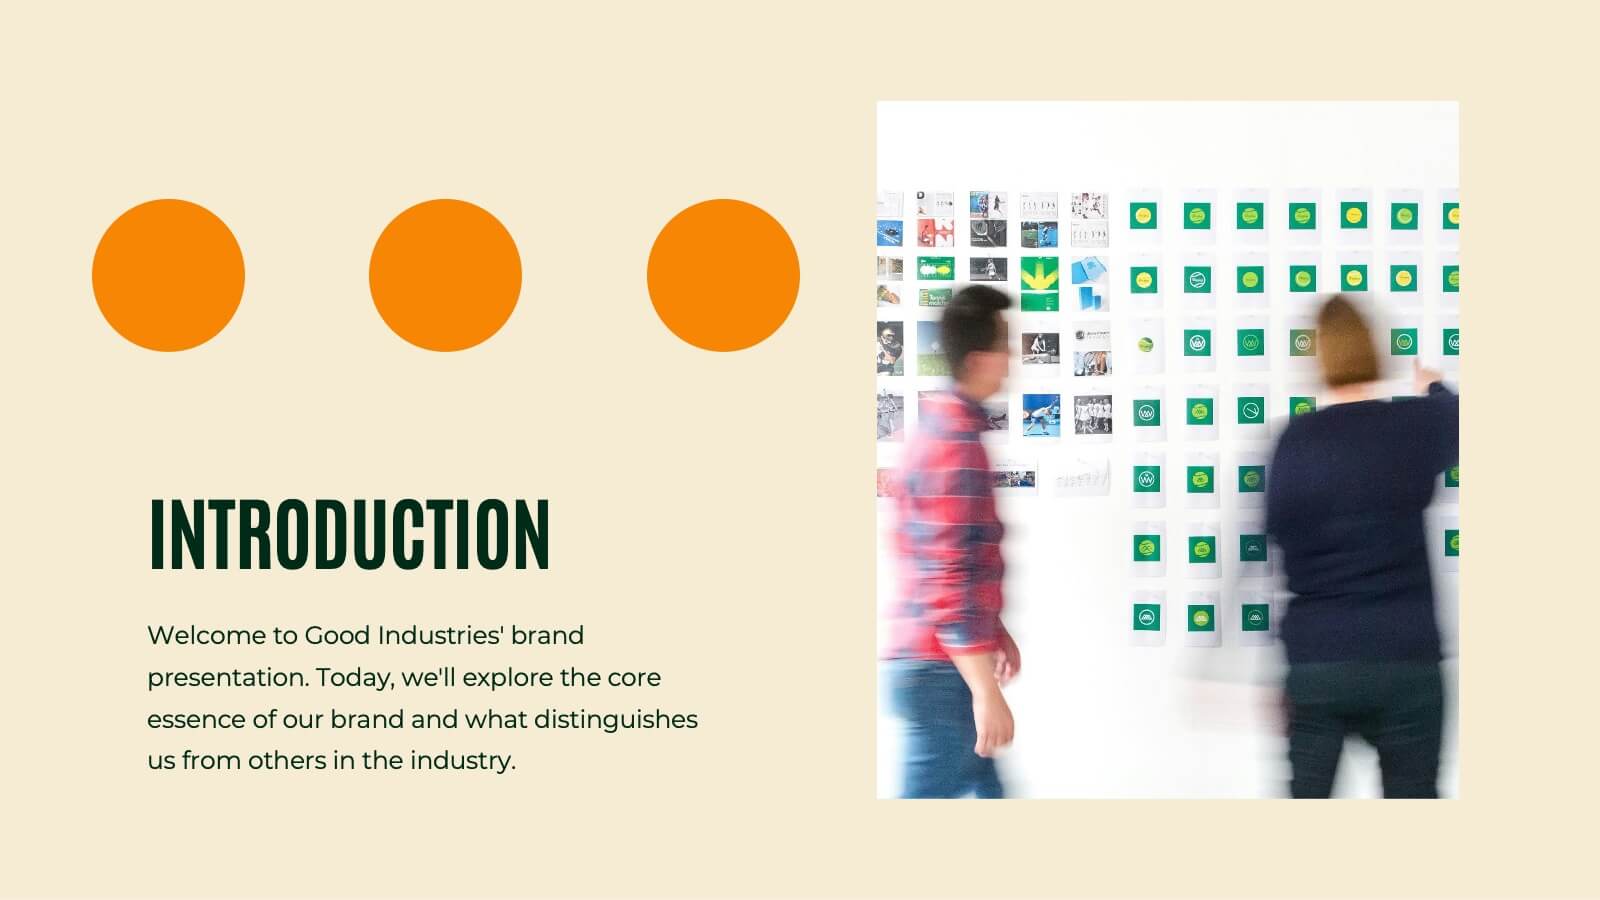
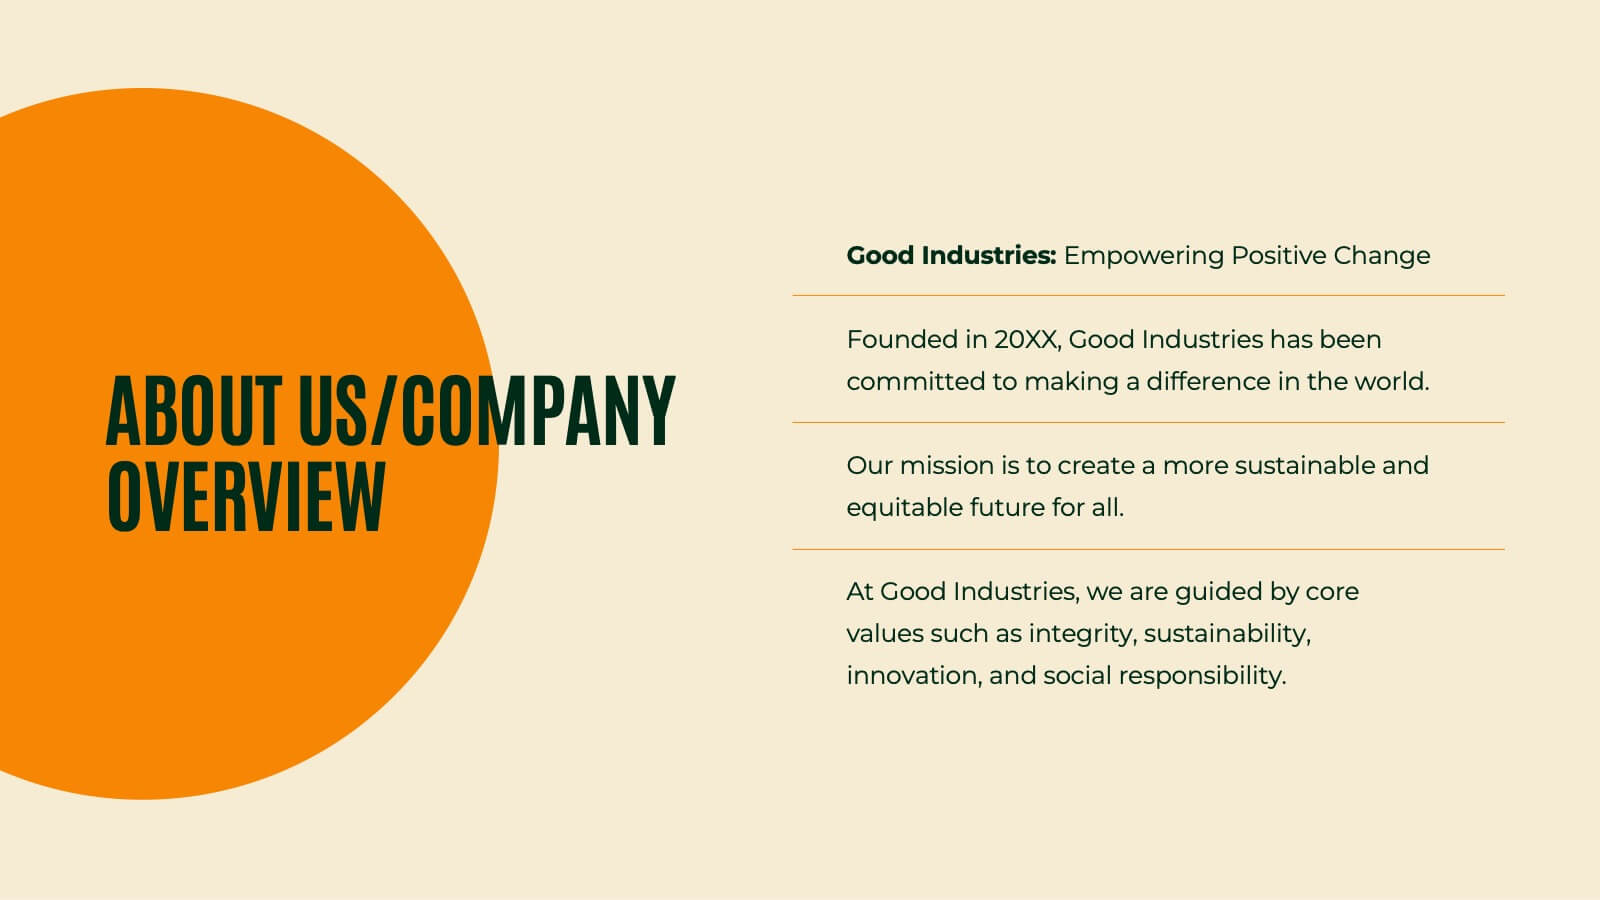
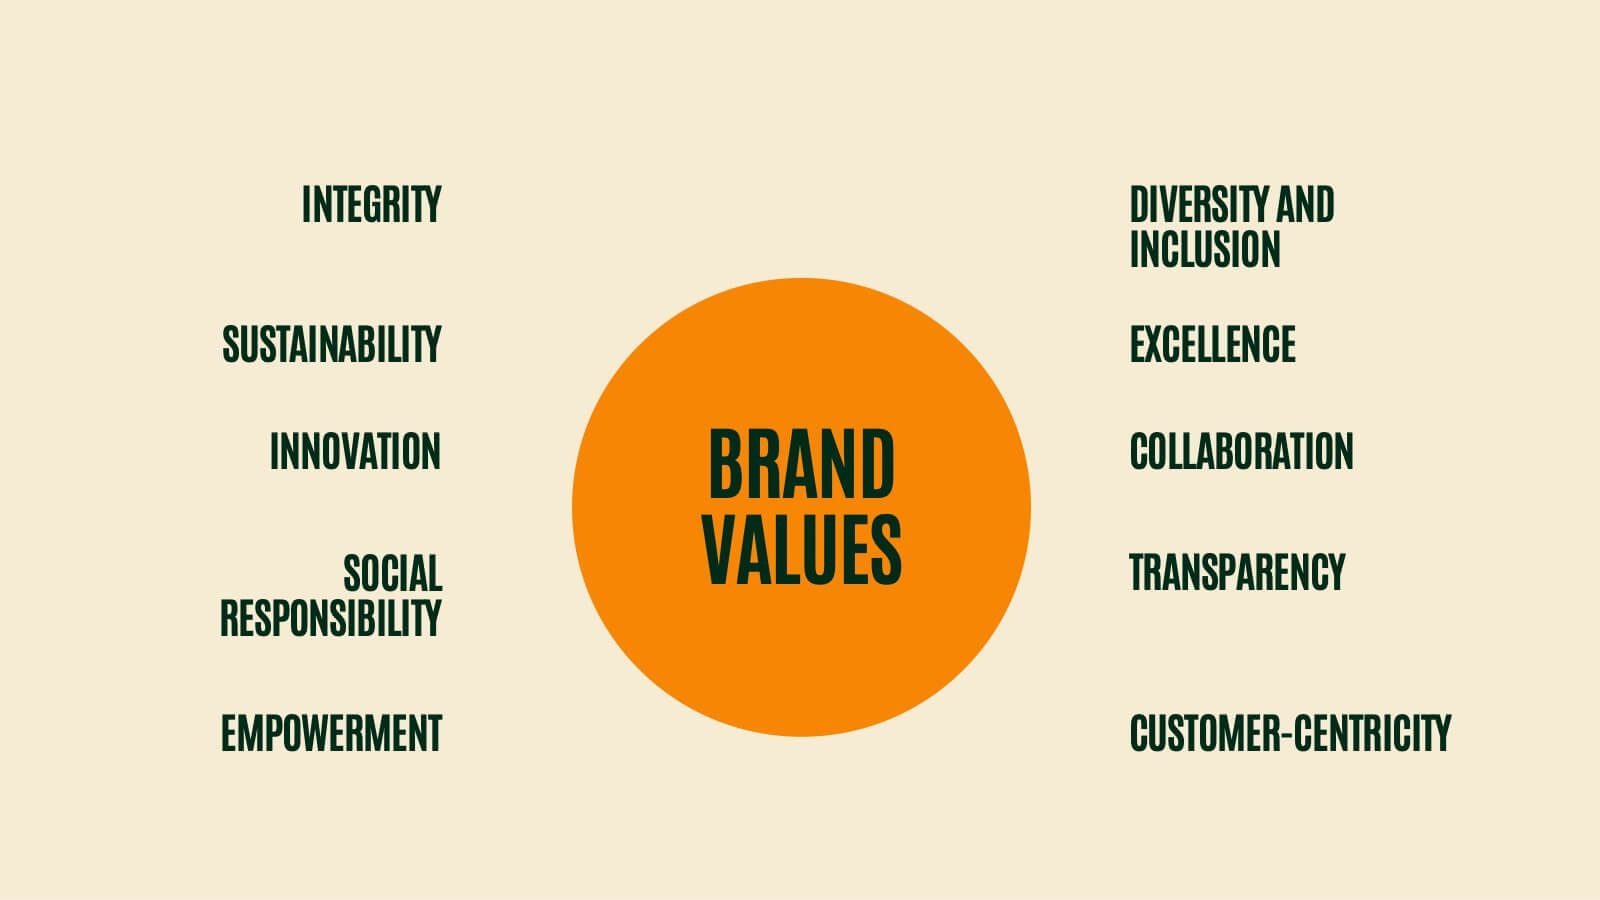
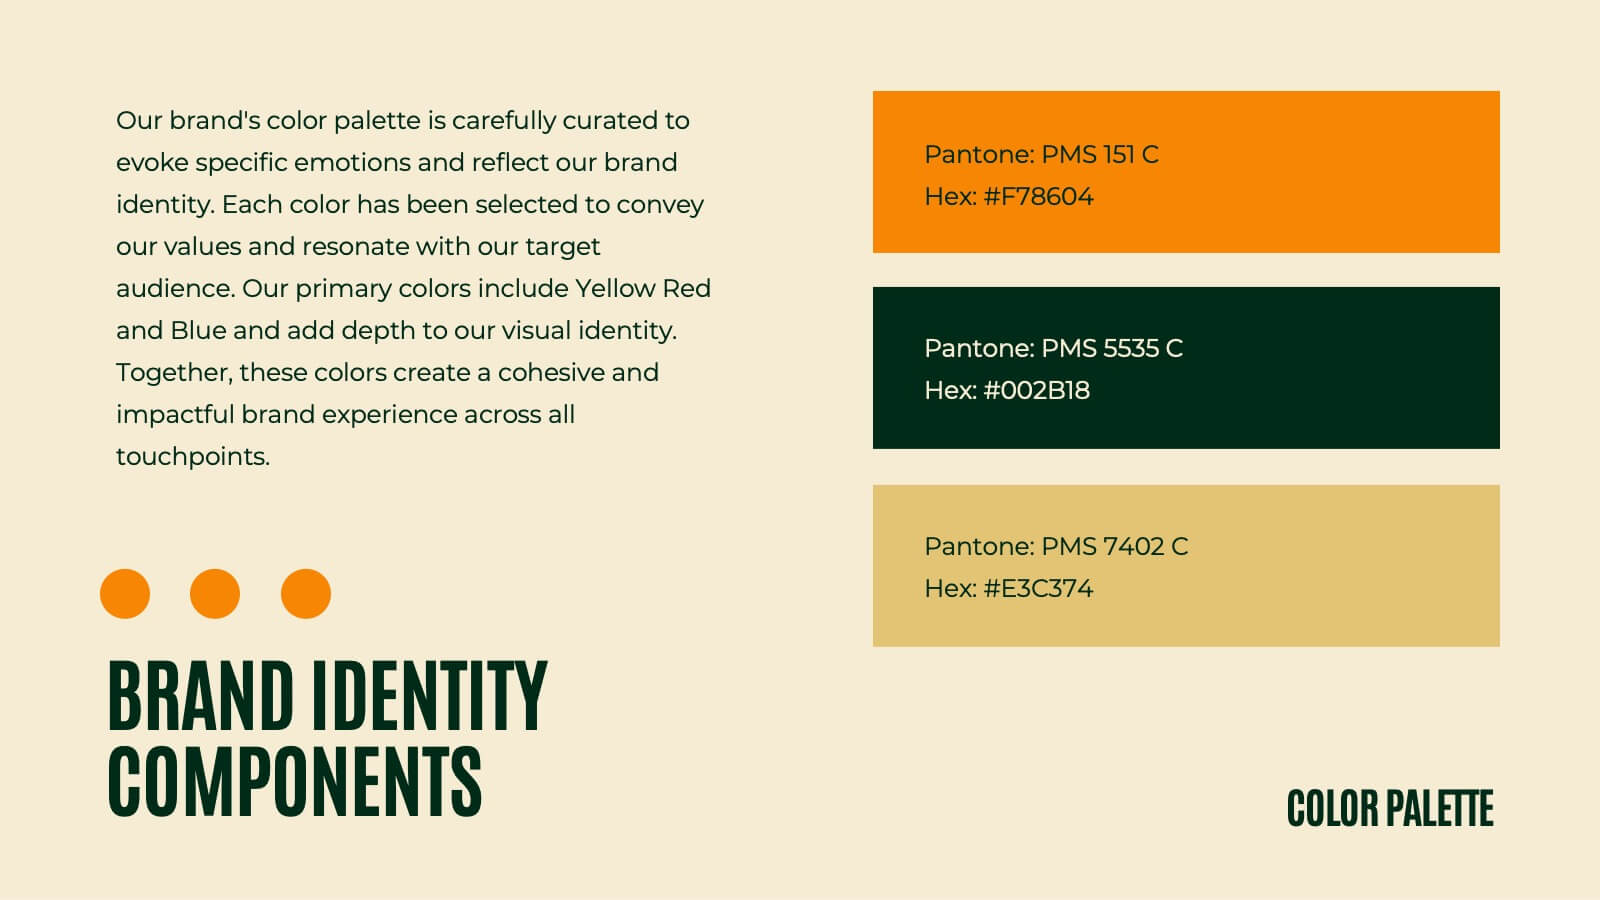
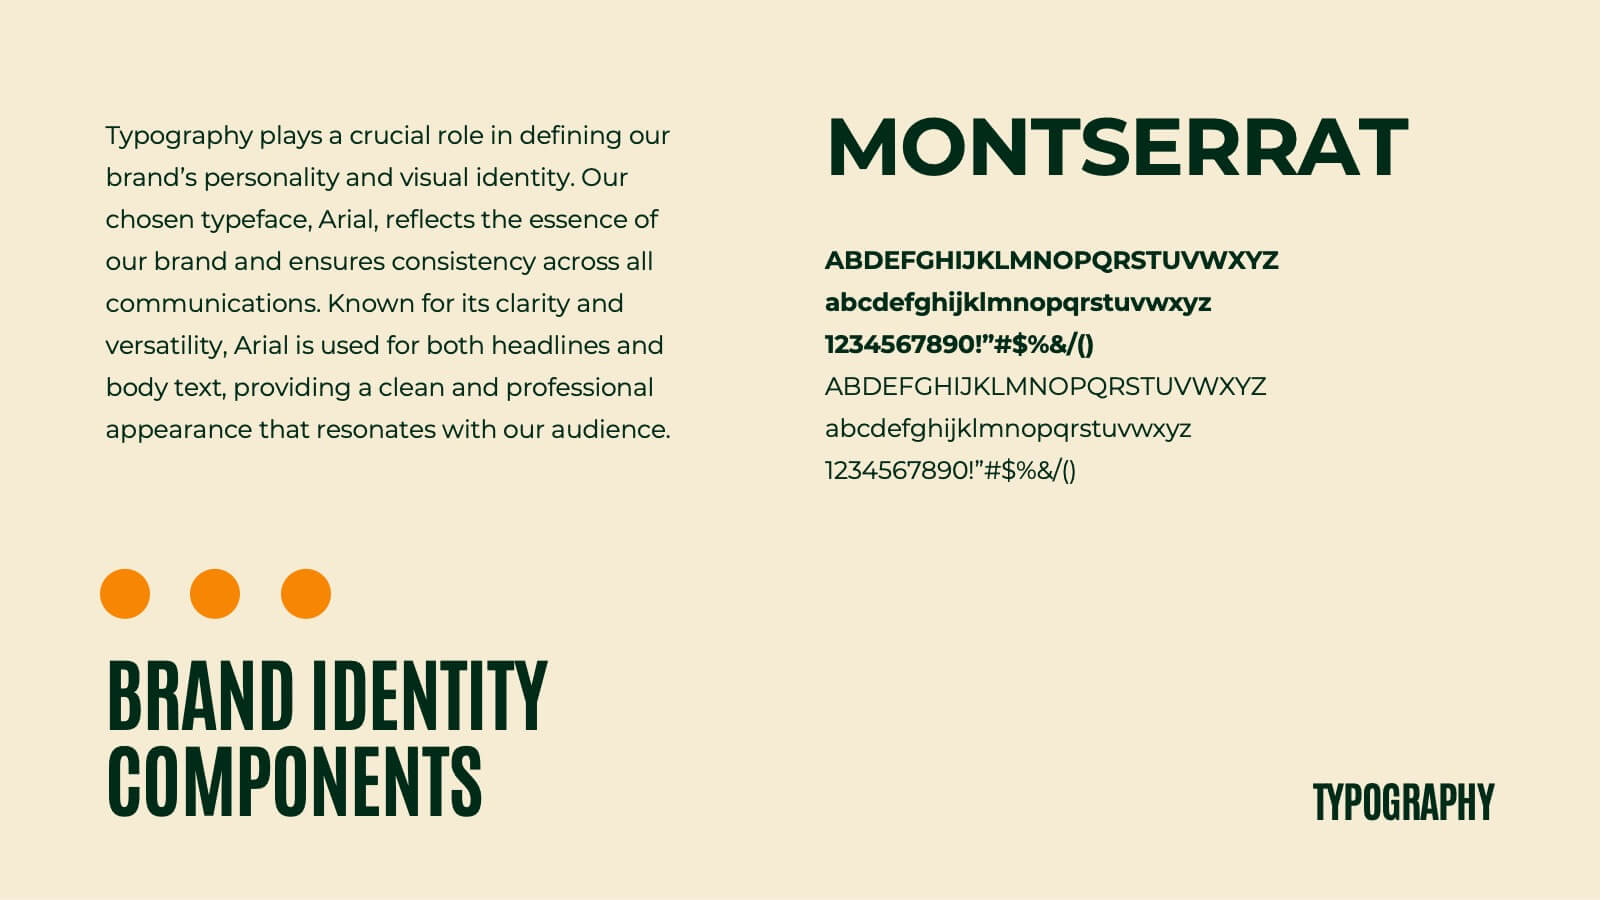
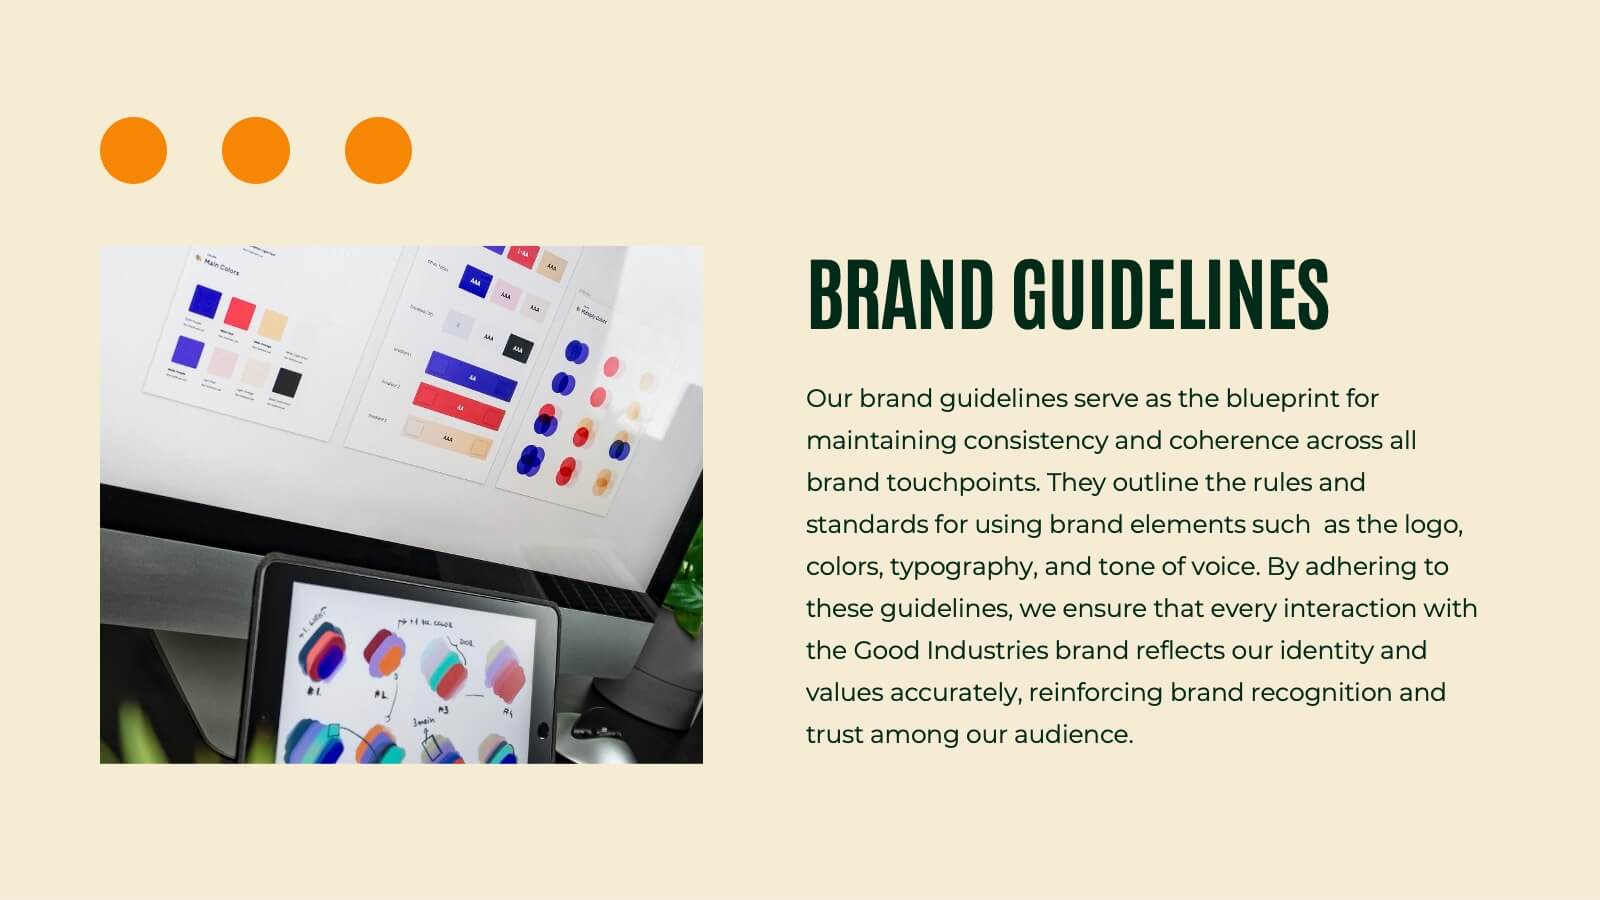
Griffin Rebranding Project Plan Presentation
Unleash the power of branding with this vibrant presentation template! This tool guides you through essential brand elements like identity, voice, and strategy. Perfect for marketers and brand managers aiming to make a memorable impact. Compatible with PowerPoint, Keynote, and Google Slides, it's a must-have for any branding project.


6 diapositivas
Business Mission Statement Presentation
Here is a vivid "Business Mission Statement" presentation template tailored to elucidate your company's core objectives and strategic goals. This template features a unique brain-design interface that symbolizes thought leadership and innovative thinking, ideal for sharing insights that resonate deeply with your team or stakeholders. Compatible with PowerPoint, Keynote, and Google Slides, it's the perfect tool for broadcasting your mission with clarity and impact.


7 diapositivas
Geometric Infographic Presentation Template
Our Geometric Infographic template will help you quickly create an original, beautiful and professional presentation with charts and diagrams of any kind. The template includes fully editable slides with a number of built-in shapes, as well as transitions. You can use the template for any kind of presentation involving geometrics. It’s ideal for product presentations and market analysis, but you can also use it to showcase your business case. This geometric Infographic template is a great way to present a large amount of information to an audience and features a clean and modern design!


26 diapositivas
Austin Presentation Template
Sports photography captures the essence of sports and its participants by conveying a strong image. The photographer needs to carefully plan the timing of taking these photos. The Austin Template is perfect for displaying information about your products and services. Vivid and bold colors draw your audience's attention, while the creative sections provide all the relevant details. With an appealing layout and stylish design, you can present yourself in the best light possible. This template will give your site the professional look it deserves, and be sure to stand out to your clients.


7 diapositivas
Summary Infographic
This collection of summary slides is expertly crafted to provide concise and clear overviews of complex information, making it ideal for concluding presentations, meetings, or reports. Each slide features a distinctive design with a strong focus on structure and readability, employing a balanced use of space and typography to highlight key points effectively. The slides utilize varied layouts, including bullet points, diagrams, and flowcharts, allowing for the presentation of summary data in a visually appealing and easily digestible format. These elements are crucial for summarizing the results of discussions, outlining project statuses, or presenting conclusions and next steps in a professional setting. Color coding and iconography are strategically used to categorize information and emphasize important metrics or conclusions, aiding in quick comprehension. This set is invaluable for professionals looking to present executive summaries, project outcomes, or strategic recommendations clearly and effectively, ensuring audiences grasp the essential takeaways without getting lost in details.


5 diapositivas
Detailed Company Plan with Financials Presentation
Present your growth strategy and numbers with this paper-plane-themed Detailed Company Plan with Financials template. The dynamic five-step layout is ideal for narrating a journey from concept to execution, complete with editable titles and icon markers. Ideal for corporate planning, business overviews, or financial strategy. Easy to use in PowerPoint, Keynote, and Google Slides.


6 diapositivas
Revenue Growth Sales Slide Presentation
Showcase your business success with this Revenue Growth Sales Slide Presentation. The upward-curved arrow design highlights five key milestones, each with customizable titles, icons, and color accents. Perfect for illustrating sales performance, growth metrics, or financial forecasts. Easy to edit in PowerPoint, Keynote, or Google Slides—ideal for sales teams, analysts, and executives.


6 diapositivas
International Breast Cancer Day Infographics
Celebrate International Breast Cancer Day with our customizable infographic template, designed to raise awareness and share vital information about breast cancer. This template is fully compatible with popular presentation software such as PowerPoint, Keynote, and Google Slides, allowing you to easily personalize it to convey your unique message. The International Breast Cancer Day infographic template serves as a versatile canvas for displaying facts, statistics, prevention methods, and support resources related to breast cancer. Whether you're a healthcare professional, advocate, or someone passionate about promoting breast health, this template offers a user-friendly platform to create informative presentations and awareness materials. Make an impact with this SEO-optimized International Breast Cancer Day infographic template, meticulously crafted for clarity and ease of use. Customize it to share stories of survivors, highlight the importance of early detection, and spread the message of hope and support. Start creating your personalized infographic to contribute to the cause today!


5 diapositivas
Cryptocurrency Market Trends Presentation
Navigate the dynamic world of digital finance with our "Cryptocurrency Market Trends" presentation templates. Perfect for analysts and enthusiasts alike, these templates provide a clear, visual representation of market movements and trends. They are fully compatible with PowerPoint, Keynote, and Google Slides, making them an excellent resource for anyone keen on the pulse of cryptocurrency markets.


6 diapositivas
Project Schedule Timeline Presentation
Plan, track, and showcase progress with this sleek timeline layout designed to visualize every milestone with clarity. Ideal for organizing project phases, deadlines, or deliverables, it helps communicate workflows efficiently and professionally. Fully editable and compatible with PowerPoint, Keynote, and Google Slides for easy customization and seamless presentation design.


6 diapositivas
Corporate Responsibility Sustainability Plan Presentation
Present your sustainability vision with the Corporate Responsibility Sustainability Plan Presentation. Designed around a tree-themed layout, this infographic highlights six key initiatives—perfect for showcasing environmental, social, and governance (ESG) efforts. Ideal for CSR reports, strategy decks, or stakeholder presentations. Fully editable in Canva, PowerPoint, Keynote, and Google Slides.


5 diapositivas
Artificial Intelligence Insights Infographics
Embark on an explorative journey into the future with artificial intelligence insights infographics. Set against a visually stimulating backdrop of purple, blue, and white. It's designed for innovators, educators, and students who strive to understand and communicate the multifaceted impacts of AI in various sectors. By encapsulating trends, innovations, and challenges, these infographics are perfect for presentations, educational materials, or online content. The creative use of graphics and icons, ensures each segment of information is not only informative but also engaging, bringing clarity to the future shaped by artificial intelligence.


7 diapositivas
Milestones in Project Management Infographic
Showcase the journey of your projects with our Milestones in Project Management Infographic, perfect for project managers, team leaders, and business strategists. This infographic is designed to visually communicate the key achievements and phases of your project timeline. Our infographic allows for a clear depiction of project progress, with markers for each significant milestone achieved. It's an effective tool for reflecting on past successes, current status, and future objectives. With customizable timelines and milestone markers, you can illustrate the path your project has taken, highlight critical deliverables, and forecast upcoming targets. This SEO-friendly infographic is crafted to enhance reports, presentations, and project reviews, making it a valuable asset for stakeholder communication. Employ this infographic to present a cohesive narrative of your project's development, celebrate accomplishments, and maintain momentum towards your project goals.


6 diapositivas
Corporate Health Metrics Dashboard Presentation
Take the pulse of your workplace with this dynamic health dashboard presentation layout. Designed to visualize employee wellness data, activity levels, and corporate health KPIs, this template blends clarity and creativity for impactful reporting. Easily customizable and fully compatible with PowerPoint, Keynote, and Google Slides to fit your presentation needs.


6 diapositivas
Brain Development Infographic
Brain Development refers to the growth, maturation, and organization of the brain throughout an individual's life, starting from early prenatal stages and continuing into adulthood. This infographic template serves as a valuable educational resource for educators, parents, healthcare professionals, and anyone interested in understanding the fascinating process of brain development. This infographic highlights the stages and factors that shape brain growth, to help promote awareness and emphasize the importance of creating supportive environments for brain development. Compatible with Powerpoint, Keynote, and Google Slides.