


Características


¿Tienes alguna pregunta?
Recomendar


4 diapositivas
ABC Learning Slide Deck Presentation
Kickstart your ideas with a playful, rocket-shaped layout that turns simple ABC steps into a clear, engaging story. This presentation helps break down processes, lessons, or concepts in a way that feels intuitive and dynamic. Fully customizable and compatible with PowerPoint, Keynote, and Google Slides.


4 diapositivas
Decision-Making Options Presentation
Make confident choices with the Decision-Making Options template. This structured layout helps visualize various decision paths, making it ideal for strategic planning, leadership discussions, and risk assessment. Fully customizable and designed for clarity, this template works seamlessly with PowerPoint, Keynote, and Google Slides for effortless presentation and collaboration.


22 diapositivas
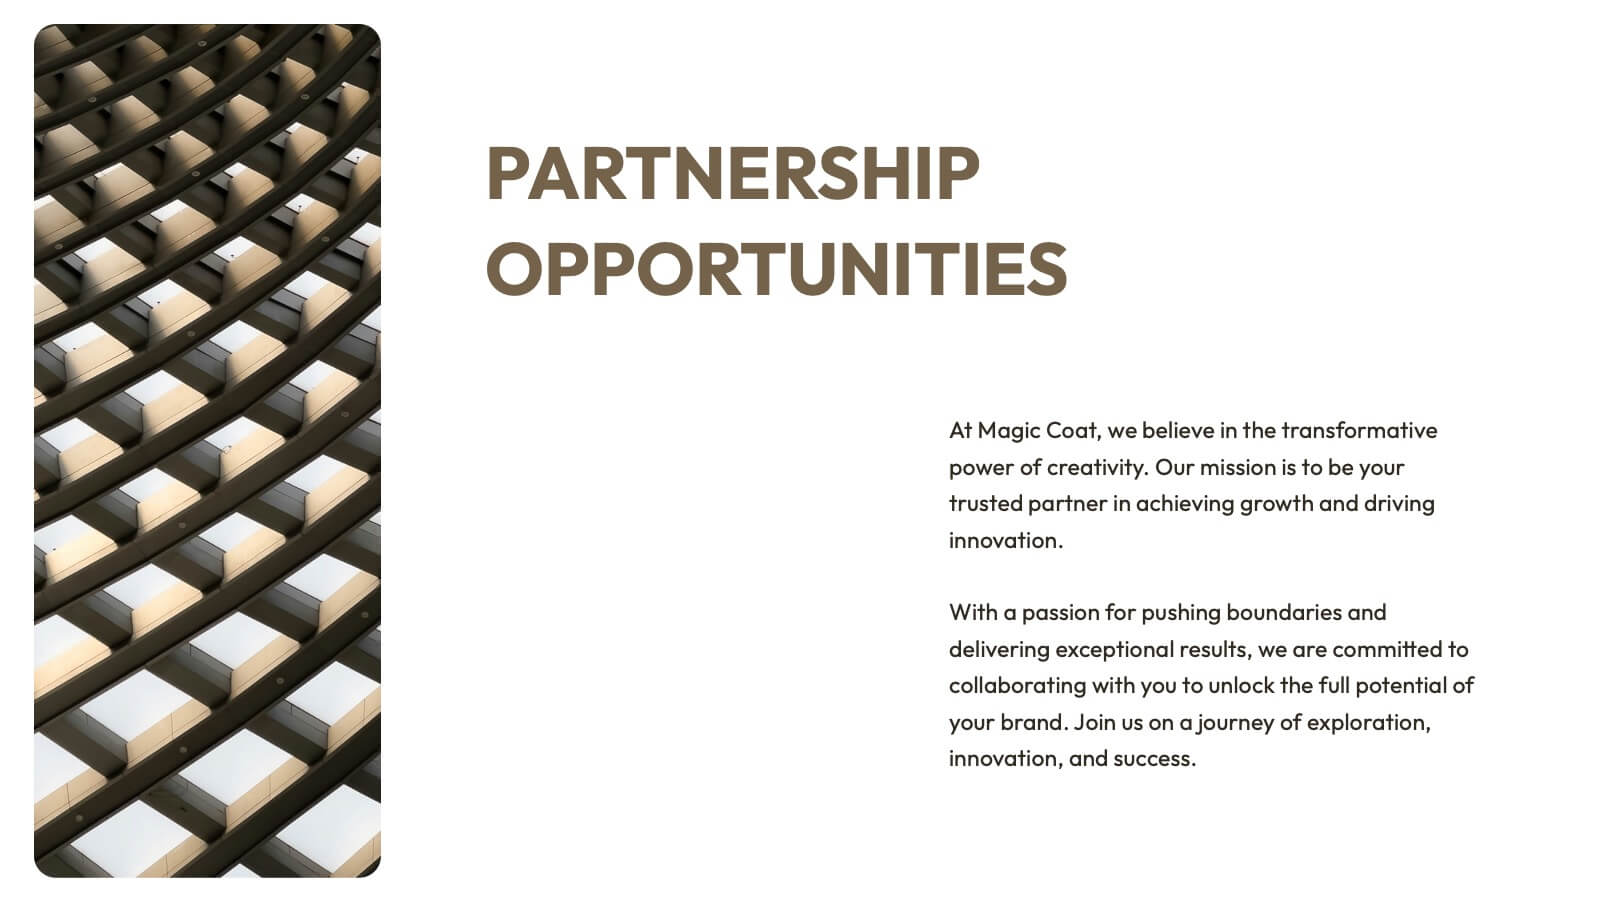
Vivid Creative Agency Pitch Deck Presentation
This sleek creative agency template is ideal for presenting your company's mission, services, and success stories. With a minimalist design, it offers a professional yet stylish approach to showcase case studies, industry trends, and partnership opportunities. It’s perfect for PowerPoint, Keynote, and Google Slides, making your agency stand out with every slide.


7 diapositivas
Gantt Chart Infographic Presentation Template
A Gantt chart is a graphic chart that illustrates the start and finish dates of project activities, and its tasks or events between a start and finish date. The resulting charts are often used to depict the relationship between individual tasks in addition to their dependencies and duration estimates. This Gantt chart template is easy to use, and allows you to adjust start and end dates with a simple drag and drop. This template is designed to help you start organizing your project by identifying tasks and dependencies on those tasks, without overwhelming you with a comprehensive layout.


6 diapositivas
5G Network Infographic
5G, short for fifth-generation wireless technology, is the latest generation of mobile network technology designed to provide faster, more reliable, and higher capacity wireless communication. This infographic template is designed to educate viewers about the key features, benefits, and impact of 5G technology on various aspects of our lives. This template aims to provide a comprehensive and easy-to-understand overview of the transformative capabilities of 5G technology. It serves as a valuable resource for individuals, businesses, and organizations seeking to understand the potential impact and benefits of 5G on various aspects of our lives and the broader technological landscape.

20 diapositivas
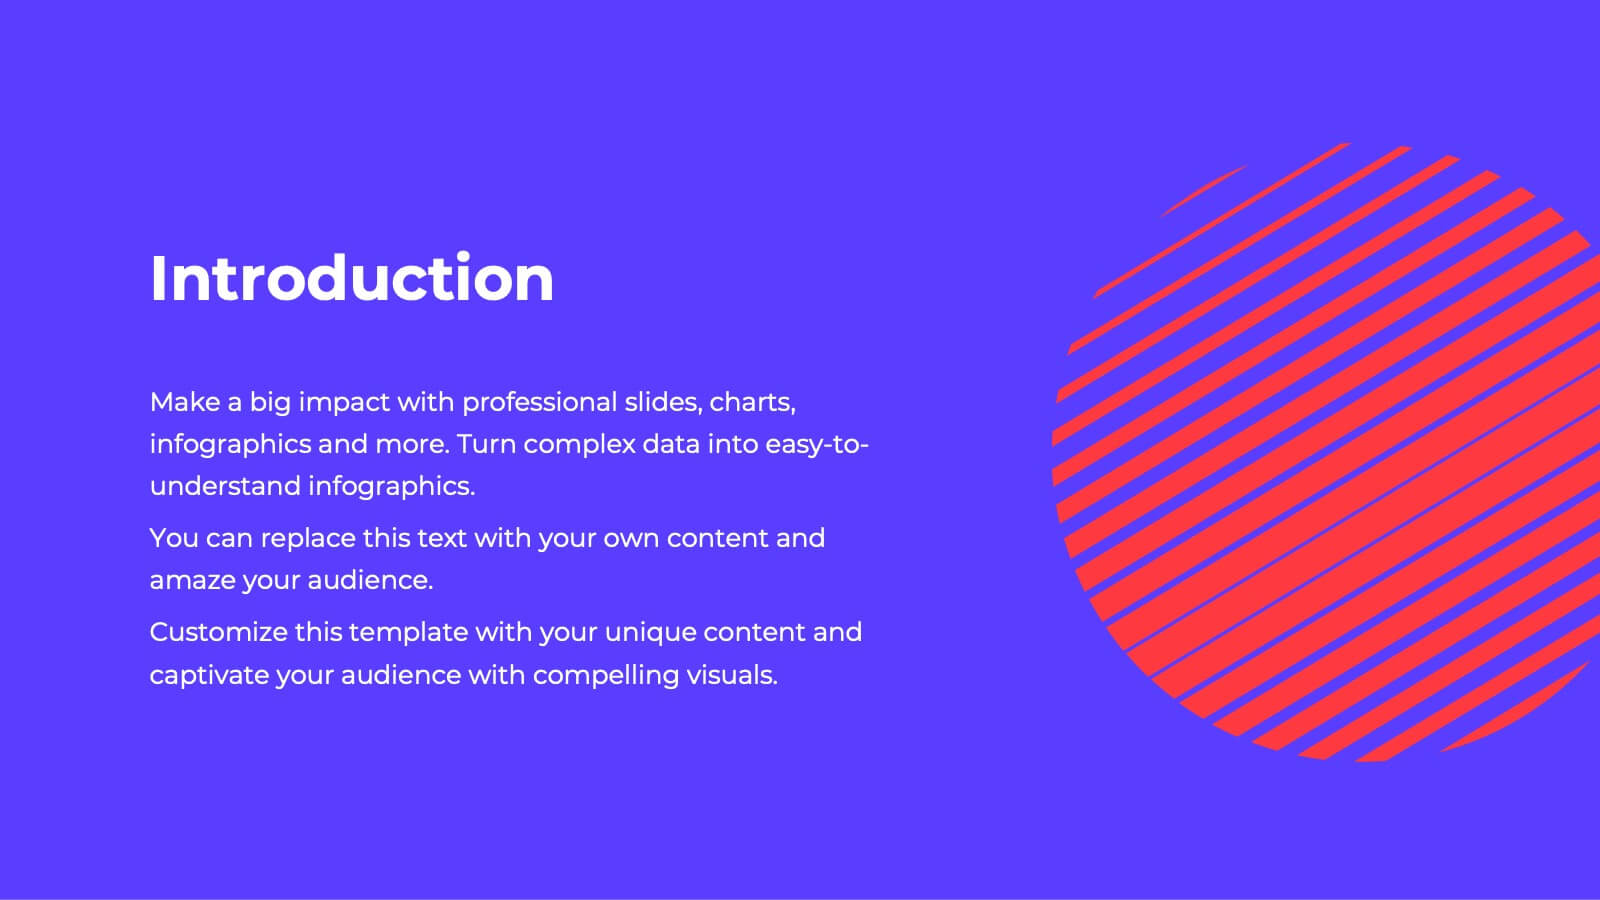
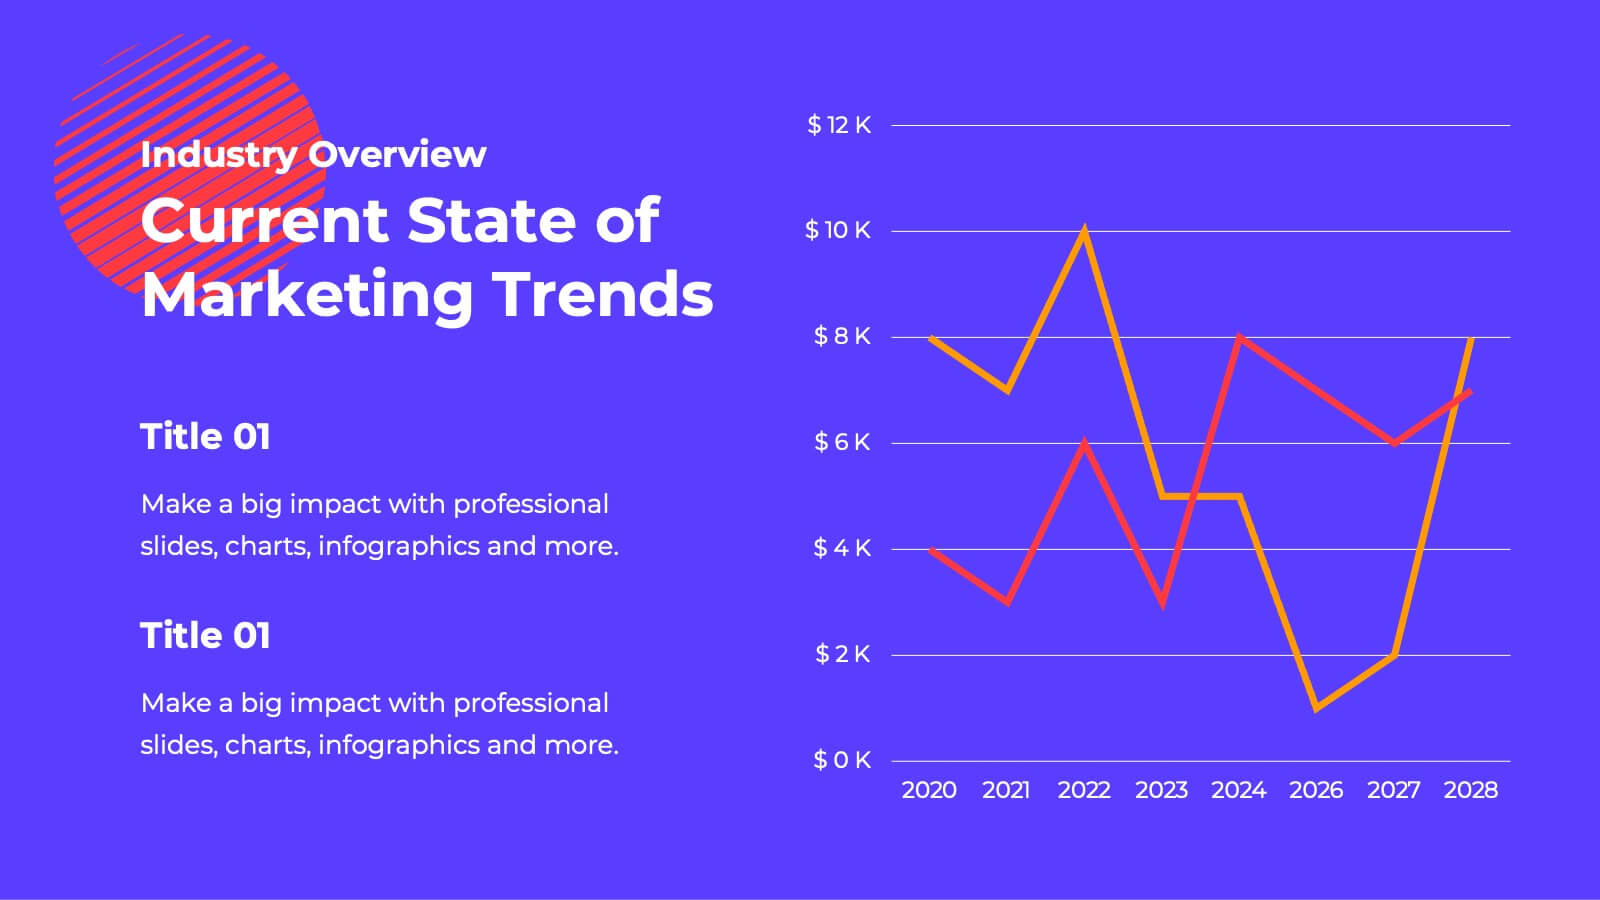
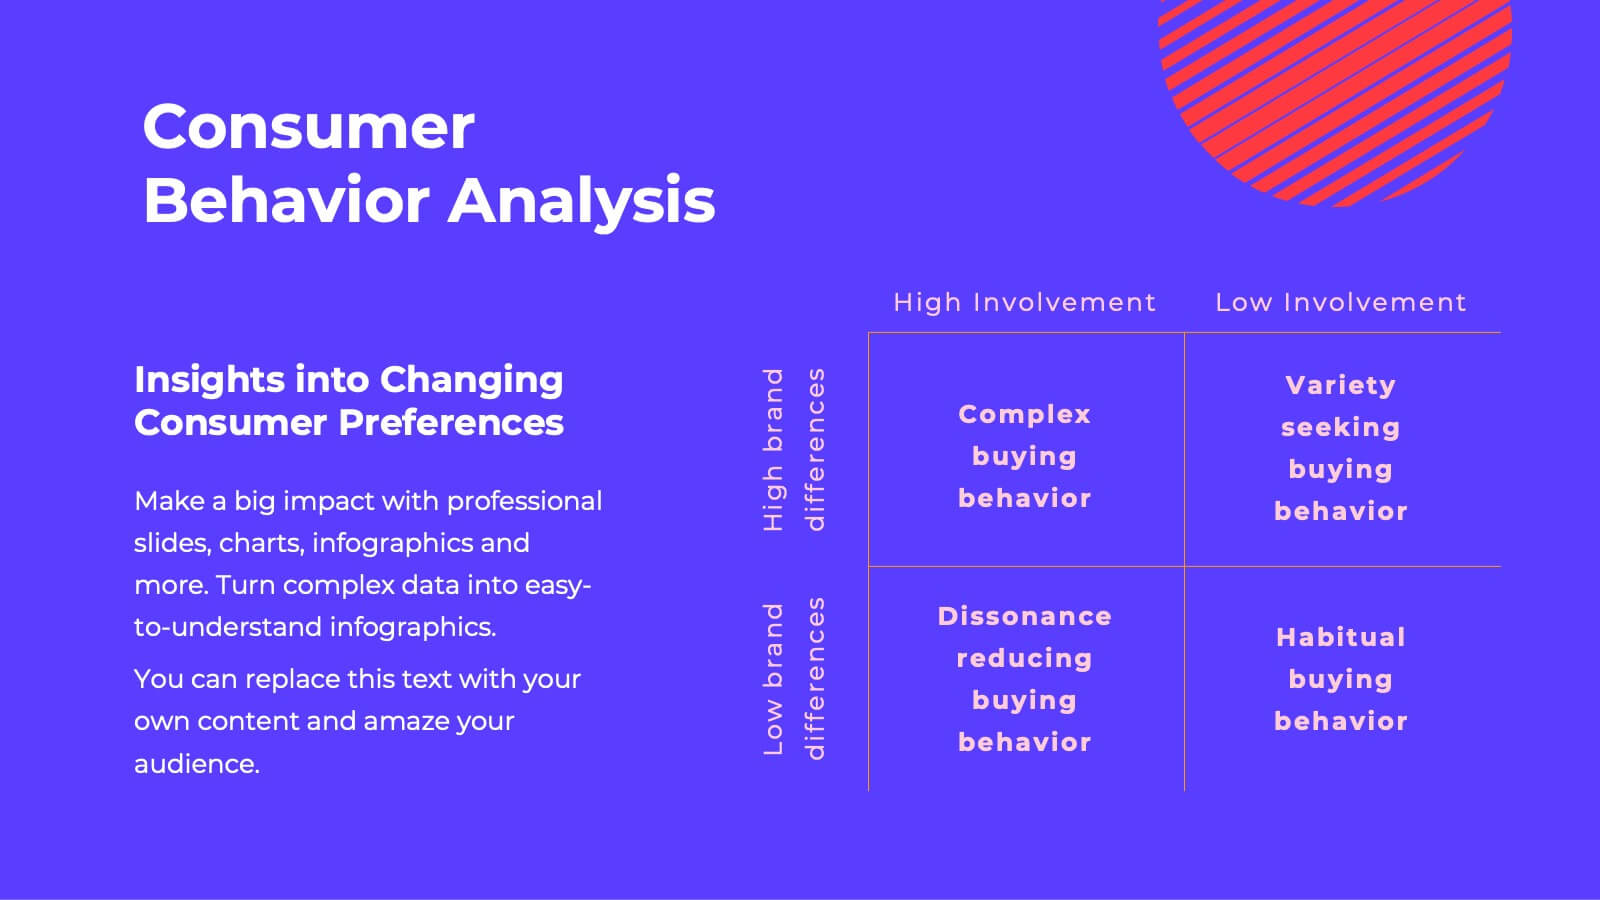
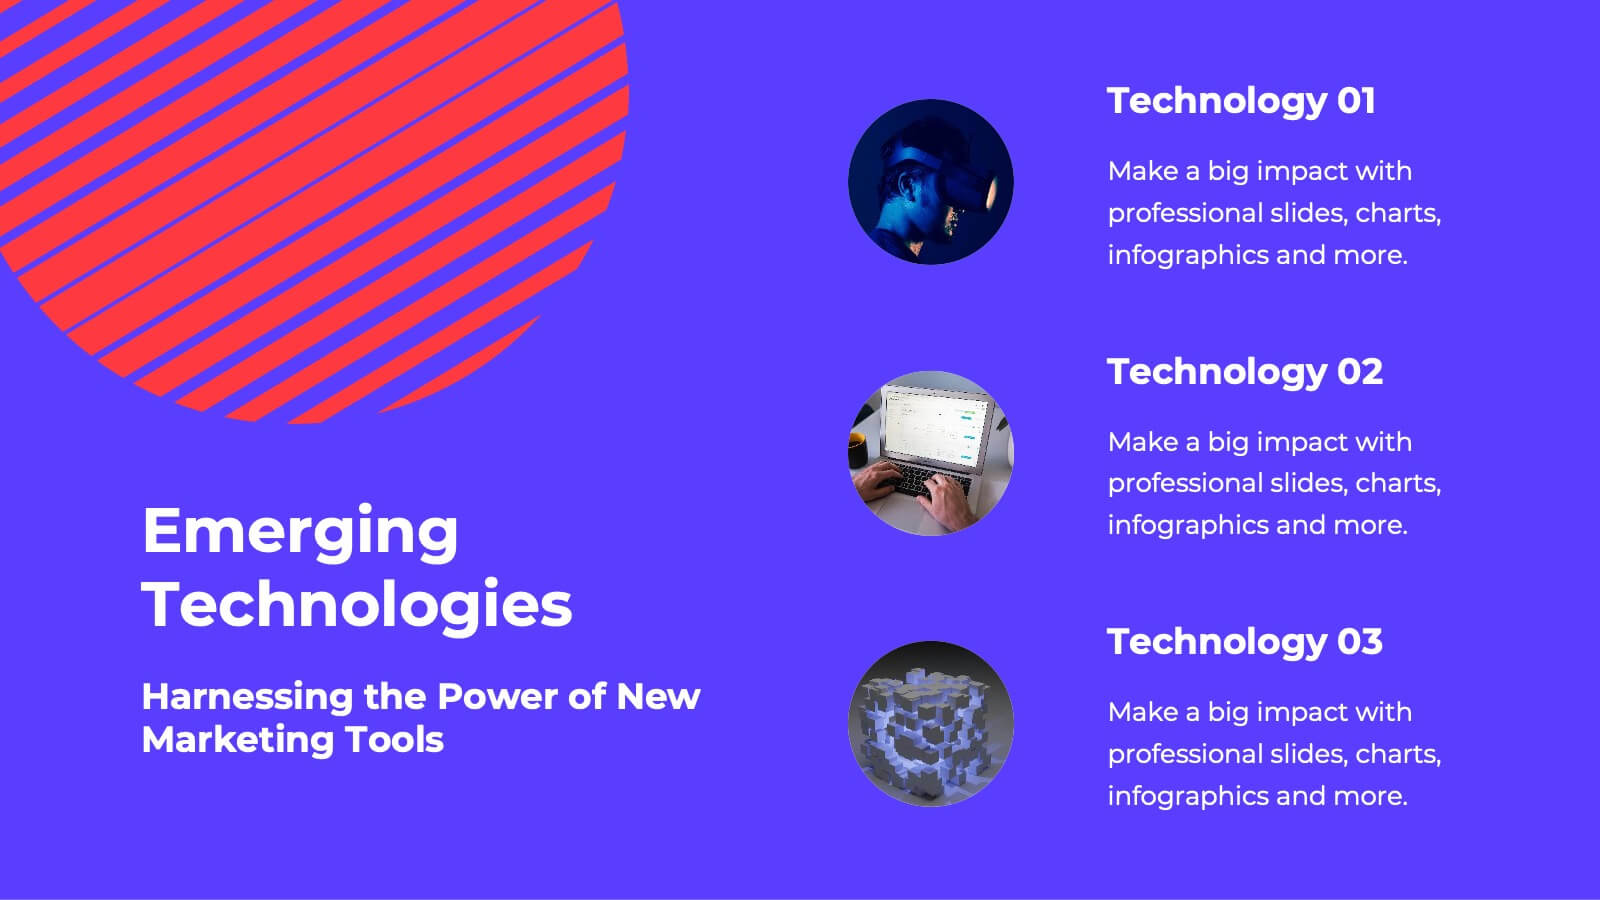
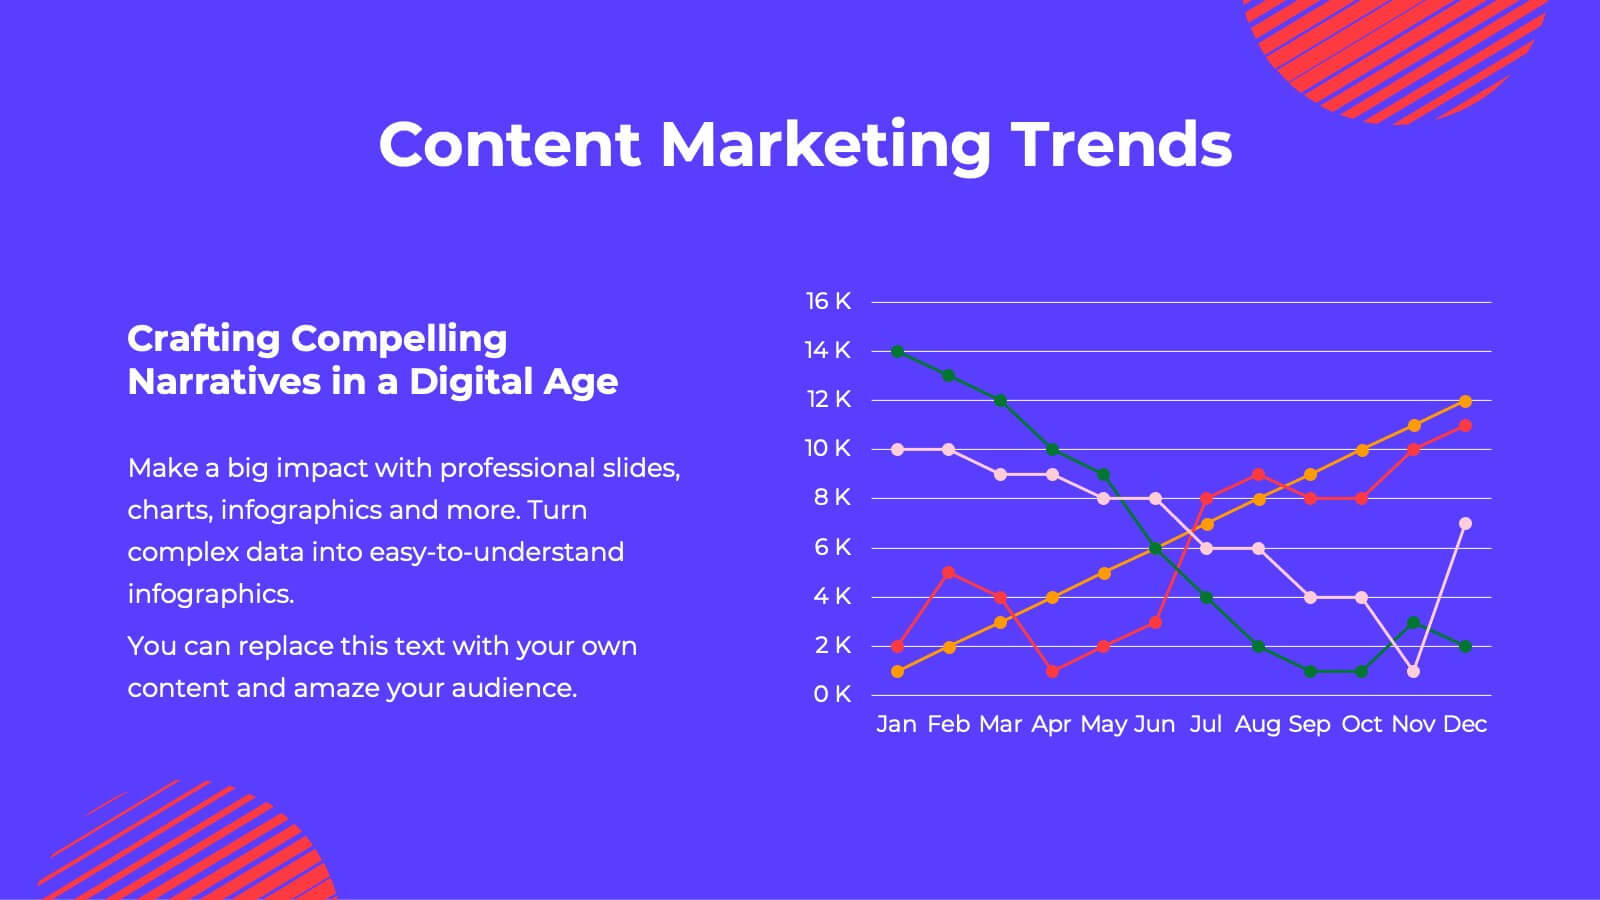
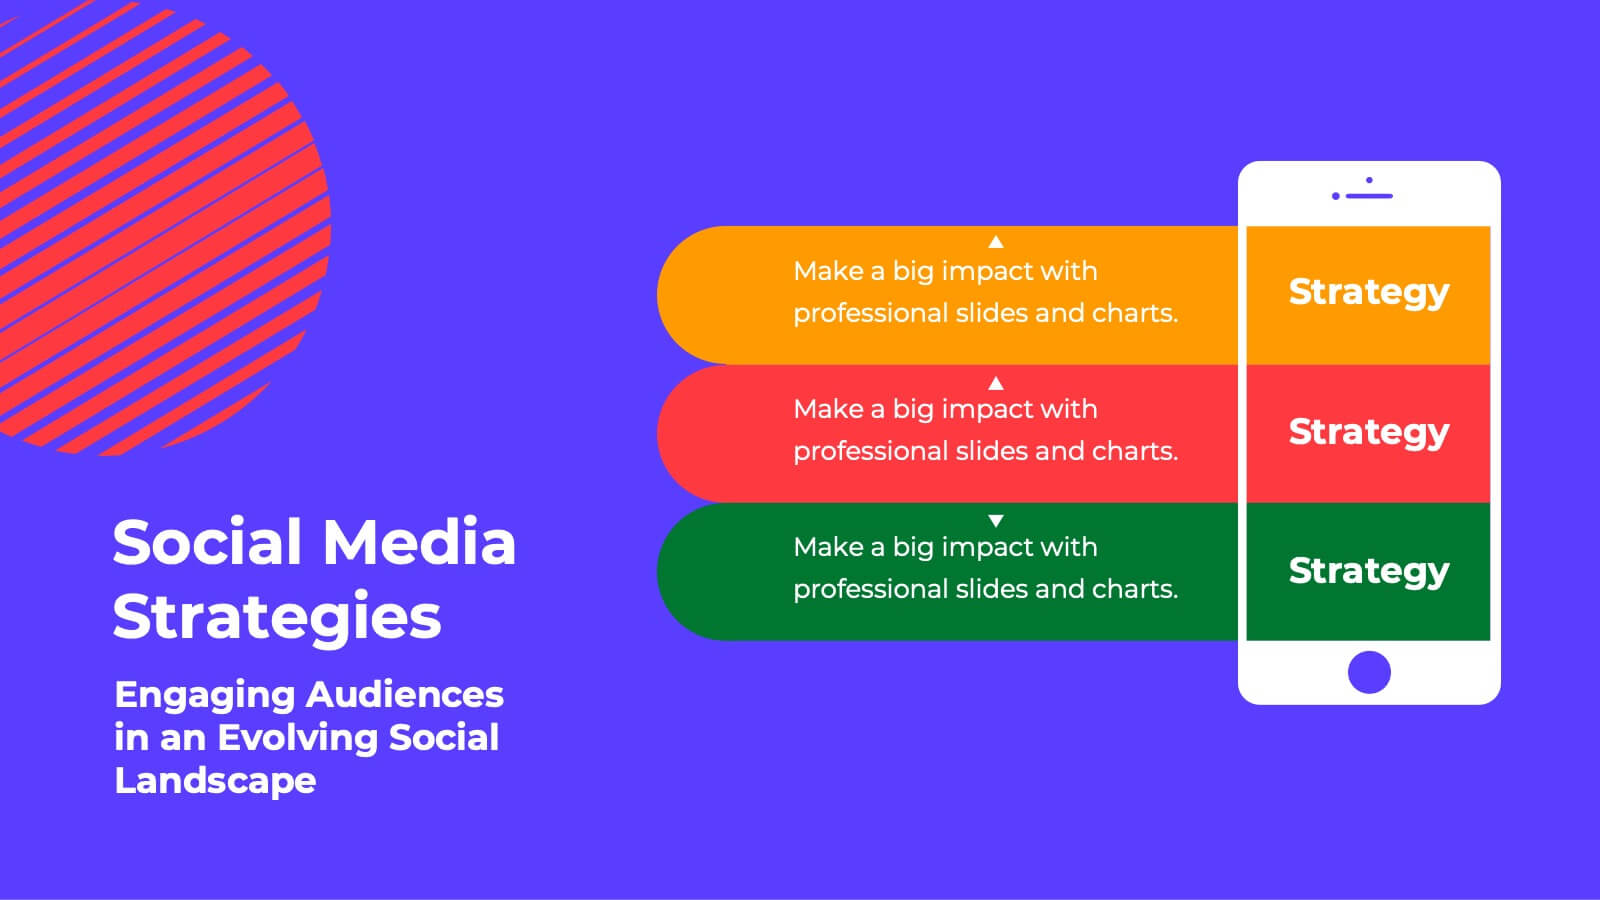
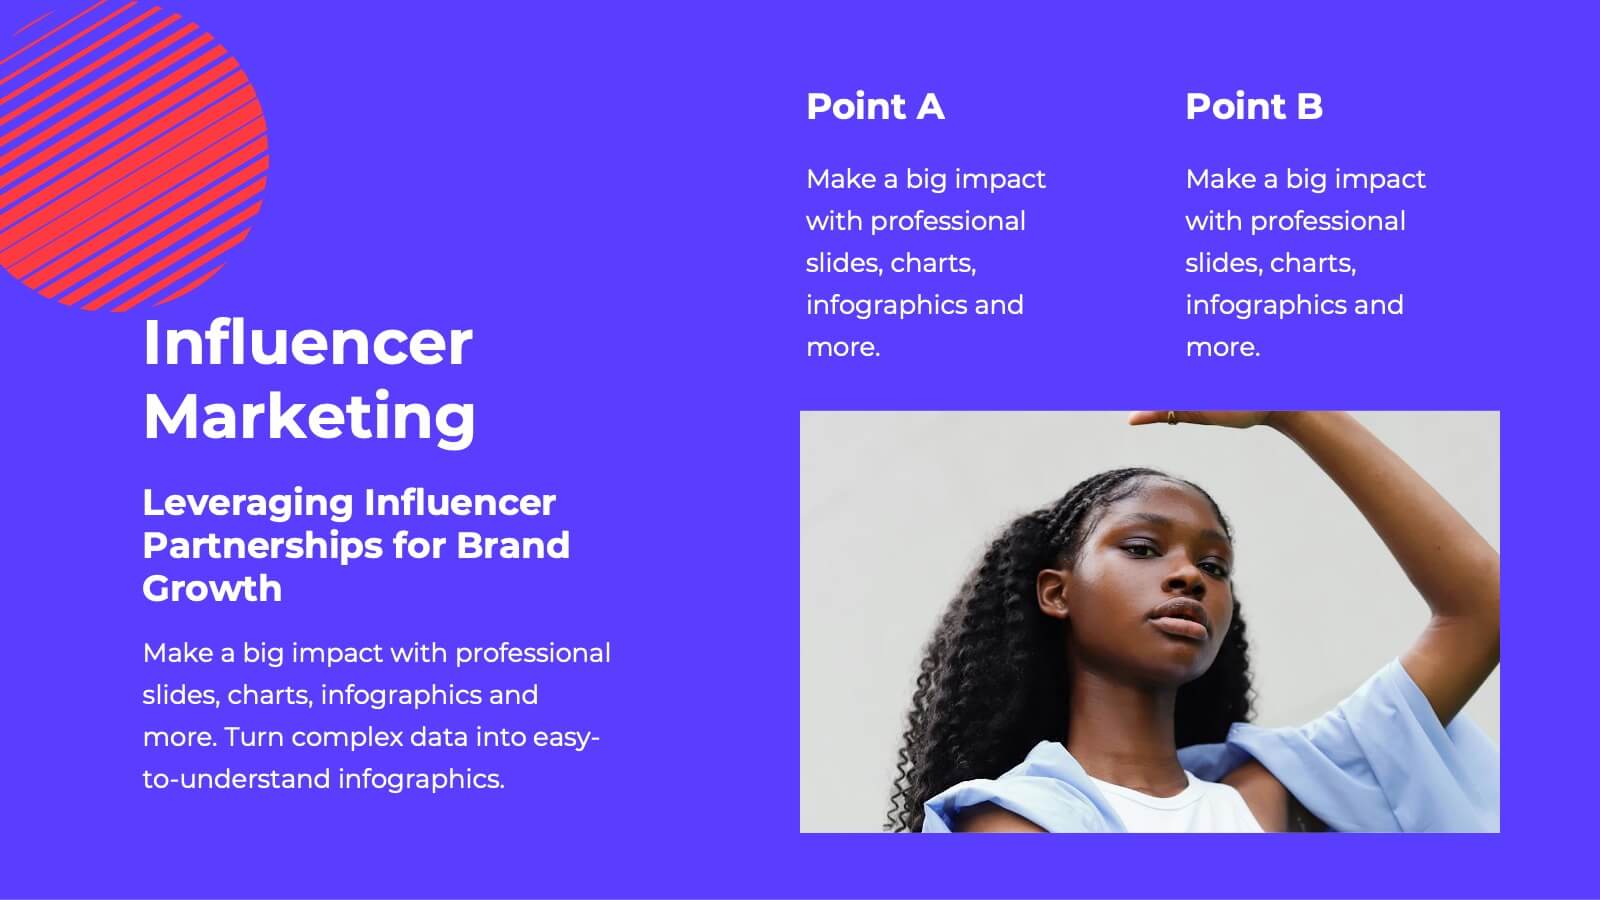
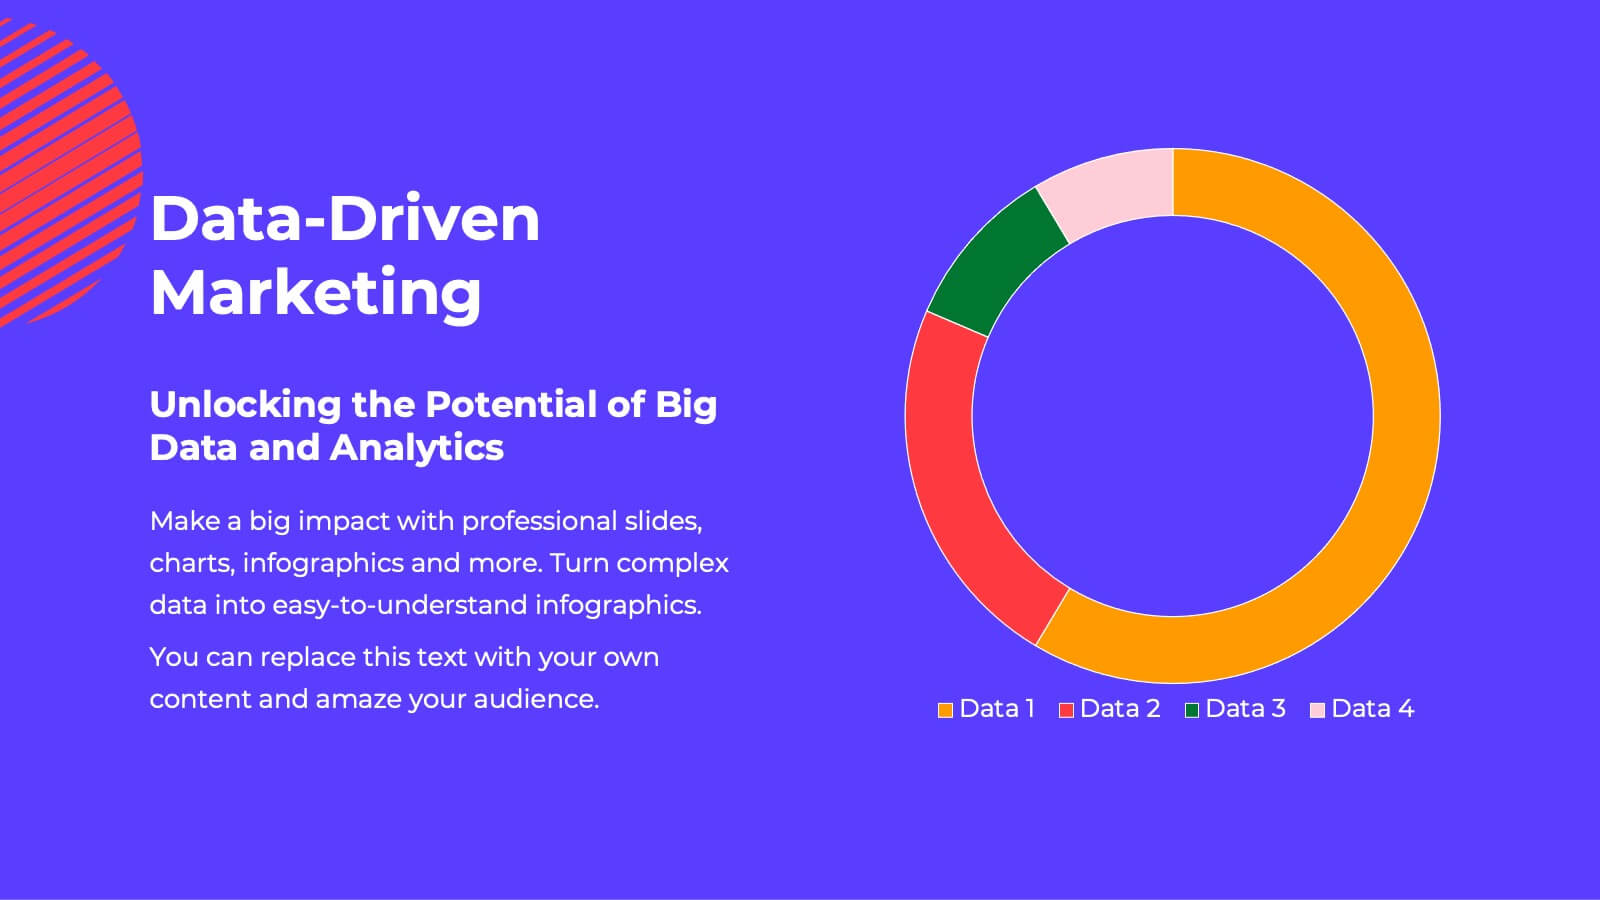
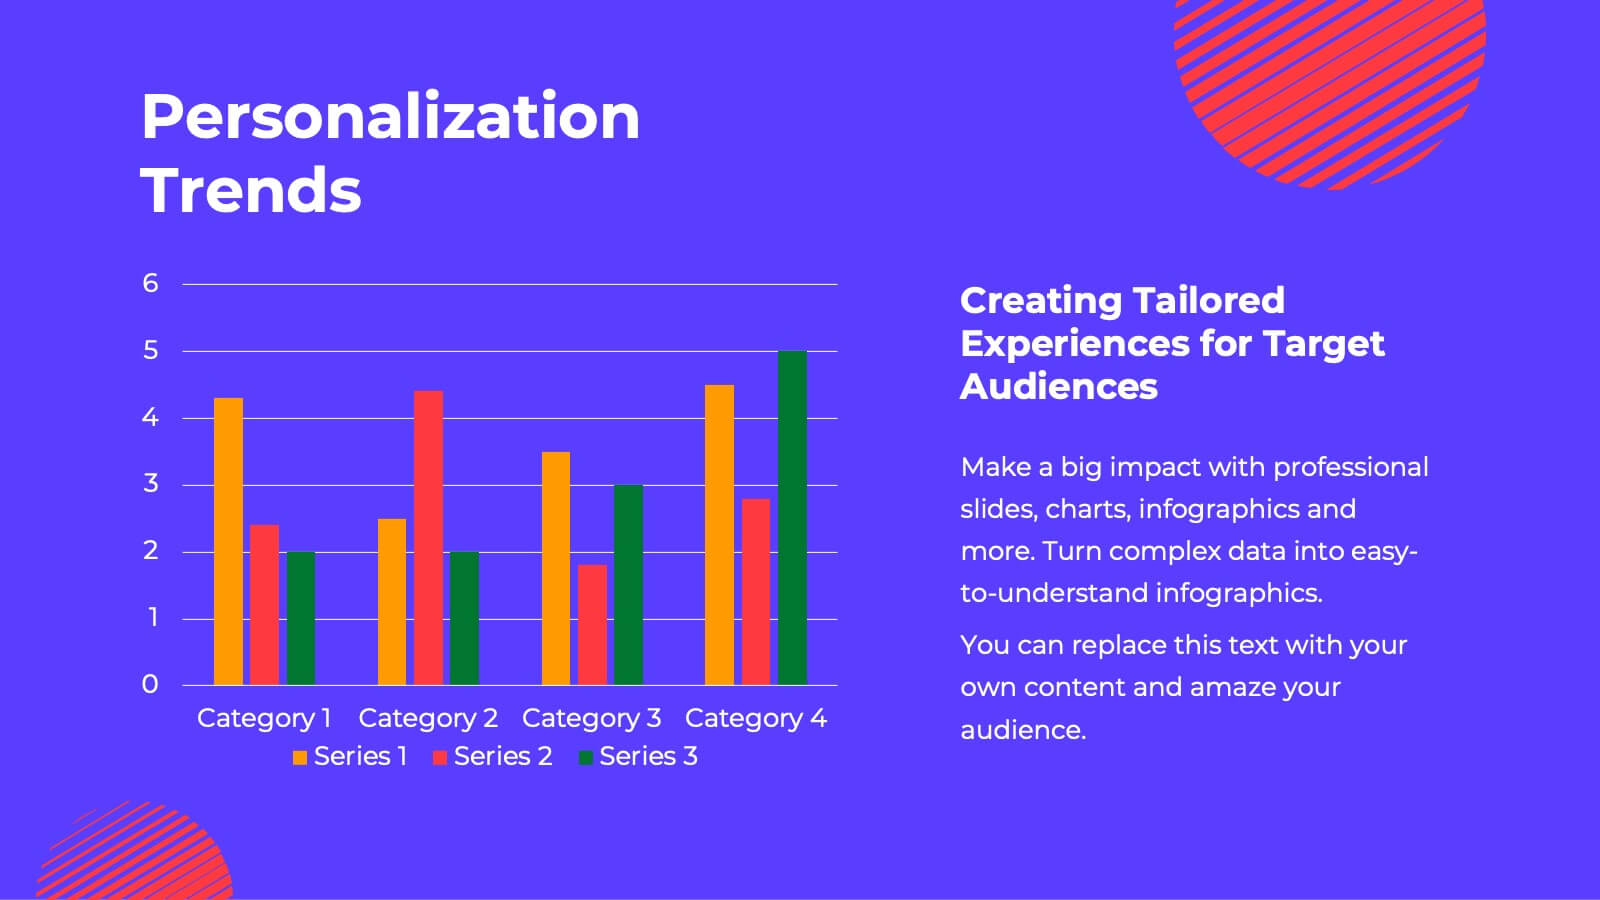
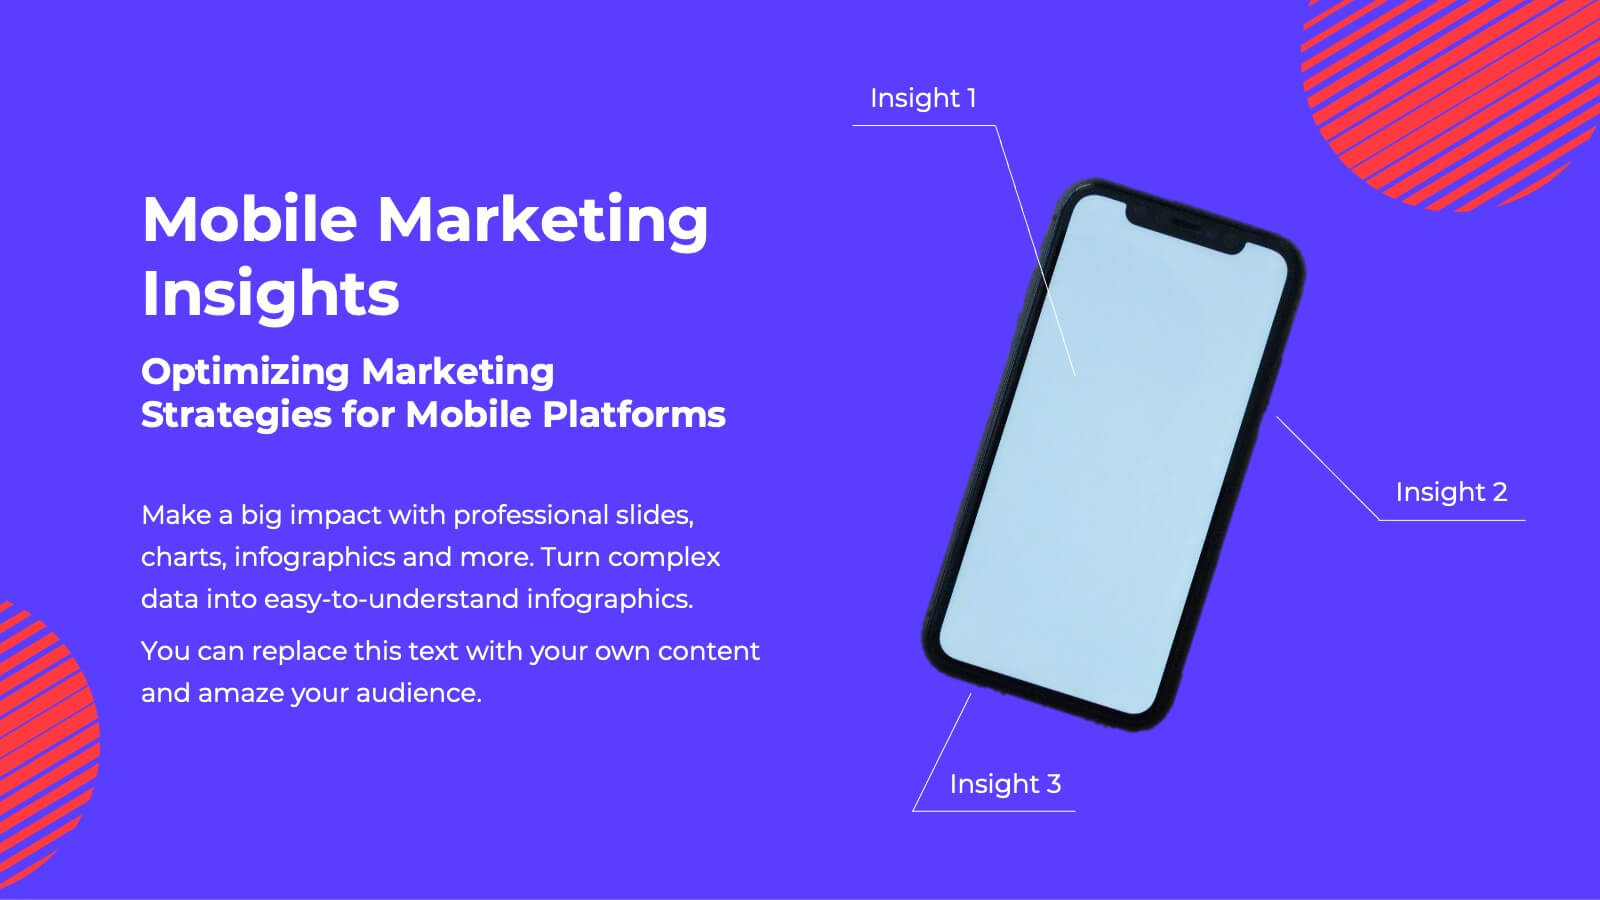
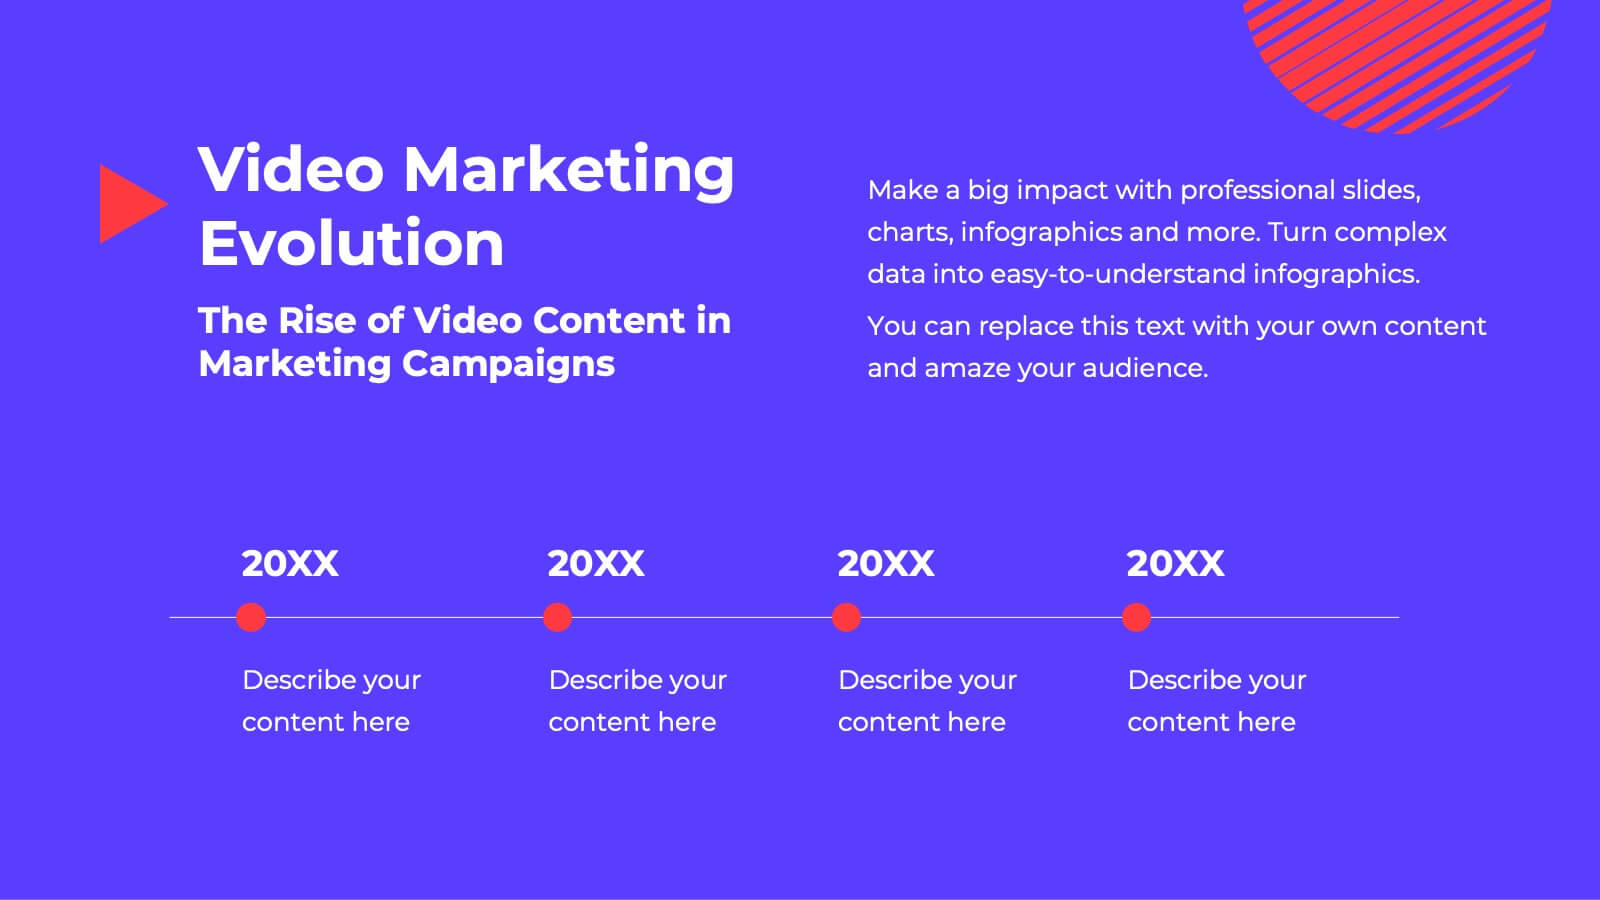
Fusion Marketing Campaign Presentation
Unleash the power of your marketing campaigns with this vibrant marketing campaign template! Dive into social media strategies, influencer marketing, data-driven insights, and more. Perfect for presenting to stakeholders and team members. Fully customizable and compatible with PowerPoint, Keynote, and Google Slides.


5 diapositivas
CBD Industry Infographics
CBD, or cannabidiol, is a natural compound derived from the hemp plant that has gained popularity in recent years for its potential therapeutic benefits. This infographic template is perfect if you want to educate others on the CBD industry. These vertical infographics are designed to help you provide a concise and engaging way to present facts, statistics, and trends about CBD products, usage, benefits, regulations, and market growth. This template can be used by CBD companies, health professionals, and educational institutions to inform and educate their audience about the industry and important considerations.


6 diapositivas
User Satisfaction Scoring System
Showcase user feedback with this vibrant User Satisfaction Scoring System Presentation. Featuring a semi-circle scale with expressive icons, it's perfect for visualizing survey results or customer experience insights. Fully editable in PowerPoint, Keynote, and Google Slides, this slide helps simplify scoring metrics while keeping your presentation clear, engaging, and professional


5 diapositivas
Breast Cancer Awareness Day
Raise awareness and educate with this visually impactful Breast Cancer Awareness Day template. Featuring circular infographic elements styled in a breast tissue-inspired layout, this slide design is ideal for campaigns, health education, corporate wellness events, and social initiatives. Each section can be customized with key data, statistics, or actionable messages. Fully editable in PowerPoint, Keynote, and Google Slides.


5 diapositivas
Strategic Planning with Concentric Circles Presentation
Visualize Your Strategy with Clarity using this Strategic Planning with Concentric Circles Presentation template. Designed to illustrate layered processes, decision-making frameworks, and business growth strategies, this concentric model helps communicate core ideas with structured, expanding details. Fully customizable and compatible with PowerPoint, Keynote, and Google Slides, this template is perfect for business leaders, strategists, and consultants aiming for clear and impactful presentations.


7 diapositivas
Medical Infographic Presentation Template
A Medical Infographic is a visual representation of complex medical information or data, designed to simplify and clarify the information for the reader. The purpose of our medical infographic template is to educate and inform people about various health and medical topics through visual aids such as charts, graphs, diagrams, and illustrations. With this template, you'll have everything you need to create a professional and engaging presentation. The template includes a variety of visual elements that can be used to present data and statistics in an easy-to-understand manner.


5 diapositivas
African Continent Map Slide Presentation
Visualize your data across Africa with a modern, easy-to-read map design that highlights regional trends and insights. Perfect for showcasing demographics, market distribution, or project reach, this template combines clarity and impact. Fully compatible with PowerPoint, Keynote, and Google Slides for smooth customization and presentation flexibility.


6 diapositivas
Credit Card Benefits Infographic
Credit cards offer various benefits to cardholders, making them a popular financial tool for everyday transactions and managing personal finances. This infographic template highlights the various benefits and advantages of using credit cards. Perfect for banks, financial institutions, and credit card companies, this template presents a comprehensive overview of the perks and rewards that credit cards offer to their users. Compatible with Powerpoint, Keynote, and Google Slide. This template offers the flexibility to customize colors, fonts, and icons to align with the brand identity of the credit card issuer.


7 diapositivas
Security Framework Infographic
A security framework, also known as a cybersecurity framework, is a structured set of guidelines, best practices, standards, and processes that help organizations design, implement, monitor, and manage robust security measures to protect their information systems and resources. This infographic template is a fortress of knowledge, guiding you through the pillars of a robust security infrastructure that safeguards your digital realm. Compatible with Powerpoint, Keynote, and Google Sides. Every element in this infographic embodies a facet of a comprehensive security framework.


5 diapositivas
Team Roles and Collaboration Flow Presentation
Visualize how your team works together using the Team Roles and Collaboration Flow Presentation. This slide layout is designed to showcase key roles, responsibilities, and communication paths across sequential stages. Ideal for project managers, HR professionals, and team leads who need to define workflows clearly. Fully customizable in PowerPoint, Keynote, Canva, and Google Slides.


4 diapositivas
Employee Performance Feedback
Showcase progress clearly with this Employee Performance Feedback presentation. Featuring skill-based metrics, productivity scores, and analysis ratings, this layout uses visual data bars to evaluate team performance at a glance. Perfect for HR reviews, team assessments, or quarterly check-ins. Fully editable in PowerPoint, Keynote, and Google Slides.


4 diapositivas
Fishbone Diagram for Root Cause Analysis
Dive into the source of any problem—literally. This fishbone diagram template offers a smart and visual way to map out causes leading to a business issue, helping teams brainstorm solutions effectively. Ideal for workshops, meetings, and audits. Easily editable in PowerPoint, Keynote, and Google Slides.